
Abstract
Planners are interested in moving park-and-ride facilities away from transit stations and leaving space nearby for development. However, the literature offers no indication on how park-and-riders would tolerate longer walking distances. This study applies stated preference surveys to examine park-and-riders’ walking tolerance and other influential factors. We found that park-and-riders overwhelmingly prefer short walking distances but a pedestrian-friendly environment can offset the disutility of walking distances. With safe intersections, good pedestrian infrastructure, and an attractive building appearance, this study indicates that park-and-riders will walk up to two blocks more than they otherwise would. They stated that security, sidewalk, and crosswalk conditions are the most critical.
Introduction
Planners commonly use transit-oriented development (TOD) as a paradigm to achieve a walkable environment around transit stops. Park-and-ride (P&R) facilities provide an alternative approach to TOD that can attract riders living outside the immediate vicinity of transit lines. Housing, jobs, and retail activities around stop areas enable nearby residents to access a transit system and allow passengers to reach various activities along a transit corridor, whereas P&R is a primary means for suburban riders to access the system. A key problem is that P&R facilities are often oriented toward automobiles, and the presence of a large parking facility often undermines the walkability around stop areas and potentially detracts from the quantity and quality of TOD in such areas (Duncan and Christensen 2013).
Planning scholars and practitioners interested in effectively combining TOD and P&R might consider siting P&R facilities at the periphery of development around transit stops. This allows placement of TOD directly adjacent to the stop in the space otherwise occupied by the P&R lot, thus minimizing walking distance to the stop for TOD residents and patrons. Furthermore, moving the P&R lot away from the stop, even by just a few blocks, means that the majority of stop area properties would have a direct walking path to the stop that avoids the P&R facility (and the traffic safety concerns and poor aesthetics that go with it). Coupled with good urban design and traffic management, moving a P&R facility away from the stop could largely mitigate its negative impact on walkability in much of the stop area, and, more importantly, attract residents to live in and patrons to visit the area.
Building underground (or, to a lesser degree, multi-story P&R facilities) provides another approach to creating more stop-adjacent space for development and hiding the parking from view of non-P&R users. However, building parking structures (especially underground) is expensive. In suburban areas where one typically finds P&R facilities, the low cost of land makes surface parking more economical. Furthermore, keeping parking adjacent to the stop, even if hidden underground, does not move traffic away from the stop area. Thus, moving the parking away from a stop provides a more financially feasible and, in some ways, more effective approach to mitigating the negative impacts of P&R facilities.
In the scenario where parking is moved away the station, P&R users would need to access transit stops by walking longer distances from the parking lot. Presumably, this would reduce the attractiveness of using transit for most, if not all, P&R users. Depending on the relative attractiveness of other travel options (e.g., parking costs at the destination and traffic congestion), this additional walking may cause some users to quit using transit. However, a pedestrian-friendly environment, as should be present in a well-planned TOD, may offset the cost associated with the additional walking distance. In the literature, little direct evidence exists with regard to how much additional walking they would tolerate if planners incorporate pedestrian-friendly designs into the walking path. Their willingness to walk longer distances presumably differs from other groups of transit users. P&R users have unique demographic characteristics (e.g., higher incomes), trip attributes (e.g., the dominance of commute trips), and pedestrian environments around the P&R facilities (e.g., serving as a transportation node for transit users instead of a place for residents and patrons) that might indicate varying levels of walking tolerance.
Studies on P&R facilities and P&R users’ travel behavior are rather limited. Some aggregate studies investigate the location, physical environment, market area, and occupancy level of P&R facilities (Farhan and Murray 2005; Horner and Groves 2007; J. Y. T. Wang, Yang, and Lindsey 2004). These studies apply geographical information systems (GIS)-based approaches to identify the walking buffers around P&R facilities. Previous studies also use a disaggregate approach based on P&R user surveys. Some focus on demographic and trip characteristics of P&R users (Shirgaokar and Deakin 2005). Others include P&R as an access option to transit stations and then predict an individual’s propensity to use transit based on their use of P&R facilities (Roorda, Passmore, and Miller 2009). Still others investigate P&R users’ attitudes toward P&R service attributes like parking price and ease (He, He, and He 2012; Syed, Golub, and Deakin 2009). However, no specific studies have addressed questions regarding their walking behavior.
Using a 2016 survey of P&R users in the Twin Cities, this study aims to fill this gap. We seek to address the following research questions:
What is the additional distance that P&R users would be willing to walk to transit stops if P&R facilities are moved away from the stops and a pedestrian-friendly environment along the walking path is provided?
Which design elements of the pedestrian environment have the most influence on P&R users’ willingness to walk?
To what extent can stop area design mitigate the disutility of walking distance?
This study relies primarily on a stated preference (SP) analysis, and, secondarily, on illustrating respondents’ stated importance of built environment characteristics.
Literature Review
P&R represents an important means to access transit. In travel demand forecasting models, transit serves as a major alternative to driving. These models, including those in the Twin Cities, often estimate the likelihood of walking or driving to transit stops. Some studies specifically focus on the factors that influence transit riders’ mode choice to transit stops (i.e., access mode). For example, Kim, Ulfarsson, and Todd Hennessy (2007) found that auto ownership has a positive association with the use of P&R facilities in St. Louis and that, for security reasons, women are more likely to be picked up/dropped off at transit stations, particularly at night. A study of the San Francisco Bay Area also concluded that P&R users will pay a premium for secured and lighted lots (Shirgaokar and Deakin 2005). On the other hand, after examining samples of walkers and P&R users who live within 1 km of the facility, Walton and Sunseri (2010) concluded that weather conditions affected walking but distance and concern of crime did not. Although these studies offer important insights into the behavior of P&R users, they have yet to show how far P&R users will walk to transit stops and what factors affect their walking tolerance.
While the literature offers few clues on the walking tolerance of P&R users, it provides more general evidence about transit users’ willingness to walk (Durand et al. 2016; Guerra, Cervero, and Tischler 2012; Sun et al. 2016). Scholars have frequently explored the generalized distance that people will walk to access transit systems. A quarter mile represents the commonly used distance that bus riders will walk to/from stops (O’Neill, Ramsey, and Chou 1992; Zhao et al. 2003) and half a mile provides the typical standard for rail riders (Agrawal, Schlossberg, and Irvin 2008; Kuby, Barranda, and Upchurch 2004). Transit planners have widely applied these rules of thumb when estimating users’ walking willingness and defining service areas of bus stops or rail stations (Furth and Rahbee 2000; Murray and Wu 2003; Transit Cooperative Research Program [TCRP], 2003). However, the literature does present some variation in the walking tolerance of transit users (TCRP 2003). Daniels and Mulley (2013) reported a mean walking distance to Sydney’s bus stops of 0.29 miles and a 75th percentile distance of 0.41 miles. For rail stations, they found a mean walking distance of 0.5 miles and a 75th percentile distance of 0.63 miles. El-Geneidy et al. (2014) showed a mean and 85th percentile walking distances to bus stations of 0.23 and 0.33 miles, respectively, in Montreal, Canada.
Previous studies have shown that walking distances to/from transit stations vary based on three groups of factors: (1) demographic characteristics of transit users, (2) mode and trip attributes, and (3) built environment characteristics. Influential demographic characteristics include gender, race, income, education, and profession (Chia, Lee, and Kamruzzaman 2016; Kim, Ulfarsson, and Todd Hennessy 2007; Loutzenheiser 1997). Significant trip factors include transit modes, trip purposes, the number of transfers, and trip duration (El-Geneidy et al. 2014; Guerra, Cervero, and Tischler 2012; J. Wang and Cao, 2017). Built environment characteristics play a major role in determining the distance transit users will walk to/from stations. The three “Ds,” density, diversity, and design (Cervero and Kockelman 1997), reflect a general mechanism by which the built environment affects transit users’ walking behavior. Many studies point to density as an important factor. In dense areas, origins and destinations tend to fall closer to transit stations. Therefore, residents of dense urban areas have a greater willingness to walk to transit than rural or suburban residents (Yang and Diez-Roux 2012). Density may also serve as a proxy for aesthetic qualities and perceived safety, which influence transit users’ walking willingness. Moreover, diverse or mixed land-use patterns have a positive association with the willingness to walk because, in such areas, origins, and destinations also tend to fall closer to stations (Saelens and Handy 2008). Studies have also concluded that dense neighborhoods with mixed non-residential land-use patterns prove more pedestrian-friendly (Cervero and Kockelman 1997; Greenwald and Boarnet 2001). Design (including pedestrian infrastructure, street connectivity of routes/network, and attractiveness of walking environments) also influences transit users’ walking behavior. Walkable neighborhoods foster greater tolerance of longer walking distances to/from stations, whereas automobile-oriented neighborhoods with a large number of roads to cross, traffic conflicts (parking and access driveways), and steps to climb reduce the acceptable walking distance (Olszewski and Wibowo 2005; Park, Kang, and Choi 2014). Furthermore, an unsafe walking environment can create barriers for transit users. For example, Mason, Kearns, and Bond (2011) found a positive association between perceived safety of a neighborhood and walking frequency in the neighborhood.
Given the many built environment characteristics that contribute to walking behavior, the question of which of these characteristics has the largest impact becomes critical when there are limited resources for station area investments. Agrawal, Schlossberg, and Irvin (2008) asked transit users in California and Oregon to rate the importance of environmental factors to their walking route choice to/from transit stations. Shortest/fastest route and traffic safety rated as the top two factors. “Sidewalks in good condition” and “Presence of attractive buildings, trees, and landscaping” also rated as either “Very important” or “Somewhat important” for about 80 percent of the respondents. Vargo (2013) identified the walkability concerns of transit users along the Central Corridor in Minneapolis/St. Paul prior to the opening of the Green Line light rail transit in 2014. The quality of sidewalk network (condition and continuity), safety issues from traffic, and lack of trees and green space rated as the top three concerns in this study. Tao, Wang, and Cao (2019) concluded that land use mix is the most important predictor of walking distance to transit stops in the Twin Cities.
Although these three studies shed light on the major factors of walkability, they focused on transit users and residents in station areas. Park-and-riders differ from general transit users in that they tend to be middle- or upper middle-class professionals and have other options for traveling. Choice riders tend to walk shorter distances than captive riders (TCRP 2003). Moreover, these socio-economic and demographic characteristics may lead them to perceive a walkable environment differently from general riders. For instance, Forsyth and Southworth (2008) stated that the walkable environment for upper middle–class professionals should have an “upscale, leafy, or cosmopolitan” character (p. 2). Furthermore, almost all park-and-riders travel for work or school purposes and have limited flexibility in arrival time. Therefore, travel time, including access time, may have a dominant influence on their travel choices, whereas the built environment around the stations may become secondary. Overall, the findings about transit users’ willingness to walk and the critical built environment characteristics may not generalize to P&R users. Planners need empirical evidence of P&R users to guide practice.
In summary, transit riders in different regions tend to walk different distances to reach transit stations, and many factors influence their walking behavior. Previous studies have found environmental correlates of walking behavior, including various measures of density, diversity, design, and safety. Among them, the literature highlighted the importance of distance, safety from traffic and crime, pedestrian infrastructure (such as sidewalks, trees, and landscaping), and the presence of businesses and attractive buildings. These four dimensions constitute the foundation of the present study. While planning researchers and practitioners concerned with better facilitating TOD should have an interest in siting P&R facilities farther from stops, no studies have explored how far P&R users will walk if planners design a pedestrian-friendly environment, how built environment characteristics influence walking tolerance of P&R users, and how these characteristics offset the disutility of increased walking distance. This study will focus on these key questions.
Survey Design and Administration
Survey Design
This study employs a SP analysis, which is used to identify the preferences for nonexistent (or not widely available) products or services (Hensher 1994)—P&R service at the periphery of a TOD in the present study. This type of analysis utilizes a survey in which respondents are asked to choose from among a set of scenarios that specify different values of the attributes associated with a service (Hensher 1994). In this study, we designed a series of SP questions to explore P&R users’ tradeoffs among intersection safety, pedestrian infrastructure, building appearance, and walking distance. Each question includes three different scenarios, and each scenario contains three images illustrating the different dimensions of the pedestrian environment for a given scenario. Respondents are asked to choose the pedestrian environment (among the three presented scenarios) in which they would feel most comfortable when walking from a P&R lot to the transit stop.
Within the SP questions, walking distance has four possible variations: walking two city blocks, three blocks, four blocks, and five blocks. Pedestrian infrastructure and building appearance have four possible variations: abundant pedestrian infrastructure and attractive buildings, abundant pedestrian infrastructure and unattractive buildings, limited pedestrian infrastructure and attractive buildings, and limited pedestrian infrastructure and unattractive buildings (see Figure 1). Intersection safety includes two possible variations: relatively safe and unsafe designs (see Figure 2). These dimensions can generate thirty two (=4 × 4 × 2) unique scenarios. Because each question includes three different scenarios, these thirty two scenarios can produce 4,960, =32!/3!(32 – 3)!)) different sets of three that could be used in the survey questions. To obtain a more manageable number of combinations, the literature often recommends an orthogonal factional factorial design, which ignores some interaction terms of different attributes (e.g., Louviere, Hensher, and Swait 2000). This technique generated thirty-two questions (using SPSS 16.0). We then removed those that had one obviously superior choice (eight questions in this study). To reduce respondents’ burden, we randomly grouped the remaining twenty-four questions into six sets, each of which includes four questions. This resulted in six versions of the survey with different question sets (the surveys were otherwise identical). Accordingly, a respondent answered only one randomly assigned version of the survey with four of these SP questions. Figure 3 presents an example of one of the questions.
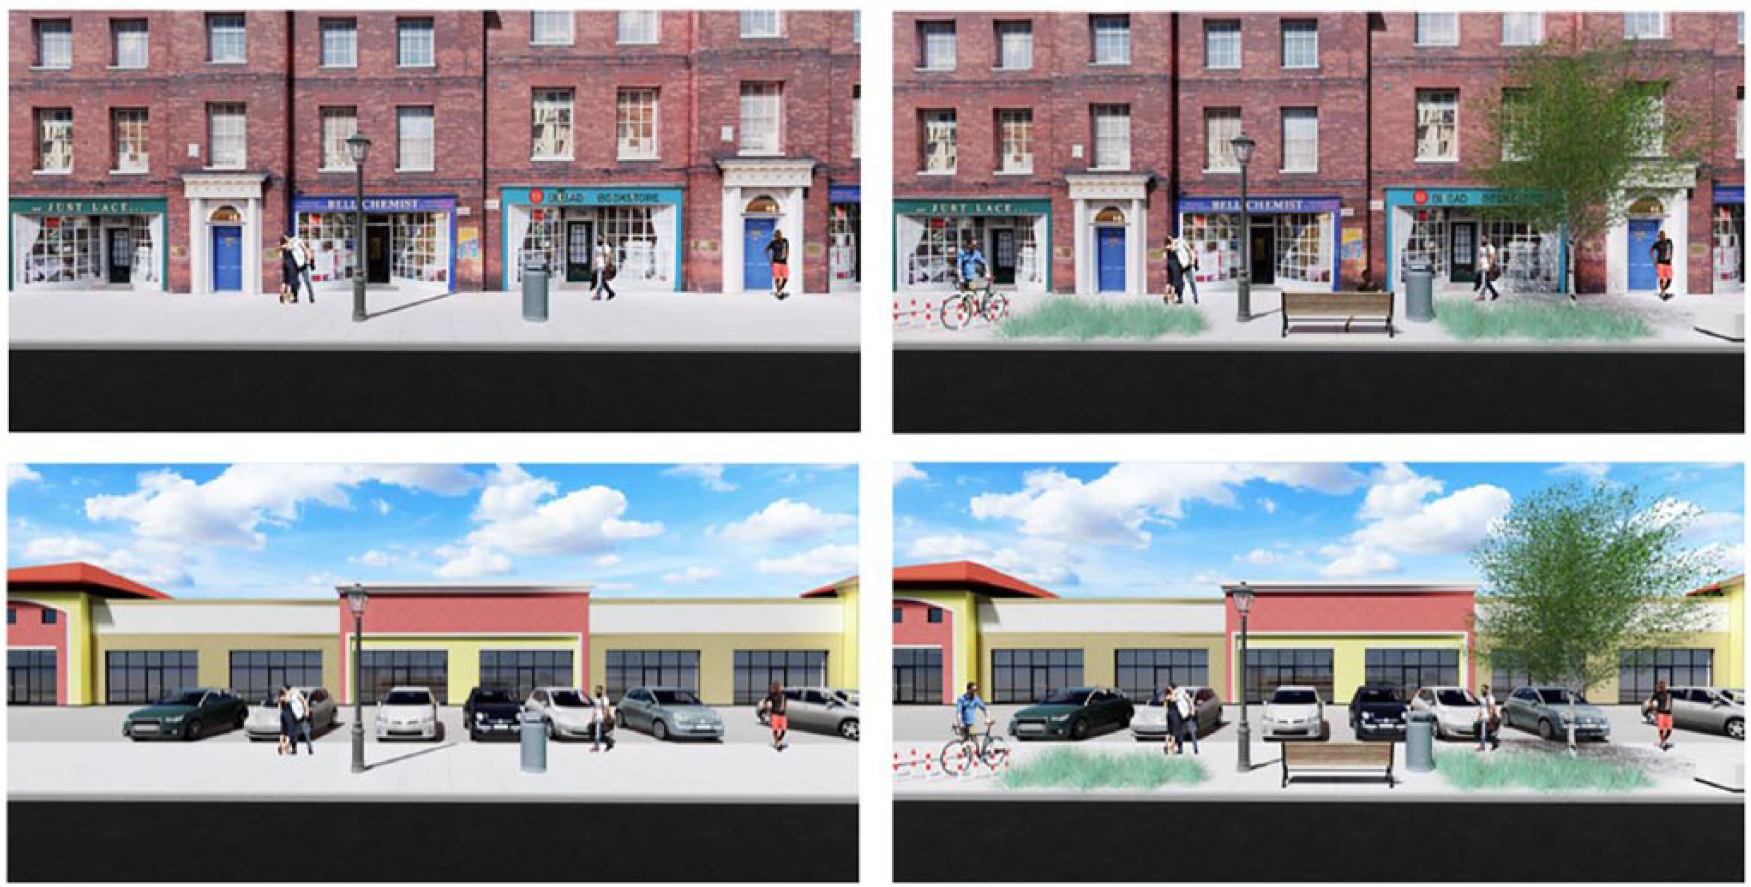
Four variations in building appearance and pedestrian infrastructure.
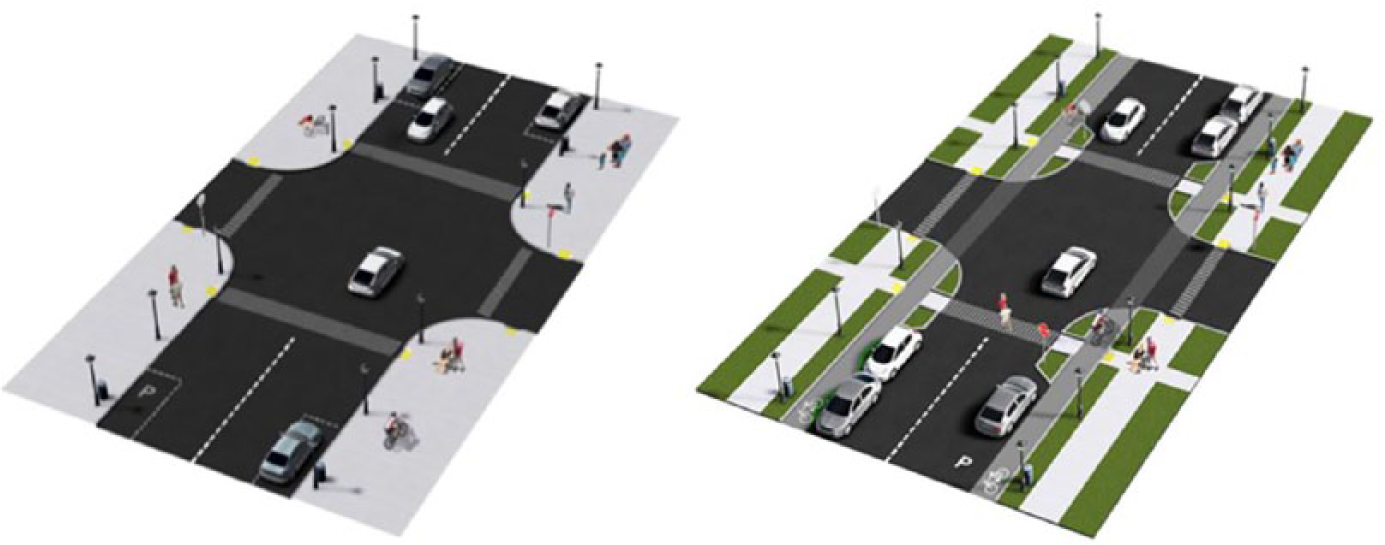
Two variations in intersection safety.
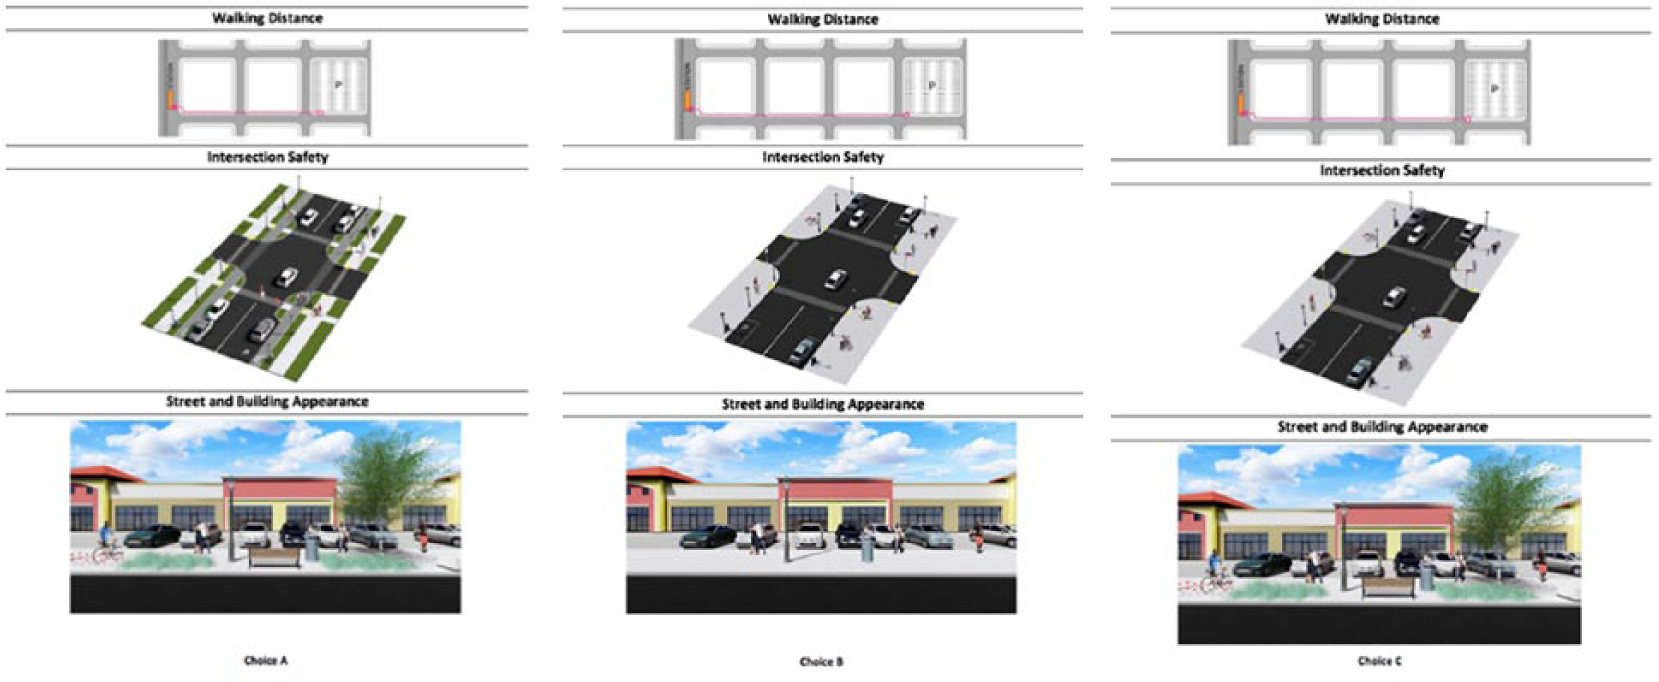
An example question.
As a supplement to the outcomes of the SP questions, the survey also asks respondents to rate the importance of 15 aspects of the built environment (see Table 5 later) when deciding how far they are willing to walk. We measure the importance of these characteristics on a four-point ordinal scale ranging from “not important at all” (1) to “extremely important” (4).
Sampling Plan
While a random sample of all P&R users in the Twin Cities would have proved optimal for this study, budget constraints did not allow this approach. Instead, the sampling plan aimed to capture a number of medium and large P&R lots, serving a variety of transit modes and locations throughout the region. All P&R facilities in the region (and in the sample) are subsidized and free of charge to their users.
We selected the following existing lots, recommended by the members of technical advisory group who are planners in local government and transportation agencies in the Twin Cities. The lots and the subsequent transit modes include the following:
The capacity of these selected P&R lots ranges from 360 to 1,428.
Data Collection
We collected the data from October 21 to November 21, 2016. Teams of two students went to these selected existing stations between 6 and 9 AM to hand out recruitment letters. Consequently, the sample excludes the small share of park and riders who arrived before or after the AM peak. While distributing the letters, the students would approach a person waiting for their bus or train, explain their university affiliation, explain the basis for the study, hand them a recruitment letter, and explain how to access the online survey (developed using Qualtrics software). Because many passengers walked into transit vehicles directly instead of waiting in the shelters, the students could not always explain all the information before handing the letter to patrons. However, the recruitment letters contained the same information. Teams went to each P&R station twice: the first time to distribute recruitment letters and a second time to place letters on the windshields of vehicles parked in the lot. The second visit served as a reminder to patrons.
We printed 4,200 letters, with half distributed for recruitment and half distributed on windshields as a reminder. Five hundred and seventy people responded to the survey. The real response rate was lower than 27.1 percent (=570/2,100) because some respondents received only recruitment letters, some received only reminder letters, and others received both letters. However, based on the number of responses before we distributed the reminder letter, the response rate was higher than 20.0 percent.
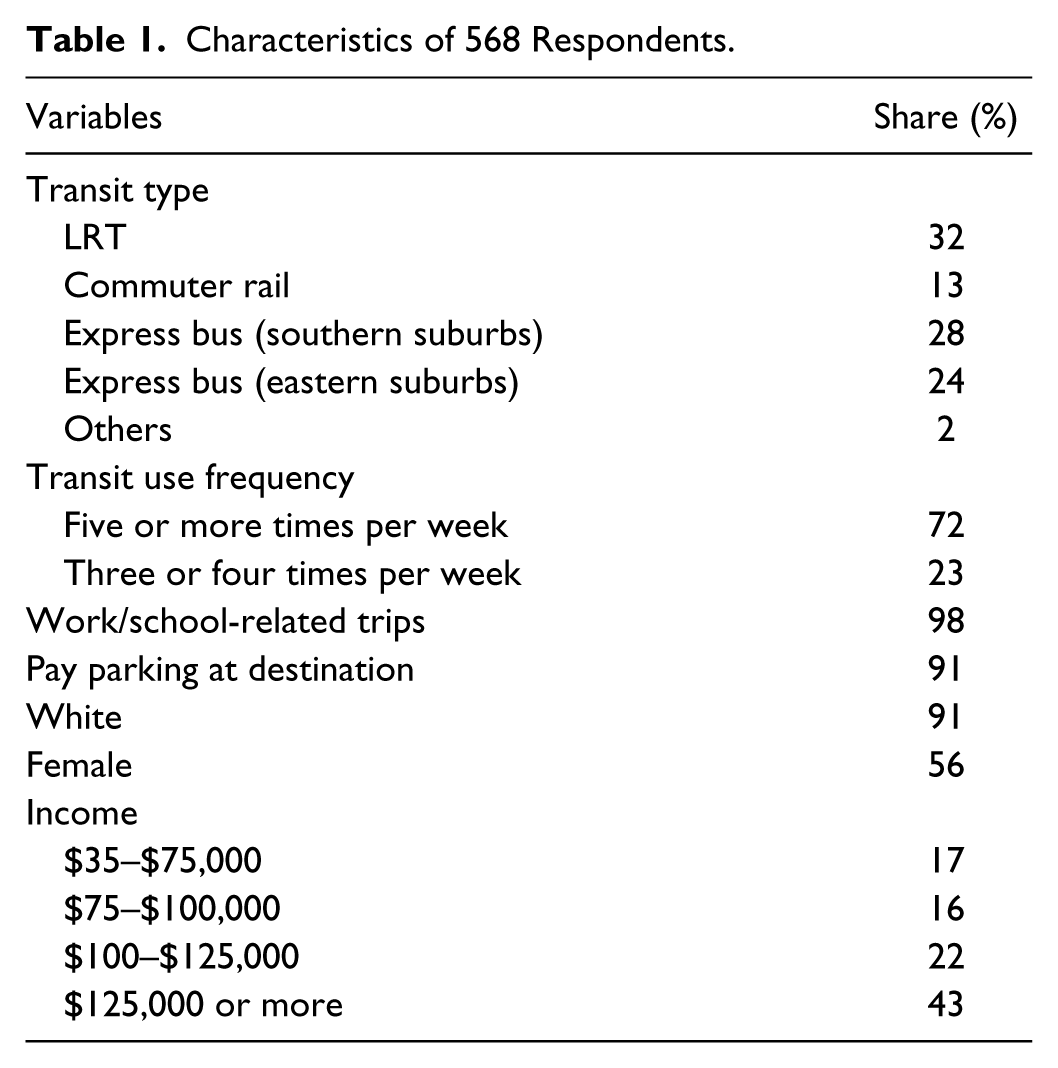
Among the 570 respondents, two accessed P&R facilities by bicycle and walking. Because this study focuses on the walking tolerance of car drivers who use P&R facilities, we excluded these responses from the analysis. Table 1 shows trip characteristics and the sample characteristics. Almost all the respondents frequently use transit and travel for work/school-related purposes. More than 90 percent of the respondents need to pay for parking at their destinations if they drive there. Caucasians make up nine out of ten respondents. Women account for 56 percent of the sample. The median income of the respondents is $100,000 to $125,000. We compared our sample with the 2016 Transit Onboard Survey data collected by Metro Transit. Metro Transit randomly recruited riders of all transit routes in the region and ensured that the number of respondents riding each route is approximately proportional to the ridership of the route. In the Metro Transit data, 54 percent of P&R users are women, 85 percent are white, and the median income is $100,000 to $150,000. Therefore, our sample and the Metro Transit data are largely consistent for these key characteristics. With that said, because population data for park and ride users are not available, we cannot fully assess the representativeness of our sample and a lack of representativeness is a potential threat to validity.
Characteristics of 568 Respondents.
Results
Descriptive Analysis
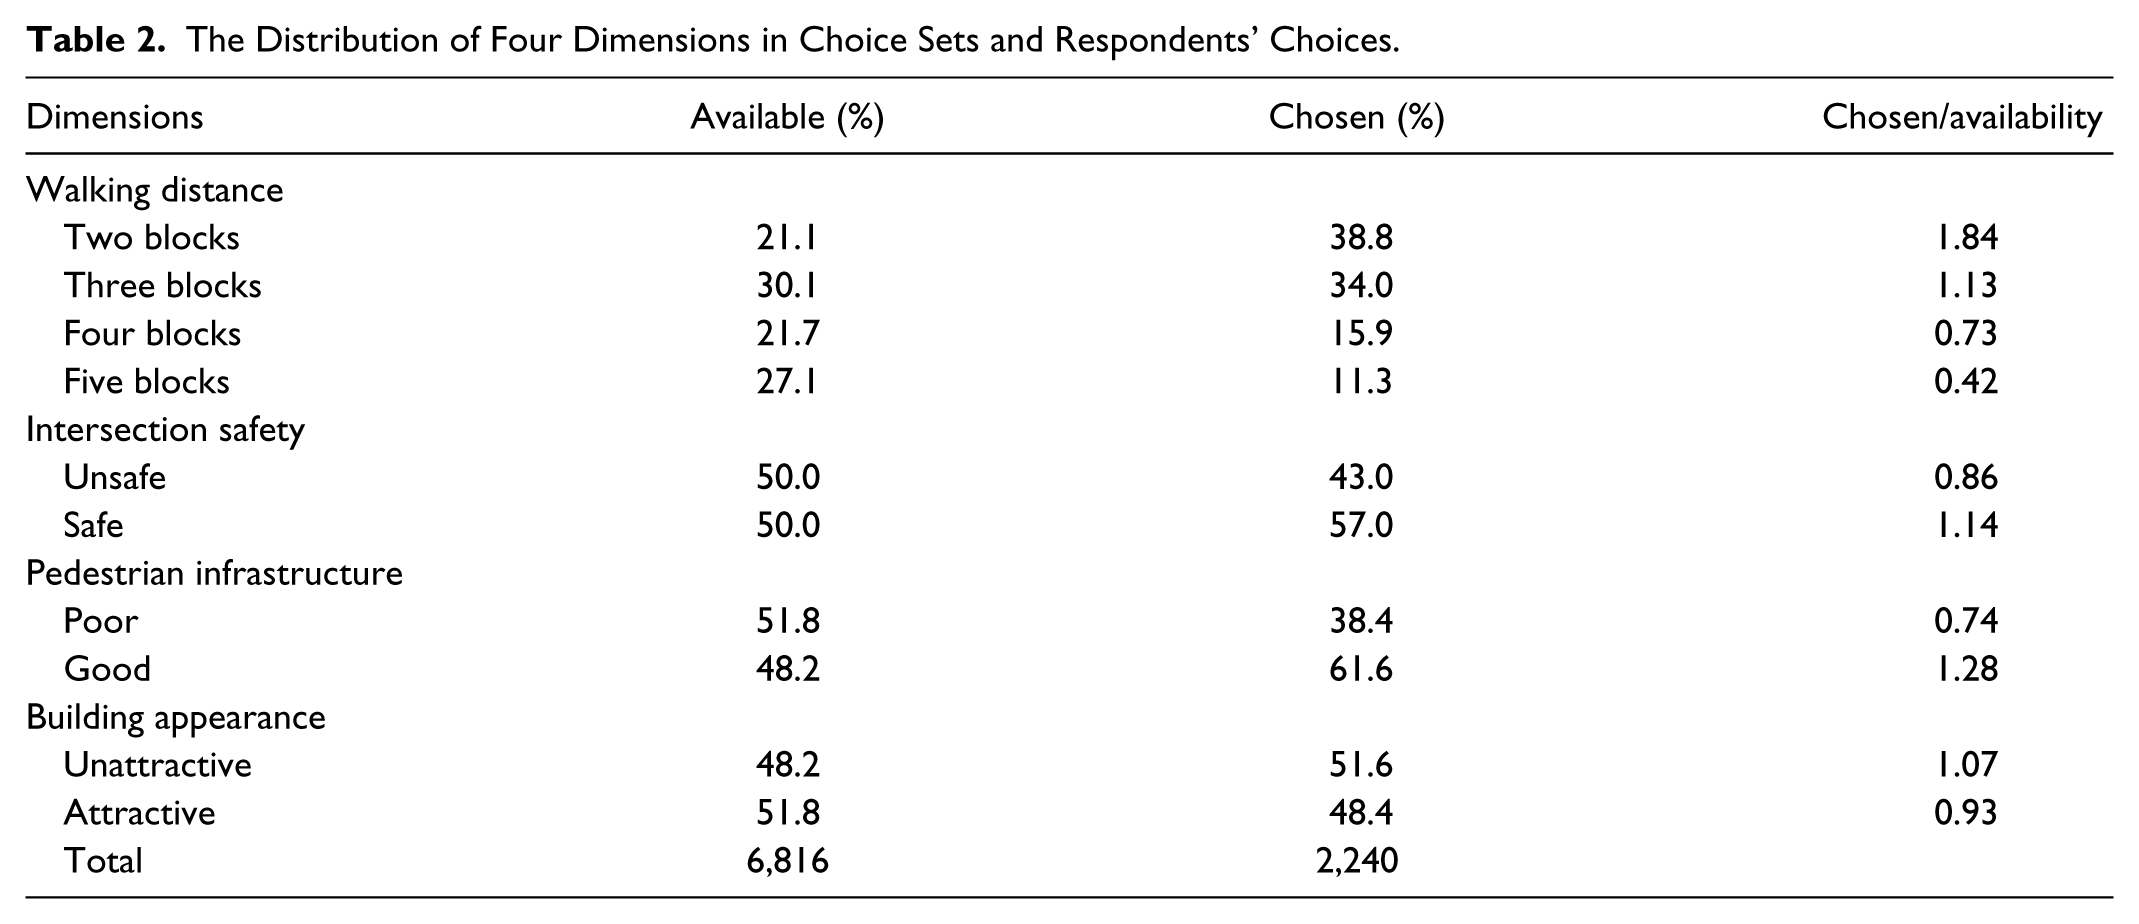
In the survey, we asked each respondent to answer four SP questions, and each question includes three scenarios. In other words, each respondent assessed twelve scenarios altogether. Thus, the data include 6,816 (568 respondents × 12 scenarios) respondent-scenario combinations. Since we asked respondents to choose one of the three scenarios in each question, respondents should have made a combined total of 2,272 choices. However, because of missing responses, the respondents made only 2,240 choices. As previously described, the scenarios vary by four dimensions: walking distance, intersection safety, pedestrian infrastructure, and building appearance. Table 2 describes the distribution of these four dimensions provided to the respondents and their choices of these dimensions. In terms of walking distance, two blocks were available in about 21 percent of the respondent-scenario combinations, but about 39 percent of the chosen scenarios had this level of walking distance. The average walking distance of all respondent-scenario combinations is three blocks (as compared to a two block minimum distance). These statistics suggest, not surprisingly, that the respondents prefer walking a shorter distance. Similarly, the respondents prefer a safe intersection and good pedestrian infrastructure. Conversely, respondents don’t have a strong preference for building appearance. Taken altogether, walking distance seems to outweigh the other three dimensions. However, because the choice of one dimension conditionally relates to the other three dimensions, a more rigorous assessment of the relative importance of these four dimensions requires multivariate analysis.
The Distribution of Four Dimensions in Choice Sets and Respondents’ Choices.
Multinomial Logit Models
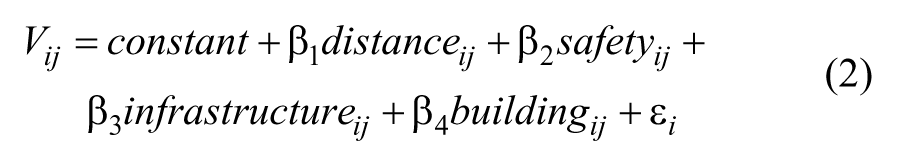
We used multinomial logit models to estimate the relative importance of the four dimensions of the pedestrian environment and quantify the block distance equivalence for each of the design dimensions. In this way, we can estimate the additional distance P&R users are willing to walk when planners incorporate different pedestrian-friendly design dimensions into the walking path. In the SP questions, respondents faced three scenarios (which combine different levels of the four attributes: walking distance, intersection safety, pedestrian infrastructure, and building appearance), and were asked to choose the scenario in which they would feel most comfortable walking from a P&R lot to the transit stop. Each of the four attributes in a scenario provides a certain utility (or disutility) to the respondent. We expect that walking distance carries a disutility (or cost to the respondent), whereas pedestrian-friendly designs have positive utilities (or benefits). The total utility of the scenario is the summation of the individual utility of each attribute. Within the utility-maximization framework, the respondent chose the image with the largest utility. Applying this framework to a statistical analysis means that each scenario serves as an observation, and whether or not a given scenario is the preferred choice becomes the dependent variable. The four attributes associated with the scenario become the independent variables and the size of the coefficients for each of these variables represent the utility (or disutility) associated with each of these attributes. This model is analogous to a residential location choice model, in which the choice of a given traffic analysis zone (TAZ) as one’s residence is the dependent variable and land use attributes associated with the TAZ are the independent variables (Bhat and Guo 2007).
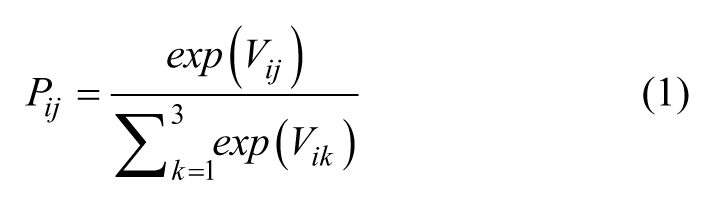
In statistical notation, the probability that an individual i chooses scenario j among three scenarios (Pij) can be expressed in the following equations
Because the four attributes are alternative specific variables (ASVs), we used the command “asclogit” to develop models in Stata 14.0. Since we gave each respondent four questions to assess, the respondent may not evaluate the four questions independently. Thus, we developed the variance–covariance matrix corresponding to the parameter estimates using a clustered sandwich estimator.
With this type of model, individual-specific variables (i.e., the demographic characteristics of the survey respondents) only have predictive power when they are interacted with ASVs. This can test whether the effect of each ASV differs by demographic characteristics (see Bhat and Guo (2007) for an example). In Table 14 of the associated technical report (Cao, Lampe, and Zhang 2017), we presented the results of interacting the four design characteristics and demographics. The utility of these design elements vary by some demographic characteristics. However, the results are difficult for non-technical readers to understand. Because this study aims to estimate the additional distance general P&R users are willing to walk when planners incorporate different pedestrian-friendly design dimensions into the walking path, instead of a particular type of P&R users, we opted to not report the interaction effects between ASVs and demographic variables in this paper.
Table 3 shows the model results for all respondents. All four dimensions have significant coefficients: walking distance has a negative influence and the other three variables have positive signs. The shorter the walking distance between P&R facilities and transit stops within a given choice, the greater the likelihood that a respondent chose it. Respondents also had a greater likelihood of selecting a scenario with safe intersections, good pedestrian infrastructure, and/or attractive building appearance.
Multinomial Logit Model for All Respondents.
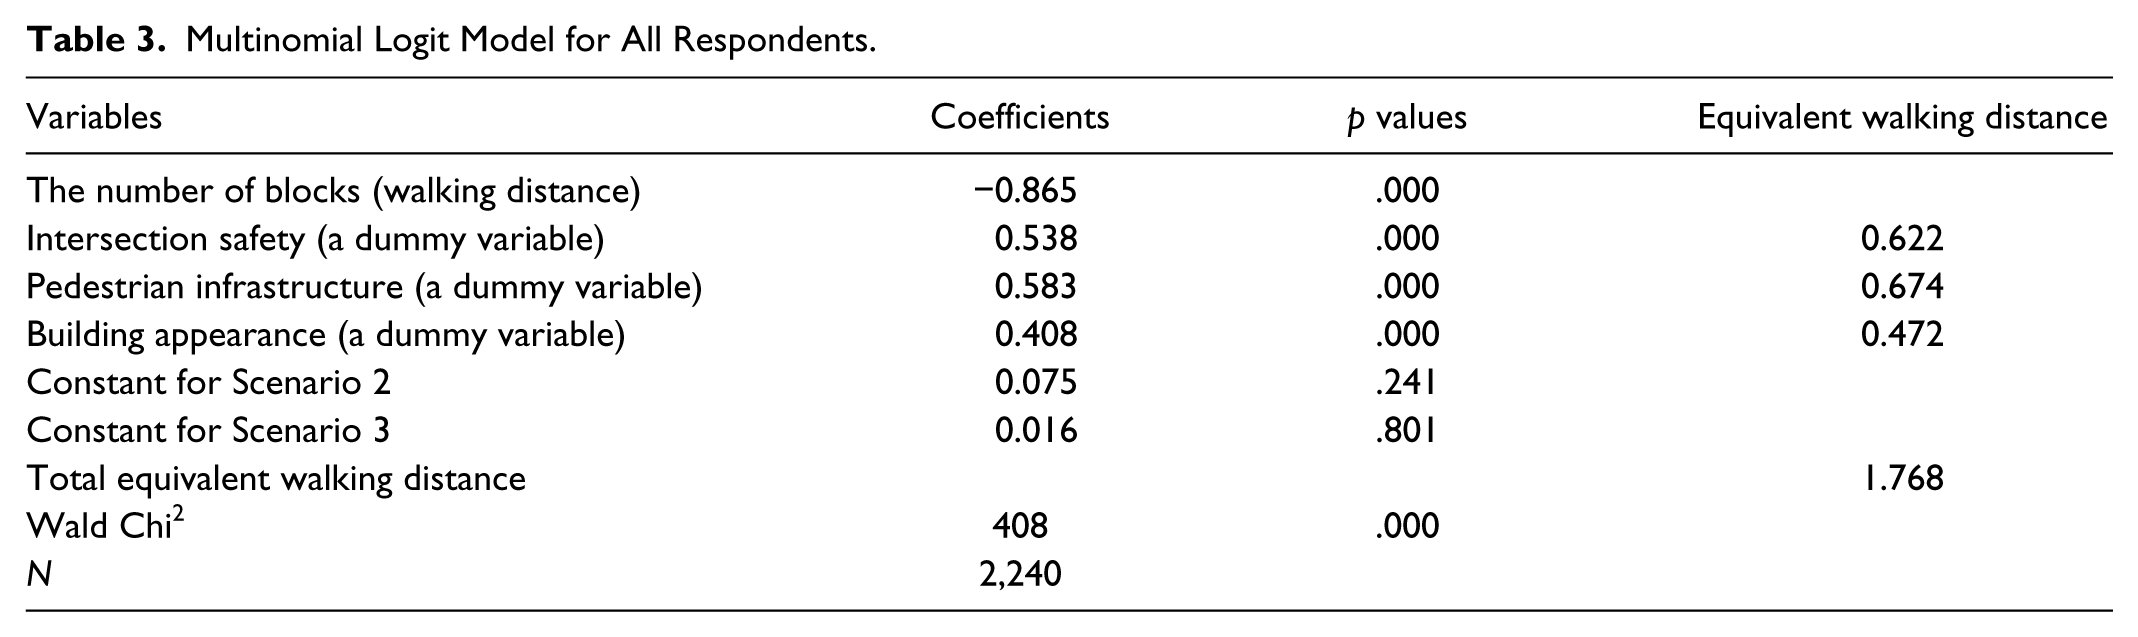
Based on the model coefficients, we can estimate the walking distance equivalence of a given design feature. For example, the number of blocks and intersection safety have coefficients of -0.865 and 0.538, respectively, meaning that 0.622 (=0.538/0.865) blocks have the same impact on the respondents’ preference as an unsafe intersection. In other words, relative to an unsafe intersection, a safe intersection can compensate for the impact of 0.622 blocks of walking distance. Similarly, good pedestrian infrastructure and attractive building appearance can compensate for the impacts of 0.674 and 0.472 blocks, respectively. Cumulatively, all the three dimensions can mitigate the impact of about 1.8 blocks (precisely, 1.768 blocks). Thus, if planners can provide safe intersections, ample pedestrian infrastructure, and attractive buildings along a walking path that does not currently have such features, P&R users seem willing to walk about 1.8 additional blocks from the P&R facility to the stop.
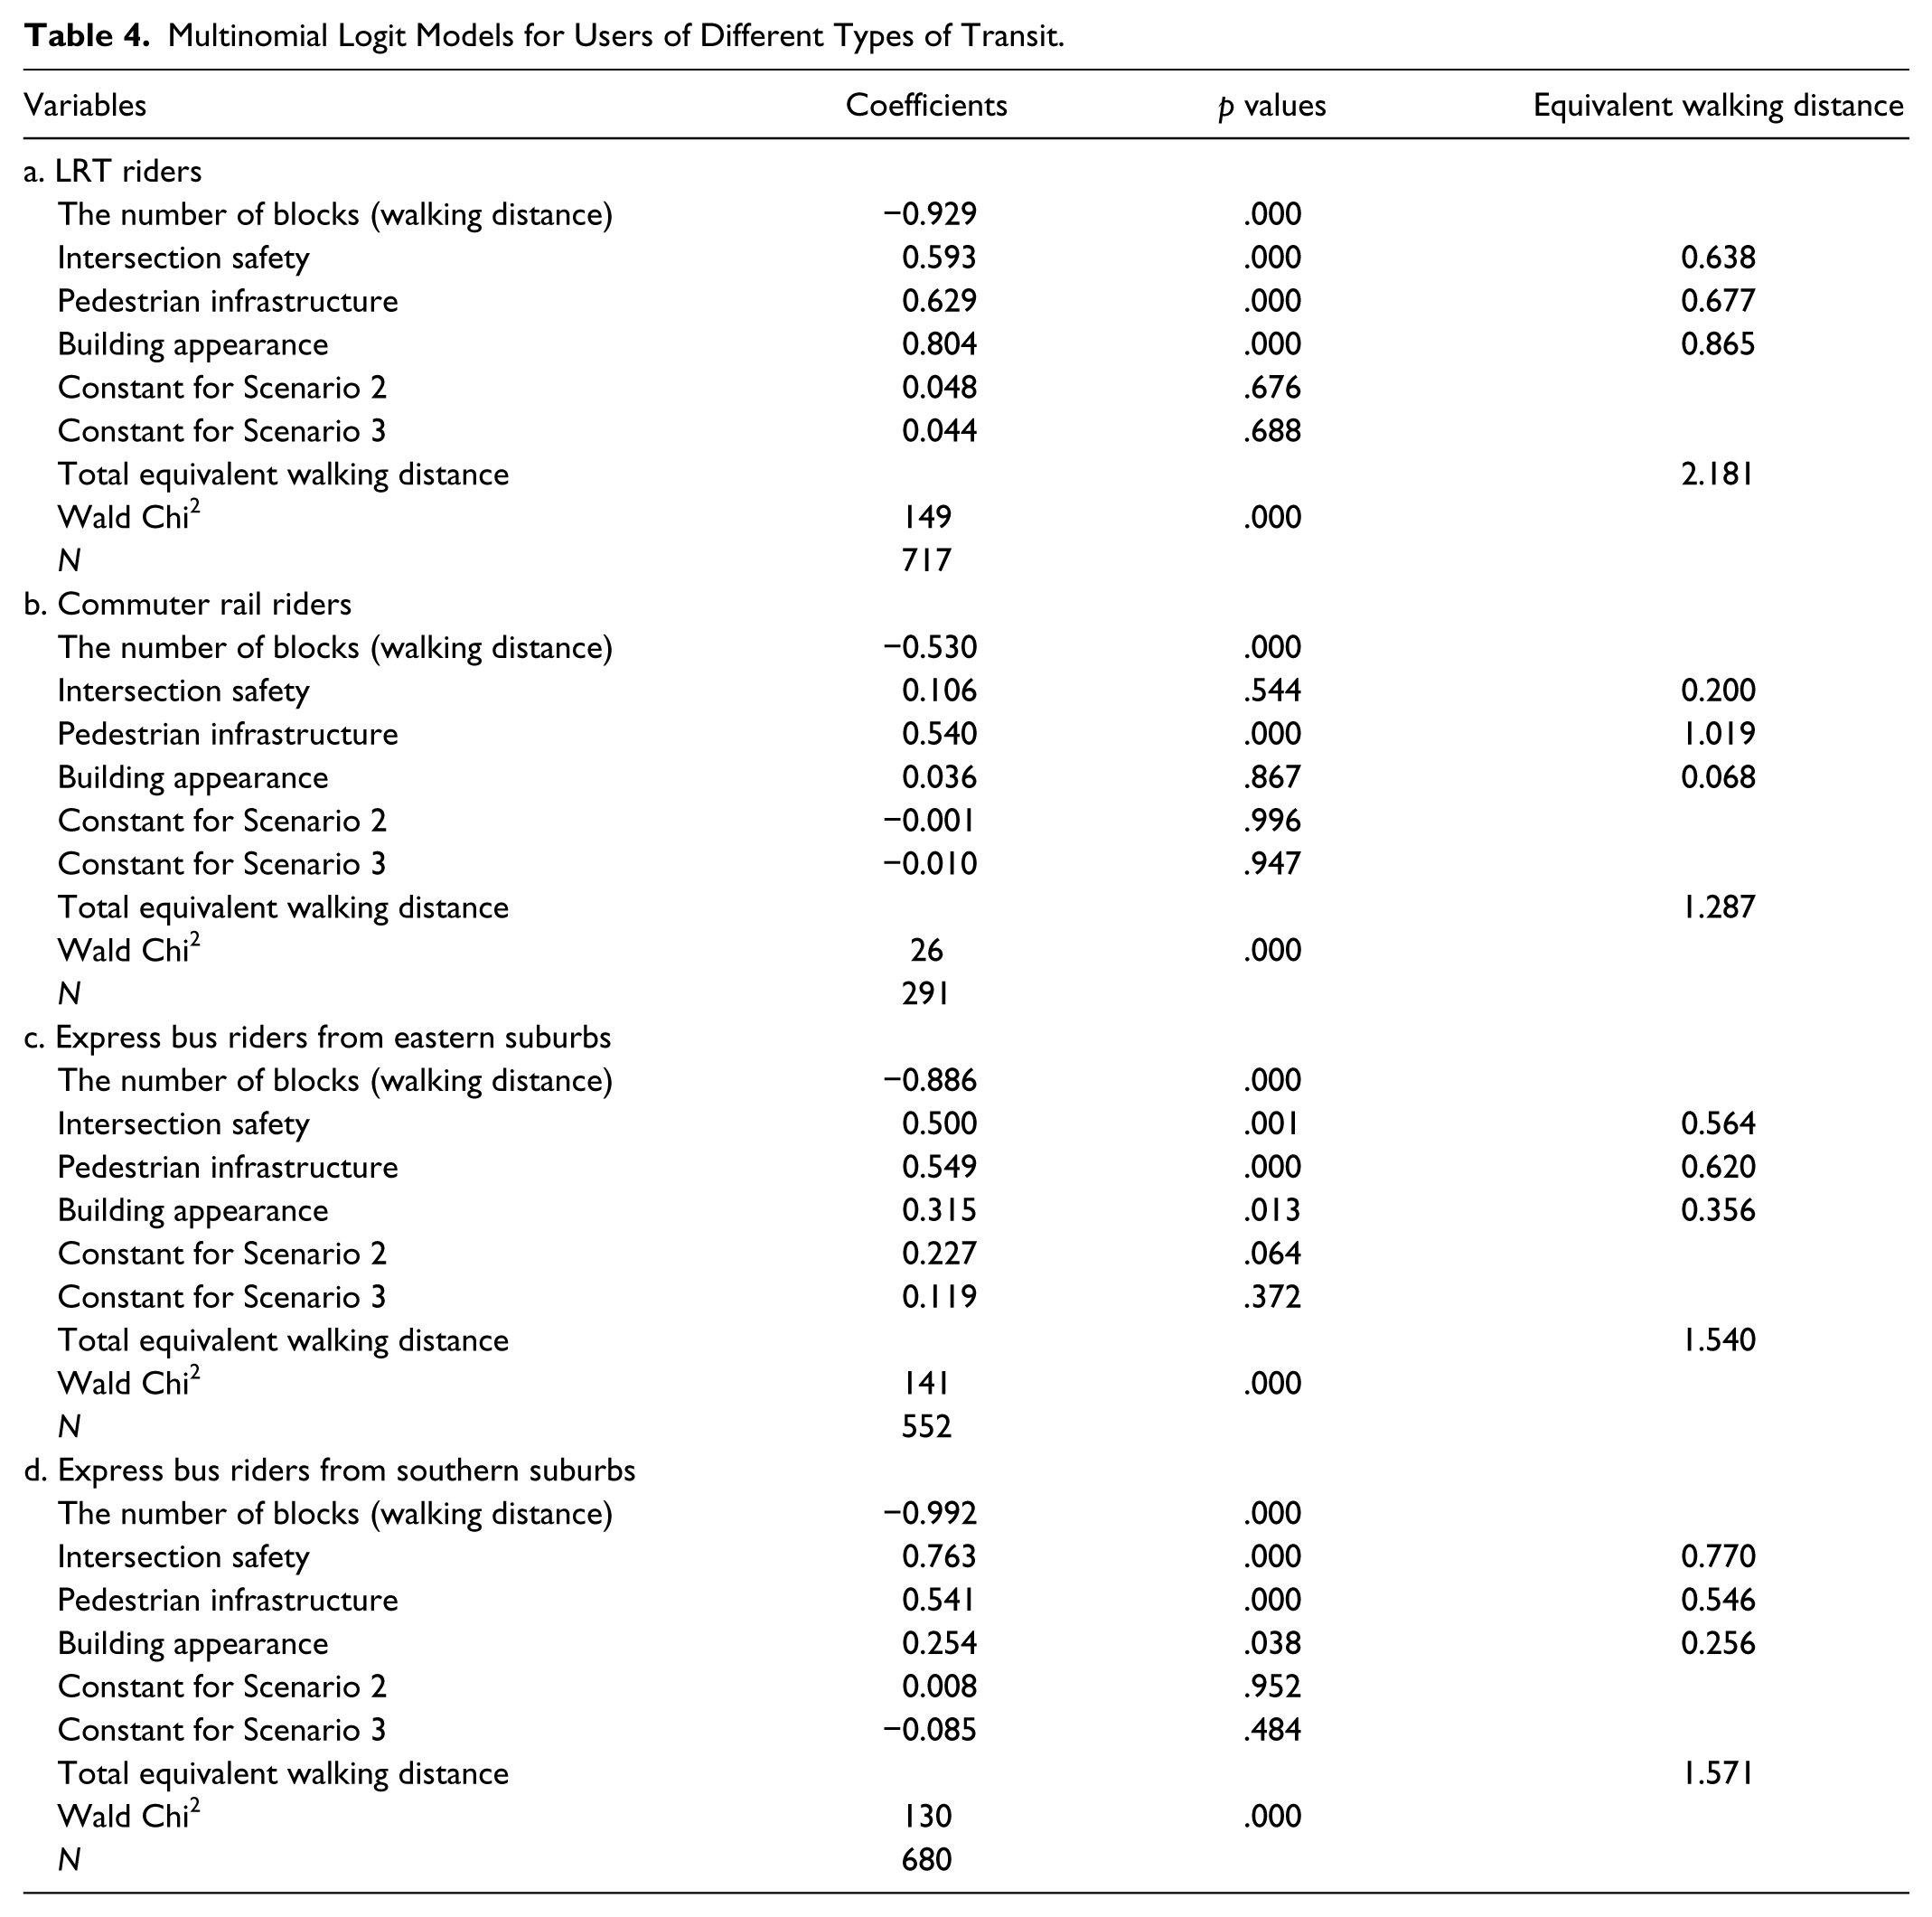
Table 4a shows the results for only the subset of LRT users. Building appearance seems more important for these LRT users than all respondents as a whole, as it has an equivalent walking distance of 0.865 blocks. Table 4b shows the results for only commuter rail users. For them, intersection safety and building experience have insignificant coefficients but pedestrian infrastructure becomes more important, with an equivalent walking distance of 1.019 blocks. Table 4c and 4d illustrate the results for express bus users from P&R facilities in southern suburbs (Burnsville and Apple Valley) and in eastern suburbs (Woodbury), respectively. The impacts of intersection safety, pedestrian infrastructure, and building appearance appear roughly similar for express bus users in southern and eastern suburbs, demonstrating the robustness of the empirical results.
Multinomial Logit Models for Users of Different Types of Transit.
Stated Importance
As previously described, we asked respondents to indicate the importance of 15 attributes in determining how far they will walk through a shopping area from a P&R lot. Table 5 illustrates the ranking of these attributes by all respondents and riders of different types of transit. In general, the ranking order remained consistent among all respondents and users of different types of transit. Sidewalks and crosswalks cleared of snow in winter, adequate street lighting, and presence of crosswalks and pedestrian signals represent the highest ranked attributes. Respondents also give high importance to sidewalks in good condition, ranking it fourth. The three highly ranked attributes related to sidewalks and crosswalks point to the importance the respondents place on the ease of walking between transit stops and P&R facilities. The quality of lighting serves as an indicator of security. The other two indicators of security (area is free of trash and vacant and rundown buildings) rank fifth and sixth among the fifteen attributes. The high rankings for these three security indicators demonstrate the importance of the psychological aspects of walking. On the other hand, the attributes associated with aesthetic quality of the environment did not rank as highly. The ranking of these attributes mostly follows a consistent pattern with the modeling results in Table 3. The attribute of benches and places to sit ranks lowest. Walking trips of P&R users focus more on direct travel to destinations (either P&R facilities or transit stops). Therefore, we would expect that such characteristics rank lower than sidewalks and crosswalks, as well as security. However, one should interpret these results with caution because their validity depends on the representativeness of the sample.
Stated Importance of the Attributes of Pedestrian Environment.
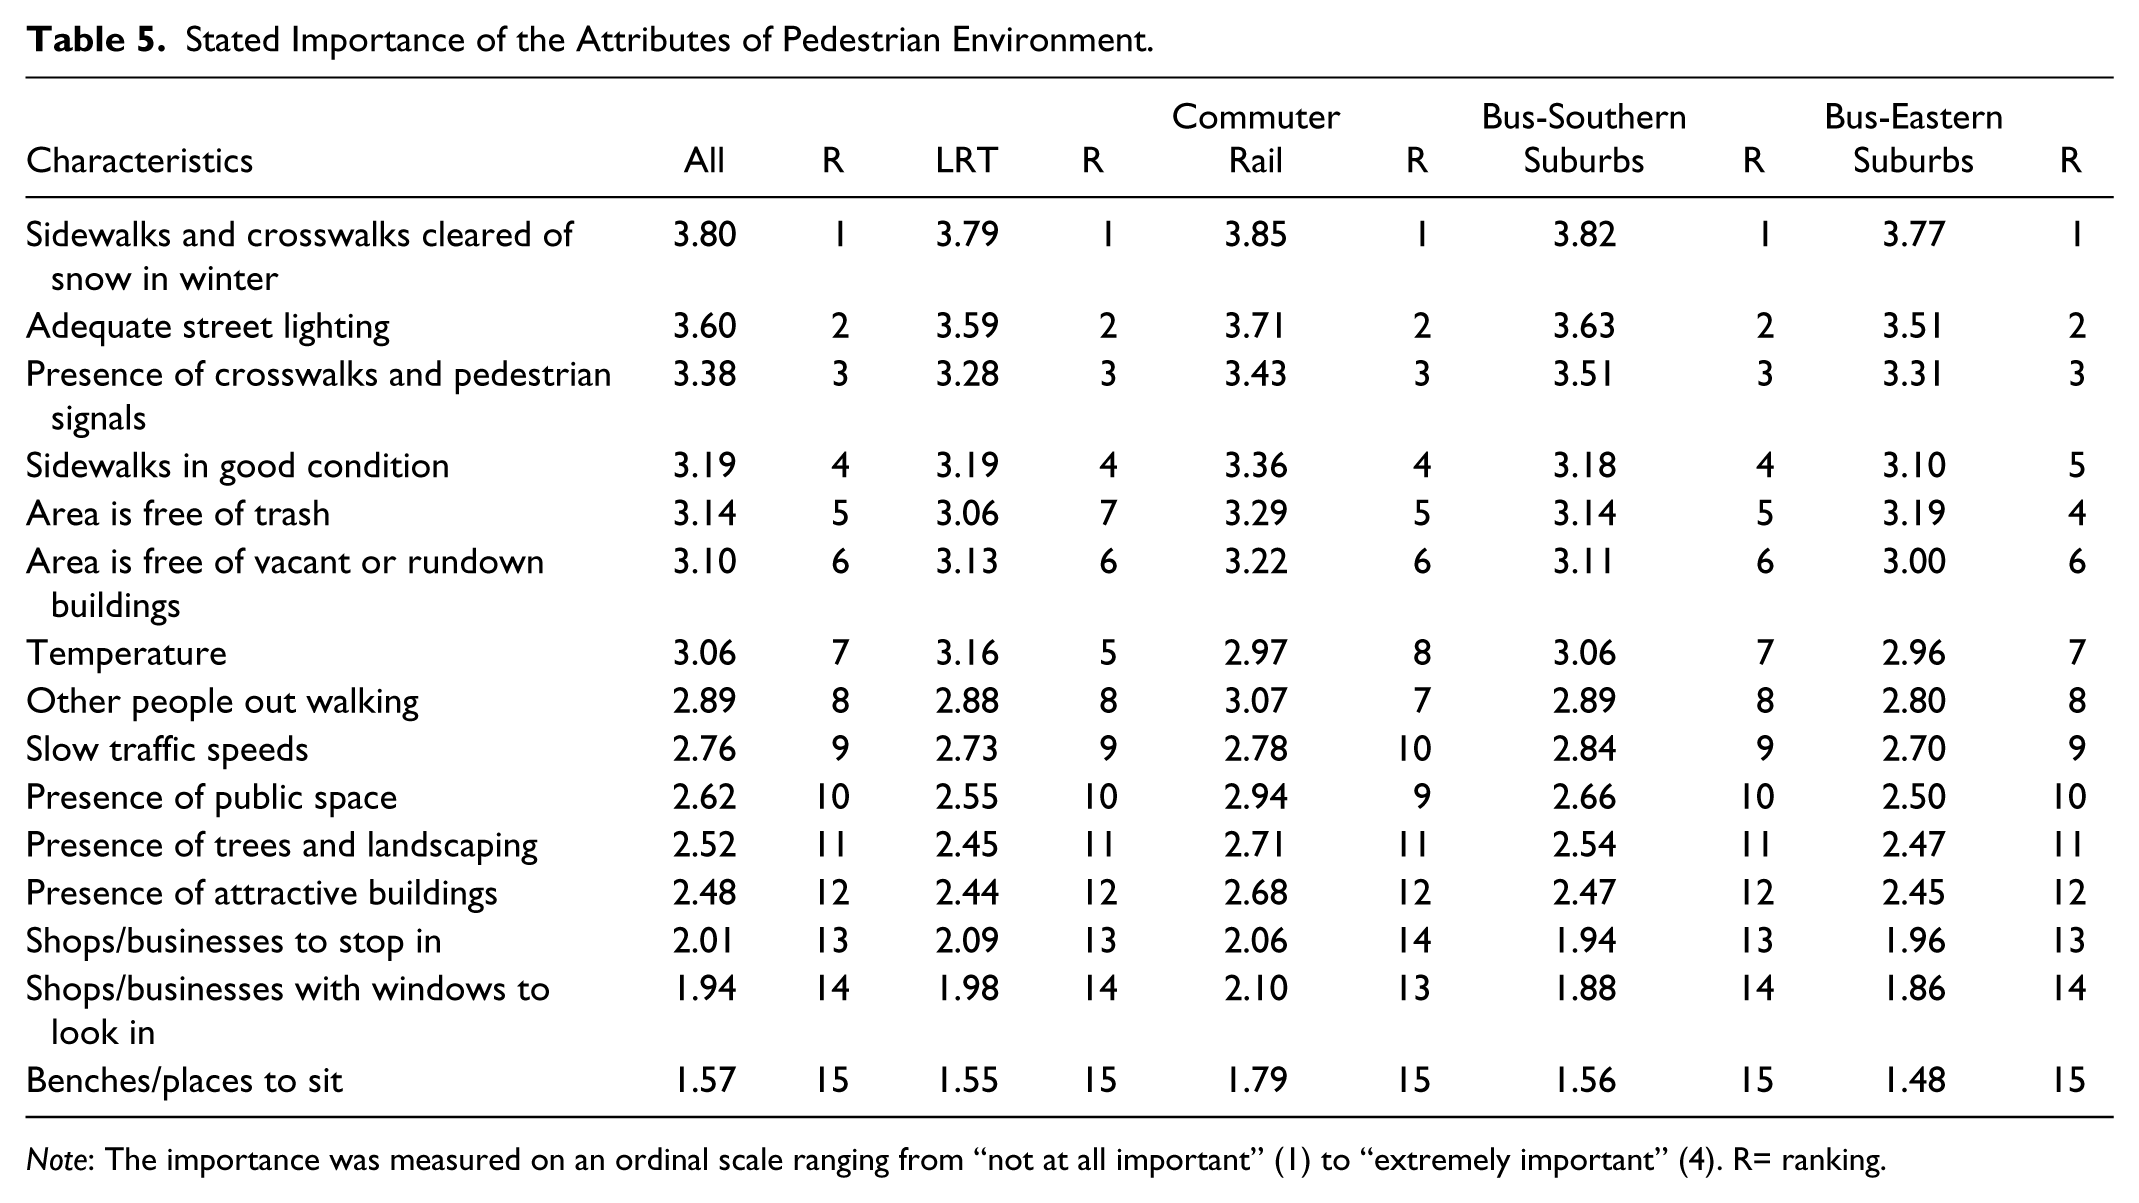
Note: The importance was measured on an ordinal scale ranging from “not at all important” (1) to “extremely important” (4). R= ranking.
About 40 percent of the respondents offered comments (not shown here) at the end of the survey. These comments also provide supportive evidence to these findings. In particular, many respondents highlighted the importance of short walking distance, lighting, safety, and weather-friendly conditions. Some respondents also mentioned coffee places and restrooms.
Conclusion
This study adopted a SP analysis to understand the additional distance park-and-ride users are willing to walk if provided with a good pedestrian environment. The study has limitations in terms of generalizability. The level of walking tolerance found among the P&R users in our survey likely relates to the specific conditions in the Twin Cities. P&R users in larger regions with higher parking costs and more congestion (e.g., New York City) will likely have a greater tolerance for walking because the costs associated with switching to driving (in terms of time and money) are very high. Conversely, smaller regions where the cost of driving is low will likely have a lower tolerance for walking to the station. The analysis method also has limitations. First, SPs do not measure actual behavior, leading to the problem that “what people say they will do is often not the same as what they actually do” (Train 2003, 157). Second, to reduce the burden on respondents, researchers can test only a limited number of attributes while holding others constant. This may lead to omitted variable bias. In addition, this approach suffers from some sources of bias, such as affirmation bias where people provide the response they think the researcher wants (Train 2003). Nevertheless, because P&R facilities at the edge of TOD are not available, this approach can offer important insights to improving planning practice.
The results showed that walking distance, as perceived through this survey, has a stronger influence than intersection safety, pedestrian infrastructure, and building appearance on P&R users’ choices. The dominance of walking distance is consistent with Agrawal, Schlossberg, and Irvin (2008). However, a good pedestrian environment along the walking path could mitigate the disutility of walking distance. More specifically, good intersection safety, pedestrian infrastructure, and building appearance can mitigate the impacts of 0.622, 0.674, and 0.472 blocks of walking distance, respectively, which represent small but nontrivial distances. If all three characteristics occur in combination, P&R users will walk about 1.8 additional blocks 1 to reach P&R facilities.
In terms of specific design elements of the pedestrian environment, the analysis of stated importance illustrated that when determining the tolerance of park-and-riders for walking, they value snow clearance, street lighting, and intersection safety the most. In general, the quality of the sidewalk network connecting transit stops and P&R facilities has the greatest importance to respondents, followed by safety and security attributes associated with the pedestrian environment. The respondents’ comments to the survey echo these sentiments, which also coincide with Vargo’s (2013) findings. Conversely, aesthetic quality seems less important for our respondents—park and ride users. This differs from our understanding of walkability of the general population. For instance, Forsyth and Southworth (2008) state that a walkable environment should include a short distance, free of major barriers, a safe environment in terms of traffic and crime, adequate pedestrian infrastructure, and a walking area with attractive landscaping and architecture design.
Overall, if planners have an interest in relocating P&R facilities to the fringe of TOD, this study suggests that, when coupled with a good pedestrian environment, these facilities can be moved roughly two city blocks away from the transit stop. Because our study focuses on determining the tolerance for additional walking, some P&R user with a higher baseline tolerance for walking (i.e., tolerance for walking under poor conditions) might be willing to walk more than two blocks to the station. However, since we don’t know their baseline tolerance, two blocks seem a safe recommendation for a P&R facility’s maximum distance from a station (at least in the Twin Cities context). Despite the seemingly short distance, moving a P&R facility just a block or two away from the transit stop could open several acres for TOD immediately around the station. It would also take the P&R facility out of the immediate path of most people walking to/from the stop. Because of the utilitarian nature of transit access and egress, intersection safety and pedestrian infrastructure seem more important than building appearance, although the relative importance of the three dimensions varies by the type of transit service. Regarding specific design elements, this study highlights the importance of safe and secure pedestrian environments, specifically with regard to snow clearance (applicable to cold regions), street lighting, crosswalks, and pedestrian signals.
Footnotes
Authors’ Note
Chen Zhang helped with the literature review. Joe Lampe helped with the survey design and administration. Ying Jiang helped with the orthogonal factional factorial design.
Declaration of Conflicting Interests
The author(s) declared no potential conflicts of interest with respect to the research, authorship, and/or publication of this article.
Funding
The author(s) disclosed receipt of the following financial support for the research, authorship, and/or publication of this article: This study was funded by Minnesota Department of Transportation.