
Abstract
This paper uses social network analysis to assess the overlap of organizations involved in hazard mitigation and planning networks in Houston, TX. We compare measures of network centrality and density to highlight unique characteristics across two networks and discuss implications of connectivity within each network. Results suggest that central actors occupy important structural locations within both networks. These overlapping organizations may be highly influential in both planning and hazard mitigation efforts. Finally, we discuss aspects of connectivity in these networks and discuss how the networks can be used to become more equitable and holistic in planning and hazard mitigation efforts.
Introduction
With disaster costs rising, there has been renewed attention on hazard mitigation, defined as proactive measures to lessen the impacts of disasters. Mitigation is key to breaking the cycle of disaster damage, recovery, and repeated damage (Godschalk et al. 2009; National Institute of Building Sciences 2018). Hazard mitigation has traditionally been led by local emergency management departments (Federal Emergency Management Agency [FEMA] 2019). Effectively reducing risks to future hazards, however, requires coordination with multiple agencies. Coordination between hazard mitigation and planning is particularly important. It has long been recognized that the best way to mitigate future hazards is to guide development out of risky locations (Burby 1998). Emergency managers’ knowledge and expertise can provide valuable information to guide planning and land development, yet many emergency managers view planning as outside their professional responsibilities (Lyles 2015; Schwab 2014; Schwab and Topping 2010). Similarly, planners often view hazard mitigation as beyond their purview (Lyles, Berke, and Smith 2014). Consequently, hazard mitigation has traditionally been isolated from land use planning (Berke and Smith 2009). In response to this disconnect, scholars and policymakers have called for better coordination and integration of hazard mitigation and city planning efforts (Berke and Smith 2009; Burby 1998, 2006).
This paper examines the connections and overlap between organizations involved in planning efforts and hazard mitigation. Specifically, we ask how much overlap exists between organizations involved in hazard mitigation efforts and those involved in planning. By this definition, an “overlapping” organization is one that is involved in both hazard mitigation and planning. There is a gap in our understanding about the extent to which planning organizations are actually involved in hazard mitigation efforts and whether those involved in hazard mitigation are also involved in the planning process. For example, while numerous organizations may be engaged in planning for conservation and parks, they may not be involved in hazard mitigation efforts that could leverage these park projects. Similarly, some organizations that are heavily involved in hazard mitigation may not be actively engaged in planning efforts. These omissions represent potential missed opportunities to integrate hazard mitigation into land use and development decisions, possibly leading to increased risk for people and property.
We use social network analysis (SNA) to examine the overlap of hazard mitigation and planning networks in Houston, TX. We map a collaboration network based on a survey of regional organizations involved in flood mitigation about their regular collaboration with other organizations. We create a planning network of the organizations involved in plans used to guide development and management decisions in the region, including participating organizations and implementation partners. This analysis provides new perspective and insight regarding the regional network of actors involved in mitigating flood risk.
SNA of the individual networks can illuminate key players (e.g., dense or well-connected organizations), important connections and gaps, and other important structural characteristics of the networks (Dempwolf and Lyles 2012). SNA has rarely been used in planning contexts (Dempwolf and Lyles 2012); this paper presents new approaches to analyzing organizations engaged in plan making and implementation.
We specifically address three questions. First, who are the actors in hazard mitigation and planning networks? Second, are the organizations listed in the planning network also well-connected in the collaboration network, and vice versa? Third, what are the implications of these relationships and overlap, or absence thereof for hazard mitigation? The organization of this paper is as follows: we begin with a review of the literature of planning networks, as well as existing research regarding stakeholder collaboration networks in environmental contexts. We then outline the context, data, and methods of the study. Results and implications are then discussed. Finally, we conclude with some remarks about planning integration and policy relevance for hazard mitigation and planning professionals.
Planning Networks
In a geographic region, multiple plans guide development. Increasingly, planning scholars recognize that to understand the effect of planning we must simultaneously consider the multiple plans a community adopts. Previous system-of-plans analysis sought to create a planning support system or information system of plans by geocoding and layering actions from multiple plans in a geographic information system (GIS) (Finn, Hopkins, and Wempe 2007; Kaza and Hopkins 2012). More recently, Berke et al. (2015, 2018) developed a “resilience scorecard” that evaluates the combined effect of multiple plans on physical vulnerability to flooding. These studies have documented inconsistencies and conflicts between plans that may give rise to uncoordinated, hazardous development. Specifically, while hazard mitigation plans typically identify areas at high flood risk and suggest proactive steps to minimize future flooding, comprehensive and economic development plans all too often guide new or intensified development toward these risky locations (Berke et al. 2018).
Plan documents are an important outcome of a planning process, but the engagement of different stakeholders in a collaborative process is of equal importance. Finn, Hopkins, and Wempe (2007) argue that contradictions and inconsistencies between plans are to be expected due to the diverse parties involved in planning and changes over time. The threat is not that plans themselves disagree, but that the organizations that are ultimately responsible for development and delivery of services are uncoordinated. Generating, sharing, and agreeing on information in a planning process can help stakeholders learn and develop new understandings of a topic, such as hazard mitigation (Burby 2005; Hanna 2000; Innes 1996, 1998). Planning can also lead to the formation of new alliances and collaborations (Burby 2005; Forester 2013; Innes, Connick, and Booher 2007). Plan processes have been characterized as policy forums, where actors bargain and make decisions, often building social networks in the process (Lubell 2013). Participation in a planning process does not necessarily lead to collaboration, but it does create an opportunity to build new or augment previous relationships. In this paper, we conceptualize involvement in planning processes as a cooperation network, where organizations involved can capitalize on their participation in the plans.
Berke et al. (2006) liken planning to a high-stakes game over the future of a community. Diverse stakeholders from various types of organizations engage in planning to guide land use and development in their interest (Lyles 2015). Formation of coalitions and planning involvement can lead to changes in the direction of a community’s comprehensive plan or, increasingly, to the production of standalone plan documents, designed to help their creators achieve specific goals (Hopkins 2001). As such, it is important to analyze who is actually involved in planning processes.
While the term “network” has been applied to describe the multiple, interconnected plans that cities adopt, network analysis tools have rarely been applied to analyze plans. As outlined in Dempwolf and Lyles (2012), SNA may provide useful information that will assist in solving problems typically faced by planners, such as coordination and cooperation costs, dynamics of power and influence, and information flows. To illustrate, a network map may show central or core organizations involved in a planning process, which may be influential in disseminating information to the disparate portions of the network and may also facilitate collaborative forums that foster cooperation and build trust. Previous studies have used SNA to analyze the positions of individuals and organizations in a planning process (Fischer et al. 2016; Lienert, Schnetzer, and Ingold 2013; Lyles 2015; Mills et al. 2014). For example, by comparing the network of individuals involved in hazard mitigation planning in two counties, Lyles (2015) argues that the position of planners is important in the type of mitigation strategies included in plans. Here, we build on these previous studies by building a network for multiple plans within a community.
Collaboration Networks
Traditionally, hazard mitigation has been led by local emergency management departments (FEMA 2019), but hazard mitigation requires coordination with multiple other agencies and stakeholders (Schwab 2014). For example, improving stormwater drainage will likely involve a city’s public works, budget, and engineering departments. Similarly, mitigation strategies to preserve floodplains in their natural state will likely involve parks and open space departments, as well as conservation organizations and landowners.
Stakeholder collaboration network studies examine both the causes and the results of interactions among stakeholders, and recent policy studies have emphasized the role of stakeholders in natural resource governance, planning, hazard mitigation, and other polycentric governance decision-making processes (Berardo and Lubell 2016; Jung, Song, and Feiock 2017; Lyles 2015; Prell, Hubacek, and Reed 2016; White et al. 2017). Network scholars suggest that one’s network connections and position in the overall network will affect how and what resources are available to the network actors (Brass 1984). For example, how a network actor is connected to other actors in the network will influence the rate at which they receive information or have access to resources (Borgatti 2005).
The network literature highlights several reasons why network connections are important in hazard mitigation (Aldrich 2012a; Sadri, Ukkusuri, and Gladwin 2017). The argument, however, is quite simple. Individuals and organizations that are well-connected to the mitigation network have increased access to resources, such as information or tools, to reduce vulnerability to hazards and rebuild after a disaster (Aldrich 2012b). Those organizations with better connections to planning agencies, stakeholders, and local or regional decision-makers may be better able to influence the mitigation processes, both on-the-ground and in public policy, than less well-connected organizations. Essentially, network ties provide access to resources that may increase an organization’s power in effecting change (Knoke 1990). In hazard mitigation, stakeholder perspectives, opinions, and policy preferences can influence local governmental agencies and reduce the damage of future disasters. Specifically, when stakeholders perceive risk in a particular area or from a certain type of disaster, they can mobilize as a collective to influence action that will reduce vulnerability (Touili et al. 2014). What is less understood is how interconnections among stakeholders creates a network of stakeholders involved in hazard mitigation efforts.
Network Overlap—Theoretical Considerations
Comparisons of the networks can reveal important information about organizations involved in multiple aspects of hazard mitigation. For instance, if the organizations connected in the planning network are not connected in the collaboration network, it may suggest a need to reinforce collaboration links. Conversely, places where existing social networks are stronger or include connections to groups not listed in plans may indicate opportunities for wider and more effective plan participation. By comparing these networks, we can identify the absence or marginalization of important organizations, missed opportunities for collaboration, and the relative strength of connections compared to what might be expected.
For hazard mitigation, the planning network may serve as a blueprint for expected collaboration among organizations in the region. Those listed as participants in the creation of a plan document, or overtly identified implementation partners, might reasonably be expected to be connected to each other within the collaboration network. Conversely, those involved in the collaboration network may have existing relationships that can be leveraged in the planning network. Planners can play a particularly important role in hazard mitigation by recommending land use policies and strategies that guide development out of risky locations (Lyles 2015; Lyles, Berke, and Smith 2014). On the contrary, emergency managers’ knowledge and expertise can provide a valuable resource to help guide planning and land development (Lyles 2015; Schwab and Topping 2010). The relative positions of different organizations within the two networks might be expected to coincide. Organizations with strong placement in the planning network but weak connections in the collaboration network may indicate an alignment problem related to staffing or organizational goals.
Comparison of the two networks may also be a way to evaluate the impacts of planning. A diverse set of actors collaborate in a planning process to reduce vulnerability and build resilience; however, engagement in planning does not equate to actual involvement in on-the-ground hazard mitigation. It is clear that the networks of organizations involved in planning highlight the diverse body of organizations potentially able to assist in mitigation, yet it is unclear how the planning network actualizes in the collaboration networks for hazard mitigation.
Study Context: Houston, TX
Our study centers on hazard mitigation in the Greater Houston region in Texas, USA. Houston is extremely vulnerable to flooding. In late August 2017, Hurricane Harvey caused an estimated $125 billion in damage, largely from flooding. After making landfall north of Corpus Christi, the storm traveled toward the Houston metro area and then stalled for several days, releasing unprecedented levels of rainfall and inundating large swaths of the city (City of Houston 2018b). Although its impact was particularly severe, Harvey is only one event in the city’s long history of flooding. Before Harvey, Houston suffered flooding disasters in both 2015 and 2016, which resulted in 16 deaths and more than $1 billion in damage (City of Houston 2018a). Twenty-three separate federal disaster declarations were declared in Harris County (which encompasses much of Houston) for flooding and tropical storms in the 40 years between 1973 and 2012 (Harris County 2013). Since Harvey, tropical Storm Imelda also caused severe flooding in the city in September 2019.
Due to the frequency and high cost of flood events in Houston, flooding has increased in importance and prevalence in political spheres (Associated Press 2019). Following Harvey, political action committees were formed to lobby for local bond measures and assistance from the Texas legislature. Coalitions of stakeholders developed plans for flood infrastructure investment in the region. This level of activity around flooding in Houston, especially outside government, differs from many places that have difficulty engaging stakeholders in hazard mitigation.
Despite Hurricane Harvey’s unprecedented character, both academic and media sources have argued that its damage was exacerbated by poor planning and uncontrolled development (Boburg and Reinhard 2017; Brody, Highfield, and Kang 2011; Sebastian et al. 2017). Rapid growth coupled with inadequate land use planning has contributed to Houston’s extreme flood vulnerability (Masterson et al. 2014). Houston has no formal zoning code, and development has been permitted in the hundred-year floodplain. Consequently, development continues in these high-risk areas. According to an analysis of local appraisal data, more than seven thousand residential buildings have been built in the hundred-year floodplain in Harris County since 2010 (Shaw, Satija, and Collier 2016). While the city has adopted regulations to reduce the vulnerability of new structures built in the floodplain, regulations that govern land use in Houston have been adopted in a piecemeal and reactive fashion (Marcano, Festa, and Shelton 2017). Floodplains have also expanded in recent decades due to uncoordinated and sprawling development throughout the region (Brody, Highfield, and Kang 2011).
Houston is also famous for its lack of planning and poor coordination of the planning process. The city adopted its first comprehensive plan in 2015, but it lacks specificity and the land use components typical of most comprehensive plans (City of Houston 2015 [Plan Houston]). An underdeveloped comprehensive plan and no zoning code pose a challenge for coordination across actors and sectors critical for hazard mitigation, such as planning, flood control, and transportation. Houston’s Department of Planning and Development guides land development, while flood infrastructure is managed by the Harris County Flood Control District (HCFCD). Without strong planning and regulations to guide these organizations, it is important to examine the coordination of the multiple actors engaged in flood mitigation and planning. The combination of vulnerability to and political action around flooding, as well as an apparent disconnect between planning and flood mitigation, makes Houston an appropriate location in which to test this novel approach of mapping and jointly evaluating collaboration and planning networks. The context provides reason to expect a degree of mismatch between the networks; revealing this and providing empirical data regarding its form will serve to validate the method and act as a proof-of-concept and baseline for future analyses.
Methodology—SNA
This paper uses SNA to highlight the extent to which organizations are interconnected in flood mitigation and planning efforts. In SNA, networks comprise actors, individuals, or organizations that are tied together by some predefined relationship. In this study, network actors are organizations involved in planning and hazard mitigation. The multiple actors and ties create a larger social structure that can be analyzed for structural patterns among the actors involved. The benefit of using SNA is that it clearly highlights which organizations are playing important roles in the network. Identifying the most central organizations is an important part of capturing the extent of an organization’s involvement in the larger planning and mitigation processes that occur in a given geographic area. Our two networks comprise organizations involved in hazard mitigation and organizations involved in planning processes.
We focus on three specific measures from the SNA literature: degree, betweenness centrality, and density. (A more detailed description of the network measures and their equations is available in Appendix B.) Each measure captures unique aspects of network connectivity. Degree serves as a measure of general connectivity to the overall network. It represents the total number of ties each actor has to other actors. In this study, a network actor is an organization involved in planning or hazard mitigation. Betweenness centrality is often used as a proxy for boundary spanning (Li et al. 2020; Lyles 2015). It is measured as the total number of times an actor falls on the shortest path between every pair of nodes in the overall network. In other words, it is the number of times two actors need the focal actor (whose centrality is being measured) in order to be connected (Borgatti 2005). This is important in hazard mitigation and planning networks because those organizations located between numerous other pairs of actors may have access to unique and important information to reduce vulnerability. Finally, density measures the extent to which an actor’s connections or ties are connected to each other. Density may act as a double-edged sword in hazard mitigation networks because while closely connected networks may offer the optimal structure for fine-grained information to be transmitted through the network (Podolny 2001), they may also run the risk of circulating and recirculating redundant information (Aral and Van Alstyne 2011; Burt 1992; Phelps, Heidl, and Wadhwa 2012). Dense networks will be less disrupted by the loss of actors, whereas a weakly connected network may be susceptible to fragmentation if actors leave the network.
Network Overlap—Methodological Considerations
A key contribution of this paper is examining the overlap of the two networks. There are several means to examine the underlying structure of networks (see Faust and Skvoretz 2002). Existing methods of network comparison are typically carried out in one of two methods. The first involves examining multiple relations across one set of actors. This is characteristic when examining change over time in a given network. Another method focuses on the structural networks across dissimilar sets of actors. Here, the underlying network structures are analyzed and compared, while other descriptive information about the nodes and ties is largely ignored.
The methods used in this paper are a hybrid of the methods mentioned above. We examine network characteristics and structures of similar sets of organizations involved (though not an identical set) in two distinct networks that affect flood vulnerability. Put differently, we look at both the organizations involved and metrics or indicators of involvement in both networks. We define network overlap as the extent to which an organization appears in both the collaboration network and the plan network.
Focusing on the connectivity of specific organizations in the network, as opposed to the underlying network structure, is advantageous in this analysis for a number of reasons. First, because of the small number of identifiable organizations, focusing on specific organizations involved in both networks provides more useful data than focusing on characteristics of the underlying network structure. Second, while it is important to know which organizations are involved in both networks, it is equally important to know which are not involved. The absence of organizations in one or another network will provide information about potential gaps in flood mitigation or planning processes. In summary, we focus on a network comparison of organizations rather than overall structures because information about the organizations involved in hazard mitigation provides detail about collaboration in the planning process.
Data: Collaboration and Planning Networks
To examine the collaboration network of stakeholders in the Greater Houston area, we administered a survey to ascertain the level of involvement and collaboration in flood mitigation efforts prior to Hurricane Harvey. Among other things, the survey asked about the frequency of collaborations, with options ranging from daily to annually. In this paper, we focus on weekly and monthly collaboration efforts. The survey was sent to the senior-most employee or representative at each organization and was in the field between February and April 2018. It includes responses from 160 organizations involved in hazard mitigation in Houston, TX. The question used to derive the network asked: “prior to Hurricane Harvey, did you, or another employee from your organization, collaborate or work directly with any individual from the organizations listed below on flood mitigation efforts?” We then provided a list of just under hundred organizations that have been involved in hazard and flood mitigation in the Houston area. In addition to the list of organizations, we provided space for the survey respondent to write in any organization that may have been omitted from the roster of organizations in the survey.
The network is created from the organizations’ responses about the frequency of collaboration. The network is undirected and symmetrized. In other words, if organization A states that they had monthly collaboration with organization B, there is a tie connecting those organizations at the monthly frequency. We assume one organization’s statement of collaboration as reciprocated between the organizations. 1
The collaboration network was originally in a two-mode 2 format, where survey respondents are tied to organizations listed in the survey. We use the bimodal transformation (Borgatti 2009), which converts the original rectangular matrix into a square matrix that maintains both sets of actors—those who received a survey and those listed in the survey. The bimodal approach analyzes both sets of network actors simultaneously. In this instance, the bimodal transformation is preferable because it identifies key nodes, relationships, and clusters consisting of actors from both the organizations listed in the survey and the organizations completing the survey. 3
To build the planning network, we collected planning participants and implementation partners from ten regional and city plans (listed in Table A1 in Appendix A). Planning participants refer to the organizations listed as involved in creating the plan, such as the plan steering or stakeholder committee. Implementation partners are the organizations listed within a plan as responsible for implementing its vision or strategies. Organizations not listed in the plans are not included in the planning network. It is important to note that we focus exclusively on organizations involved in planning, and not broader public participation techniques to engage residents. While public participation is an important predictor of plan outcomes and varies across plans in our study, we focus on organizations. Since a primary driver of this research was to explore fragmentation across sectors that influence flood vulnerability, organizations that control resources and development processes are a better fit for our study. Organizations also better match the data produced by the stakeholder survey that solicited information about collaboration at the organizational level. The plans we analyzed include a wide variety of different types of organizations: city agencies, business associations, environmental nonprofits, and universities. These different organizations capture the differing perspectives and interest of residents.
We included all plans developed by regional and city agencies that will affect physical vulnerability to flooding in the Houston area. Our sample includes plans developed by key regional government organizations such as the Houston-Galveston Area Council (H-GAC), the metropolitan planning organization for the region, Harris County, and the City of Houston. These entities have unique but overlapping jurisdictional areas. In addition to plans created by government agencies, our sample includes several plans developed by coalitions of stakeholders. For example, “Houston Stronger” is a regional flood infrastructure plan created by a coalition of Harris County civic groups, businesses and business associations, and environmental organizations. Similarly, the “Gulf-Houston Regional Conservation Plan” was created by an alliance of businesses, environmental, and government organizations. These plans demonstrate the importance of nongovernmental organizations (NGOs) and coalitions in the Houston region, as well as the contention over the area’s future development and flood mitigation projects. Our sample of plans also represents different planning domains, including comprehensive planning, hazard mitigation, transportation, and parks and conservation.
The plans vary in the level of direction they provide for future development. On one extreme, “Plan Houston” merely provides a vision for Houston, with few implementable policies. The goal of the planning process was to build broad consensus on the direction of the city and to encourage coordination and partnerships. Over seventy-five different organizations were recognized as participating in the planning process—the most of any plan in the sample—but no organizations are designated as responsible for implementation. On the opposite end of the spectrum, the “Harris County Flood Control District Federal Briefing” and “2017-2020 Transportation Improvement Plan” both focus on specific projects, providing extensive details on funding, timelines, and implementation responsibilities. The Regional Transportation Plan and complementary Transportation Improvement Plan are still participatory processes, with twenty-three organizations identified as involved in the planning and forty-four identified as responsible for implementation. The HCFCD Federal Briefing is more of a “technocratic” plan, with no stakeholders included in the planning process and only five implementation partners (see Table A1 in Appendix A for the number of participants and implementation partners for each plan).
For the plan network, we use a unimodal transformation. Initially, the plan network was a two-mode network comprising plans and organizations listed in those plans. A tie existed when the organization was listed in the plan. Because the focus of this paper is the link between organizations, the unimodal transformation results in an organization-to-organization network (Borgatti 2009) where the tie between organizations suggests that both organizations were listed in the same plan. The network comprises organizations listed as implementation partners and planning participants in the plans, and the tie represents the co-occurrence in each individual plan. The ties are valued, meaning that if the value between two nodes is a 5, those two organizations would have been listed together in five plans.
Results
Planning Network
We first examine the primary and central organizations of each individual network, beginning with the planning network, and then explicitly examine the overlap of both networks. The network outputs are available in Tables 1 through 6, with the plan network in Tables 1 and 2. Visualizations of the network are presented in Figures 1 through 3. The ten most connected (by degree centrality) organizations in the planning network, numbered 1 to 10 in Figure 1, are comprised mostly of city and county governmental agencies. The high connectivity of governmental agencies is expected since planning is primarily the responsibility of local government. The high connectivity of government agencies may allow them to disseminate resources, such as information, through a broader network.
Plan Network Organizations and Metrics.

Plan Network Density.

Note: Density high and low = 1.00 and 0.25. H-GAC = Houston-Galveston Area Council.
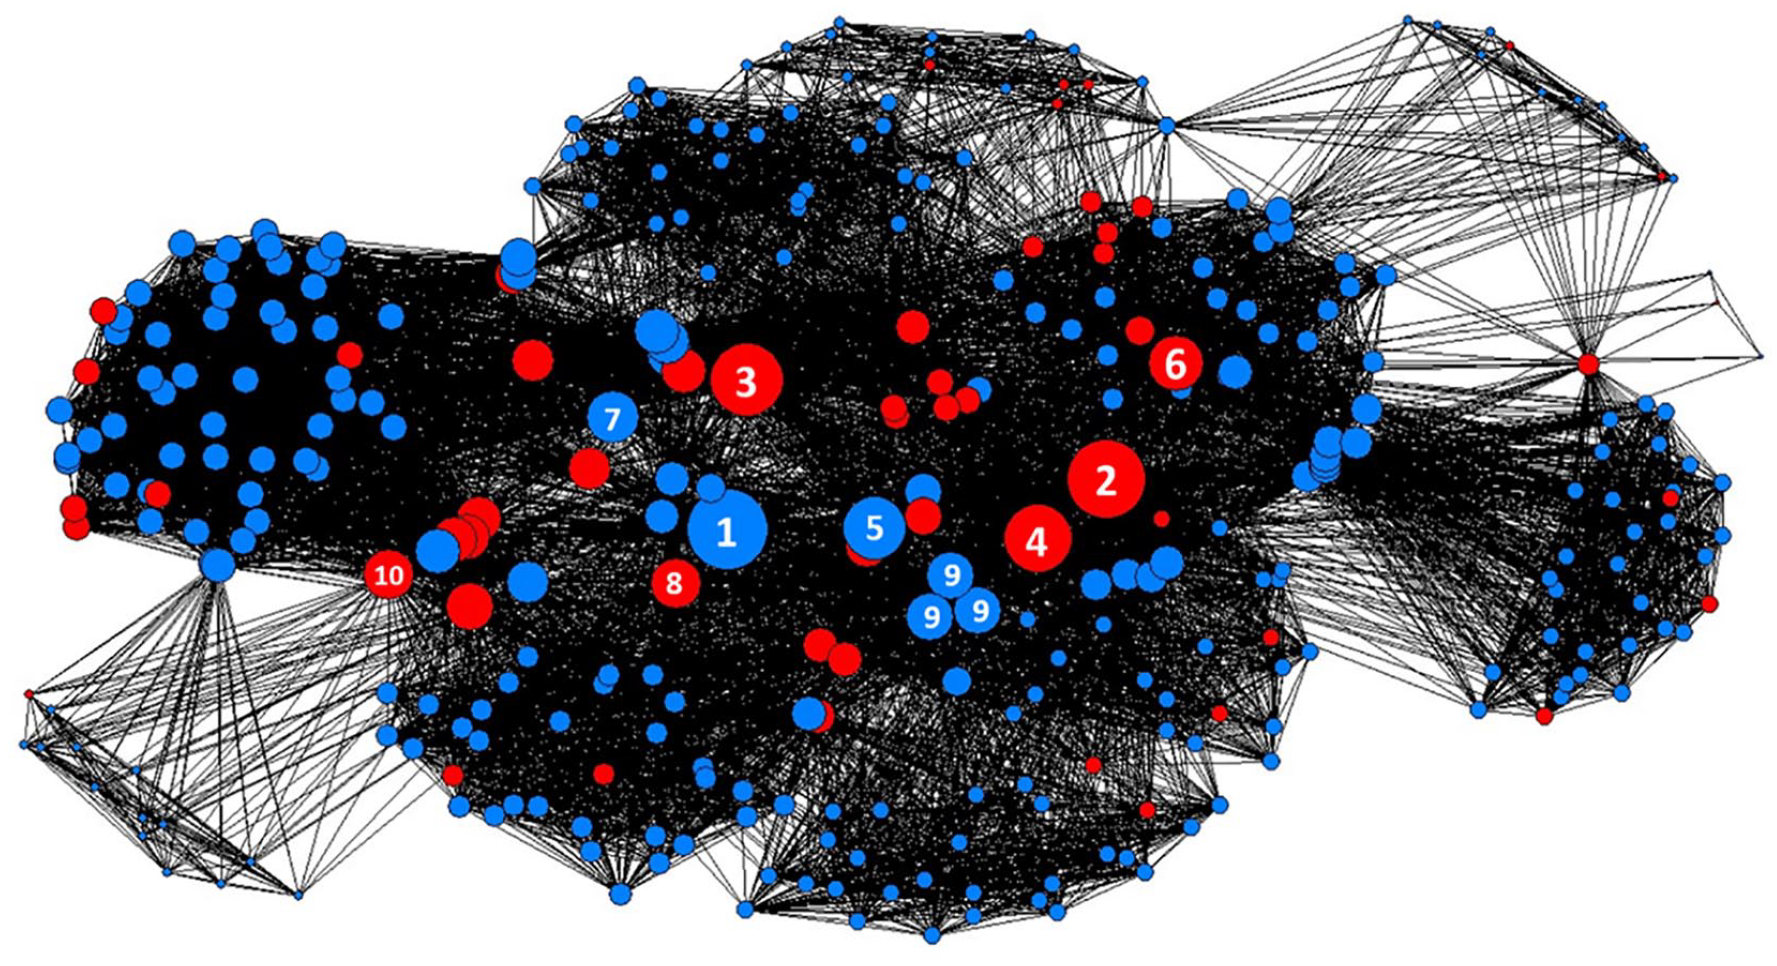
Planning network with nodes sized by degree centrality.
Stakeholder monthly communication.
Stakeholder weekly communication.
As shown in Table 1, the rank of the organizational centrality scores is similar. 4 Indeed, results are practically identical regarding the organizations involved, although the order differs slightly. Recall, betweenness measures how many times the organization falls on the shortest path between every other pair of organizations. In the planning context, organizations with high betweenness scores are in structural locations to bring diverse parties to the table and facilitate information flow across the network. It is appropriate and encouraging that local governments are among those with the highest betweenness scores. Three environmental NGOs—Houston Parks Board, Buffalo Bayou Partnership, and Houston Wilderness—are also represented among the most connected organizations. These organizations are active environmental stewards: they advocate for, plan, and actively manage parks and open space in Houston.
We next examine the density scores of the planning network organizations, located in Table 2. Density is a measure of the connectedness of the focal actors’ ties. Organizations with high density scores are embedded in a tight-knit or well-connected clique. This is demonstrated in Figure 1 by the tight groups of organizations around the boundary of the network. Organizations with low density are clustered in the center of Figure 1 and are connected to organizations that may otherwise be disconnected from each other. The plan network is a relatively densely connected graph, although there are examples of low-density actors discussed below. The direct interpretation of density in the plan network suggests that organizations with high density are listed in a small number of plans and engage with the same set of organizations. Results show that 273 organizations are listed in only one plan, meaning they have a density of 1. Conversely, organizations with low density are those listed in multiple plans with multiple other organizations. The implications of this is that organizations with low density will be more connected to a diverse number of organizations across the planning network.
Local governmental organizations are shown to have relatively lower levels of density. This is likely favorable for the dissemination of information, which is able to reach various branches or disconnected portions of the global network faster. Environmental organizations also have low density, suggesting that these organizations are participating in multiple planning processes with different types of organizations.
Collaboration Network
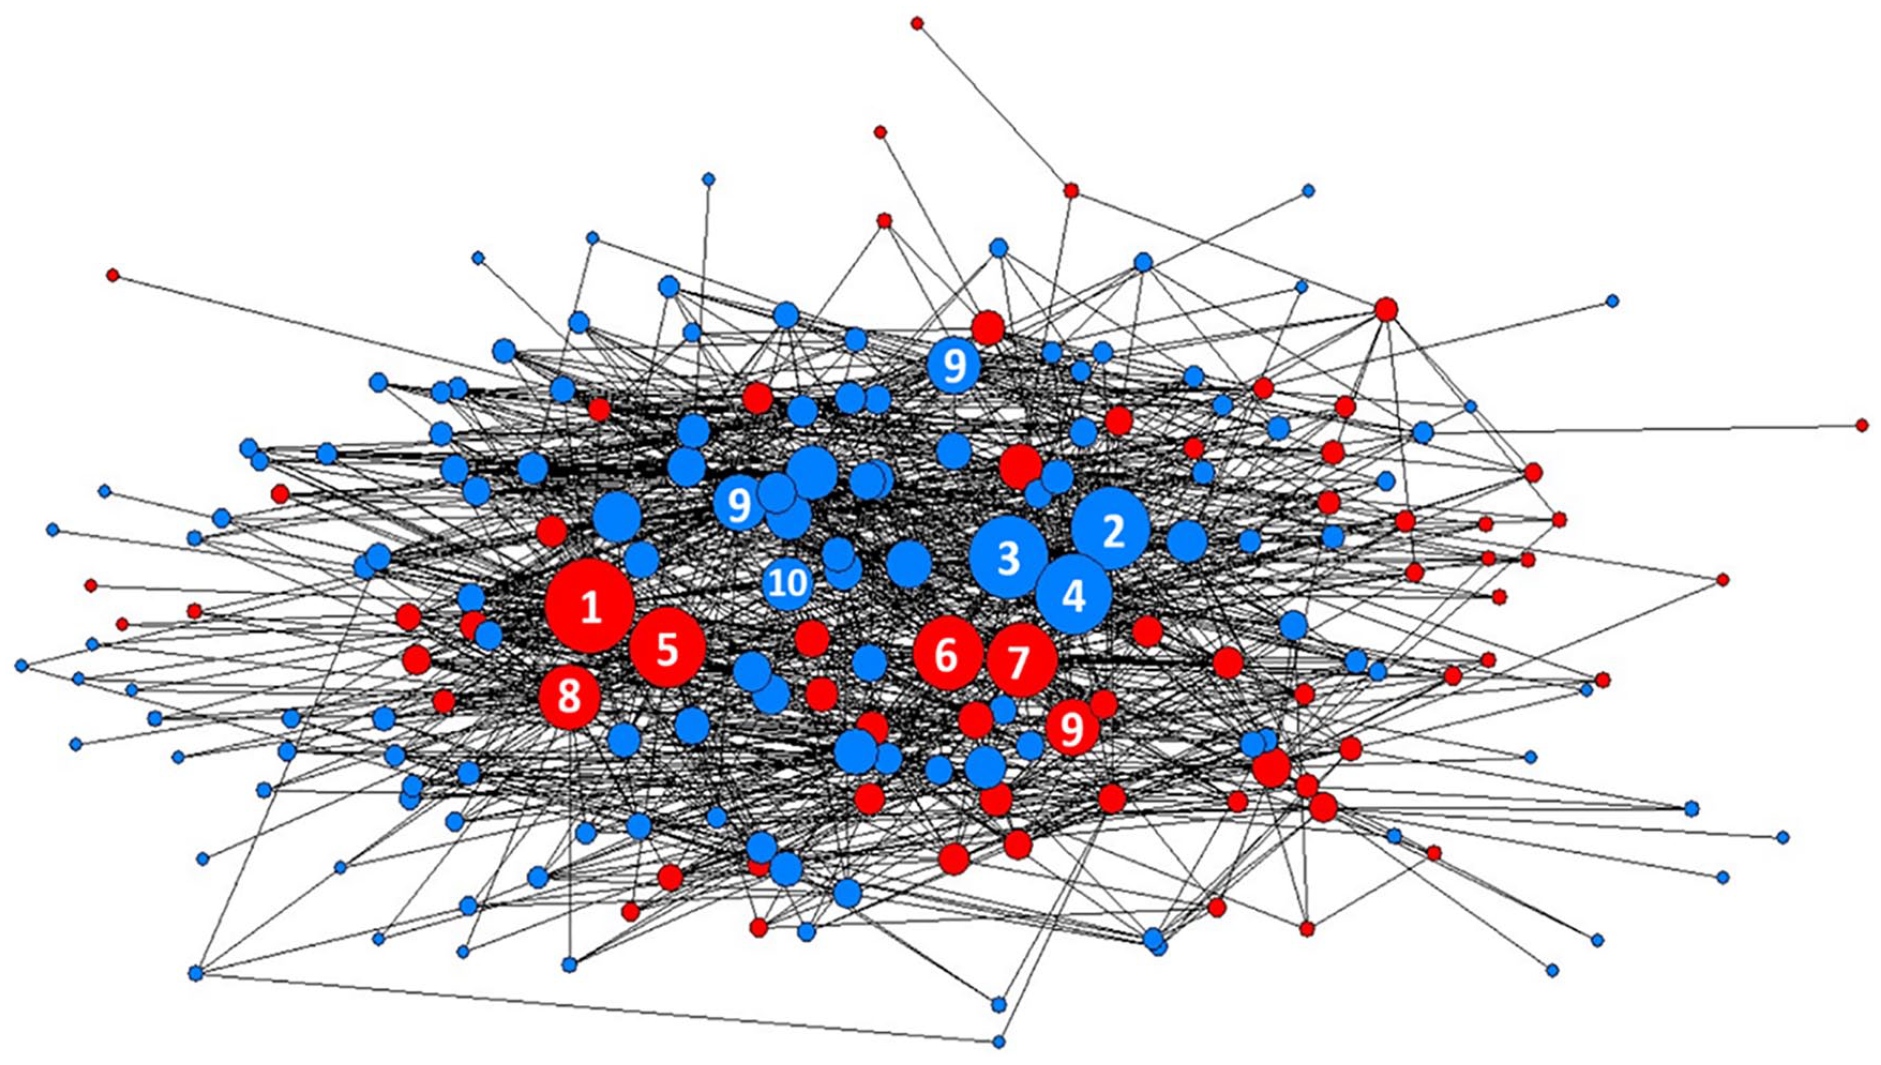
We examine the stakeholder collaboration network at two different collaboration frequencies: weekly and monthly. The monthly network output is available in Tables 3 and 4. The organizations with the highest degree centrality scores, numbered 1 to 10 in Figure 2, are primarily city and county government agencies. Arguably, this is to be expected given that hazard mitigation is often coordinated and carried out by municipal and county governmental agencies. It is notable that the H-GAC, the region’s metropolitan planning organization, is represented among the most connected organizations (numbers 3, 4, and 9 in Figure 2). Metropolitan planning organizations are central in planning and funding regional transportation but are not traditionally leaders of hazard mitigation. Regional organizations, however, can play an important role in coordinating multijurisdictional efforts.
Monthly Collaboration Network Organizations and Metrics.

Note: Degree high and low = 59 and 1. Betweenness high and low = 2,506 and 0. H-GAC = Houston-Galveston Area Council.
Monthly Collaboration Network Density.

Note: Density high and low = 1.00 and 0.63. H-GAC = Houston-Galveston Area Council.
The organizations with the highest degree centrality in the stakeholder monthly collaboration network are similar to those listed in the plan network. These consist primarily of governmental organizations, but with greater representation of governmental agencies dedicated to emergency management, such as the Harris County Office of Emergency Management, and agencies that would be responsible for infrastructural responsibilities, such as the Harris County Engineering Department. It is notable that environmental organizations that appear to play a central role in the planning network are less represented in the collaboration network. Similar to the plan network, the organizations with relatively higher betweenness centrality are the same organizations with high degree centrality. Again, this is expected.
The collaboration network monthly density measures are presented in Table 4. 5 A variety of regional agency offices represent those with the lowest density. 6 These organizations occupy an important structural location in the network, connecting organizations that may otherwise remain disconnected. To further illustrate, this network location implies that in the instance that the organization is removed from the network, the organizations that are tied to the removed organization would no longer be indirectly connected to each other. A gap, or hole, in the network would exist in its place. The relatively high density of the several emergency preparedness organizations in the monthly collaboration network may prove useful at rapidly disseminating information within the group, but may experience challenges when trying to move that information to the larger network (Ahuja 2000; Burt 1992). These results may suggest that emergency management and preparedness organizations, which are responsible for disaster response, are not well positioned for predisaster mitigation that requires collaboration of a larger, more diverse network. On the occasion that the clique must quickly and efficiently mobilize or respond to a hazard, however, this network formation may provide useful and efficient resources to the group as they are densely connected to each other.
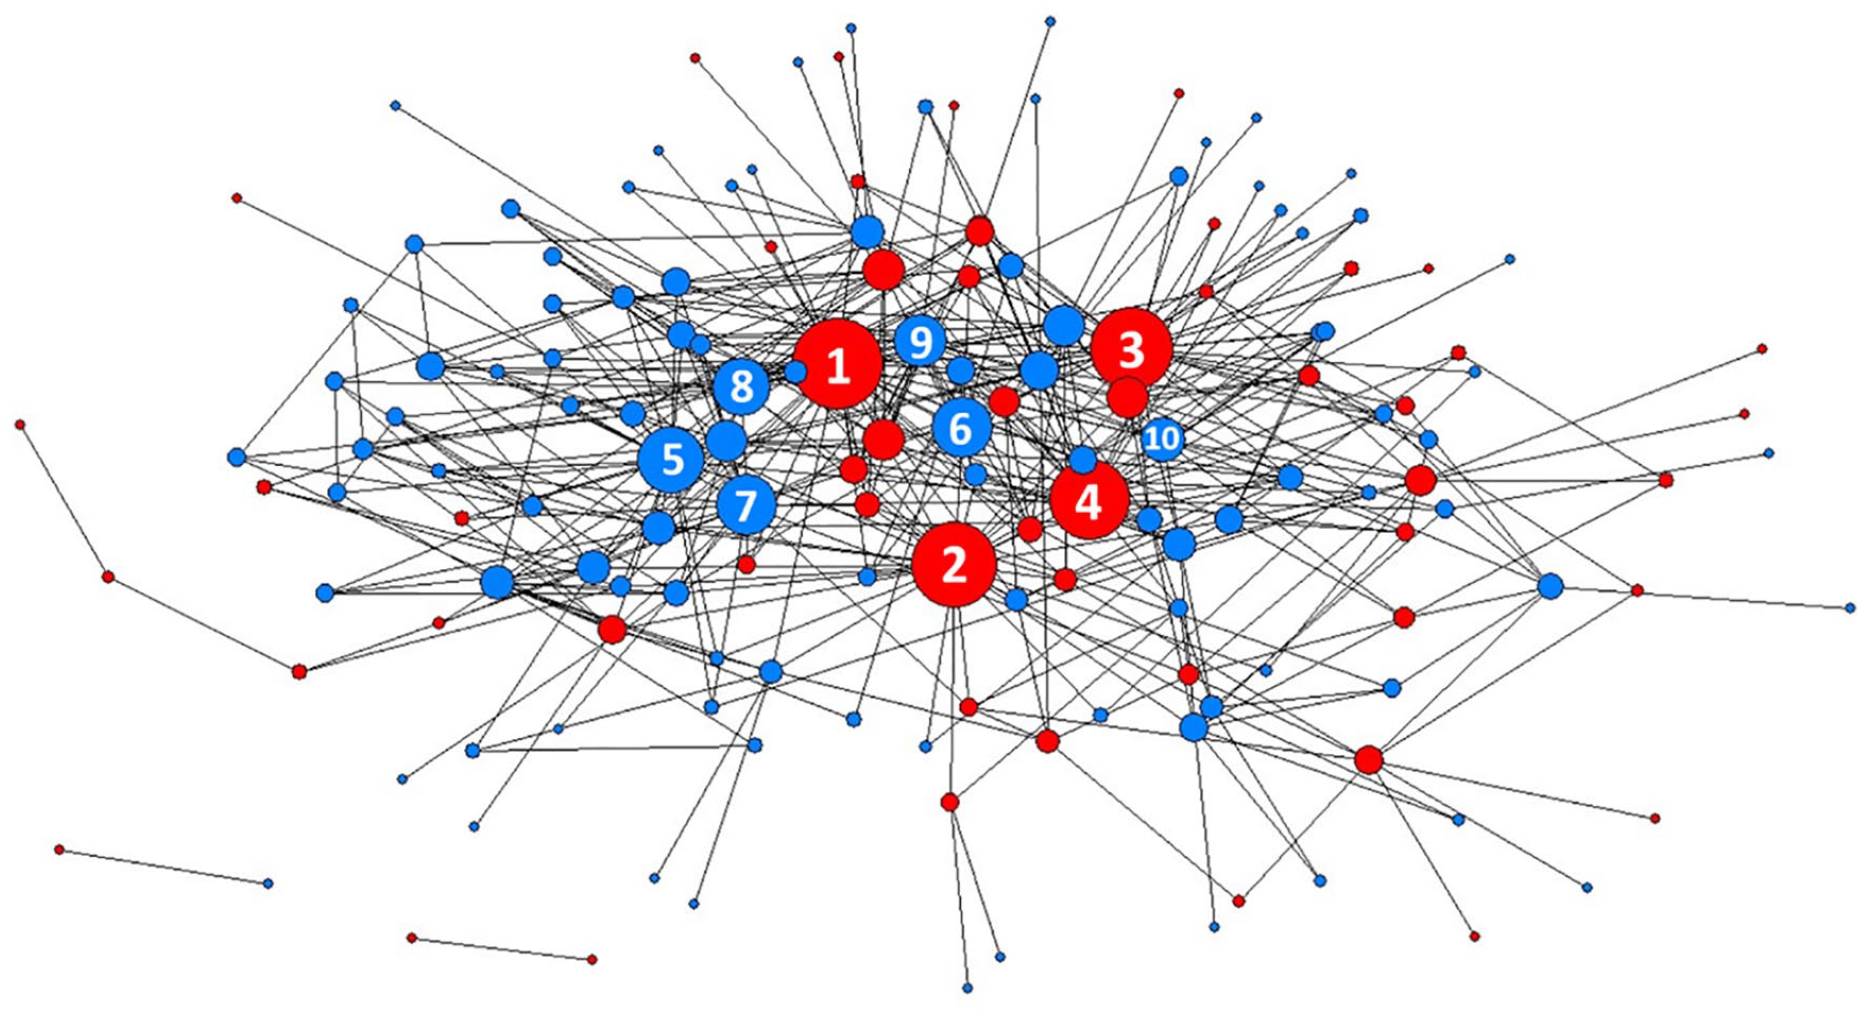
Finally, the results for the stakeholder weekly network are presented in Tables 5 and 6. The weekly collaboration network consists generally of those organizations whose primary role is hazard mitigation. The two organizations with the highest degree centrality and betweenness are HCFCD and Harris County Office of Homeland Security and Emergency Management. HCFCD is responsible for planning, implementing, and maintaining flood control infrastructure in the county, while the County Office of Homeland Security and Emergency management is responsible for hazard mitigation planning and is the lead agency for disaster preparedness. Many of the most connected organizations, such as the Harris County Engineering Department and the City of Houston Department of Public Works & Engineering, would be involved in the implementation of mitigation projects. Again, the H-GAC and its various offices are among the most connected organizations; the H-GAC Community and Environmental Planning Department oversees community investment grants, and the H-GAC Public Services Department assists local government in the development and coordination of emergency communications. It is also important to recognize that the Texas Department of Transportation (TxDOT) emerges as a central actor in the weekly collaboration network. The involvement of TxDOT highlights the important link between transportation and hazard mitigation in the Houston area.
Weekly Collaboration Network Organizations and Metrics.

Note: Degree high and low = 36 and 1. Betweenness high and low = 2,339 and 0. H-GAC = Houston-Galveston Area Council.
Weekly Collaboration Network Density.

Note: Density high and low = 1.00 and 0.47. H-GAC = Houston-Galveston Area Council.
Density measures for the weekly collaboration network, found in Table 6, show that city and county agencies have relatively lower density, implying that they may be connected to otherwise disconnected segments of the network. As stated above, this structural location may facilitate collaboration and dispersal of information (Granovetter 1973). An ideal typical low-density example would imply that a single actor is very important to the cohesion of the immediate network. If the actor was removed, the network would dissipate. There appears to be little rationale to the organizations that have high density values. These organizations range from budgetary and economic agencies to transportation and emergency response agencies. Empirically, these organizations may be involved in a specific project or task force that requires frequent communication within the group, but whose collaboration infrequently extends beyond the group.
Network Overlap
We next examine the organizational overlap in both networks, by which we refer to those organizations listed in the plans that also appear in the monthly or weekly collaboration network. The organizations with a check mark by their names in the Tables are overlapping organizations with high network metrics or the most connected organizations. A full list of overlapping organizations is located in Table A2 in Appendix B.
There is a wide variety of overlapping organizations in the two networks. Ultimately, this is encouraging, as greater overlap in agencies and organizations suggests greater coordination between planning and mitigation. The overlapping organizations include regional governmental agencies, such as the City of Houston and Harris County governments; governmental agencies that deal specifically with hazards and disasters, such as the HCFCD; environmentally focused NGOs, such as Houston Wilderness and The Nature Conservancy; as well as real estate and construction groups.
The connectivity of the overlapping organizations varies dramatically as well. As seen in Figure 4, the levels of connectivity across all networks and each network measure range from virtually the lowest possible value to the highest (or near the highest). The similar trends for each network metric across different network types provide evidence of the broad levels of connectivity of the overlapping organizations.
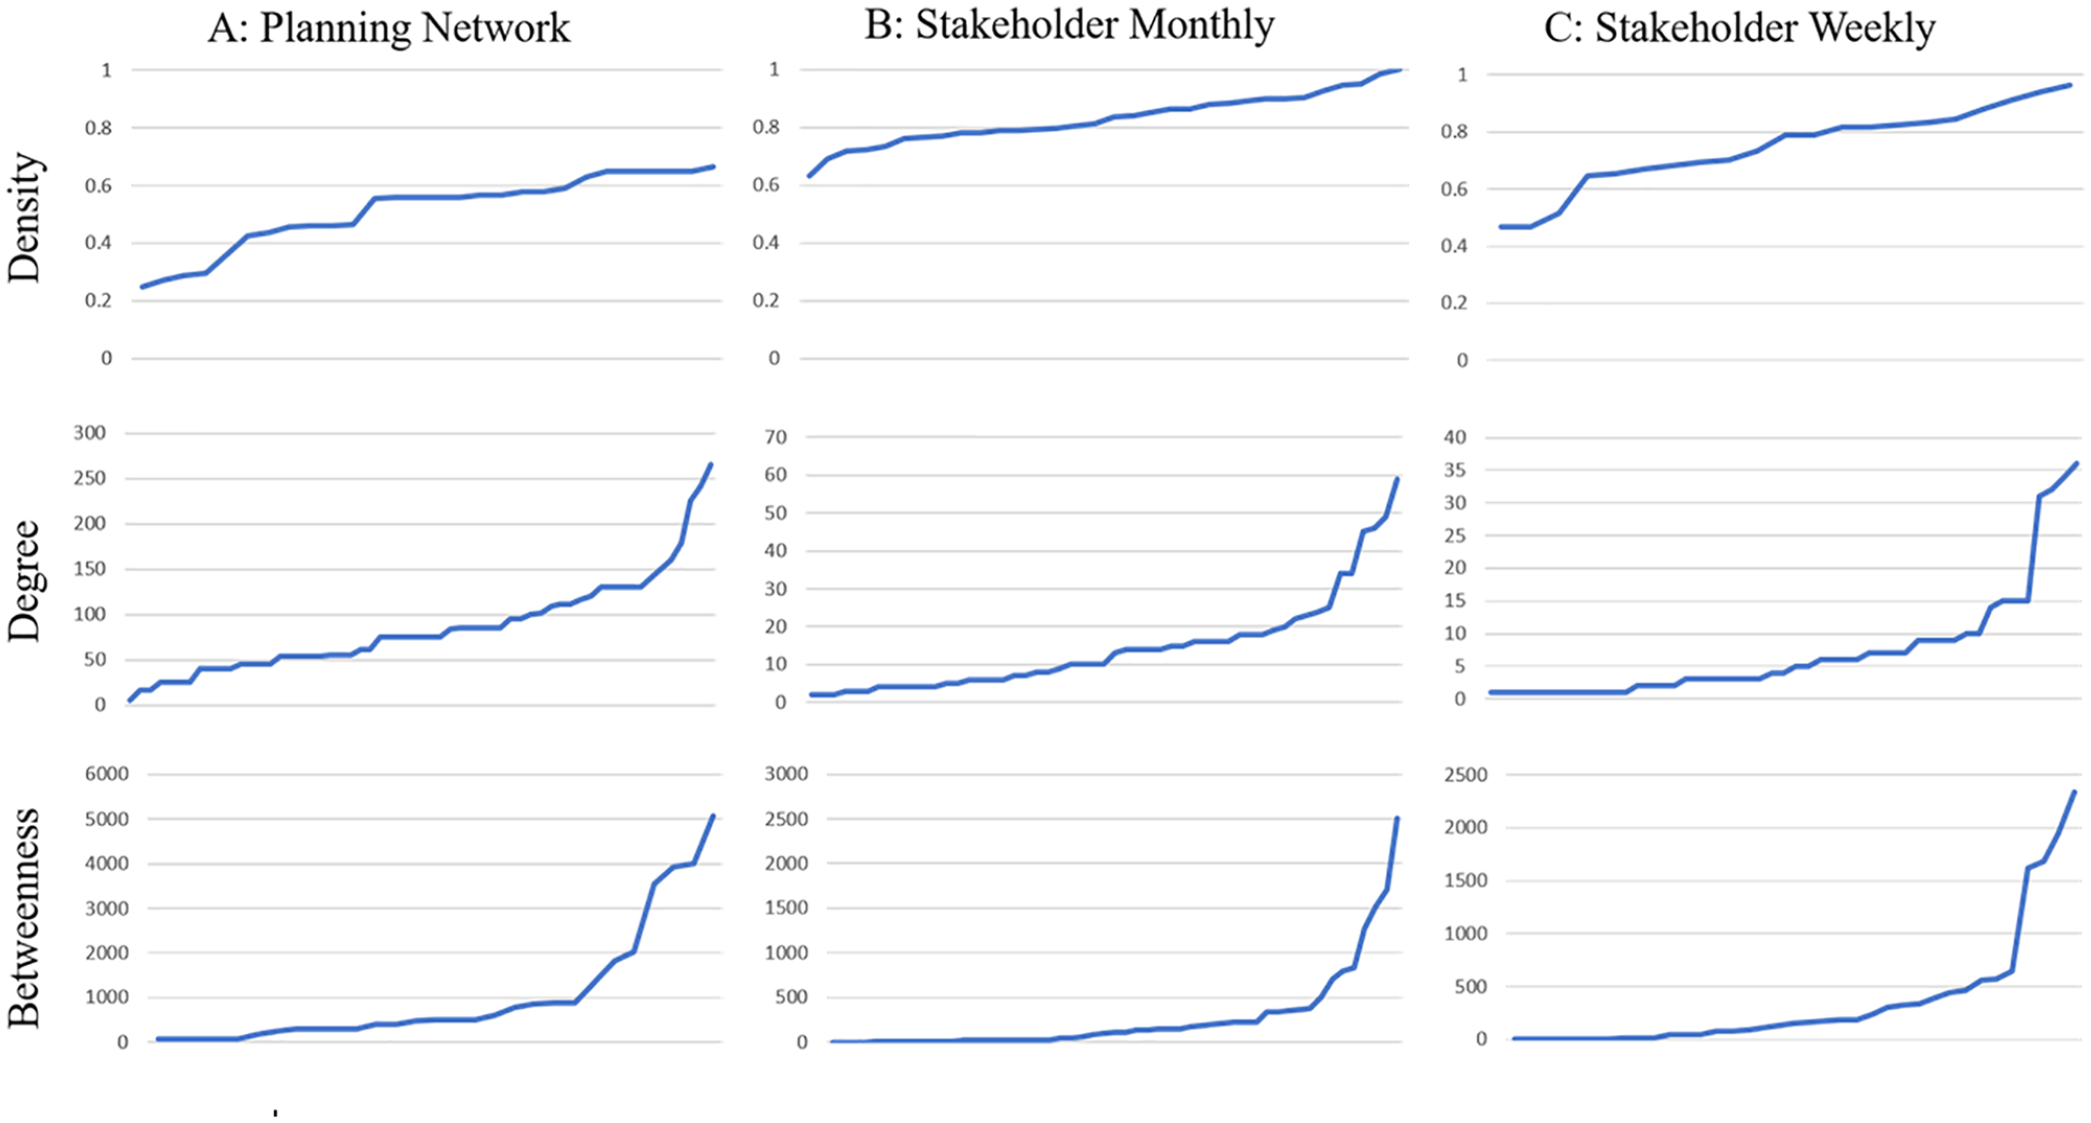
Overlapping organizations arrayed by increasing order and network measure.
There are several overlapping organizations that are, arguably, important or essential to hazard mitigation. The City of Houston, Harris County, and the HCFCD are consistently connected across the different networks. These highly connected organizations are also connected to disparate, or otherwise disconnected, segments of the network. Therefore, they may play a critical role in connecting with a larger proportion of the network and increased efficiency in disseminating information. One of the most consistently well-connected and densely connected government agencies is the HCFCD. The HCFCD is a special purpose district created by the Texas Legislature in 1937 in response to devastating floods that struck the region in 1929 and 1935. The District’s mission is to (1) devise flood damage reduction plans, (2) implement the plans, and (3) maintain the infrastructure (2017 HCFCD Federal Briefing). The HCFCD maintains an extensive network of drainage and flood control infrastructure, including more than 1,500 channels totaling about 2,500 miles in length (about the distance from Los Angeles to New York) and more than 200 stormwater detention basins (9,156 acres) (2017 HCFCD Federal Briefing).
While HCFCD is responsible for planning, implementing, and maintaining flood control infrastructure, it does not administer floodplain regulation in Harris County or the City of Houston. This requires close coordination between the district and agencies responsible for floodplain regulation, such as the Harris County Public Infrastructure Department (Harris County Hazard Mitigation Plan).
In addition to reducing flood impacts, a secondary goal of HCFCD is to enhance recreation, open space, and environmental preservation through District facilities (2017 HCFCD Federal Briefing). Consequently, HCFCD is an important partner for organizations pursuing these goals. For example, HCFCD was a participant and implementing partner in the Gulf-Houston Regional Conservation Plan, which seeks to protect remaining habitat in the region and improve water quality. Many of the policies in the plan focus on protecting floodplains and wetlands—areas HCFCD owns or is targeting for acquisition. Similarly, City of Houston’s (2015) Parks Master Plan suggests partnering with HCFCD to create multiuse trails along bayous that HCFCD maintains.
Houston Wilderness is also among the most connected organizations in both the plan and collaboration network. Houston Wilderness is a coalition of business, environmental, and government interests that works to conserve biodiversity in the greater Houston region. Houston Wilderness led the development of the Gulf-Houston Regional Conservation Plan, which sets ambitious conservation goals and serves as a database of member organizations’ conservation projects. In this way, the plan serves to coordinate projects of the multiple parties involved, which can then be mobilized to reduce vulnerability to hazards and disasters (Feiock 2013; Shrestha 2018).
Discussion
There are several important takeaways from the results presented above. Generally, the results suggest that the planning and collaboration networks are relatively well populated and demonstrate various levels of connectivity among the organizations involved. The overlap, however, suggests that there is much room for improvement and the two distinct networks are not as well integrated as they could be. Of particular importance is the lack of overlap of planning agencies, as discussed below. While further research is needed, the lack of integration and coordination across networks may suggest that Houston is not well prepared to plan and respond to flood disasters.
There are numerous organizations that are present in the collaboration network that are not present in the planning network. Private organizations and NGOs involved in mitigation efforts are included only on the fringes in the planning network if they are involved at all. These organizations may have important information about how plans are executed before and during hazards. Although their reduced presence in the networks in this study may be an artifact of the data collection method, engaging them in the planning process could help reduce future risk to disasters.
Conversely, some environmental organizations that play a central role in the planning network are not as central in the collaboration network. The absence of environmental organizations, like Buffalo Bayou Partnership and Houston Wilderness, in central locations in the collaboration network suggests that there are opportunities to better leverage open space and parks for hazard mitigation purposes. Preserving floodplains as parks and open space can prevent development in risky locations, as well as provide stormwater management and protective services.
Two additional outcomes of the overlap analysis are worthy of mention, the first being the absence of specific planning departments from the networks. Within all networks, only ten planning organizations are mentioned—and in no network do planning organizations take a predominantly central or well-connected role. While there are many factors that go into developing plans, the lack of planning agencies centrally involved may contribute to development in hazardous areas such as floodplains. As discussed below, it is possible that the plans mention larger organizations, even though it is planning agencies that are involved. A limitation of this current method is that it relies solely on the information provided in the plans and treats all involvement as equal. Further analysis and ethnographic extensions of this work can divulge additional information about the different levels of involvement and offer improvements to the methods used here.
Organizations involved in emergency management, preparedness, and response have high density values in the monthly collaboration network. Essentially, the high density suggests that all organizations in the network are closely connected to each other. This tight-knit clique creates a double-edged sword for hazard mitigation. Literature suggests that densely connected groups share important fine-grained information more readily than sparsely connected cliques. However, a tight-knit group naturally establishes boundaries which may impede reaching out in times of need and creating an inclusive environment for other organizations to access resources from these organizations (Ahuja 2000).
Plans tend to identify governments as participants and implementers (e.g., H-GAC), while the collaboration network identifies specific divisions or agencies of these larger organization (e.g., H-GAC Community and Environmental Planning). The reference of the government rather than specific agencies may explain the absence of planning organizations. Although this may be an artifact of the data collection process, it may be beneficial for plans to include individual agencies within larger government organizations. Smaller agencies or departments charged with specific tasks may provide valuable resources and specialized knowledge that could be beneficial to the planning processes and mitigation organizations in ways that larger organizations (or higher level administrators within those organizations) may be unable.
These results also carry important implications for smaller and less well-connected, or peripheral, organizations. The most important may be with regard to building and cultivating relationships with important actors. Specifically, if there is no direct relationship between smaller organizations and larger, more centrally connected organizations, the smaller organizations would do well to work strategically to build the relationship. As connectedness and the relationship develop between the organizations, smaller organizations can influence the policymaking and planning process through those contacts, and can more effectively receive useful information, in return.
Hazard mitigation has been termed “policy without a public” because of the traditional lack of public interest in the topic (Burby 2006). In contrast, our work suggests high levels of involvement of nongovernmental stakeholders. Advocacy organizations like Houston Stronger, which formed a Political Action Committee (PAC) that successfully advocated for the passage of a $2.5 billion bond in 2019 to invest in flood control projects across Harris County, demonstrate an invested (and perhaps growing) interest in flood mitigation. The Houston region may be somewhat unique with its widespread exposure to flooding and significant investments in flood mitigation (and relatively weak government), but it may also prove to be a harbinger as flooding is exacerbated in many places due to climate change. In either case, our results highlight the important role of nonprofits and interest groups in planning and flood mitigation.
Conclusion
This paper contributes to the literature on planning networks in a number of ways. While previous works have examined the organizations involved in a single plan, our paper builds on this literature by examining all major plans in a regional context. As a result, we provide a methodological example of how network analysis might be used to more fully understand the interaction of planning agencies and organizations beyond a single plan. It is clear that incorporating SNA methods to more fully understand planning networks and organizational involvement in mitigation collaboration is worthwhile and will produce important and relevant findings. Our work further highlights the complex governance arrangements around hazard mitigation and planning. City, county, and regional governmental organizations are central actors in all the networks, demonstrating multilevel governance arrangements. It is particularly important to note the large role that H-GAC, the metropolitan planning organization for the region, plays in all networks analyzed.
The methodology used here highlights the interactions between organizations involved in the planning and mitigation networks. Examining characteristics of organization connectivity in distinct networks provides researchers and practitioners a way of highlighting which organizations are involved in hazard mitigation and planning networks and which are not. This has important implications for how plans are carried out and by whom, as well as highlights which organizations are not connected that perhaps should be. Collaborative planning and engaging diverse stakeholders are thought to produce better plans. Combining SNA of plans with plan analysis offers the opportunity to test and evaluate theories around collaborative planning. Ultimately, further developing this method promises to provide a wealth of information about planning processes, planning equity, and desired outcomes in hazard mitigation efforts.
As is typical to exploratory research, there are several limitations of this work that can motivate future research. This analysis, for example, omits numerous attributes of the organizations in the structural network analysis. Working with attributes in the network analysis will result in specific network outcomes according to individual organizational characteristics. The network characteristics of organizational collaboration may inform policy makers on strategies and mechanisms to increase planning involvement with the goal of reducing vulnerability to hazards and disasters. Another limitation is that we do not address the role of residents and public participation. Residents play an important role in both planning and hazard mitigation. In Houston, regulations to restrict development in the hundred-year floodplain were rescinded due to political and legal pressure from homeowners in the floodplain (Marcano, Festa, and Shelton 2017). Future research should more fully address the role of residents in shaping plans and mitigation efforts. Finally, as with other network studies derived from survey responses, we cannot claim to have captured every organization and institution involved in a hazard mitigation or planning network. We are confident, however, that our methods allow us to capture salient or core organizations involved. In addition to core organizations, we also captured numerous pendant organizations—those only mentioned once or that collaborated with only one other actor.
Using multiple networks as a method of understanding involvement in hazard mitigation efforts and the planning process introduces additional avenues to extend this line of research—for example, examining the role that regional organizations, which do not typically have authority in hazard mitigation planning, can play in mitigation. Regional organizations, such as H-GAC, with jurisdiction over relatively large areas may provide a more holistic approach to hazard mitigation, compared to organizations with smaller jurisdictions that are often focused more locally. There is also a need to replicate what has been presented here in other cities. Replication in other cities would also provide a way of building theory around which types of organizations play a central role in these processes generally as well as establish a baseline and range of values that can contribute to defining of well-connected and poorly connected networks in this context. Repeating this analysis over time and incorporating an ethnographic perspective would also provide new insights on why and how networks perform and change and whether efforts to increase inclusion in the planning and mitigation processes are effective. An ethnographic perspective would also shed light on the qualitative aspects of the tie. As all ties are not equal in practice, it is important to more fully understand what aspects of ties increase effective relationships.
As results from this paper show, there are several organizations that take a prominent and central role in the collaboration and planning networks. These organizations are charged with carefully coordinating strategies to protect people and property in the instance of a disaster. It is also clear from the findings that there are many organizations that are left out of the planning or who are only tangentially connected. This represents a potential missed opportunity to engage with smaller organizations that may be focused on one geographic area. As a result, some areas may not receive sufficient attention or resources to effectively mitigate hazards. This is particularly important for those individuals and communities at the “periphery” of society. Access to planning coalitions and processes allows those lacking strong ties to prepare and advocate for equitable planning, which may reduce vulnerability to disasters. In correspondence with other plan analysis frameworks, the methods presented in this paper can be used to more fully understand involvement in the planning and mitigation processes. As the ultimate goal to reduce vulnerability to events, future studies in this vein can provide a path forward to more fully understand how coordinated planning efforts reduce the long-term impact of hazards.
Footnotes
Appendix A
All Overlapping Organizations.

| American Planning Association | Houston Advanced Research Center (HARC) |
| Bayou Land Conservancy | Houston Endowment |
| Bayou Preservation Association | Houston Housing Authority |
| Blueprint Houston | Houston Real Estate Council |
| Center for Houston’s Future | Houston Tomorrow |
| City of Houston | Houston Transtar |
| City of Houston Department of Neighborhoods | Houston Wilderness |
| City of Houston General Services Department | Houston-Galveston Area Council |
| City of Houston General Services Department | Katy Prairie Conservancy |
| City of Houston Office of Emergency Management | Local Initiatives Support Corporation |
| City of Houston Parks and Recreation Department | Memorial Management District |
| City of Houston Parks Board | METRO |
| City of Houston Planning & Development Department | Native Prairies Association of Texas |
| City of Houston Planning Commission | Neighborhood Centers, Inc |
| City of Houston Solid Waste Management Department | Port of Houston Authority |
| City of Jersey Village City Management | Rice University |
| Conservation Fund | Super Neighborhood Alliance |
| Ducks Unlimited | Texas A&M University AgriLife Extension Service |
| Economic Alliance of Houston Port Region | Texas A&M University Texas Coastal Watershed Program |
| FEMA Office of Emergency | Texas Medical Center |
| Galveston Bay Foundation | Texas Sea Grant |
| Greater Houston Partnership | The Greater Houston Builders Association |
| Gulf Coast Rail District | The Gulf Coast Economic Development District |
| Harris County | The Nature Conservancy |
| Harris County Fire Marshal’s Office | Trust for Public Land |
| Harris County Flood Control District | Trust for Public Land |
| Harris County Office of Homeland Security and Emergency Management | United Way of Greater Houston |
| Harris County Toll Road Authority | Urban Land Institute |
| H-GAC Transportation Policy Council |
Note: H-GAC = Houston-Galveston Area Council; FEMA = Federal Emergency Management Agency.
Appendix B
Acknowledgements
The authors would like to thank Ali Mostafavi, Phil Berke, Arnold Vedlitz, Baiherula Abula, Shangjia Dong, and Qingchun Li for their contributions to data collection and overall project guidance.
Declaration of Conflicting Interests
The author(s) declared no potential conflicts of interest with respect to the research, authorship, and/or publication of this article.
Funding
The author(s) disclosed receipt of the following financial support for the research, authorship, and/or publication of this article: This material is based upon work supported by the National Science Foundation under Grant Award Numbers 1760258 and 1832662.
Disclaimer
Any opinions and conclusions expressed herein are those of the authors and do not necessarily reflect the views of the U.S. Census Bureau. This work was mostly or entirely completed while Dr. Bryce Hannibal was employed at Texas A&M University.