
Abstract
This research examines the impact of light rail stations on housing market by analyzing the 1993–2013 single-family home sale transactions in the City of Los Angeles, California. The study period was divided into seven 3-year periods, and the area was divided into three different groups by income level: low-, middle-, and high-income. The result shows that the opening of light railways increased property values in general. It also revealed the differentiated impacts by neighborhood income levels.
Keywords
Introduction
Light rail transit systems, as desired destinations and regional access points, improve access to employment, fight congestion, promote healthy living, reduce the carbon footprint of travel, and bring various other societal benefits (Bowes and Ihlanfeldt 2001; Hong, Boarnet, and Houston 2016; Litman 2007; Newman, Kenworthy, and Glazebrook 2013; Zhong and Li 2016). However, the intensive capital investments they require deter policymakers who are anxious about the impact of rail transit on property values and consequentially municipal revenues (Falcocchio, Malik, and Kontokosta 2018; Smith and Gihring 2006; Zhao, Das, and Larson 2012). Numerous studies have tried to reveal the property value impacts of rail transit; unfortunately, the results were mixed and unsettled, failing to afford convincing policy recommendations (AlQuhtani and Anjomani 2019; Debrezion, Pels, and Rietveld 2007; Ko and Cao 2013; Q. Pan 2019; Zhong and Li 2016).
Most of the previous studies on the property value impact of rail transit, such as those referenced above, are based on a cross-sectional approach. Researchers would compare properties sold near transit stations with those sold in areas supposedly too far to be impacted by the stations. They often fail to offer convincing evidence about the long-term impacts and causal relations (see Zhong and Li 2016, 35). Researchers increasingly recognize the importance of longitudinal analyses in revealing the property value impact of rail transit (Bae, Jun, and Park 2003; Ransom 2018). At the same time, despite the abundance of literature in quantifying the impact, the social equity–related consequences of such implications have not been well addressed (Dong 2017).
This study addresses the above two shortcomings. First, it is a longitudinal assessment. We examine the impact of light rail stations on property values by analyzing the 1993–2013 single-family home sale transactions in the City of Los Angeles, California. This span period covers different stages of the studied transit system, from pre-announcement to several years after the opening. Second, we investigate how the impacts of rail transit differentiate within neighborhoods of various income levels. This provides policymakers input from the social equity perspectives.
The following section summarizes relevant literature, followed by a description of data and methods. We will then discuss the results and policy implications and provide concluding remarks.
Literature Review
Proximity to rail transit may impact property values in two opposite ways: positive due to enhanced access to jobs and urban opportunities and negative due to various externalities such as noise and crime (Bowes and Ihlanfeldt 2001). Landis et al. (1995), John (1996), and Al-Mosaind, Dueker, and Strathman (1993), among others, are early examples of case studies (Washington, DC, USA, and Portland, Oregon, USA, respectively) in which accessibility to rail transit was found to impact property values positively. Similar findings were reported later by researchers such as Bae, Jun, and Park (2003), Duncan (2008), Billings (2011), H. Pan and Zhang (2008), and Zhang et al. (2014).
While positive findings dominated the debate, adverse effects were also reported. For example, in their Charlotte (North Carolina, USA) case study, Yan, Delmelle, and Duncan (2012) found that proximity to the rail transit corridor negatively influences home prices before the operation. Still, the impact switched to positive after the operation. Bollinger, Ihlanfeldt, and Bowes (1998), in their Atlanta (Georgia, USA) study, revealed a negative relationship between proximity to rail transit stations and office rents, which might be due to safety concerns. Zhong and Li (2016) found that the proximity to mature rail transit stations benefited multi-family property values but decreased the values of single-family properties; they also found that Park-and-Ride facilities heavily discounted the premiums for rail transit accessibility.
Mixed-effects, in terms of signs and magnitude, were reported in the following meta-analyses: Debrezion, Pels, and Rietveld (2007), Mohammad et al. (2013), and Zhang (2009). The complex mechanism behind the land use impact of rail transit, coupled with methodological limitations in data and estimation techniques, may have contributed to the mixed findings of the magnitudes and directions of the effects (Debrezion, Pels, and Rietveld 2007; Higgins and Kanaroglou 2016; Mohammad et al. 2013; Zhong and Li 2016).
A limited number of recent researchers have endeavored to unleash the longitudinal approach’s potential in revealing the causal impact of rail transit on property values. Weinberger (2001) analyzed 1984–2000 commercial property rent in Santa Clara County, California. Bae, Jun, and Park (2003) studied how proximity to a subway station influenced housing prices in Seoul, South Korea, by analyzing four years of housing transaction data: 1989 (the subway line was announced), 1995 (during construction), 1997 (the completion year), and 2000 (three years post-opening). They found that the impact was statistically significant only before the line’s opening.
Ransom (2018) studied the effect of rail transit on housing prices in Seattle, Washington, by applying the difference-in-difference regression technique to housing transactions before the construction and after the opening. Other examples of this line of research include studies in St. Paul, Minnesota (Cao and Lou 2017), Minneapolis, Minnesota (Hurst and West 2014), Washington County, Oregon (Knaap, Ding, and Hopkins 2001), and Phoenix, Arizona (Golub, Guhathakurta, and Sollapuram 2012).
While we focus on the impact of the light rail station on housing values, numerous studies have examined the relation of gentrification to transit investment (Dawkins and Moeckel 2016; Revington 2015; Zuk et al. 2018). Gentrification is often seen as an unfortunate outcome of revitalization (Dawkins and Moeckel 2016; Revington 2015). Low-income neighborhoods suffer from a lack of investments from both the public and private sectors. A large-scale investment like light rail systems increases the value of nearby properties and triggers revitalization of the area attracting private investments in both residential and commercial properties (Pollack, Bluestone, and Billingham 2010). Increasing housing values accelerates the transition from renter- to owner-occupied units, limits the chance of providing affordable housing, and leads to displacement of low-income households (Bardaka, Delgado, and Florax 2018). In commercial properties, increased rent drives out small local businesses in the revitalization process (Cervero and Duncan 2002). As a result, the neighborhood becomes more attractive for middle- and upper-class residents, which leads to changes in the neighborhood’s socioeconomic characteristics (Bardaka, Delgado, and Florax 2018; Dawkins and Moeckel 2016; Revington 2015).
Recent studies on this matter focus on the socioeconomic changes in the nearby neighborhoods. They examine occupations, unemployment, income, education, race, investments, and other demographic changes rather than property value changes. Baker and Lee (2019) argue that examining socioeconomic characteristics provides a more substantial understanding of gentrification and overall neighborhood change. González, Loukaitou-Sideris, and Chapple (2019) and Grube-Cavers and Patterson (2015) also argue that the impacts of transit investment on neighborhood changes need to be understood from a broader spectrum of time and space. While this study is limited to examining the impact of light rail stations on the single-family residential value, we focus on examining equity consequences on rail transit development, analyzing the impact on low-, middle-, and high-income neighborhoods by space and time. We also aim to provide a good basis and framework for future research examining gentrification and neighborhood changes.
Data and Method
Study Area
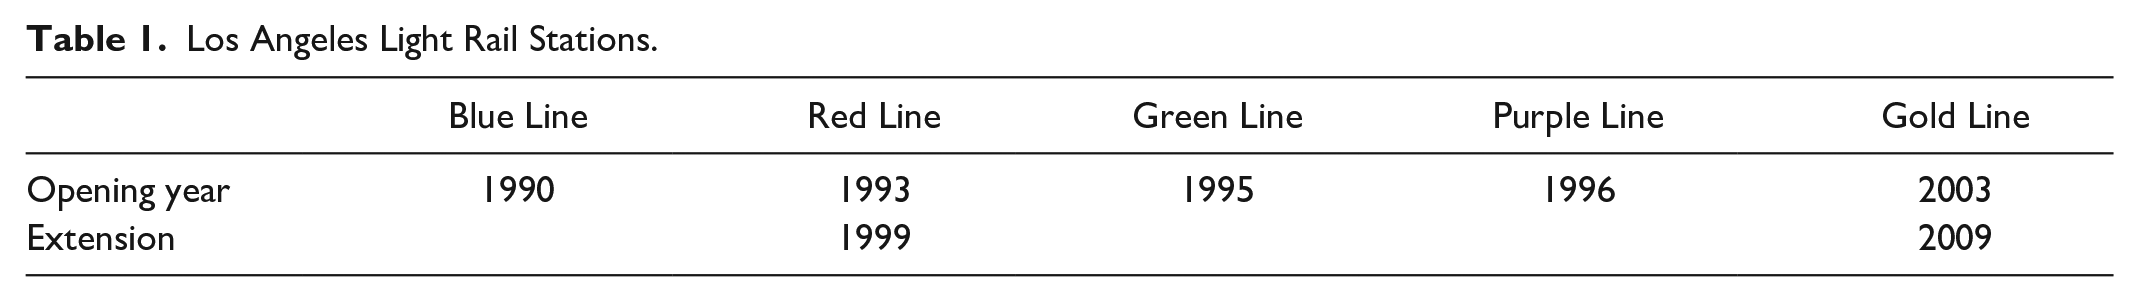
The study area is located in the northeast of Los Angeles County, where the Gold Line (name changed to L Line in 2020) opened in 2003 (Table 1). The line initially connected Northeast Los Angeles, South Pasadena, and Pasadena to Downtown Los Angeles (where it serves several attractions, including Little Tokyo, the Southwest Museum, Chinatown, and Union Station). It later expanded to East Los Angeles in 2009. The whole line is 31 miles long with twenty-six stations and a daily weekday ridership of around 47,656 in 2019. In this study, we focus on the northeast of Los Angeles, where the Gold Line opened initially, to examine the longitudinal impact before and after the Gold Line operation. For longitudinal analyses, we analyze a period of twenty-one years, from 1993 to 2013. The period includes seven 3-year periods, three periods before and four periods after the opening of the Gold Line. Each period represents phases of developmental and operational conditions: (1) first two periods for the planning phase of the line (1993–1998), (2) third and fourth periods for the construction and opening (1999–2004), and (3) last three periods for the operation (2005–2013). This allows for the analysis regarding changes in the residents’ preference over the light rail stations as the system develops and adjusts.
Los Angeles Light Rail Stations.
Empirical Data and Data Collection
In this research, the dependent variable is the sales prices of single-family houses near the Gold Line stations in Los Angeles County. For the study area boundary, we choose single-family properties within 3-mile radius of Gold Line stations opened in 2003. The 3-mile radius was chosen to include sufficient cases of non-impact properties after verifying the impact area, which is within a 2-mile radius. The other end of the line where the Gold Line extended in 2009 is not included in our analysis. The area, East Los Angeles, is considered as a different neighborhood passing through Downtown Los Angeles. Besides, the properties did not have stations until 2009; thus, they could not be included in this longitudinal study. We exclude parcels within 3 miles from the stations from other lines, that is, red, purple, and blue, to focus on properties that the Gold Line solely impacts. The boundary includes 94,877 sales transactions in the twenty-one years, 1993 to 2013. The sales transaction and properties’ structural data were purchased from DataQuick Information Systems. Through preliminary analyses, we treat the original dataset and exclude extremes:
The sales prices from 1993 to 2013 are adjusted to 2013 real estate market prices using the Housing Price Index specified to the Los Angeles Metropolitan Statistical Area (MSA), provided by the Federal Housing Financing Agency.
Sales prices lower than $30,733 and higher than $3,500,120, the sample’s 1 percentile and 99 percentile, respectively, are excluded. As a result, 1,898 sales records were removed from the analysis. These extreme values do not reflect the common market value (Noh, Newman, and Lee 2021).
Missing or mistyped values in structural and neighborhood variables are excluded. There were 3,290 missing or mistyped values that could not be restored.
After the preliminary regression, 581 cases with extreme residuals, caused by an unordinary number of beds and bathrooms, or size of floor and lot areas, are confirmed and removed (Noh and Rogers 2016).
As a result, the final sample for single-family housing includes 89,108 sales transactions.
In this study, we conduct several hedonic regressions to analyze heterogeneity in the impact of the rail stations in terms of income status. We analyze the sales in low-, middle-, and high-income neighborhoods in separate hedonic regressions to examine the heterogeneity in the impact of the rail station. We chose the median household income in 2000 census block group data of the study area—$40,281—as a benchmark and created three neighborhood income levels using 80 and 120 percent of this value as cutting points: low (< $32,224), middle ($32,224–$48,337), and high (>$48,337). Our benchmark is very close (within a 5% difference) to Los Angeles County’s median income, which is $42,045. Among 89,108 sales transactions, 33,508, 26,645, and 28,955 transactions belonged to low-, middle-, and high-income neighborhoods, respectively. Figure 1 shows the Gold Line stations and the distribution of neighborhoods by income level. All income levels are well distributed around the study area, with a concentration of low-income neighborhoods closer to downtown.
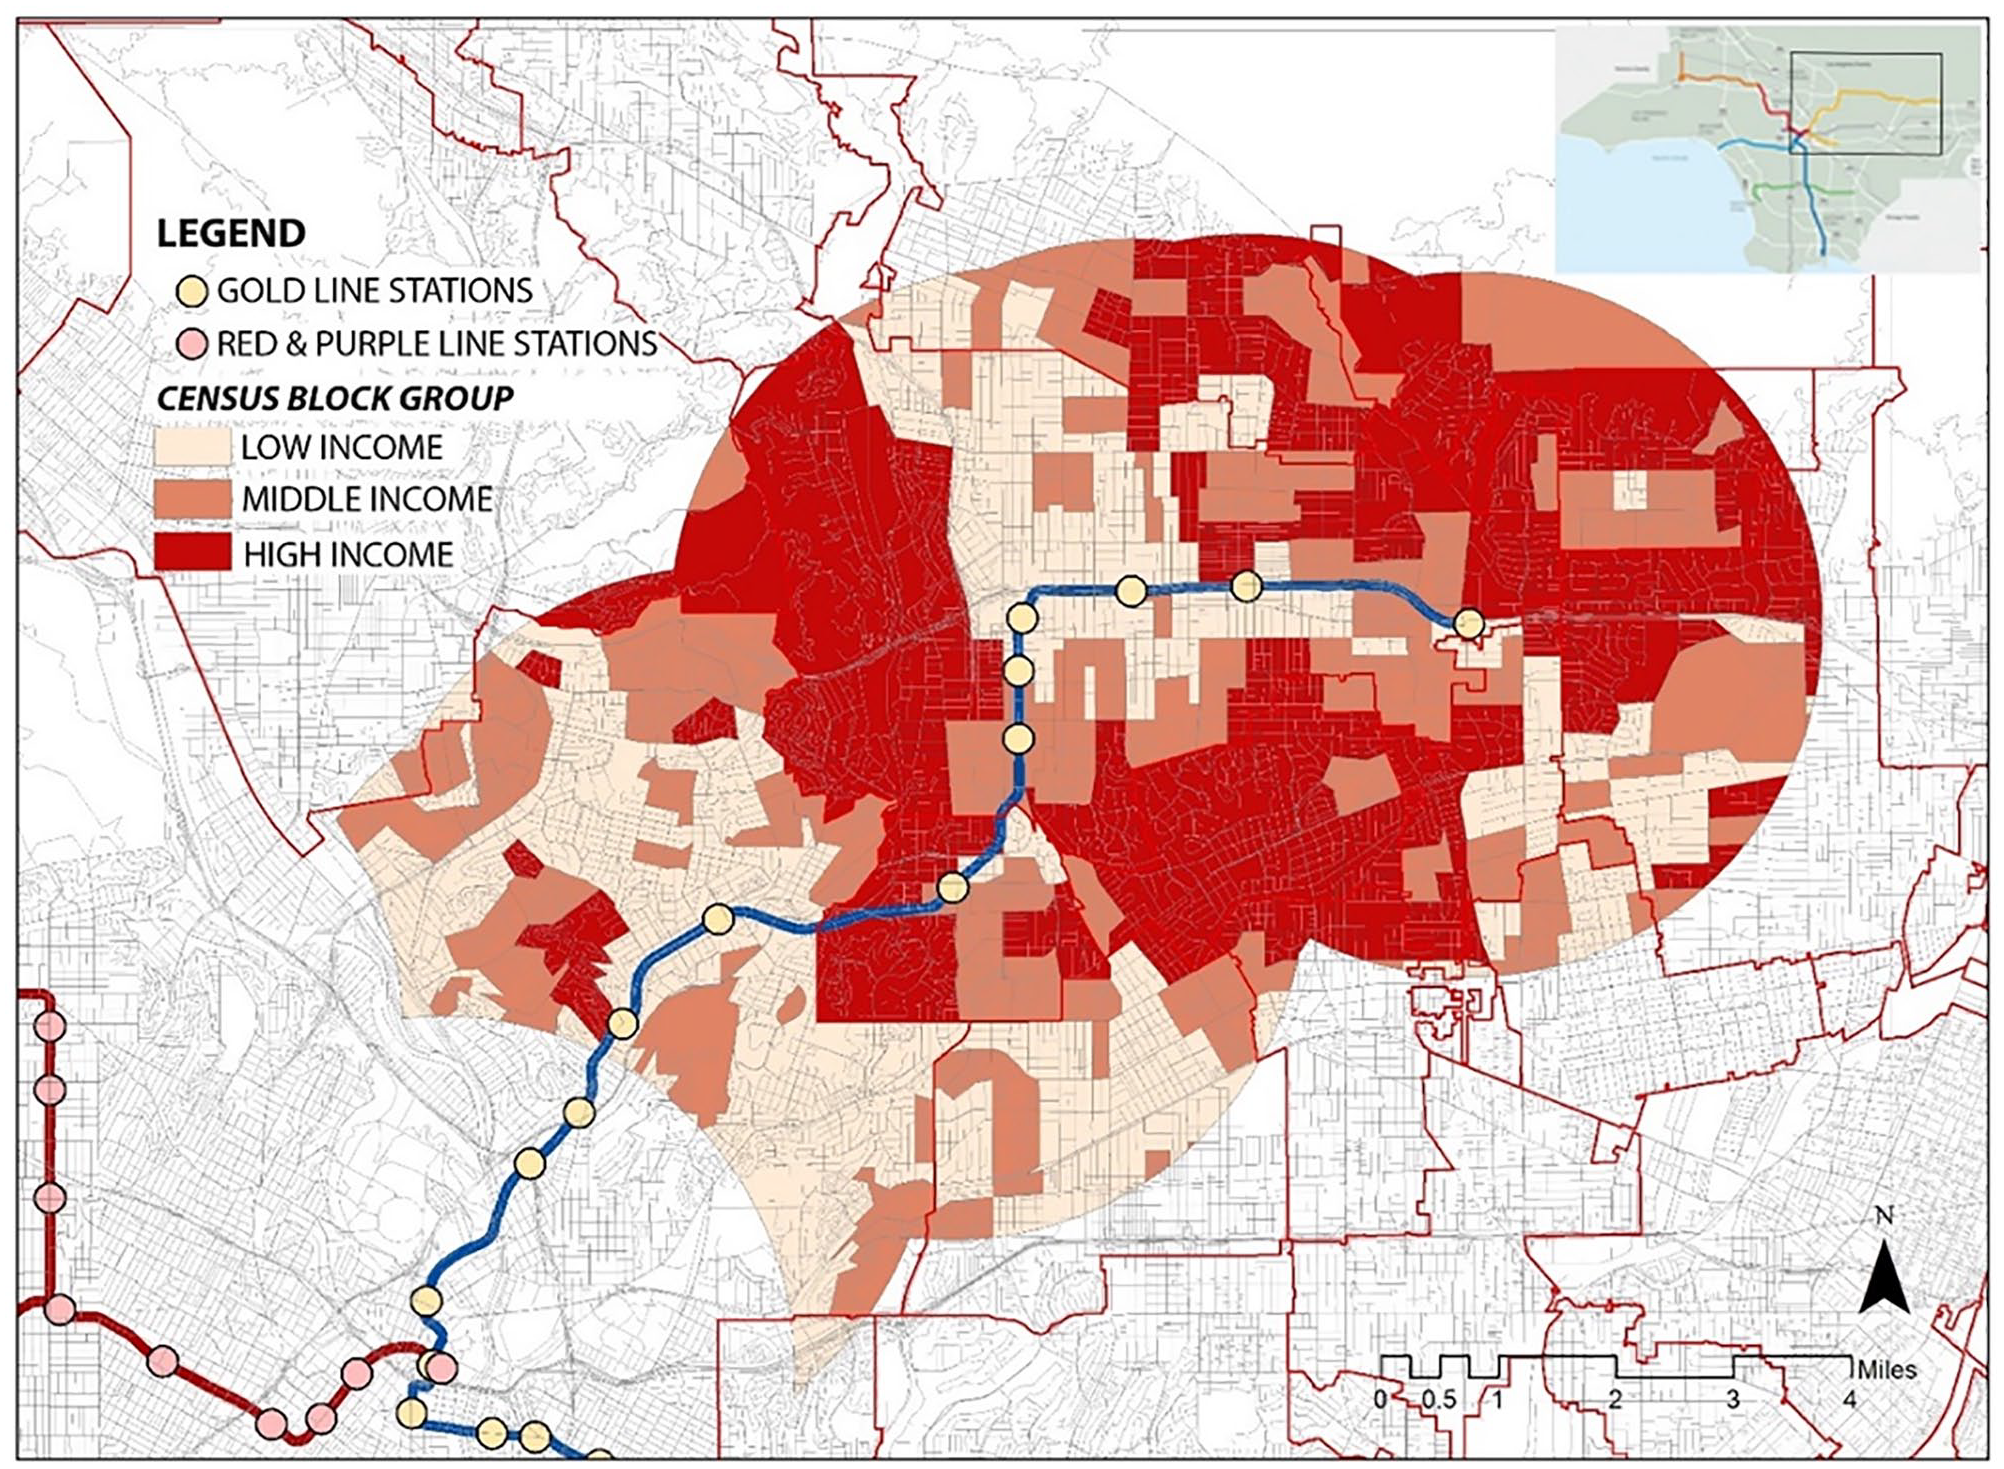
Study area and neighborhoods by income level.
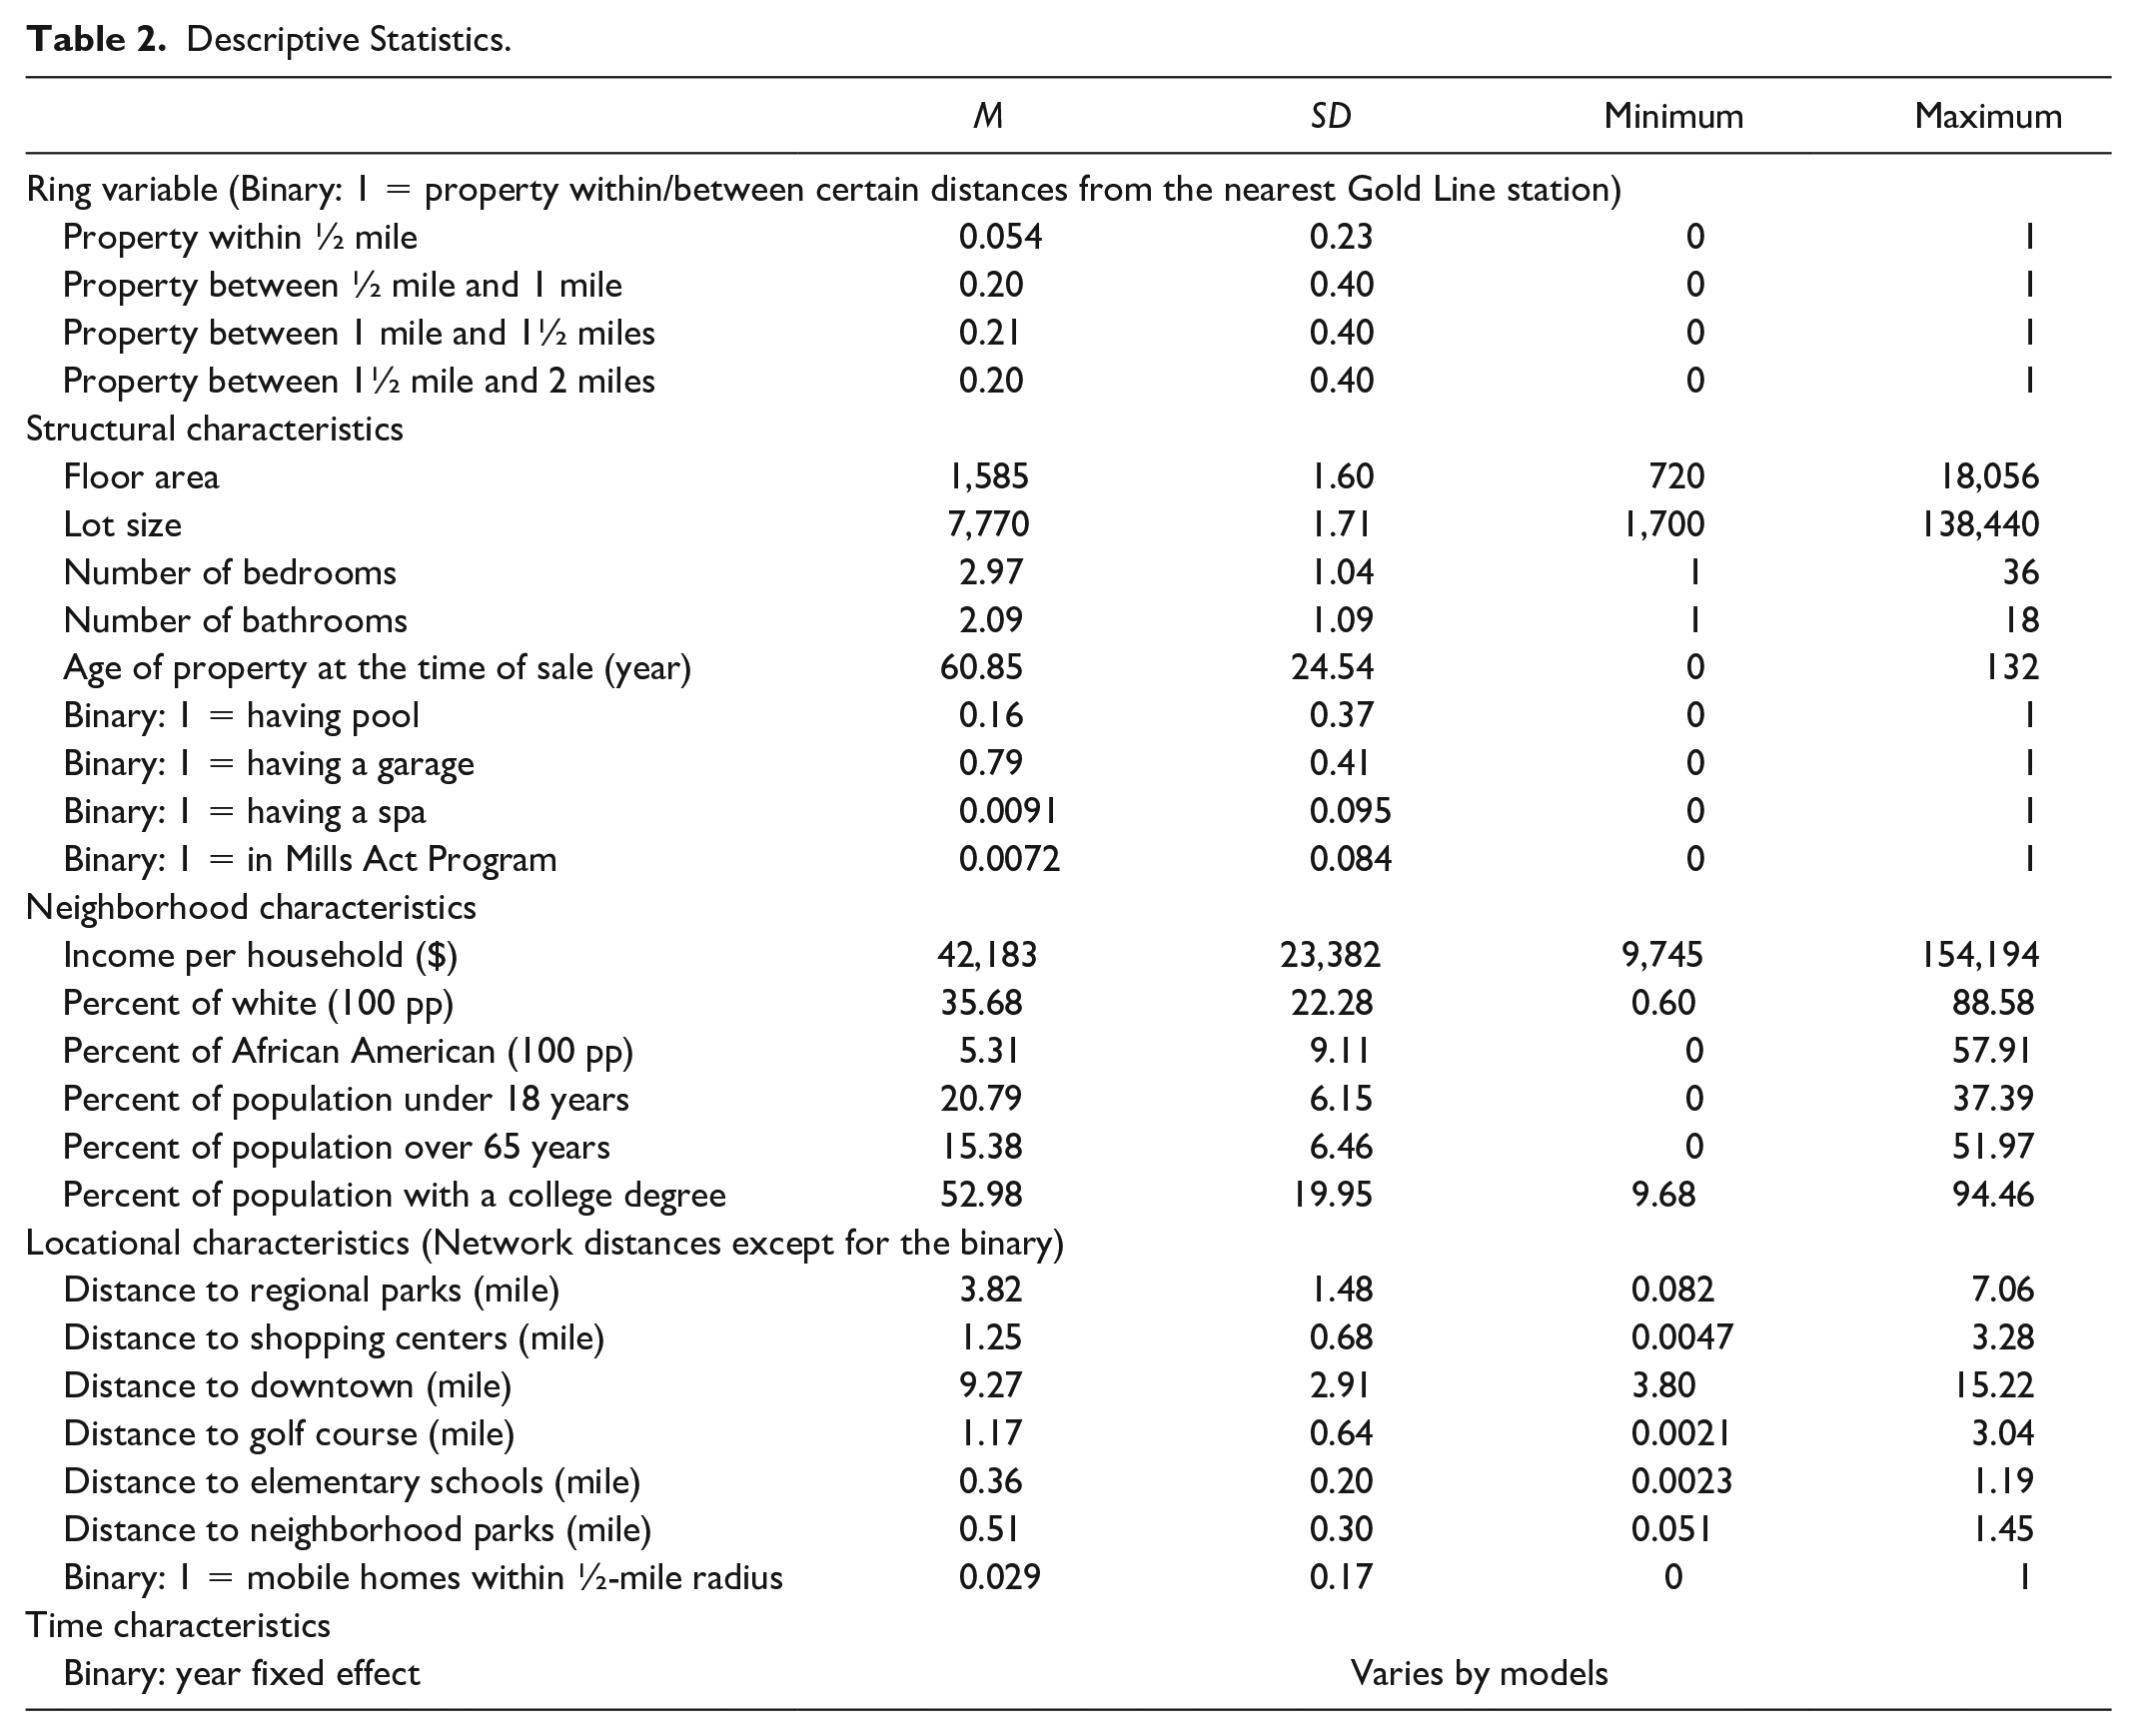
In addition to stratifying our sample by income, we introduce binary distance bands around the stations as the key variables in the study to examine the spatial heterogeneity in the impact. Our bands include within ½ mile, ½ to 1 mile, 1 to 1½ miles, or 1½ to 2 miles from the stations. Specifying consecutive distance rings allows us to determine how far the rail stations’ impact influences the properties. It also enables us to determine which part of the neighborhood sees the largest impact.
To process the locational variables, we used several sources to acquire data. We acquired geographic information system (GIS)-related data from Los Angeles County GIS Data Portal (see Appendix, Note 2). The portal provides shapefiles for shopping centers, schools, parks, recreation centers, downtown, golf courses, mobile homes, and light rail stations. The parcel map was purchased from the Office of the Assessor, County of Los Angeles. We employed either network distance or Euclidean distance for locational variables. The network distance, appropriate to capture the magnitude of utilities, is employed for dis/amenities where residents can walk or drive up and enjoy, that is, large parks, recreational areas, and schools. Euclidean distance, on the other hand, is more appropriate for dis/amenities where residents enjoy views and environmental benefits or have strong psychological existence among residents (Noh 2019; Noh and Rogers 2016). While the stations provide utilities for commuters within a ½-mile radius, they also bring various spillover effects such as traffic, noise, and redevelopment. As one of our objectives is to analyze the spillover effect of the light rail stations, the ring variables were calculated based on Euclidean distances, assuming the ½-mile radius ring will represent the walking population and the other rings will help us understand the spillover effects.
Building structural attributes include the heated area, lot area, numbers of rooms and bathrooms, structure’s age, and binary variables representing whether each of the following features exists: swimming pool, garage, spa, and participation in the Mills Act program (see Appendix, Note 1). Neighborhood variables, income, age, race/ethnicity, and education level data at the block group level from the 2000 Census are introduced to account for spatial differences in the analysis. Regarding multicollinearity issues, we conducted Pearson’s correlation, and the coefficients are all less than .7.
Hedonic Price Model
The Hedonic Price Model (HPM) is based on a multiple regression that infers implicit prices of amenities and disamenities associated with a property by analyzing variation in housing prices while controlling for structural and neighborhood characteristics (Redfearn 2009). HPM allows decomposing values for properties’ attributes in different dwellings in different places (Malpezzi 2003). To examine the impact of Gold line rail stations on housing premium, the hedonic model employs the following attributes: (1) consecutive distance bands from rail stations, (2) structural characteristics, (3) locational characteristics, that is, network distances to amenities and disamenities, and (4) neighborhood characteristics, that is, sociodemographic characteristics such as race, education, and age. The hedonic framework in this study is as follows:

where P(h), S, N, L, and T are vectors;
Descriptive Statistics.
Results and Discussion
We conducted four sets of modeling work: one for the overall sample and three for the low-, middle-, and high-income neighborhoods, respectively. We estimated seven regression models for each set, which is based on a three-year period during 1993–2013. As the study aims to examine the impact of light rail stations, we focus on the interpretation of four key variables, the distance ring variables (see Appendix, Note 3).
Longitudinal Hedonic Modeling for All Properties
Before the opening, a majority of the coefficients for the distance ring variables are statistically insignificant (Table 3). The significant coefficients have negative values that range from −0.0414 to −0.0156. Properties within ½ mile of the proposed station had a negative impact of 2.88 and 4.14 percent lower housing values in the two periods from 1996 to 2001. Also, properties between ½ mile and 1 mile from the stations had a negative impact of 1.56 percent from 1999 to 2001. The negative impact within a 1-mile radius before the opening indicates that locating near major thoroughfare without access to public transportation services harms properties’ value.
Regression Results: All Sales Transaction.
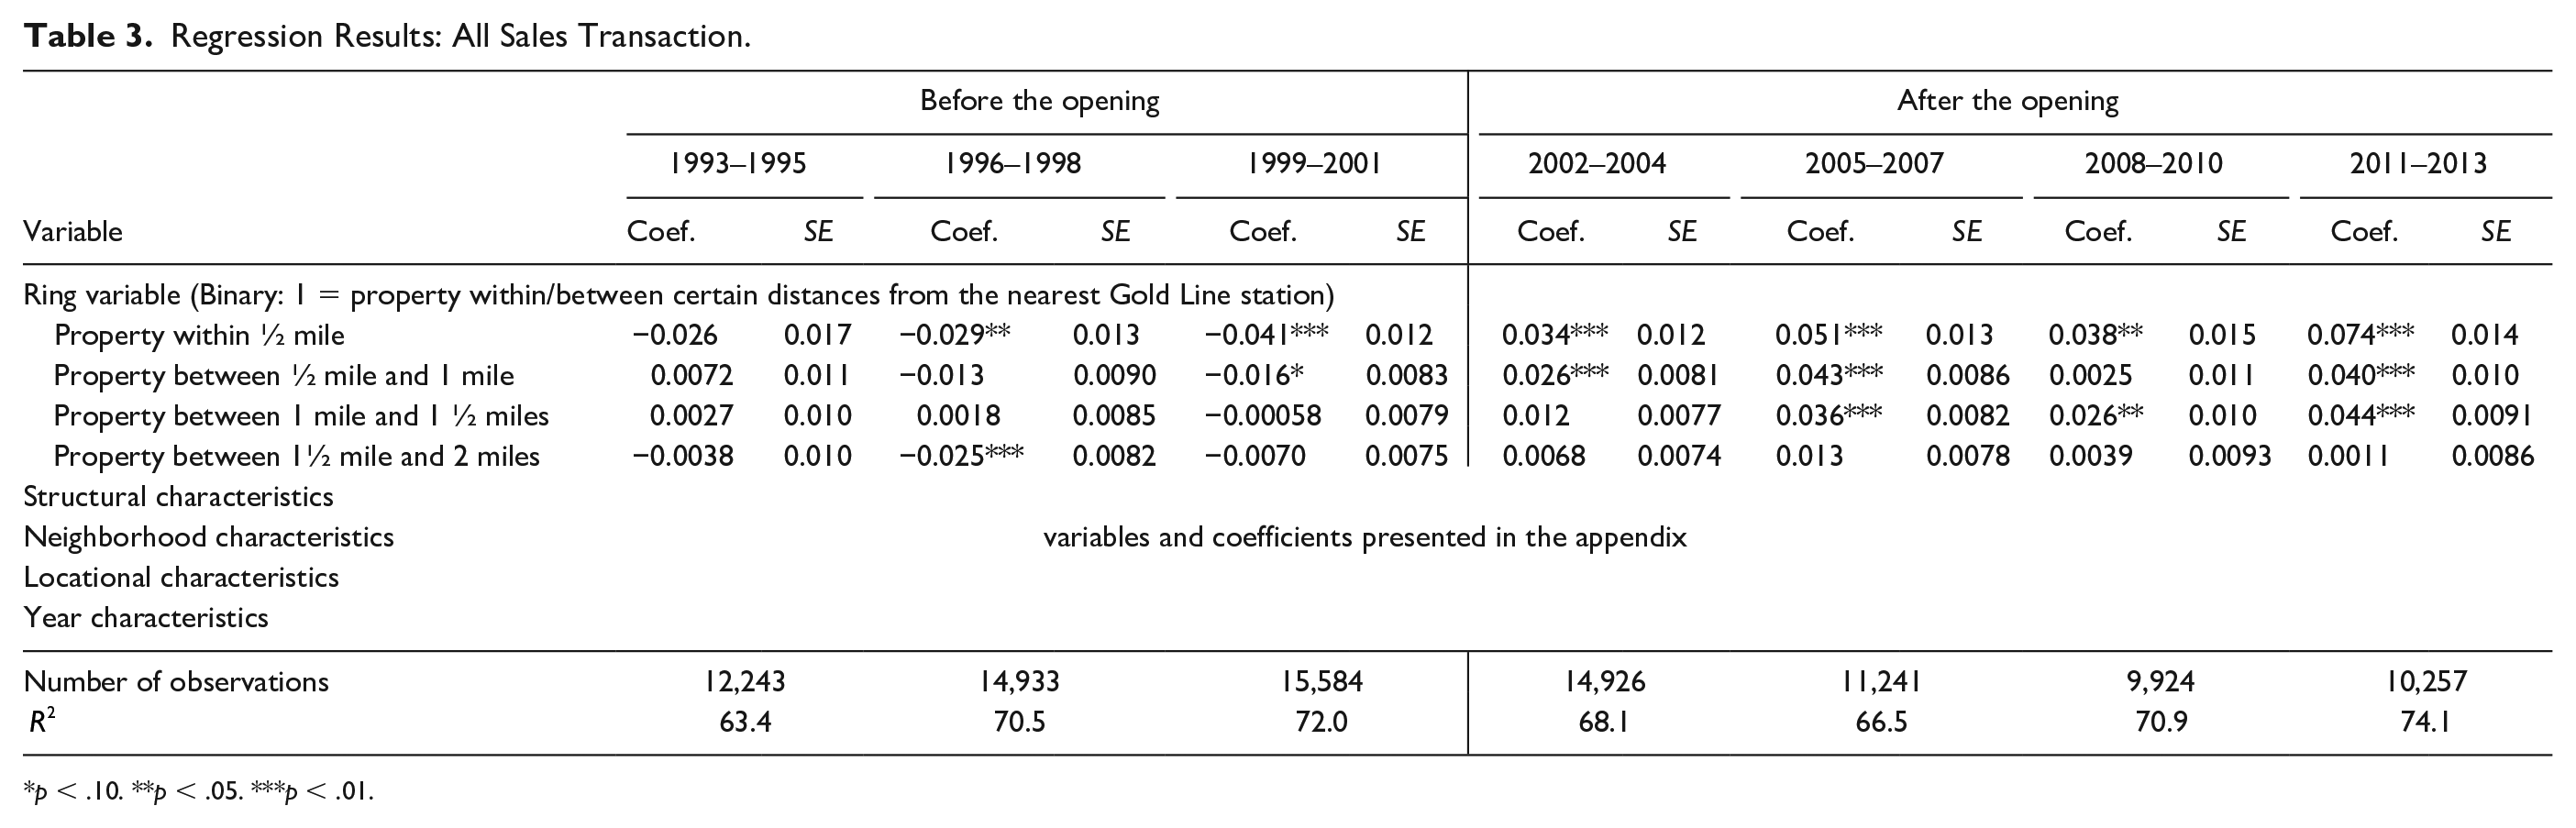
p < .10. **p < .05. ***p < .01.
After the construction and opening of the Gold Line stations, most of the coefficients within 1½ mile, three inner rings, were statistically significant and positive. The premium ranged from 2.58 to 7.38 percent. The results suggest that the positive impact on the single-family residential properties steadily increased since the light rail stations opened (Figure 2). The slight decrease in a positive effect on the 2008–2010 period may be due to the housing crisis in 2008. As the market crashed and housing prices plummeted, the premium would have shrunk as well. In the last period, after eight years since the opening, properties experienced the highest premium for locating near the stations. The ring variable’s coefficients between 1½ mile and 2 miles are insignificant for the entire period except for 1996–1998. This suggests that the light rail stations’ impact is limited within 1½ mile; furthermore, the properties within ½ mile from the stations benefit the most from the opening of the light rail service. The impact switches from negative to positive immediately after the opening of the stations. In the same period, properties between ½ mile and 1 mile from the station also benefit from the opening, turning negative impact into positive impact. This indicates that the single-family residents are not favorable of residing near the major thoroughfares, especially under construction. However, right after the opening of the light rail stations, the preference changes. Similarly, three years after the light rail stations’ opening, the impact becomes positive and statistically significant for the properties between 1- and 1½-mile radius from the stations.
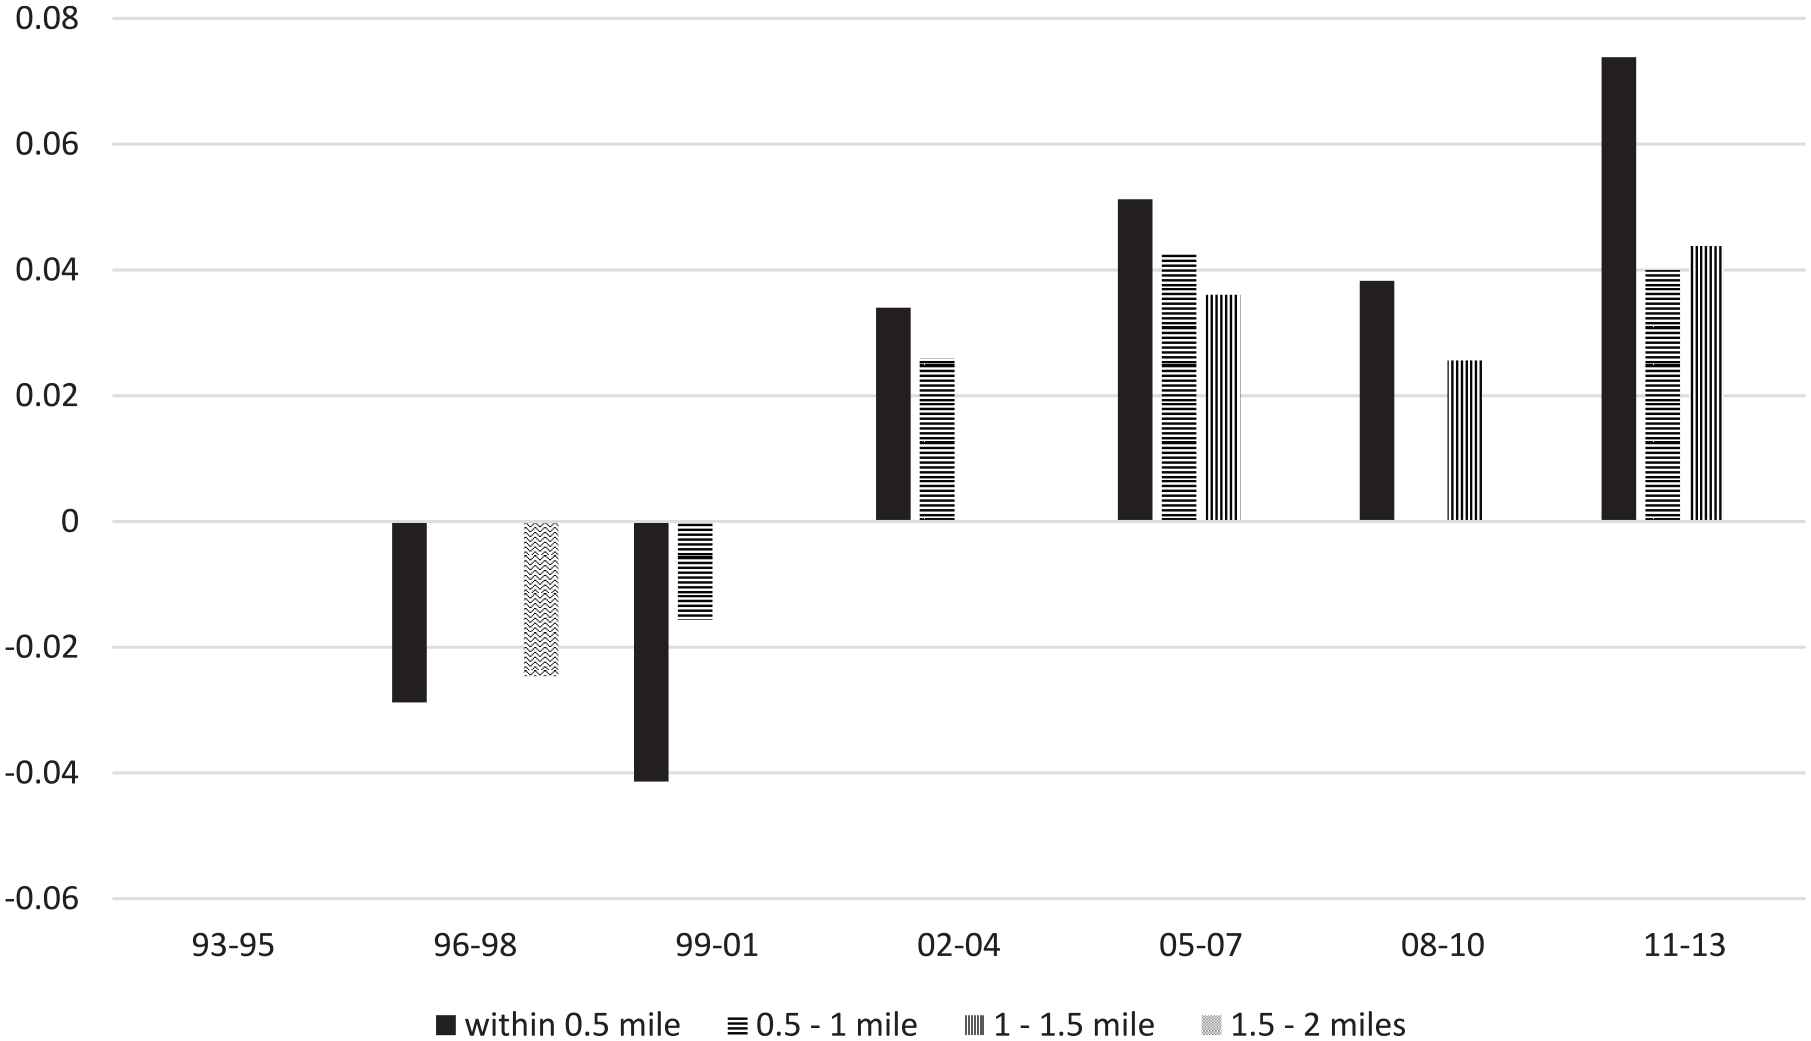
Coefficients of ring variables: All income levels combined.
Among the four distance bands, properties within ½ mile of the stations had the most significant coefficients. In the models, the coefficients rapidly increased after the opening of the Gold Line. The negative association between proximity and sales price turned into a positive association after the opening and remained its increasing trend. Properties in other distance bands also experienced some premium after the opening but not a rising trend. The positive impact remained around 2.56 to 4.38 percent. The increasing trend within the ½-mile radius may suggest that properties near the stations are influenced by gentrification. The coefficients show a rapid increase from negative 4.14 percent before the opening to the highest premium of 7.38 percent in the last period.
Spatial Heterogeneity in the Effects
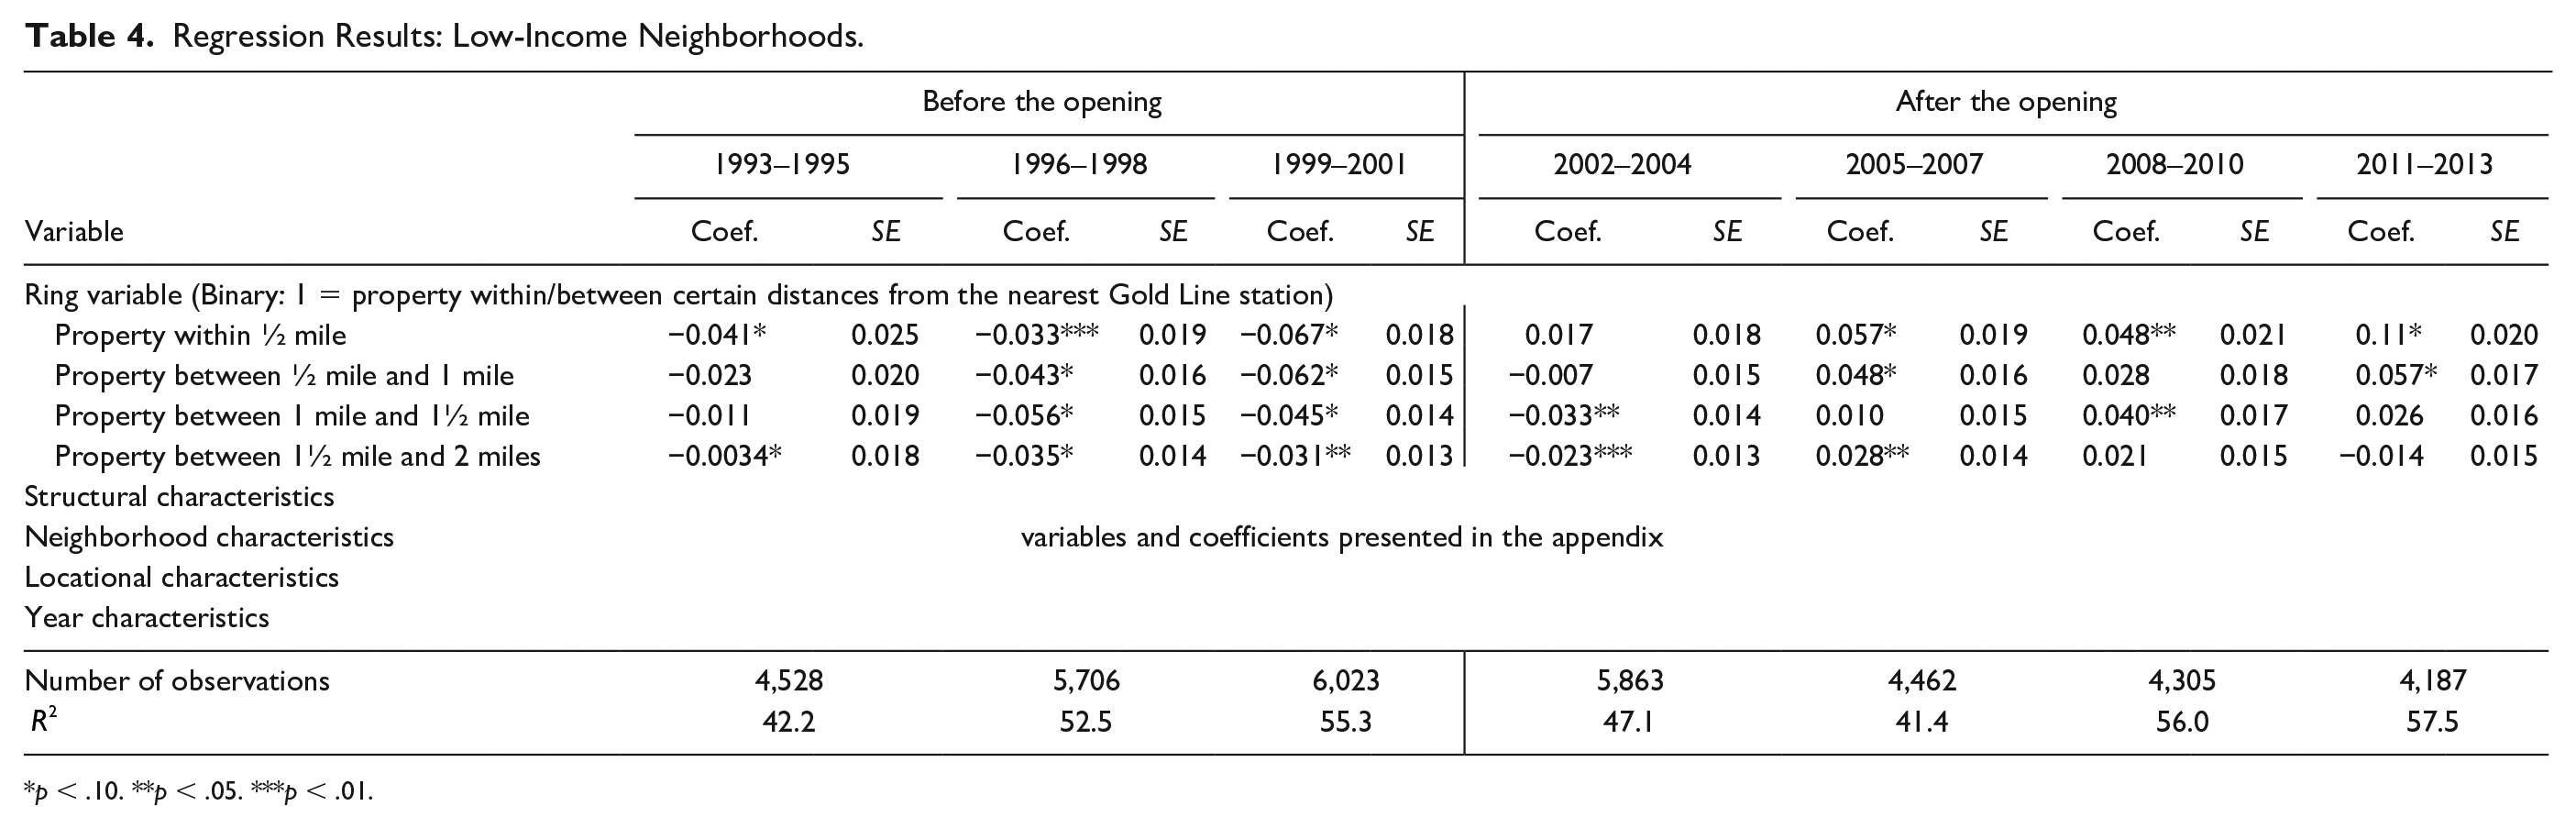
In low-income neighborhoods, the ring variables’ coefficients have a similar trend to the model that includes all neighborhoods, but the magnitude of the impact is more considerable (Table 4). The impact increased from −6.67 percent in 1999–2001 before the opening to 10.91 percent in 2011–2013 (Table 4 and Figure 3). Similarly, for the ring variable between ½ mile and 1 mile, the impact increases from −6.21 to 5.65 percent in the same periods. Properties between 1- and 2-mile radius also experienced a positive effect switching negative to positive like the inner ring variables (Figure 3). One thing to note is that all the positive associations came three years after the stations’ opening.
Regression Results: Low-Income Neighborhoods.
p < .10. **p < .05. ***p < .01.
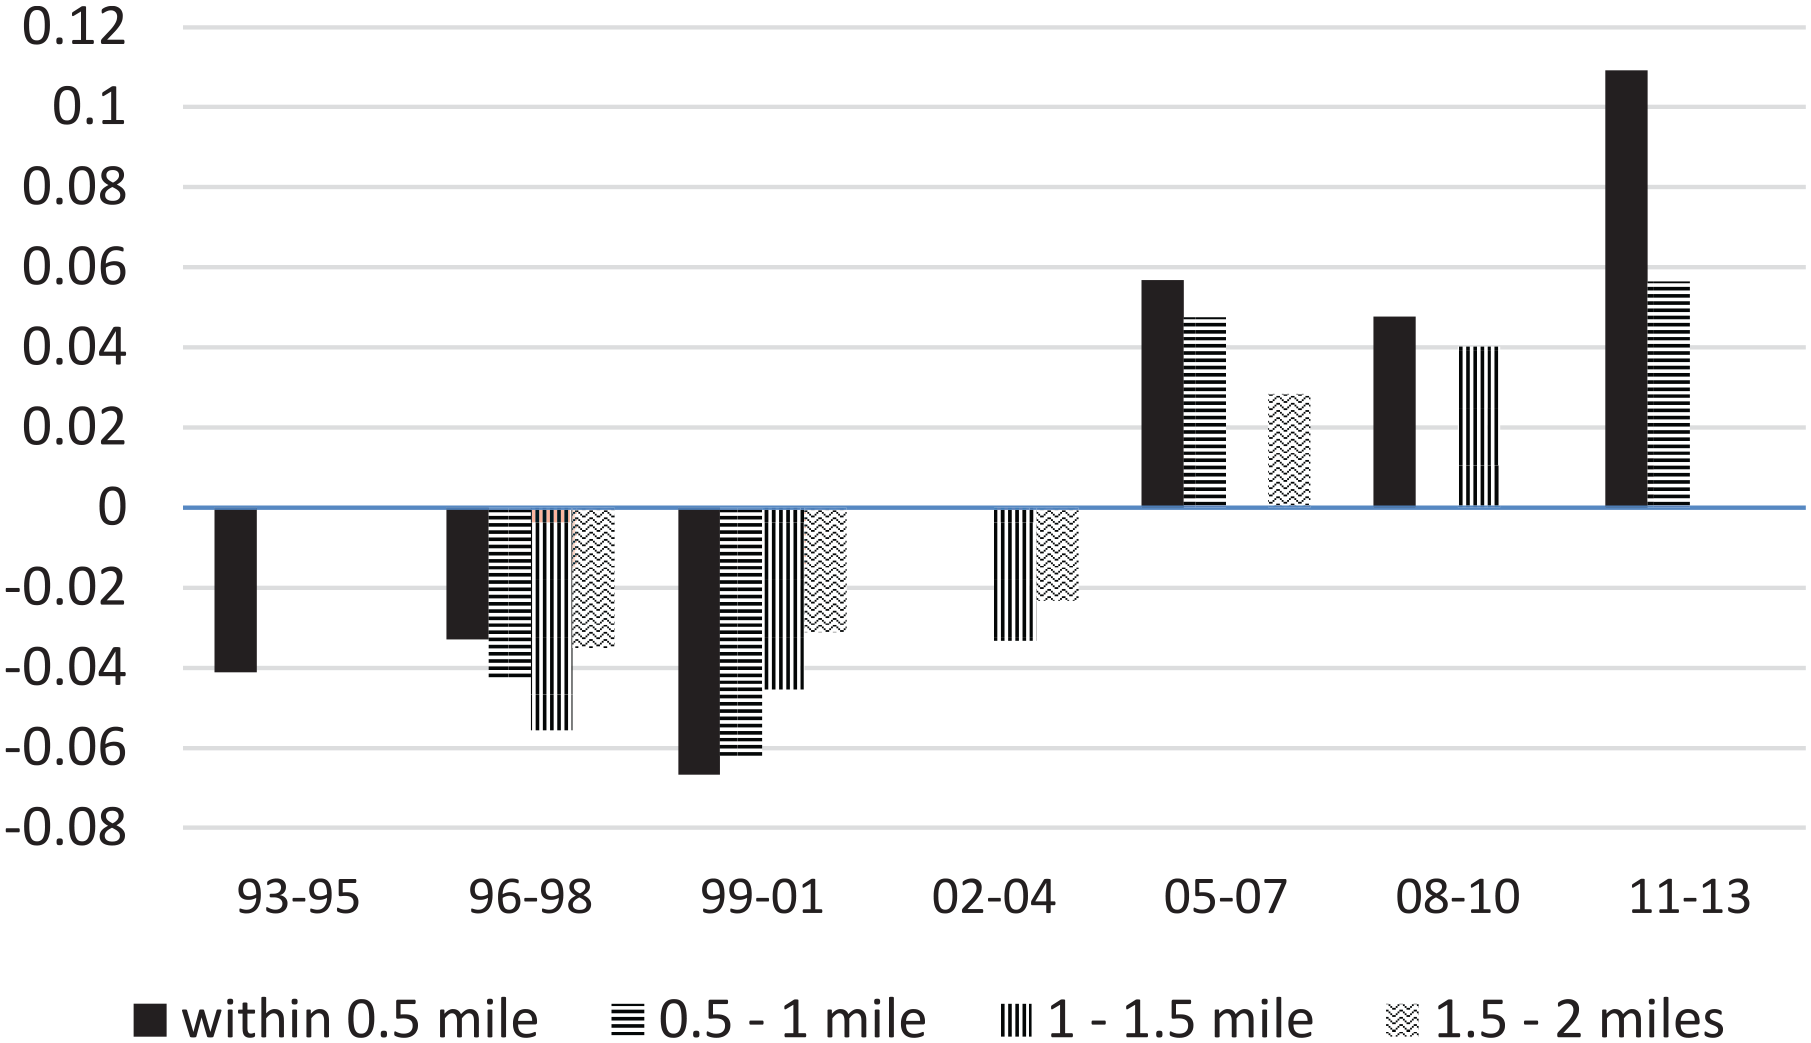
Coefficients of ring variables: Low-income neighborhoods.
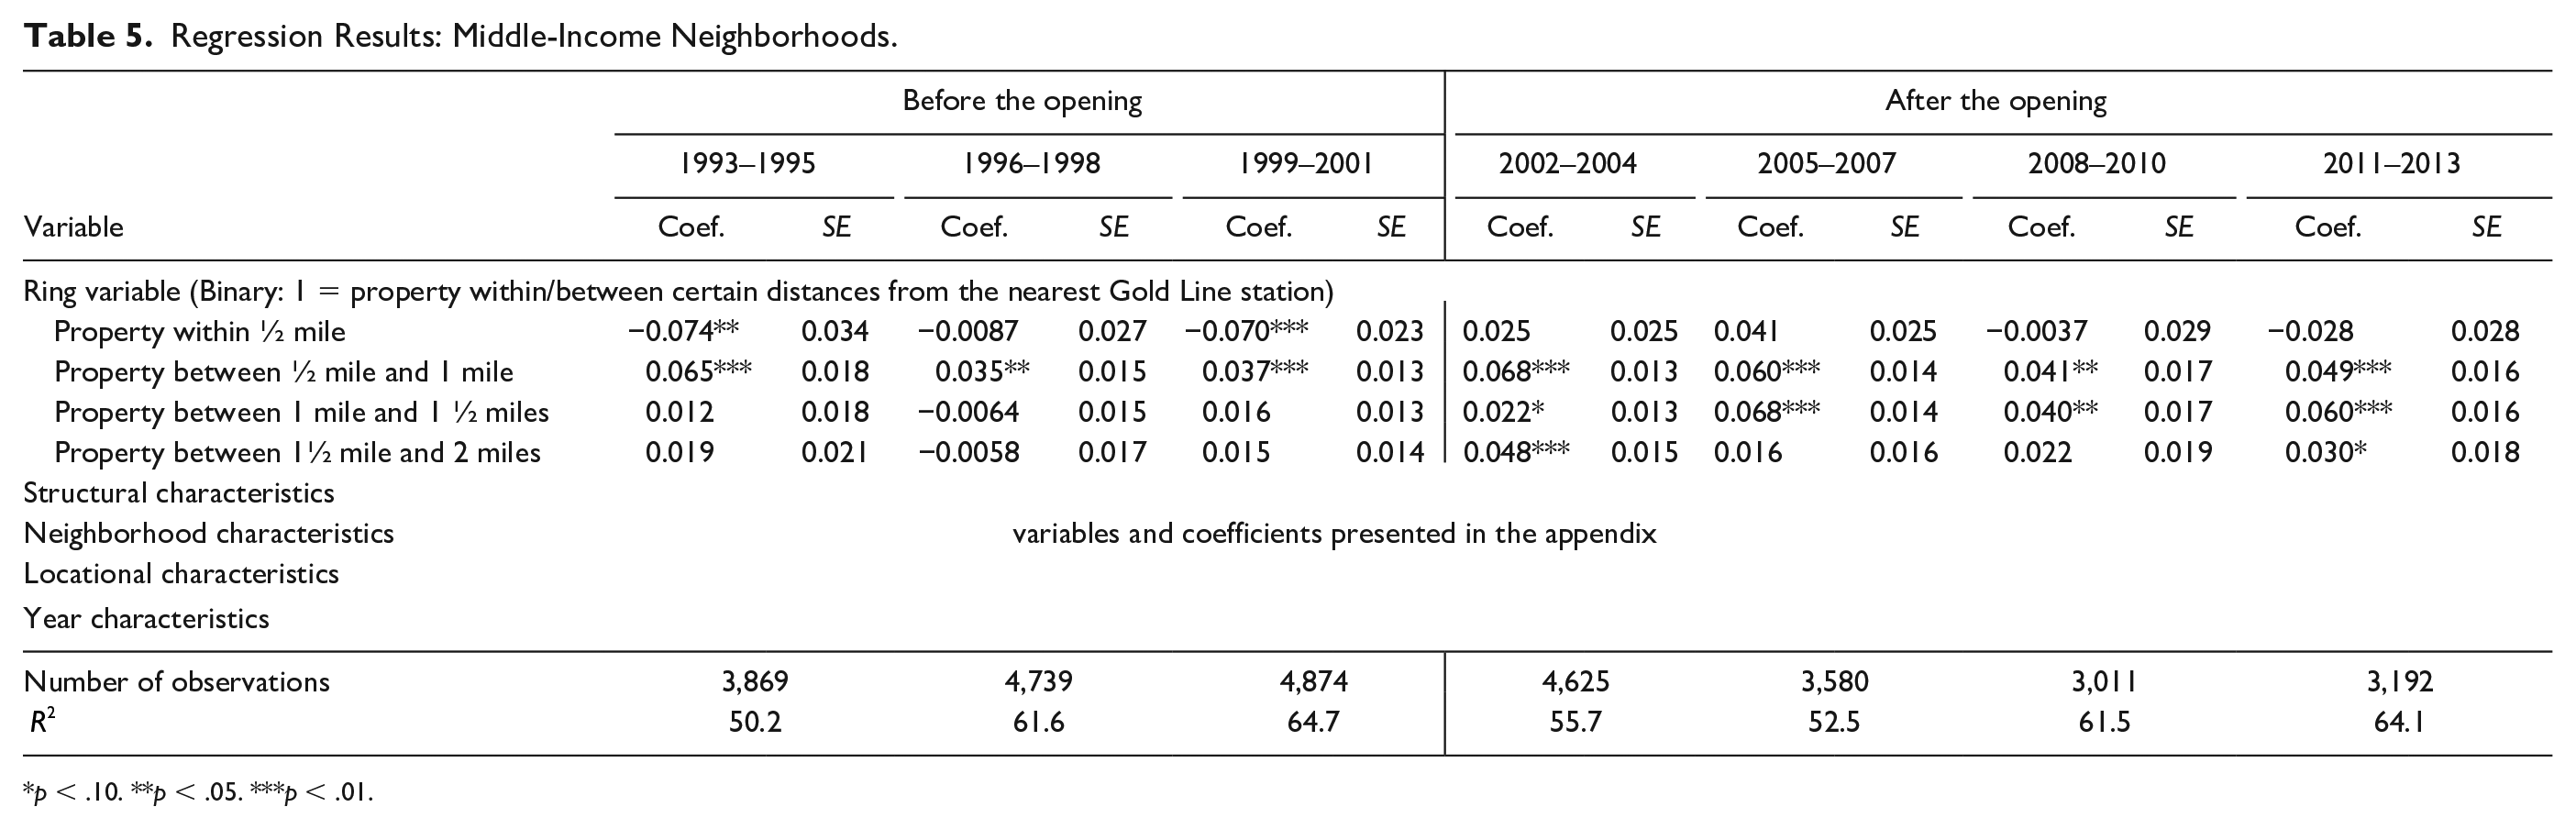
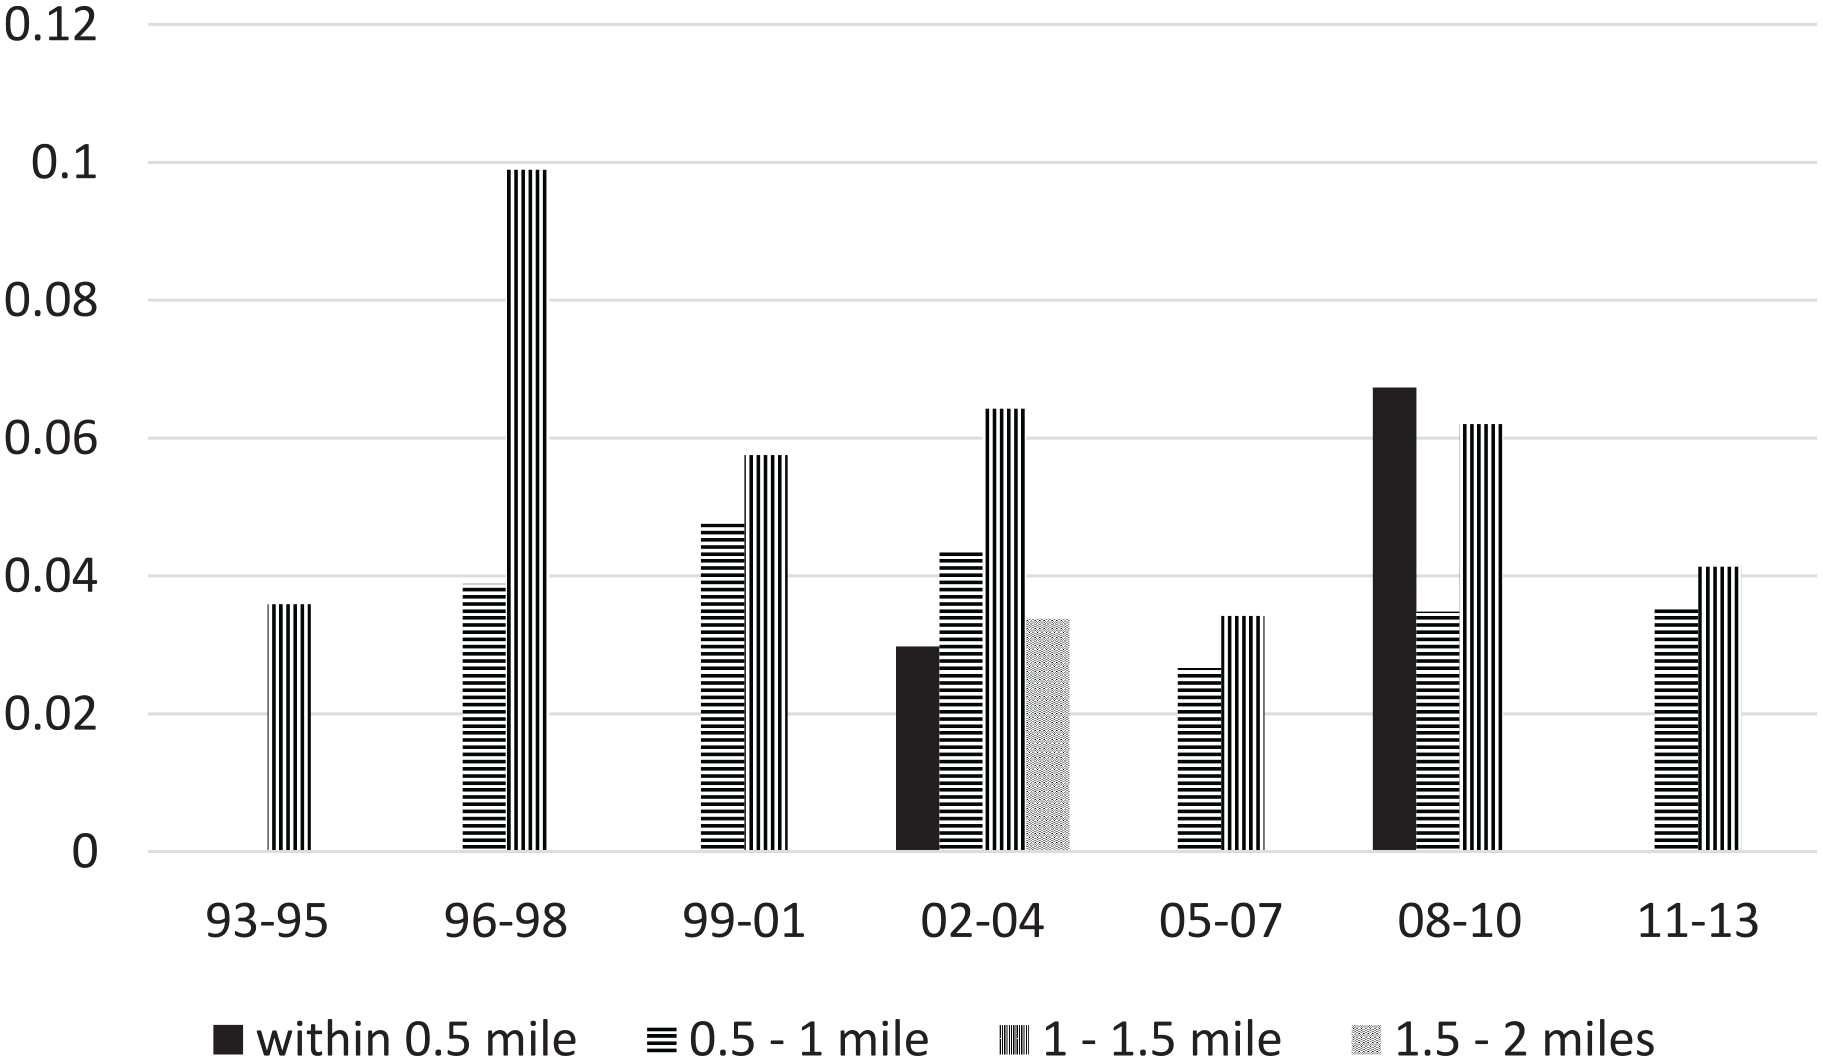
In the middle-income neighborhoods, the ring variables between ½ and 1 mile and between 1 mile and 1½ mile present statistically significant coefficients (Table 5). The second inner ring variable’s coefficients, ½ mile to 1 mile, do not show any significant increase or decrease in the impact. Regardless of the station opening, the results were positive during the whole study period, ranging from 3.53 to 6.84 percent. On the other hand, properties between 1 mile and 1½ mile experienced an increasing trend, from 1.56 to 6.04 percent after 8 to 11 years (Figure 4).
Regression Results: Middle-Income Neighborhoods.
p < .10. **p < .05. ***p < .01.
Coefficients of ring variables: Middle-income neighborhoods.
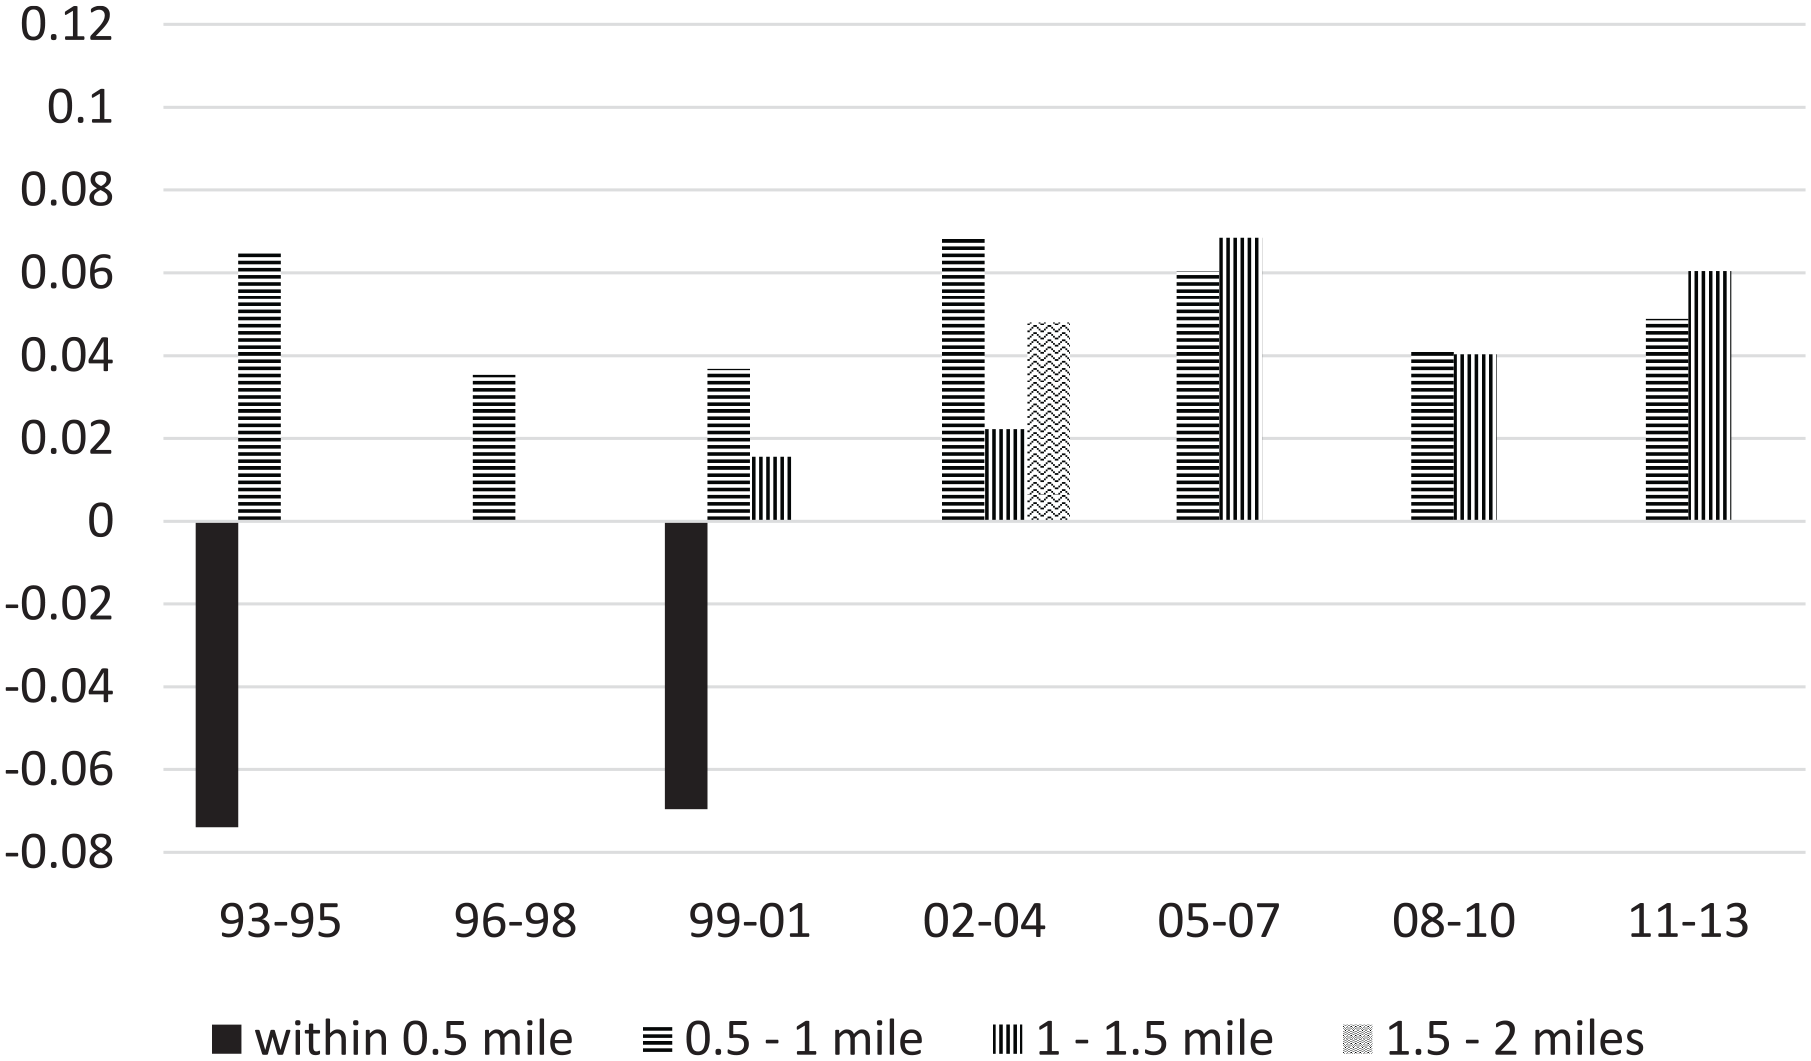
The properties in high-income neighborhoods present a similar trend in the impact as those in middle-income neighborhoods (Table 6). The inner ring coefficients are statistically insignificant except for two periods, 2002–2004 and 2008–2010. While the coefficients in the ½-mile to 1-mile ring and 1-mile to 1½-mile ring present a statistically significant and positive association, they do not show significant trends (Figure 5). The statistical insignificance for half of the coefficients and no trend change for the significant coefficients indicate that property value in high-income neighborhoods is less sensitive to the light rail stations.
Regression Results: High-Income Neighborhoods.
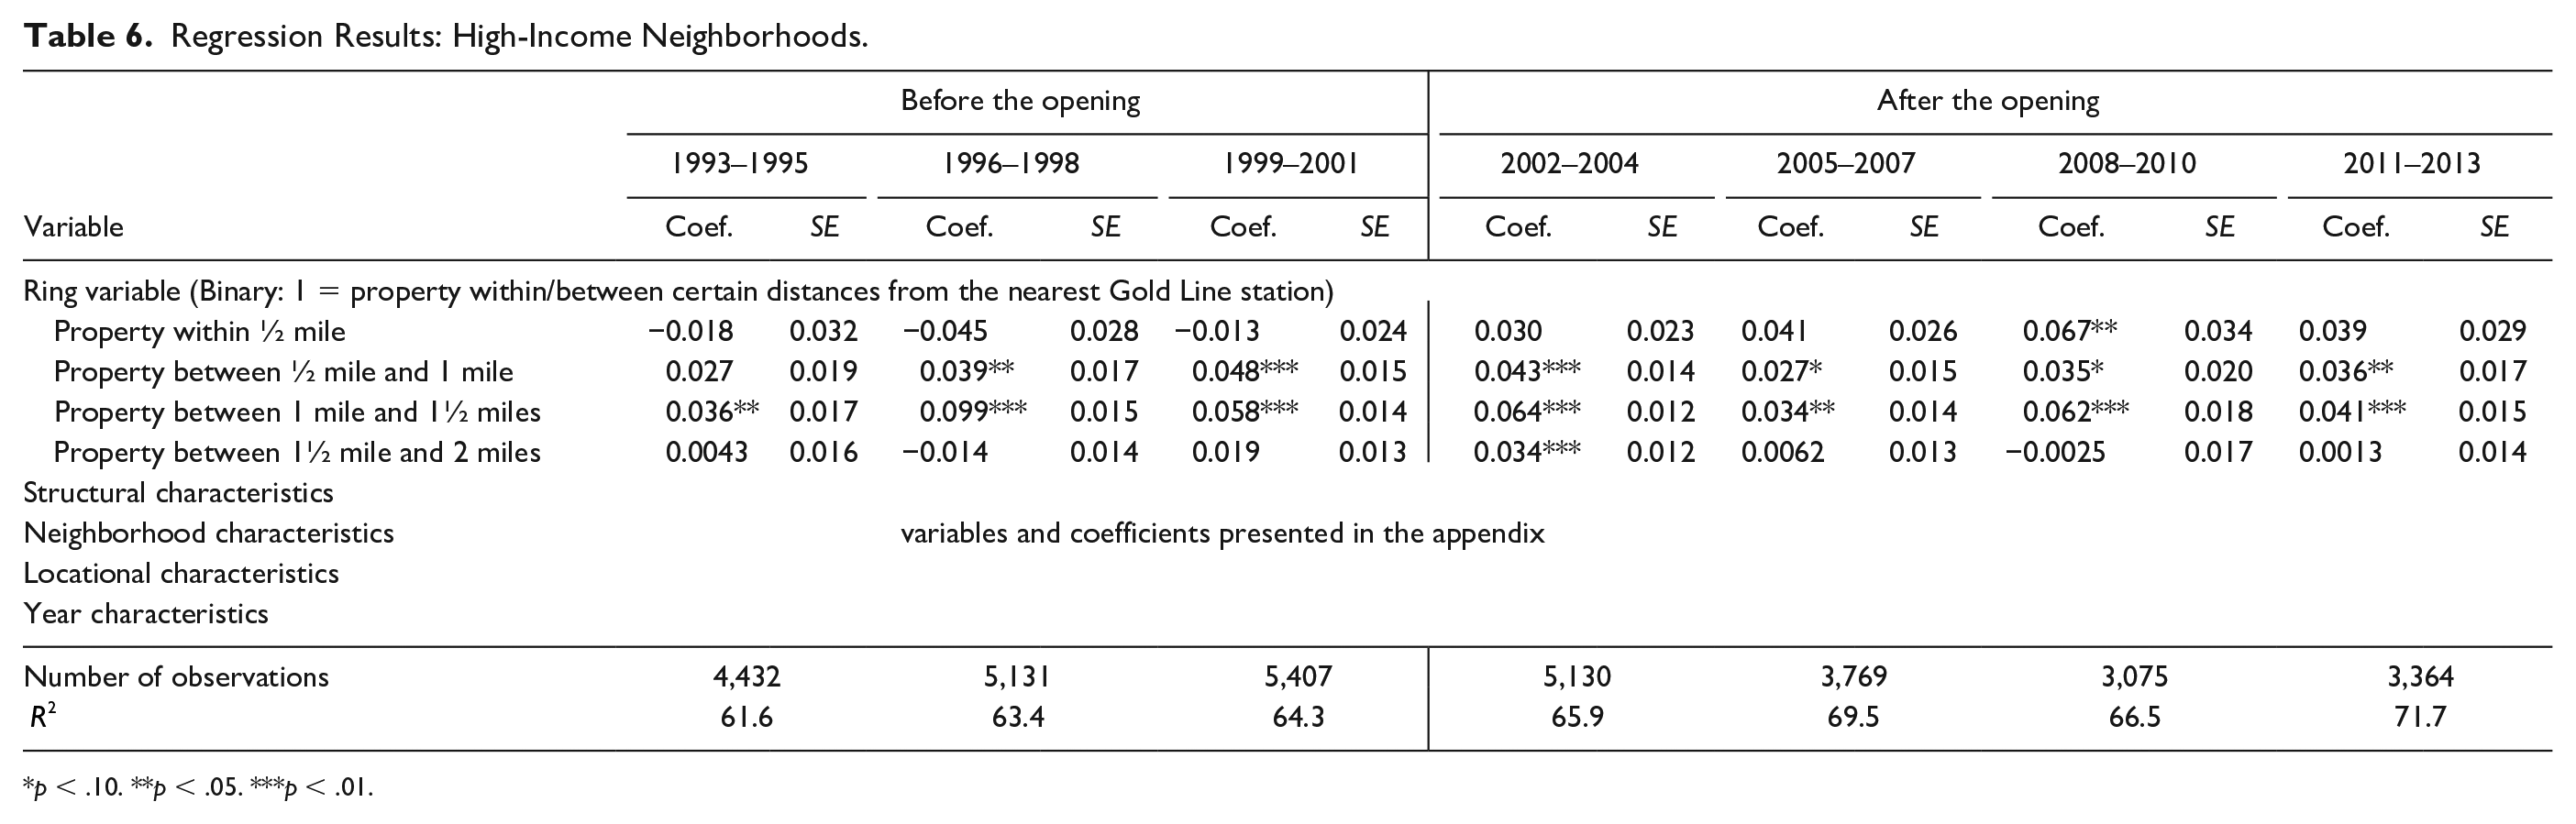
p < .10. **p < .05. ***p < .01.
Coefficients of ring variables: High-income neighborhoods.
To compare the neighborhoods, we interpret the result of each ring variable. The coefficients of properties within ½ mile present statistical significance within the low-income neighborhoods but not in other neighborhoods. In the low-income neighborhoods, the stations had positive impacts on housing values, switching from negative (−6.6%) to positive (11.0%) for locating within a ½-mile radius. The results indicate that low-income neighborhoods within walking distance, ½ mile radius, are more impacted by the light rail stations than those in other neighborhoods. The lowest negative impact of 6.6 percent in 1999–2001 may be due to the construction causing traffic and noise. After the opening, the positive impact increased, and it peaked during the last period, 2011–2013. The Gold Line extension from Union Station to Eastside in 2009 may have caused an increase in 2011 to 2013. It also indicates that residents appreciate the light rail stations more as the system stabilizes. Another possibility is that low-income neighborhoods within a ½-mile radius of the stations were experiencing gentrification. The market likely found development or redevelopment opportunities in those areas with lower property values and good accessibility to public transportation. This also explains the insignificant coefficients of middle- and high-income neighborhoods.
For properties ½ to 1 mile from the stations, those located in the low-income neighborhood experienced an increase in the housing premium. However, we observed no increasing or decreasing trend from those located in middle- and high-income neighborhoods. The impact had been positive regardless of the opening of stations. The results for properties between 1 mile and 1½ mile are similar to properties between ½ mile and 1 mile. The impact had been positive in the middle- and high-income neighborhoods across all periods, but in low-income neighborhoods, the impact increased from negative 5.6 percent to positive 4.0 percent. This may be due to the mobility of the residents. For the residents in middle- and high-income neighborhoods, mobility is less limited without public transportation. A higher ownership rate for a personal vehicle provides them with more transport options. As they can commute using their private vehicle, their residence apart from major intersections and thoroughfares but close enough to get to ½ mile to 1½ mile from the stations possesses premiums over properties in the other distance bands regardless of the light railways. This explains the constant positive association throughout the entire study period irrespective of the light rail stations.
In the furthest ring, 1½ mile to 2 miles, properties in the low-income neighborhoods experienced an increase after the opening. After 2008, however, the coefficients are statistically insignificant. For properties in the middle- and high-income neighborhoods, the coefficients are insignificant throughout the entire study period except for the positive impact in 2002–2004, including the opening in 2003. This indicates that middle- and high-income neighborhoods expected a premium from the Gold Line railway stations. However, the market did not respond since then. Generally, in all distance bands, properties in the low-income neighborhoods benefit from the stations’ opening. Notably, the properties adjacent to or close to the stations have experienced increasing and more significant premiums since the opening. This may mean that reliable public transportation means like light railways are appreciated in low-income neighborhoods with limited commuting options. But, it can also mean that the area is being gentrified.
Conclusion
The light rail transit systems have been adopted to provide commuting options for metropolitan areas. They have also been expected to invigorate the region’s economy, and their success depends on accessibility, reliability, user cost, and the condition of maintenance. This study uses an innovative analytical approach to investigating the property value impacts of rail transit by considering the longitudinal assessment and heterogeneity in the results depending on neighborhood socioeconomic status. This study finds that their property value impacts were generally positive, consistent with several previous studies (Mohammad et al. 2013). This study reveals that the impact dynamics were significantly moderated by different sociodemographic characteristics of new transit corridors, especially income levels.
Low-income neighborhoods within ½ mile of the stations experienced the largest increase in property values after the opening; in contrast, the opening of a station within ½ mile did not seem to affect property values in the middle- and high-income neighborhoods. Unexpectedly, ½ to 1½ mile from a station seems to be the Goldilocks zone for middle- and high-income neighborhoods, bringing a positive property value premium even before the station’s opening. Such findings contradict those by Hess and Almeida (2007), who found positive effects for high-income station areas and negative for low-income station areas.
Findings from this study are mixed news to policymakers who enthusiastically promote light rail transit and those concerned with the social equity perspectives of investments on transit. On the one hand, as the low-income residents tend to have strong preferences for using public transit and therefore live close to stations, it is commendable to locate the stations in more distressed neighborhoods. On the other hand, our findings release an alarming signal for the gentrification potential in the low-income neighborhoods after rail transit services become available. Such a concern echoes several previous studies (Baker and Lee 2019; Cappellano and Spisto 2014; Dong 2017; Grube-Cavers and Patterson 2015; Kahn 2007; Luckey et al. 2018; Saldaña and Wykowski 2012). While this study showed the positive impact of light rail stations on housing premiums in low-income neighborhoods spatially and temporally, it calls for further investigations on the heterogeneity in light rail stations’ impact and possible gentrification consequences. Future researchers may also consider analyzing rental prices. Renters, compared to property owners, are more vulnerable to gentrification. Also, to substantially understand gentrification and overall neighborhood change, researchers may employ socioeconomic measures using the framework of classifying low-, middle-, and high-income neighborhoods in time and space.
This study is subject to limitations to generalize the findings. The study area, the northeast of Los Angeles, is a predominantly residential area bounded by forests. In this longitudinal study, limiting the area that shares similar characteristics was advantageous to control for externalities over the years. This condition, however, limits us from generalizing the results in other settings. Further longitudinal research on the impact of light railways in different settings and other land uses will provide a more comprehensive understanding of light railways’ impact. Also, there are methodological limitations in the study. The control variables derived from the 2000 Census are cross-sectional data, and we could not incorporate the changes in neighborhood attributes such as income, race, and age. The study period of twenty-one years includes two Census periods. We chose Census 2000 considering the goal of this study, revealing heterogeneity in the impact of light rail stations. We fixed the neighborhood before the opening and tracked the changes over time. As the Census data at the block group level are not continuous, not being able to incorporate changes over time is a limitation in this longitudinal study. Finally, we add to the methodological discussions on how to appropriately specify hedonic pricing studies for long-time-span housing. We compared our results with their counterparts from spatial autoregressive models and did not identify considerable differences. This might be due to the fact that we introduced several neighborhoods and locational variables along with the ring variables. All these factors led us to believe that hedonic modeling with several longitudinal periods best fits this study’s purpose. Future studies might still need to do some comparisons to ensure the robustness of results.
Footnotes
Appendix
Declaration of Conflicting Interests
The author(s) declared no potential conflicts of interest with respect to the research, authorship, and/or publication of this article.
Funding
The author(s) received no financial support for the research, authorship, and/or publication of this article.