
Abstract
Conventional urban park categorizations often rely on size, environmental characteristics, and historical background, ignoring visitor characteristics due to a lack of empirical data. This study uses mobile phone data and distance-based cluster analysis to classify eighty-five urban parks in Tokyo, revealing four distinct categories based on visitor behavior, particularly home-park distance and visit frequency. The new categories revealed that proportions of visitor types varied considerably across the sample parks. There also existed notable mismatches between the administrative categories and the newly derived categories. Furthermore, the findings imply that non-uniform park management strategies, not limited by conventional park categories, are needed.
Introduction
Existing classifications of urban parks are often based on size, environmental characteristics, and historical background of the parks, assuming connections exist between such classifications and the target visitors of parks. Especially in small- to medium-sized urban park planning, conventional wisdom mostly assumes that residents living in adjacent neighborhoods are the main group of visitors (Ren et al. 2022; Veal 2013). The targeted visitors may not be clearly visible in the official park categories, except for certain types of open space designated for special use such as children’s playgrounds (Loukaitou-Sideris et al. 2016). Yet, in the legal documents or other guidelines supporting categorization of parks, we can find direct or indirect statements regarding the assumed target visitors of different park categories in the system.
However, the assumed connections between current categorizations of urban parks and their target visitors are hardly outcomes of careful observation and empirical studies on actual park visitors. Rather, they are in most cases remnants of theoretically ideal urban form and structure suggested approximately a century ago (Veal 2013). There are many reasons why these practices have stayed for a long time, including difficulty of large-scale data collection on park visitors and their characteristics.
Considering actual park usage in park classification is crucial because administrative classifications often overlook how parks are used in reality (Jaung and Carrasco 2021). Ignoring detailed visitor data can lead to mismatches between park facilities and user needs, resulting in underutilized spaces or overcrowded areas, inefficient resource allocation, and a lack of responsiveness to changing urban dynamics (Ren et al. 2022). Consequently, park planning that relies on conventional classifications without empirical data can limit the potential benefits parks offer to communities, such as physical activity, social interaction, and mental well-being.
This study aims to fill the research gap by comparing the existing classification system with new categories derived from visiting behaviors of actual park visitors. First, we suggest different groups of park visitors defined by the number of visits and the distance between the park and their home locations. Then we use the percentages of the three visitor groups as the variables to find clusters among the eighty-five sample parks. Comparing the existing system with the results of our analysis, this study illustrates the gap between the assumed and actual visitors of urban parks and discusses potential ways to make park planning and management more visitor friendly and to better serve park visitors.
Literature Review
Urban Park Planning Principles and Classification System of Tokyo
Park planning and neighborhood design are closely associated. They have been shaped by incorporating various planning ideals and responses to actual situations throughout the late nineteenth century and the early twentieth century (Ishikawa 2001). For example, the concept of Neighborhood Unit infiltrated planning communities in a number of regions of the world, neighborhood parks became part of necessary amenities in neighborhood plans (Veal 2013). Today, park planning guidelines often suggest walking distances, normally 400 to 500 m or fifteen-minute time radius, to be a criterion of neighborhood park provision (Guan and Zhou 2024).
Park planning in Japan is not an exception. The 1972 Park Enhancement Plan set up a hierarchical order of urban parks based on neighborhood units, or kinrinjyuku (in Japanese近隣住区), which is the primary spatial unit defines smaller and larger modules by division or multiplication. Chiku (in Japanese地区) is a higher module of kinrinjyuku, encompassing four kinrinjyukus. Each kinrinjyuku is recommended to be approximately 1 km by 1 km, of which population is approximately 20,000 (Committee for the Publication of “Urban Parks in Japan” [CPUPJ] 2005, 67). A kinrinjyuku is supposed to have one kinrin park, or a neighborhood park as translated, serving the kinrinjyuku. Then there are chiku parks, or district parks, one per chiku. The City Park Act, first enacted in 1956 and applied to the whole nation, provides and regulates the standards of these parks (CPUPJ 2005, 32).
Tokyo’s park planning system includes various categories of parks created and managed on different legal bases (Shin 2004, 192–93). Tokyo is divided into twenty-three special wards (in Japanese特別区), each with its own local government functioning similarly to cities (Tokyo Metropolitan Government [TMG] n.d.-a). The average size of a ward is approximately twenty-three square kilometers, but this varies widely. For example, Ōta Ward covers about sixty-one square kilometers, while Taito Ward covers about ten square kilometers. Each ward comprises multiple chiku, with the number of chiku varying depending on the size and population of the ward. On average, a ward can encompass around two to nine chiku (TMG n.d.-b). Each ward has established ward-level ordinances to facilitate park provision and management, responding to specific needs of the ward. For example, the park ordinance of Setagaya Ward aims to provide six square meters of urban park space per resident and grants the mayor of Setagaya a series of authorities regarding creating, regulating, and managing ward-level parks. Katsushika Ward, with slightly different goals, has a similar ordinance as well. These ordinances provide similar guidelines on the size of parks and target users to those in the City Park Act.
Tokyo has two primary types of parks at the ward level, ward urban parks and ward parks, each governed by different ordinances. Ward urban parks are regulated under the City Park Act and are typically larger parks serving broader community needs, often including amenities for various recreational activities. In contrast, ward parks are smaller, community-focused spaces governed by ward-level ordinances or the Child Welfare Act, tailored to the specific needs of local residents (Shin 2004, 224–25; TMG 2021).
At the metropolitan level, TMG has its own ordinance to create and operate TMG parks, or toritsukoen (in Japanese都立公園). Historically, TMG has transferred management rights and responsibilities of many TMG parks to ward governments as importance of local governance increased (Shin 2004, 200). The current ordinance states that the location of a new TMG (n.d.-c) park should consider the overall distribution of urban parks in the boundary of Tokyo and aim to balance different functions of those parks within Tokyo (see Note 1 in Supplemental material).
Park Visitor Groups and Their Behavioral Characteristics
Urban park visitors include hugely diverse groups of people not only in terms of basic demographic profiles (i.e., gender, age, race) but also in terms of other characteristics such as travel distance to a park. There is a considerable amount of literature on the connections between basic demographic profiles and how they use parks or what they want from park visits (Loukaitou-Sideris et al. 2016). For example, females and males showed differences in the preferences toward park landscape and amenities, in the desired benefits, and in the patterns of company (Sanesi and Chiarello 2006; Schipperjin et al. 2010). In terms of age, different stages of life were also related with changes in what people mainly sought from nature and green spaces (Payne, Mowen, and Orsega-Smith 2002). Also, notable is that many of the older adults did not visit a park in the survey of Payne, Mowen, and Orsega-Smith (2002) due to the disadvantages in mobility.
Unlike the aforementioned demographic profiles, there is little research on links between other characteristics of urban park visitors and their preference or behavior. Below, we present some findings from the existing literature looking at home-park distance and repeated visits, the foci of this study. Sanesi and Chiarello (2006) revealed that high percentages of working citizens (66.7%) and students (62.5%) looked for relaxation while they stayed in the park, compared to other recreational and social functions. Although this study did not directly point out where the working citizens and students were from, it is reasonable to assume that they visited the park because it was close to their working or studying places. More recently, Song and Shim (2021) contrasted “tourists” and “neighborhood residents” in their study on visitors of a park. They argued that there was a higher proportion of “Activity Seekers,” who value “Amenity,” “Atmosphere,” “Outdoor activity,” and “Therapeutic” relatively more than “Local Culture,” “Community,” “Spirituality,” “Wilderness,” and “Environmental Learning,” among tourists than among neighborhood residents. Furthermore, 48.7 percent of tourists visited once or twice per year, while 17.8 percent of residents did so. What both studies indicated is where park visitors come from is related to the activities and values that they are looking for at the park.
Newly Available Data for Investigating Park Visitor Characteristics and Behaviors
One path which enables more in-depth studies on park visitor characteristics and behaviors is the use of so-called “big data” such as information from social media and digital devices. Recent years numerous newly available social media data has been applied to study urban park visitation across various geographical locations. For example, Donahue et al. (2018) compared Flickr and Twitter data with traditional surveys administered by agency survey estimates over 1,500 urban parks in Twin Cities, MN. They summarized the factors affecting frequency of park visits for both local residents and visitors include landscape, surrounding neighborhood attributes, and accessibility. In a different context, Li et al. (2020) used Weibo check-in data to study the use of 13,759 parks located in 287 at prefecture level cities in China. They established positive associations between points of interest (POIs) and bus stops with the density of check-in visits. They also found that larger service areas and the landscape shape index (LSI) showed a negative association with park usage. Similarly, Chen et al. (2018) integrated emerging big data to measure the use of green space. The provided hourly real-time Tencent user density (RTUD) data of 3.25 million users in 686 urban parks in Shenzhen. They argued that sensor and positioning technologies provided a cost-effective alternative to “costly and laborious” field investigation. Lyu and Zhang (2019) utilized geospatial data to measure the visitation of fifty-seven urban parks in Wuhan. They compared the Baidu heat map with Weibo check-in data and found the former is more accurate. They also found that the surrounding environment features played a more important role than park attributes.
In recent years, mobile phone data has also become an important source for park studies. If properly calibrated, high-resolution in time and space of the mobile phone data can generate new chances for advancing human nature interactions (Merrill et al. 2020; Ren et al. 2022). In Japan, Guan et al. (2020) studied visitation of thirty parks in Tokyo using 1.2 million anonymous smart phone users. They found the highest user density right around the vicinity of parks regardless of park surface area and function. In Singapore, Jaung and Carrasco (2021) applied mobile phone data to identify weather impacts on urban green space. They argued that temperature has a stronger impact on the number of visitors and how long they stay in a park, compared to other weather conditions including wind and rainfall, agreeing that higher temperature will reduce visitor stay time.
Despite these advancements in park visitation research using various data sources, two significant gaps remain in the literature. First, while existing studies have documented overall park usage patterns, they rarely differentiate between visitor types and their distinct behavioral characteristics. Second, there is limited understanding of how travel distance and visit frequency patterns relate to park usage, particularly in the context of existing park classification systems. This study addresses these gaps by analyzing actual visiting behaviors to identify distinct visitor groups, offering new insights that could complement traditional park classification approaches which are primarily based on administrative and physical characteristics.
Data and Method
Sample Parks, Estimation of Park Visitors, and Their Home Locations
The study area is the twenty-three inner wards of Tokyo, Japan. Among the over 5,000 designated parks, we selected eighty-five parks, which include thirteen TMG parks, sixty-six Ward Urban parks, and six Ward parks. This selection was guided by both the administrative classification system and a size constraint, ensuring a representative sample of parks. The chosen parks have surface areas between three and ten hectares, aligning with the recommended size range for “district parks” in the Japanese park system. However, our sample includes parks from various administrative categories, highlighting the diversity within this size range (Park Foundation Park Management Operation Research Center [PFPMORC] 2016, 290). Supplemental Figure A1 shows the location of the parks. They are distributed across all twenty-three inner wards. The list of the parks can be found in the Supplementary material (Table A1).
Park visitors and their home locations were estimated through mobile phone GPS data. The mobile phone GPS data are fully anonymized for security reasons but it is possible to retrieve two aspects of park visitors, home-park distance and visit frequency, without identifying any other demographic information (Guan et al. 2020); see Note 2 in Supplemental material.
The estimation of where park visitors lived and the parks they visited throughout the year was performed. Batch processing of mobile phone location data using the Data Warehouse Package (DWP) to derive stops was done. DWP is a central repository for data analysis and integration of data from multiple disparate sources. The stay point extraction algorithm is based on the spatiotemporal values of points (Akiyama, Horanont, and Shibasaki 2013). In the procedure, a stay point denotes a geographic zone where a user stays for a period of time. Spatial distances and temporal differences between observation points are used as criteria to detect stay points, where the maximum distance covering a location and the minimum time users spend at the same location are constraints (Akiyama, Horanont, and Shibasaki 2013). We identified park visitors as those who stayed in the park for more than five minutes. Under optimal conditions without the presence of obstacles, the accuracy error is controlled to a minimum of fifteen meters (Guan et al. 2020). However, various factors, such as the presence of high-rise buildings, dense tree cover, and weather conditions, can affect this accuracy. In areas with many tall structures, the error can increase to around thirty meters or more.
To estimate visitors’ home locations, we analyzed regular overnight GPS signals. A consistent presence between 8 p.m. and 7 a.m. for at least four nights a week over more than half the year was used to indicate a residential location (Guan and Zhou 2024). This method allowed us to estimate the travel distance from home to the park for each visitor. The processed GPS data focused on identifying primary residences and did not include visitors who lacked a consistent overnight presence.
Identifying Visitor Types
We identified different visitor groups with the combination of two important properties, estimated home location and number of visits during a year (Note 3 in Supplemental material). To ensure our thresholds are generalizable beyond Tokyo, we based our distance categories on the percentile distribution of travel distances in our dataset. The first group, neighborhood residents, includes people who live within four kilometers of a sample park, corresponding to the 10th percentile of all observed travel distances. This distance aligns with the typical cycling range in Tokyo and previous studies on park catchment areas (Guan et al. 2020).
The second group, regular visitors, consists of those whose home is more than ten kilometers from a park (corresponding to the 25th percentile of travel distances) and who visited the park more than four times a year. According to commuting statistics of the Tokyo metropolitan area, the mean travel time to work was forty-three minutes in 1998 and forty-eight minutes for men and thirty-seven minutes for women in 2008 (Kawabata and Abe 2018; Kawabata and Shen 2006). For example, commuting from Setagaya station to the Toranomon area in Tokyo by public transportation takes approximately forty to fifty minutes, covering a Euclidean distance of about ten kilometers (Google n.d.). Setagaya is a representative residential area, while Toranomon is at the heart of the central business district. Moreover, if one comes from a suburban area or comes by car, the commuting distance will be longer for the same commuting time. It is a common understanding that a large proportion of workers in the Tokyo metropolitan areas commute more than ten kilometers to work. Thus, the ten-kilometer threshold aligns with these commuting patterns, capturing the typical distance workers or students travel daily.
The third group, annual visitors, includes individuals who visited a target park once a year from more than twenty kilometers away, representing the 50th percentile of travel distances in our dataset. This group mainly consists of tourists visiting for seasonal or annual events. We chose the twenty-kilometer threshold to capture long-distance visitors, as it typically exceeds the local catchment areas of most urban parks and represents a significant travel commitment, indicating a purpose-driven visit rather than casual use. However, this group might also include visitors with other purposes. Table 1 is a summary of the criteria for the three visitor types.
Potential Title and Characteristics of the Three Types of Park Visitors.
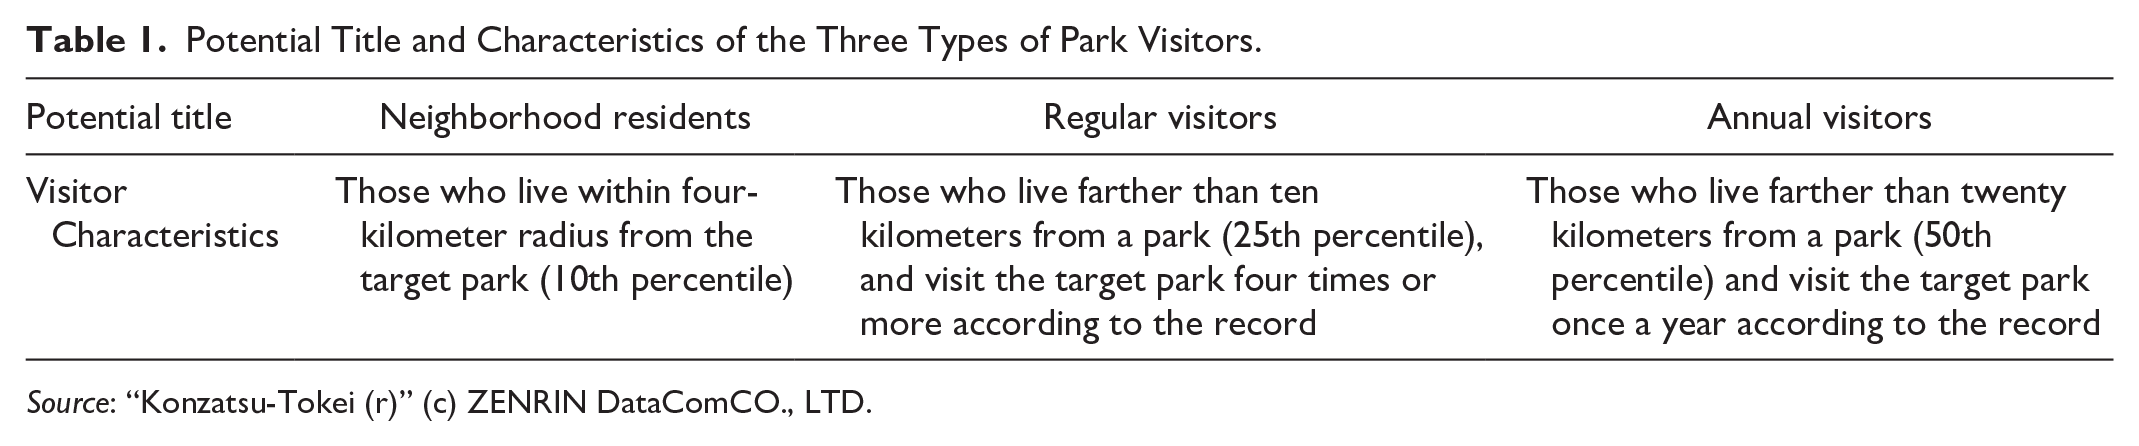
Source: “Konzatsu-Tokei (r)” (c) ZENRIN DataComCO., LTD.
New Clustering of the Sample Parks and Comparisons of the New Clusters with Other Classifications
Using the percentage distribution of the three visitor types identified above (neighborhood residents, regular visitors, and annual visitors) as variables, a distance-based cluster analysis was conducted. The percentage values for each visitor type were calculated relative to the total number of visitors per park, ensuring the variables reflected the proportional composition of visitors rather than absolute numbers. We employed the hierarchical clustering method using the average linkage (between groups) method to compute cluster distances. This approach calculates the average distance between all pairs of objects from two different clusters, which helps in identifying clusters that are more homogeneous internally. We generated dendrograms to visualize the clustering process and examined solutions with up to ten clusters. To determine the optimal number of clusters, we assessed the dendrograms alongside additional analytic outcomes such as the silhouette coefficient, which measures the quality of the clustering by evaluating how similar each point is to its own cluster compared to other clusters. Based on these assessments, we selected the number of clusters that would lead to realistic and meaningful categorization was selected. Then the visitor profiles of each cluster of parks from the analysis is examined and general characteristics of the new park categories are explained and summarized.
We then mapped the four park categories found through the clustering process and compared the new categories with the existing administrative categories. This comparison is to disclose the gap between who are the assumed visitors in the planning laws and guidelines and which types of people visit the parks in reality. Additionally, we provide analysis of total visit volume to examine whether total visit volume is the factor driving this new categorization.
Results
Summary Statistics of Visitor Type Proportions
Supplemental Appendix Table D1 shows the overview of visitor and visit patterns of all parks. It is noteworthy that the variation in the percentage of the mobile phone IDs with no estimated home locations is relatively small. On average, 83.64 percent of the IDs recorded have estimated home locations while the standard deviation of the percentage is 2.68. At least 71.94 percent of the IDs are linked to estimated home locations in the sample parks. These numbers offer evidence that the following discussions and implications are not likely to be biased due to the missing data issue.
Among all park visitors, on average, 37.60 percent were categorized as neighborhood residents. This was lower than our expectation as most of the sample parks were considered as parks for those who live nearby, either in a neighborhood unit or in a district defined by planners. The highest percentage of neighborhood residents was approximately 70 percent, which was reasonable as some of the parks were used mainly by residents living closely, but it means that there were still a considerable percentage of park users coming from farther locations. Regular visitors accounted for 13.34 percent on average. While 13.34 percent is not an ignorable proportion for park planning and design, in the maximum case, the proportion reached almost 30 percent. On average, approximately one-fifth of the visitors were categorized as annual visitors. There were considerable variations in it as well, indicated by a standard deviation of 9.83. In the extreme case, Annual visitors accounted for 44.43 percent of all visitors. These wide spectra of visitor composition led to interesting outcomes of clustering, presented in the following section.
New Categories of Parks from the Cluster Analysis
Cluster analysis gave us substantially meaningful results, as shown in Supplemental Figure A2, four different clusters having distinct combinations of ranges from the three variables (Note 4 in Supplemental material). Comparing three and four practically meaningful clusters, we found that the additional cluster in the four clusters was interpretable and distinctive enough from other clusters. As we employed only three variables, models with more than five clusters are likely to be over-classification.
The first cluster is characterized by a high proportion of annual visitors accounting for 31 percent of the total visitors, as shown in Figure 1 and Table 2, cluster 1 summary. These parks still have quite a number of visitors from their adjacent neighborhoods. The second cluster, with only six parks, seems to be fully distant-visitor oriented. Forty-two percent of the total visitors are annual visitors, while only 5 percent are coming from their neighborhoods (see Table 3, cluster 2 summary). The third cluster can be tagged as “balanced.” On average, one-third of their visitors are from the neighborhoods (see Table 3, cluster 3 summary). However, this cluster still has fair proportions of distant visitors. The fourth one is clearly neighborhood oriented. More than half of the total visitors are neighborhood residents. The percentage of commuting visitors is significantly low, only 8.5 percent on average (see Table 3, cluster 4 summary).
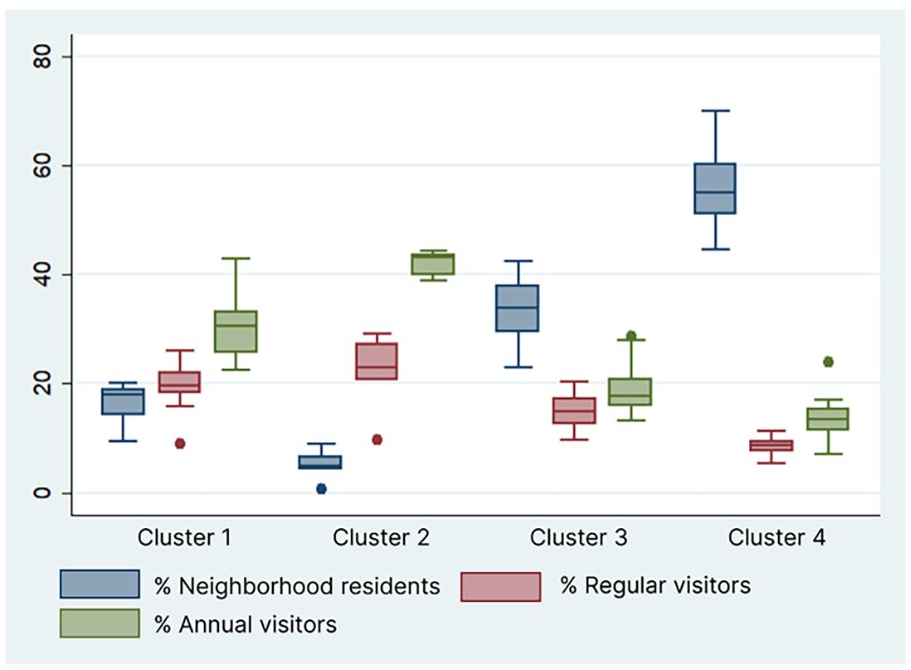
Box plot of visitor type percentages by cluster.
Summary of the Four Clusters.
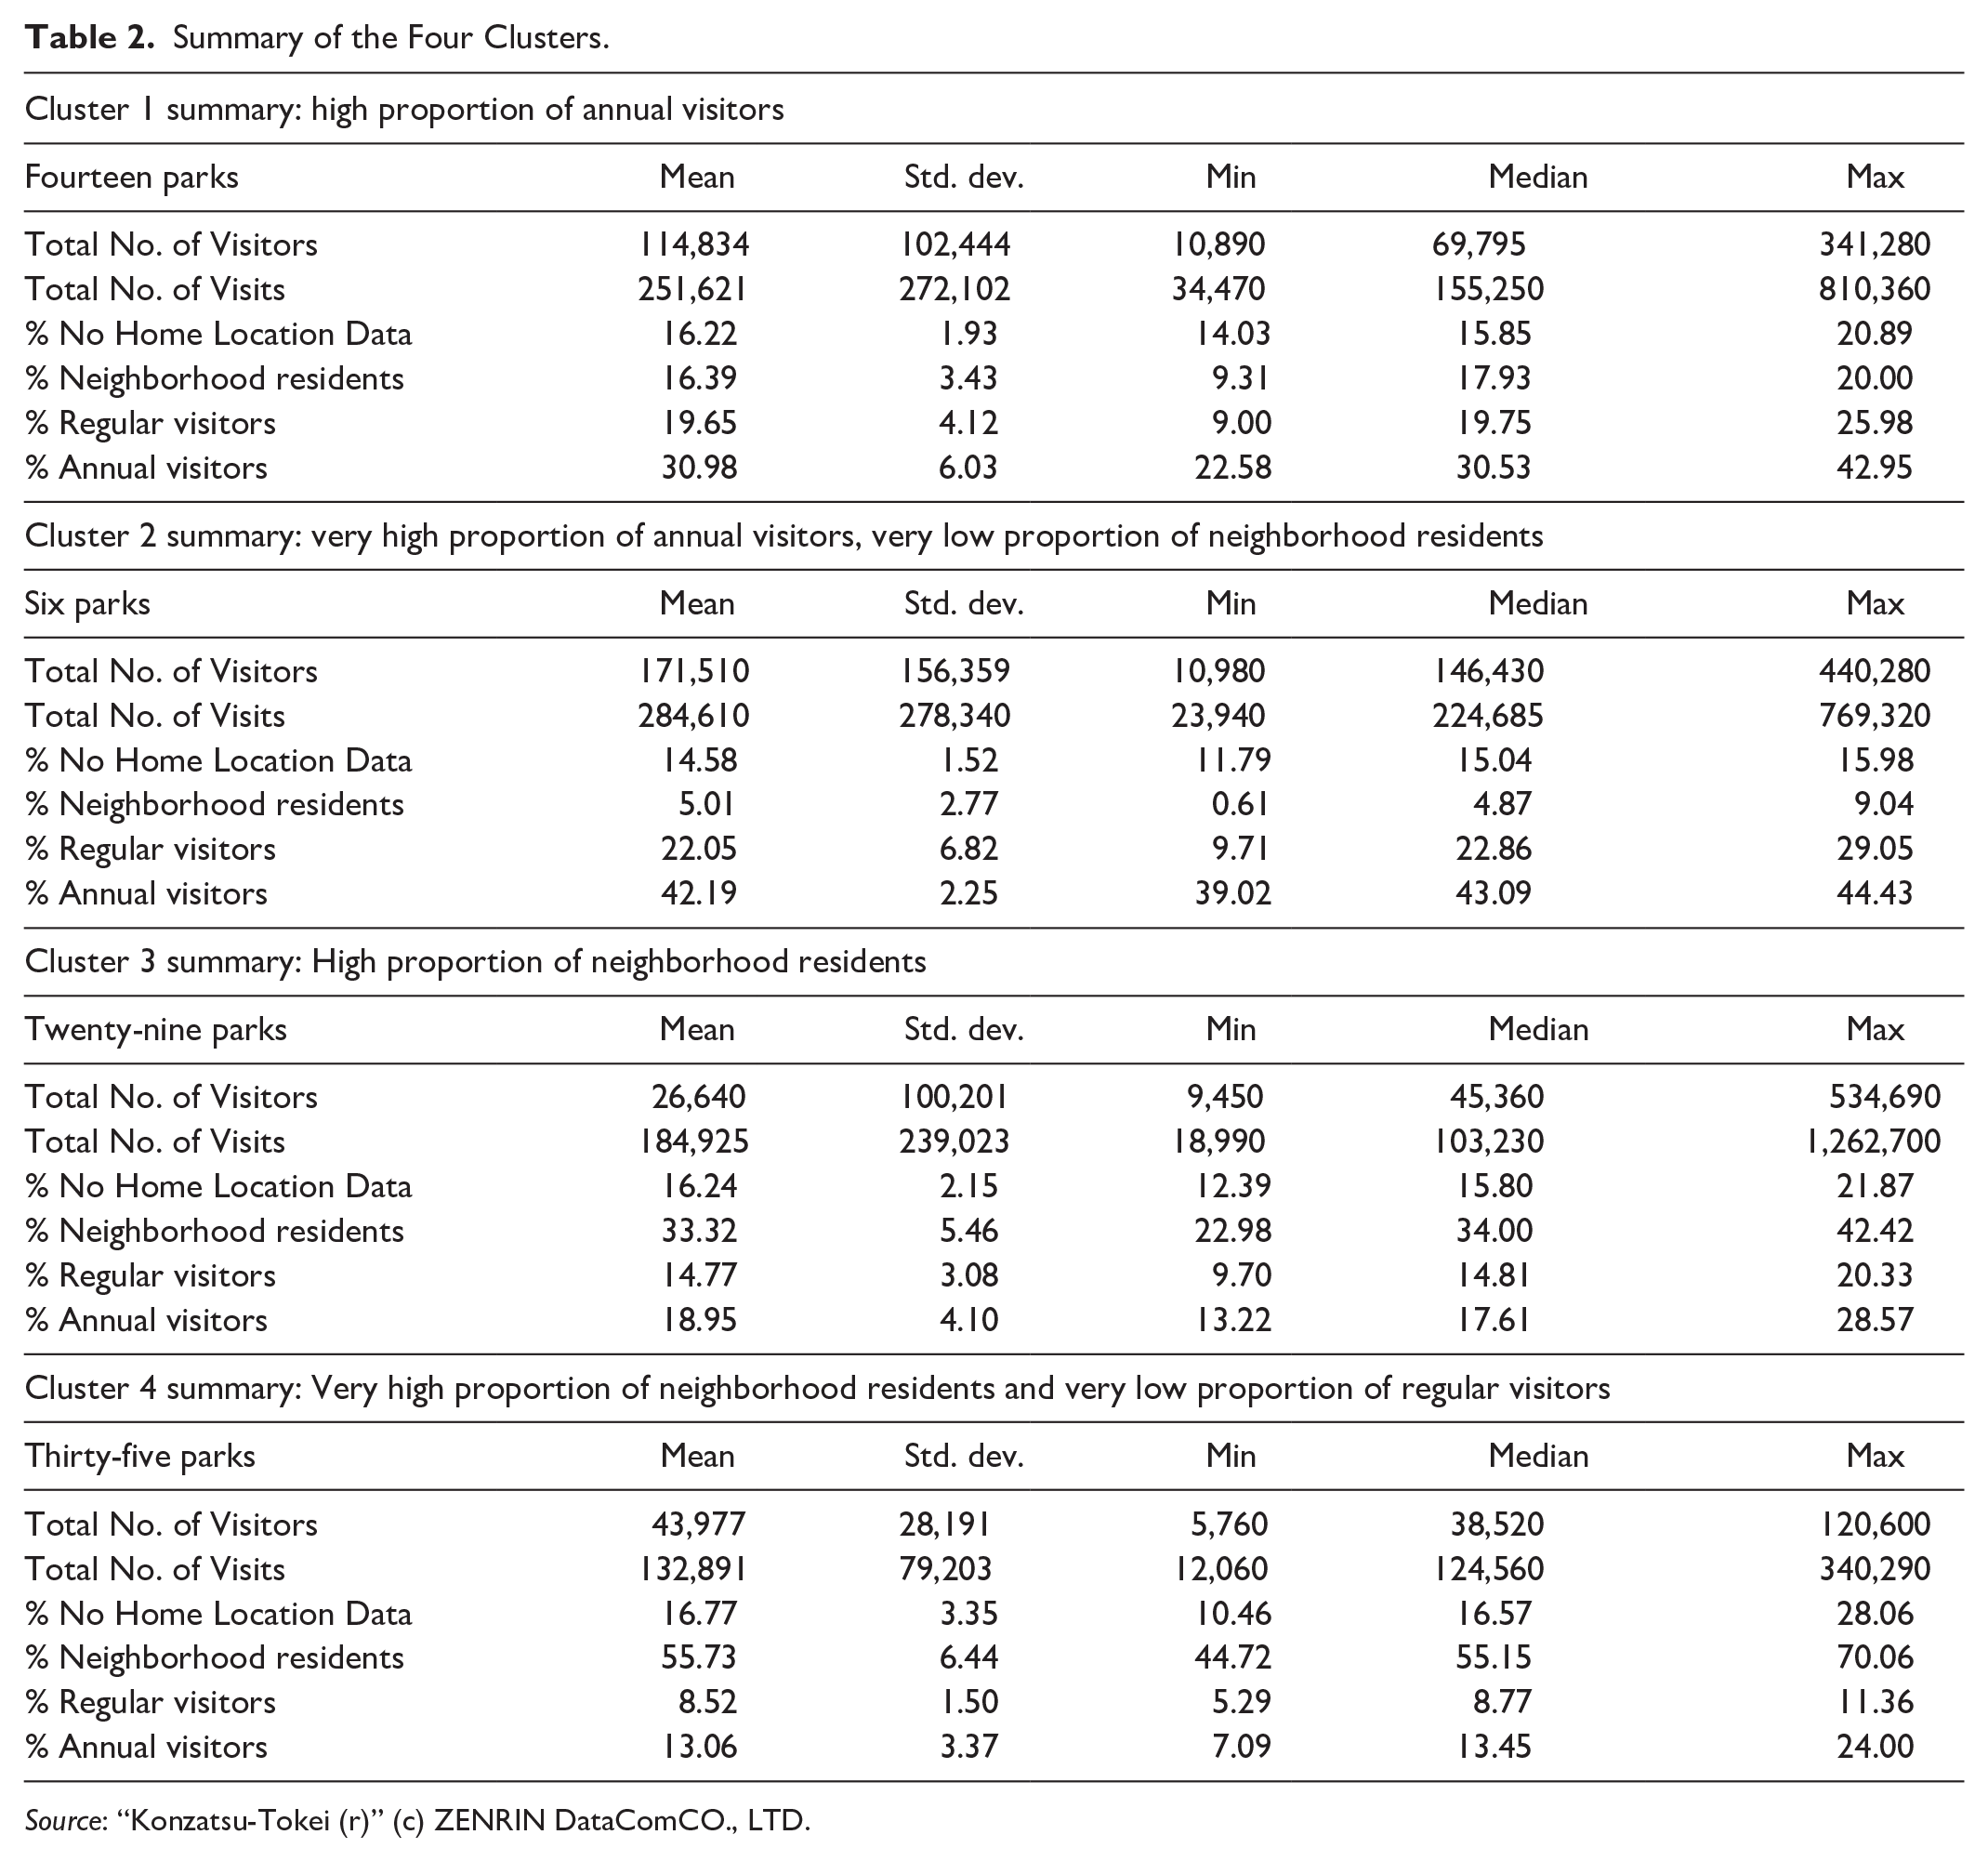
Source: “Konzatsu-Tokei (r)” (c) ZENRIN DataComCO., LTD.
Comparison of Official Urban Park Classification and the Clustering Results.
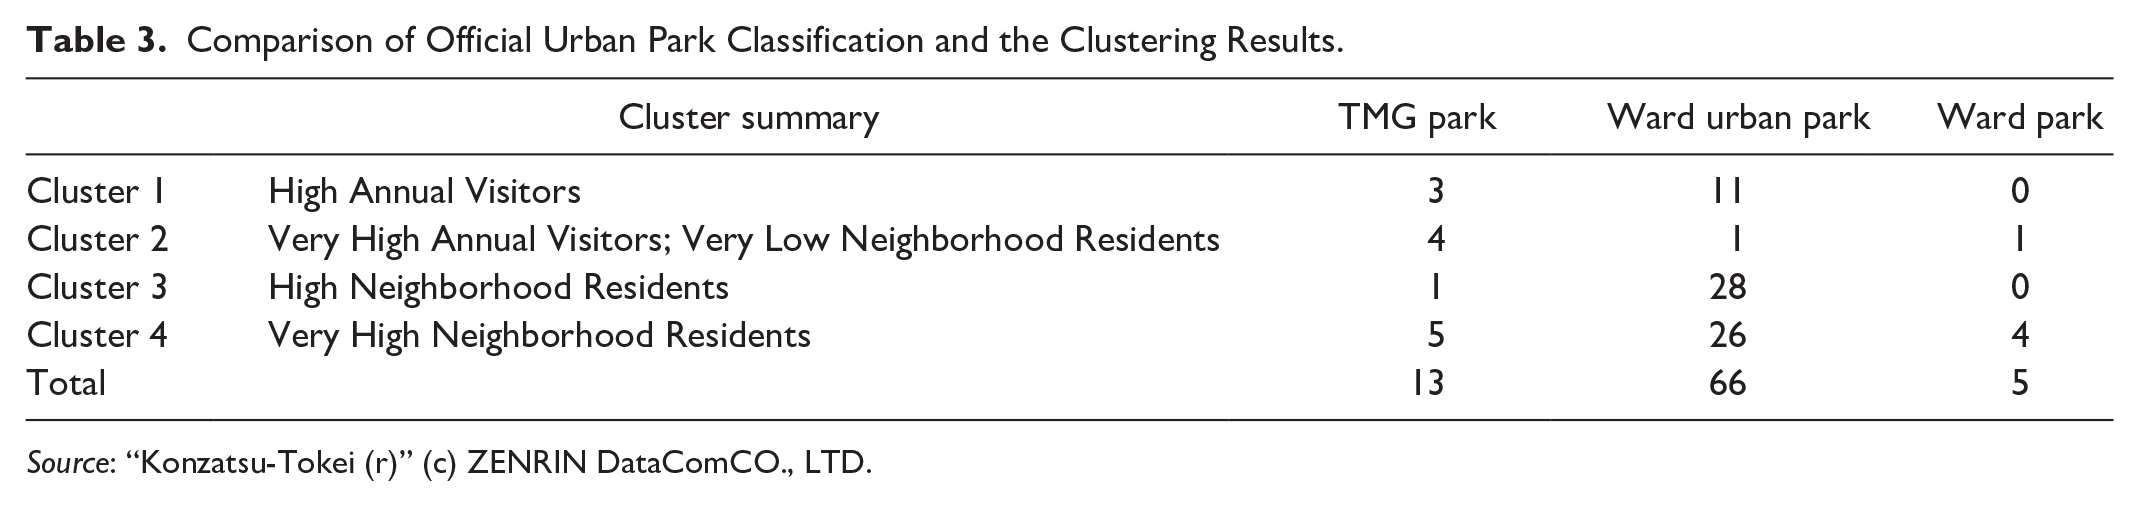
Source: “Konzatsu-Tokei (r)” (c) ZENRIN DataComCO., LTD.
The Derived Park Clusters versus Geographical Location, Administrative Categories, and Total Visit Volume
Park locations by cluster mapped in Figure 2 present sensical and interpretable results. Many of clusters 1 and 2 are concentrated in the core area, for instance, Chiyoda Ward, Shinjuku Ward, and Shibuya Ward. Clusters 3 and 4 are in general found in more peripheral areas. The core area is connected well not only to the Tokyo metropolitan area but also to almost all regions of Japan, bustling with domestic (and international) tourists. This pattern, however, is not applied to every case. Some parks in the core area are frequented mainly by neighborhood residents while some parks in peripheral areas have notably high ratios of annual visitors.
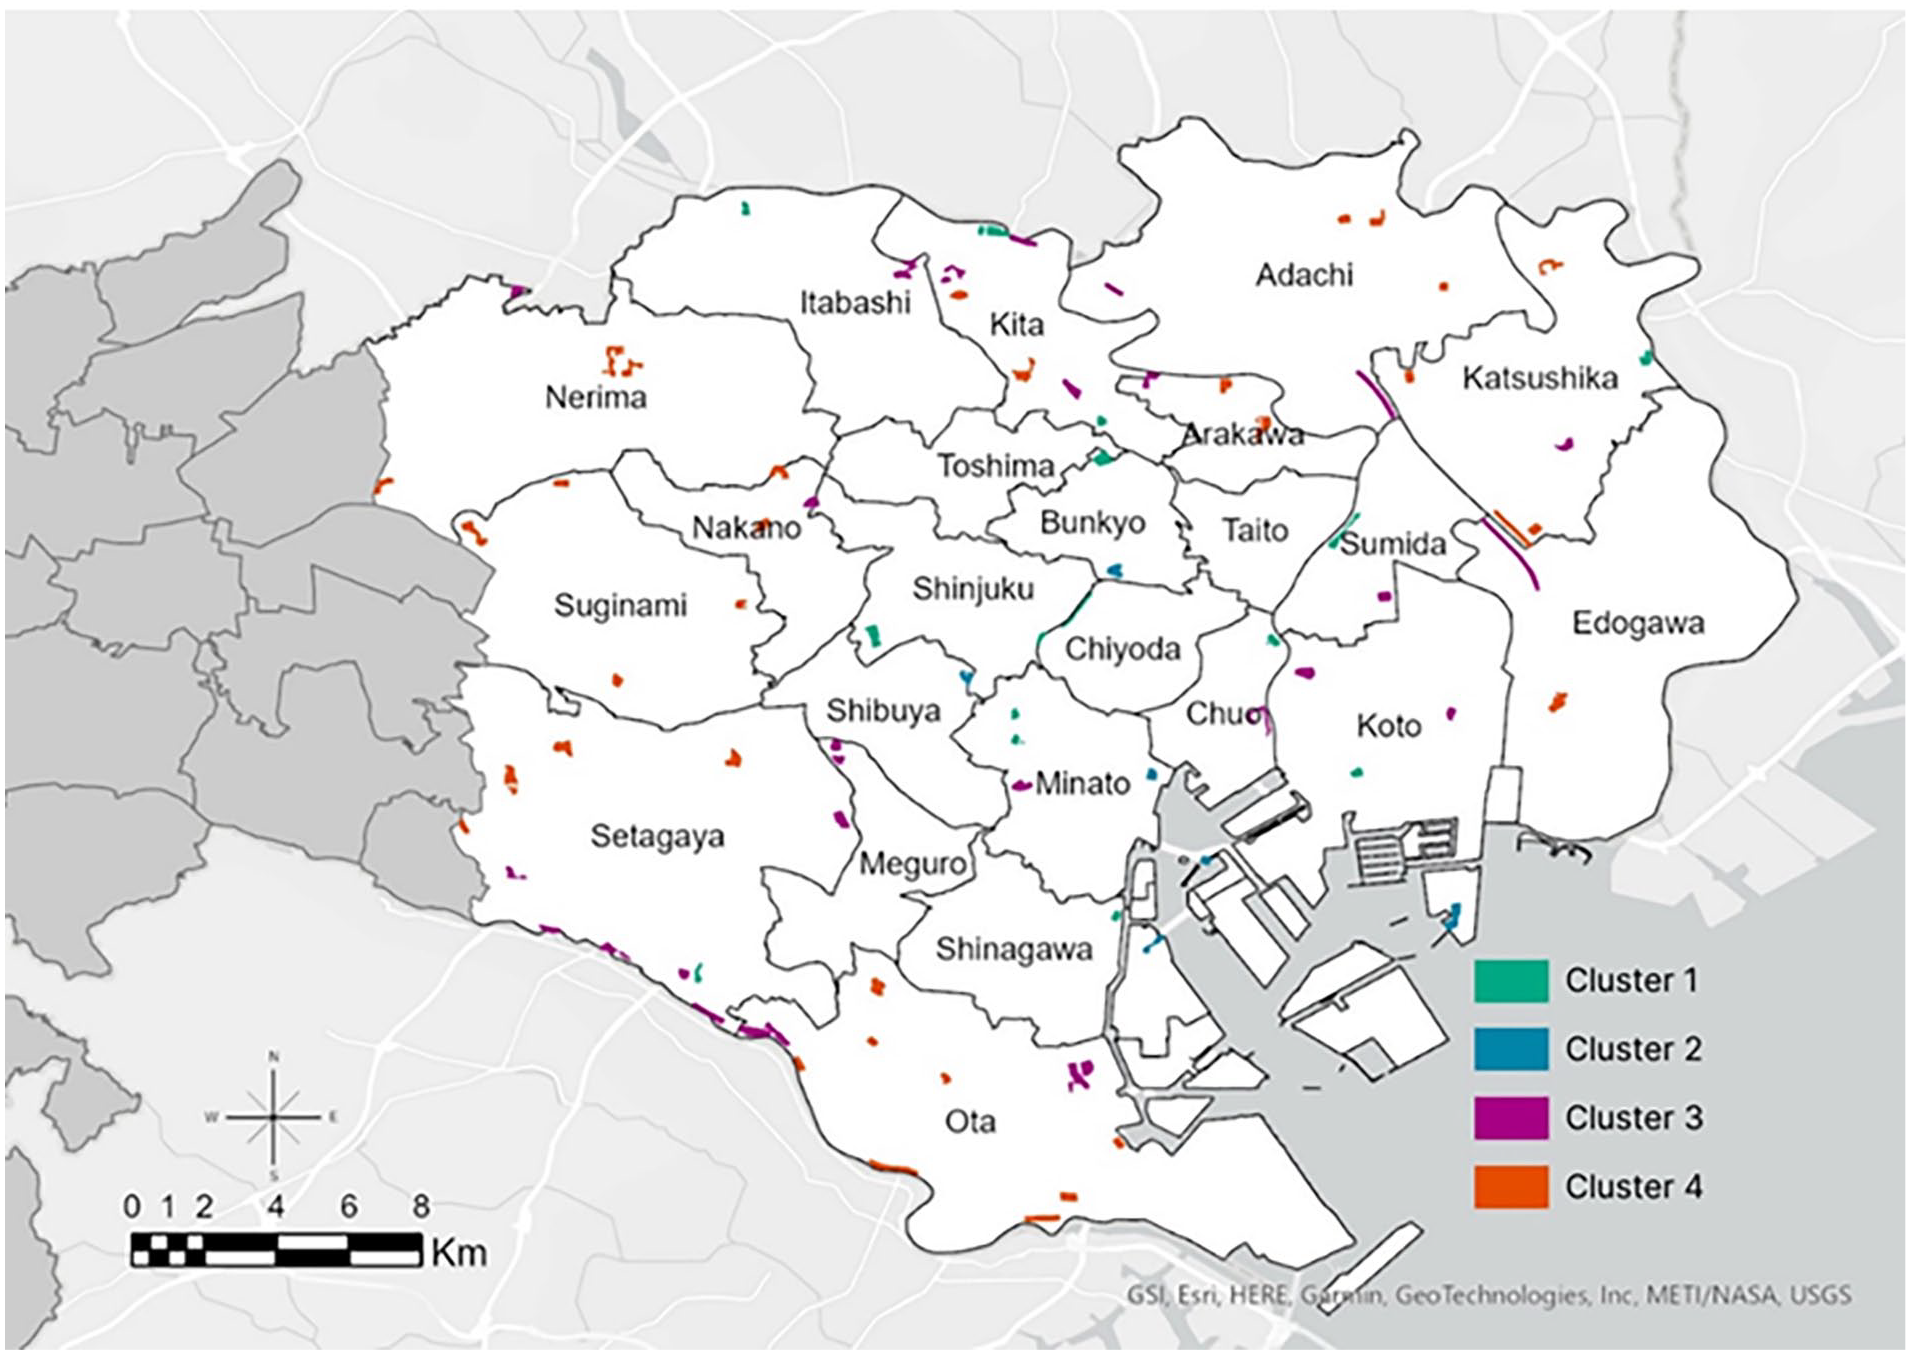
Geographical distribution of the four clusters.
Table 3 shows discrepancies between the official legal classification system and the clusters based on visitor proportions. Ward urban parks are assumed to be used mainly by nearby residents but a considerable number of those parks are visited by annual visitors from far distances. Also, some of the TMG parks are used mainly by neighborhood residents rather than attracting visitors from all over Tokyo. Notably, the five TMG parks, which are supposed to attract visitors from across Tokyo, fall into cluster 4, where neighborhood residents are the primary users. In contrast, the eleven ward urban parks fall into cluster 1, where annual visitors are the most dominant group, accounting for approximately 31 percent on average, followed by regular visitors at 20 percent. Neighborhood residents, the main target visitors of these parks, constitute the smallest group, with an average of 16 percent. This reveals that the actual visitor profiles of these parks differ significantly from the intended target audiences.
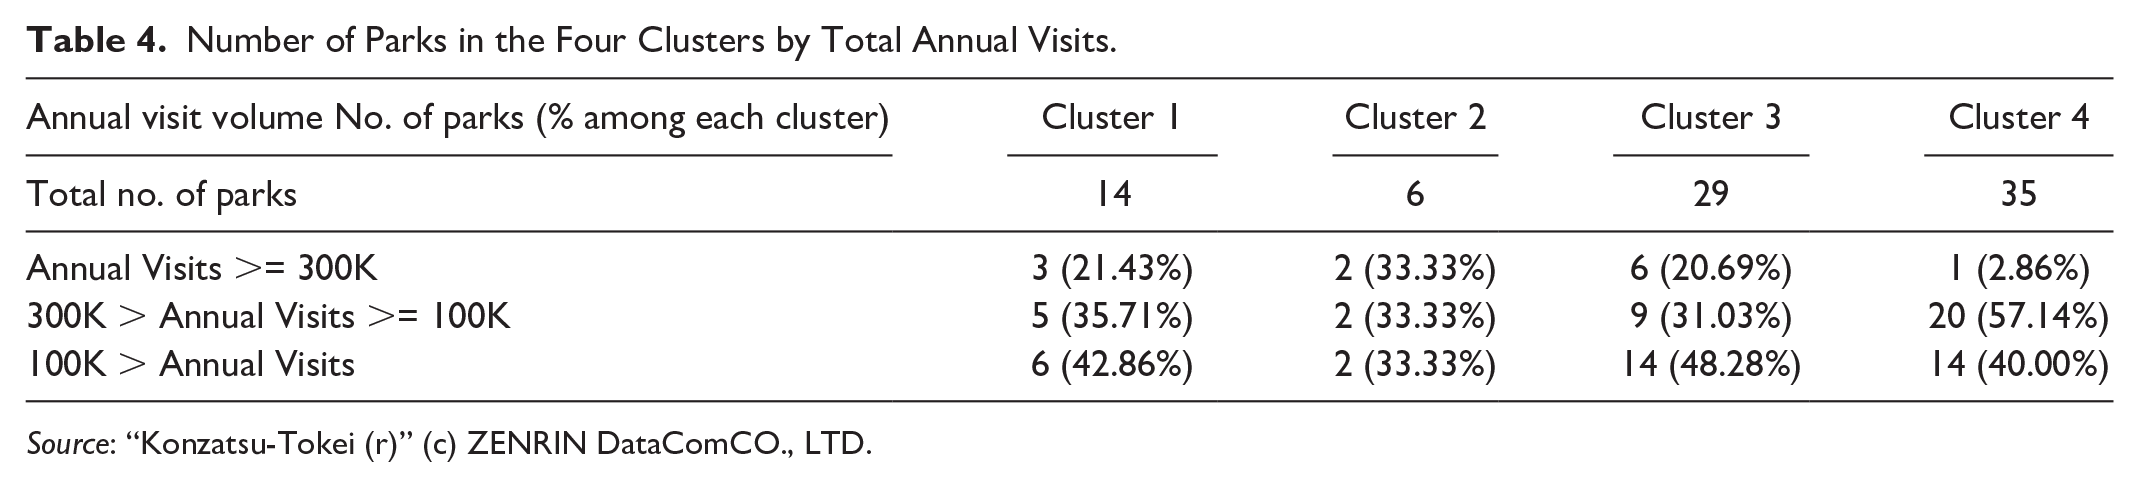
Breakdown of each cluster by annual visit volume is presented in Table 4. Higher percentages of cluster 1 and 2 parks recorded large visit volumes, with a notable portion of cluster 3 parks (six parks, 20.69%) also accommodated 300,000 or more visits. Additionally, 57.14 percent of cluster 4 parks, mainly for close-living residents, saw annual visits between 100,000 and 300,000, and this percentage is the highest among the four clusters. In sum, annual visit volumes of cluster 3 and 4 parks were not markedly smaller compared with cluster 1 and 2 parks. To further examine these observations, chi-square tests of independence were conducted to examine the relationships between cluster types and park characteristics. The test between cluster types and official park classifications showed a significant association (χ² = 23.847, df = 6, p < .001) (Supplemental Appendix Table C1), indicating that park clusters are significantly related to their administrative categories. Similarly, the test between cluster types and annual visit categories revealed a significant association (χ² = 15.678, df = 6, p < .05) (Supplemental Appendix Table C2), suggesting that the distribution of annual visit volumes differs significantly across clusters.
Number of Parks in the Four Clusters by Total Annual Visits.
Source: “Konzatsu-Tokei (r)” (c) ZENRIN DataComCO., LTD.
Discussion
Varying Visitor Type Proportions within a Similar Size Range
One of the most noteworthy findings of this study is that the proportions of different visitor types among the park visitors vary considerably across the sample parks despite their similar sizes. This large variation indicates that one cannot assume that urban parks within certain size ranges would have much the same composition of visitors and thus calls for more refined and targeted approaches in urban park planning and management.
While further studies are needed, the three types of visitors outlined in this study would have different visit patterns and purposes. Neighborhood residents can generally stay longer than other types. They also have much more choices in terms of when to visit: early or late through the day, during weekdays or weekends, and summer or winter. Purpose-wise, neighborhood residents may demand more activities and socialization than other types. Regular visitors may stay shorter than others and may be able to visit only around lunchtime or in other breaktimes. Their purpose of visits is more likely to be getting some relaxation. Annual visitors come for an event, staying for a day or for a few hours. They may be actively looking for new experiences but not for long-term socialization.
These assumptions are in line with the pieces of evidence found in the earlier literature review. Two thirds of the working citizens and students who responded in the survey of Sanesi and Chiarello (2006) preferred relaxation in the park to other recreational and social functions. Compared with neighborhood residents, visitors were more likely to be “Activity Seekers” who considered amenity, outdoor activity, or therapeutic experience more important than local culture, community, or spirituality, found Song and Shim (2021) in their study on urban park visitors.
However, in the conventional park classification system and planning process, few considerations have been made to accommodate such different needs according to the visitor characteristics examined here. Only a small amount of content addressing the presence and needs of the different visitor types, except for the basic demographic profiles, exists in medium-sized urban park planning and management literature. Regular visitors are probably the most invisible ones among the three types while they account for a significant percentage among the total number of visitors, on average 13 percent in this study (Note 5 in Supplemental material). As urban park planning and management are in most cases separated along administrative boundaries, administrative bodies tend to focus on their residents, thus ignoring cross-boundary visitors (see the ordinances discussed in the earlier sections).
In general, annual visitors have received more attention from administrative bodies than regular visitors, arguably because they are considered helpers of local economy and branding. A majority of the ward governments in Tokyo have webpages for urban parks often highlighting those parks which attract visitors during seasonal and special events (Arakawa Ward n.d; Nerima Ward 2018; Suginami Ward n.d.). What is questionable is whether park planning and operation accommodate the needs of these annual visitors.
Administrative Categories, Their Target Visitors, and the Actual Visitors
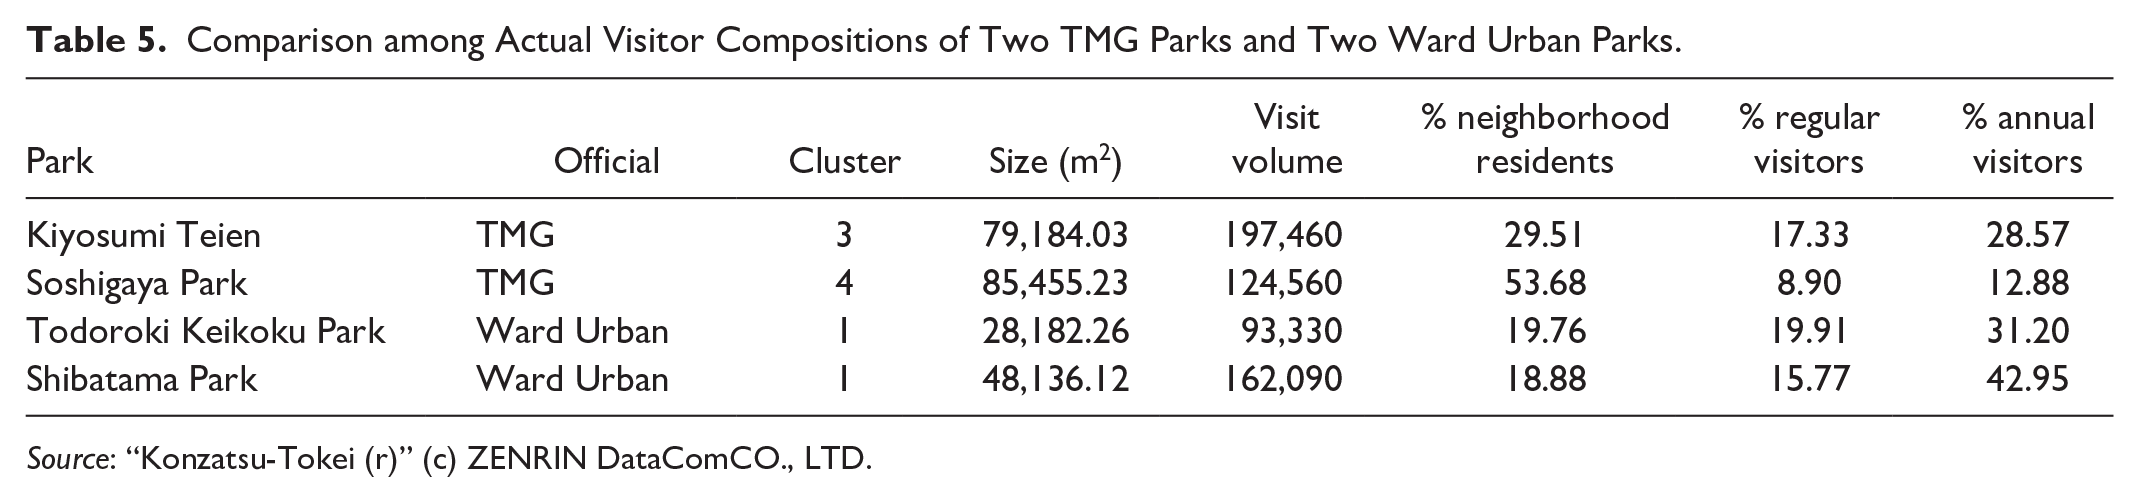
On top of the high variation within the size range we examined, the administrative categories, based on different values/legal supports and implying different target visitor type compositions, did not match well with the categorization using the actual visitor type composition data. For instance, comparison of the four parks in Table 5 illustrates in detail the mismatches between the assumed visitor characteristics of TMG parks and ward urban parks and the actual visitor characteristics of those parks.
Comparison among Actual Visitor Compositions of Two TMG Parks and Two Ward Urban Parks.
Source: “Konzatsu-Tokei (r)” (c) ZENRIN DataComCO., LTD.
Kiyosumi Teien contains a famous traditional Japanese garden, one of the reasons for its designation as a TMG park. Interestingly enough, the park is a neighborhood-serving park as much as a tourist attraction. This dual role is physically manifested in its careful integration of historic elements with community amenities. The park’s traditional garden area features a large central pond (see Supplemental Appendix E), nationally sourced stone arrangements, and the historic Taisho Memorial Hall, while its additional open park area provides accessible community spaces. The seasonal plantings, including cherry blossoms, hydrangeas, and iris gardens, further enhance its appeal to both cultural tourists and local residents.
The case of Soshigaya Park is more striking. The park mainly serves its neighborhood residents while the share of annual visitors from distant metropolitan Tokyo area is approximately one-fourth of the former. As images shown in Supplemental Appendix E, its physical characteristics, extensive recreational facilities, open lawns, and playground equipment, clearly align with its actual function as a community-oriented space, demonstrating how design elements can override administrative designations in determining usage patterns.
In contrast, Todoroki Keikoku Park and Shibatama Park, both ward urban parks managed by ward governments, are places loved by a huge number of Tokyo metropolitan area residents living farther than twenty kilometers from the parks. The proportions of annual visitors in these parks are approximately 1.5 to 2.0 times larger than those of neighborhood residents. Todoroki Keikoku’s unique valley landscape, featuring natural streams, traditional Japanese gardens, and protected woodlands (see Supplemental Appendix E), creates a distinctive environment that draws visitors from across Tokyo. Similarly, Shibatama Park’s attractive design and recreational facilities appeal to a broader metropolitan audience. These cases exemplify the government level distinction backed up by the assumptions that the official categorization does not match well with real visitor profiles. It also raises the possibility that a park could have multiple identities in terms of visitor patterns.
Administrative categorization of urban parks such as the ones illustrated earlier not only assumes the target visitors but also decides many factors that affect management and enhancement of park environment. The quality and quantity of human and financial resources available for a park change, in many cases, according to the level of government supervising the park. The legal support or requirements for management and enhancement also change. For example, even under the hand of the same level of government, ward urban parks and ward parks have different legal bounds. The former is subject to City Park Act, while the latter is bound to ward-level ordinances or Child Welfare Act, which are affected much by the situation of the ward government (Shin 2004, 224–25, TMG 2021). Therefore, the mismatches this study found imply that allocation of those resources is in discord with where they are needed and inefficient.
Total Visit Volume and Visitor Type Proportions
Total visit volume of a park, along with other basic facts such as park size, provides useful information for park management and enhancement. For example, Asukayama Park in Kita ward, a famous cherry-blossom spot with three museums, marks a prominently high volume of visits annually. This park receives special attention from the Kita Ward government (Kita Ward 2022). With its unique landscape features, it is possible to predict when the visit volume will peak and thus necessary human and financial support for such time can be made.
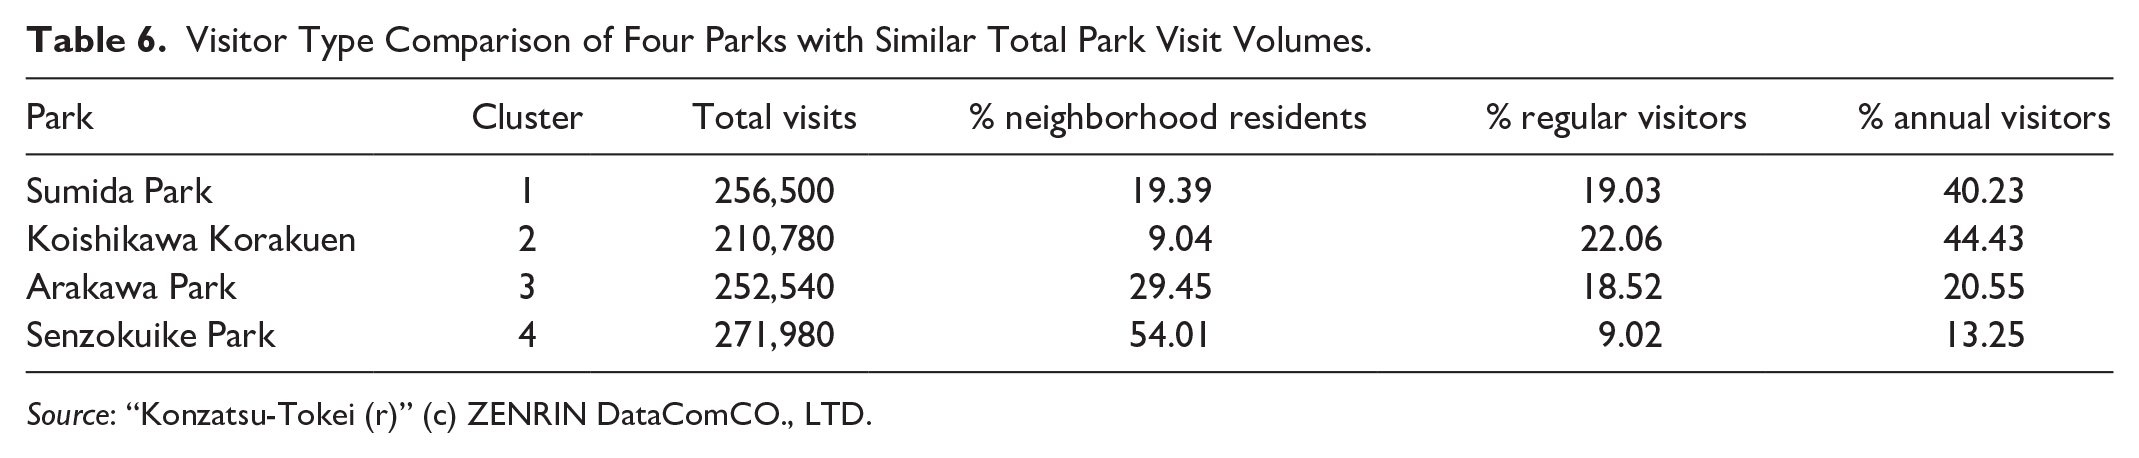
However, our study also found that total visit volume alone was not enough to make appropriate and refined park management and enhancement plans for park users. Across the parks accommodating similar yearly total visit volumes, large variations in visitor type proportions exist (Table 6). While Sumida Park, Koishikawa Korakuen, Arakawa Park, Senzokuike Park all have a similar range of annual visits, between 200,000 and 300,000, each of them belongs to a different cluster in our analysis, clusters 1, 2, 3, and 4, respectively. Sumida Park and Koishikawa Korakuen have more than 40 percent of annual visitors. Arakawa Park is frequented by more neighborhood residents but also has a considerable number of visitors who are regular visitors and annual visitors. More than one half of the Senzokuike Park visitors are neighborhood residents while regular visitors and annual visitors take up significantly low percentages compared to other parks.
Visitor Type Comparison of Four Parks with Similar Total Park Visit Volumes.
Source: “Konzatsu-Tokei (r)” (c) ZENRIN DataComCO., LTD.
These visitor profiles are informative as they imply time-wise patterns of visit volumes to a certain extent. Koishikawa Korakuen, a famous traditional garden, may see peaks during special seasons such as cherry-blossom or autumn foliage. Senzokuike Park may show a much more evenly distributed visit pattern daily, weekly, and yearly as the main visitor group is neighborhood residents who may use the park for ordinary daily recreation and have flexible time schedules. Yet, these predictions are far from a precise one. As discussed in Guan et al. (2020), a number of environmental, locational, and cultural factors affect monthly and seasonal fluctuation of park visit volumes.
Planning Implications
The discrepancies between administrative park classifications and actual visitor patterns revealed in our study highlight the need for evidence-based approaches in park planning and management (Donahue et al. 2018; Guan et al. 2020; Li et al. 2020). Recognizing the presence of multiple visitor types within a single park underscores the necessity for flexible and adaptive management practices (Loukaitou-Sideris et al. 2016; Payne, Mowen, and Orsega-Smith 2002; Song and Shim 2021). To better serve diverse visitor groups, park managers should consider three key aspects based on our empirical findings. First, parks require multi-functional design that accommodates diverse user needs simultaneously through fundamental amenities such as restrooms, water fountains, and varied seating options (Guan and Zhou 2024). Second, management strategies should account for the distinct temporal patterns of different visitor groups in maintenance schedules and programming (Ren et al. 2022). Third, comprehensive information systems, including clear wayfinding and multilingual signage, are essential to support both local and non-local visitors.
The visitor profile-oriented categorization approach can serve as a valuable complement to existing administrative frameworks, contributing to a more comprehensive and evidence-based urban park system (Donahue et al. 2018; Jaung and Carrasco 2021; Li et al. 2020). This integrated approach enables park authorities to align resource allocation more precisely with actual usage patterns while maintaining institutional structures (Li et al. 2020). For instance, parks showing significant metropolitan-wide visitation patterns could benefit from inter-jurisdictional resource sharing and collaborative management strategies, regardless of their administrative designation (Guan et al. 2020). The empirical data on visitor compositions can inform targeted infrastructure investments, maintenance schedules, and programming decisions that respond to documented usage patterns (Chen et al. 2018; Jaung and Carrasco 2021). Moreover, this complementary classification framework provides a quantitative foundation for policy decisions regarding resource distribution and management priorities across the park system (Loukaitou-Sideris et al. 2016; Ren et al. 2022).
Adopting data-driven approaches is essential for effective park planning and management (Lyu and Zhang 2019; Merrill et al. 2020; Schipperjin et al. 2010). Empirical data on visitor patterns should inform the re-evaluation of administrative classifications and resource allocation strategies. Utilizing mobile phone data, social media check-ins, and other digital tools to track visitor numbers, demographics, and behaviors in real time can be highly beneficial (Chen et al. 2018; Donahue et al. 2018). Implementing sensors and IoT devices to monitor park usage patterns can help identify peak times and areas of high foot traffic. Resources should be allocated based on actual usage data, ensuring that parks with high footfall or diverse visitor groups receive adequate maintenance and security (Jaung and Carrasco 2021; Ren et al. 2022). Staffing levels can be dynamically adjusted to match visitor patterns, ensuring sufficient personnel during peak times (Guan and Zhou 2024).
While this study focuses on Tokyo, the findings have broader implications for urban park management globally. The methodology and insights gained can be applied to other cities to improve park planning and management practices. The mobile phone data analysis approach can be adapted to cities with similar technological infrastructure, as demonstrated by successful implementations in Singapore (Jaung and Carrasco 2021) and Shanghai (Ren et al. 2022). However, implementation would require consideration of local contexts, including data privacy regulations, mobile phone penetration rates, and existing park monitoring systems. Cities with established smart city initiatives could integrate these methods into their existing frameworks, as shown by Chen et al. (2018) in their multi-city analysis of park usage patterns. The analytical framework could be especially useful for cities seeking to optimize resource allocation and improve evidence-based decision-making in park management, though the specific metrics and thresholds would need to be calibrated to local conditions and user behaviors.
Conclusion
This study provides a series of evidence that characteristics of the actual visitors of medium-sized urban parks are considerably different from those of the target visitors based on conventional park planning theory and practices. Examining the visitors of sample parks with home-park distance and frequency of visits, we showed that in general the park visitors included not just neighborhood residents but rather diverse types. Clustering of the sample parks highlighted substantial discrepancies between administrative classifications and actual park usage, suggesting the need for data-driven park management guidelines.
This study has several limitations. The use of anonymized mobile data may introduce biases. Notably, the data might underrepresent certain demographic groups, such as elderly residents who are less likely to carry smartphones or children who don’t own mobile devices, potentially leading to an underestimation of neighborhood visitors. Additionally, the criteria used to identify neighborhood residents, regular visitors, and annual visitors may not fully capture the nuances of visitor behavior. The distance and frequency thresholds used to identify these visitor types are based on empirical observations and literature, but further validation and refinement of these criteria are necessary for broader applicability beyond Tokyo. Future research should refine visitor typologies by incorporating broader demographic attributes and exploring behavioral patterns and spatial needs in more detail. Applying these methodologies in different cities can help validate and generalize our findings. Additionally, investigating the impact of seasonal events and special occasions on park usage patterns would provide a deeper understanding of how to cater to diverse visitor needs. Exploring these hyperparameters in various urban contexts will ensure their relevance and accuracy, contributing to more effective and inclusive park planning and management.
Supplemental Material
sj-docx-1-jpe-10.1177_0739456X251347237 – Supplemental material for Visitor Profile-oriented Urban Park Categorization: Analyzing Home-to-park Trip Characteristics Using Mobile Phone Data
Supplemental material, sj-docx-1-jpe-10.1177_0739456X251347237 for Visitor Profile-oriented Urban Park Categorization: Analyzing Home-to-park Trip Characteristics Using Mobile Phone Data by Jihoon Song, ChengHe Guan, Yichun Zhou, Yuki Akiyama and Ryosuke Shibasaki in Journal of Planning Education and Research
Footnotes
Data Availability Statement
This study used “Konzatsu-Toukei® Data” provided by ZENRIN DataCom Co., LTD. Due to legal and commercial reasons, it is not possible to share the data.
Declaration of Conflicting Interests
The author(s) declared no potential conflicts of interest with respect to the research, authorship, and/or publication of this article.
Funding
The author(s) disclosed receipt of the following financial support for the research, authorship, and/or publication of this article: This research is funded by the Shanghai Nature and Health Foundation (Grant No. 20230701 SNHF), Shanghai, China; Pudong Pearl Program Leading Scheme 2023, Pudong Talents Office; Program for Professor of Special Appointment (Eastern Scholar) at Shanghai Institutions of Higher Learning (Grant No. 20230111 SMEC); National Foreign Young Talents Program from the State Administration of Foreign Experts Affairs (Grant No. 10109_ Special Grant); Shanghai Municipal Education Commission (Key program of AI-Driven Initiative to Promote Research Paradigm Reform and Empower Disciplinary Advancement). This research is partially supported by the NYU Shanghai Boost Fund; Shanghai Tongmu Architecture Consulting and Shanghai Technology Exchange; LOUD Climate; and Envision Energy.
Supplemental Material
Supplemental material for this article is available online.
Author Biographies
References
Supplementary Material
Please find the following supplemental material available below.
For Open Access articles published under a Creative Commons License, all supplemental material carries the same license as the article it is associated with.
For non-Open Access articles published, all supplemental material carries a non-exclusive license, and permission requests for re-use of supplemental material or any part of supplemental material shall be sent directly to the copyright owner as specified in the copyright notice associated with the article.