
Abstract
Developmental composition courses serve a sizable and growing number of Generation 1.5 students, or long-term U.S. resident language learners, and it is believed that language challenges may be part of Generation 1.5 writers’ difficulty in controlling the academic register. The current study investigates possible similarities and differences between Generation 1.5 students (n = 149) and two other student groups: mainstream first language (L1) writers (n = 203) and more traditional second language (L2) writers (n = 55), thus determining the extent to which language-use variables distinguish Generation 1.5 texts from those of their classmates. Results indicate significant differences between Generation 1.5 and L2 students on holistic writing quality, word errors, word class errors, verb errors, total identified errors, and spoken features of language. Generation 1.5 and L1 texts significantly differed on academic features of language. Implications are presented, suggesting that developmental Generation 1.5 writing may be more similar to L1 writing than has been previously reported.
Institutions across the United States have seen an influx over the past two decades of a specific type of multilingual English student here referred to as Generation 1.5 (Harklau, Losey, & Siegal, 1999; Roberge, Siegal, & Harklau, 2009). These students are commonly viewed as having circumstantial and learner characteristics distinct from English as a first language (L1) and more traditional English as a second language (L2) students (e.g., international or recently arrived immigrants; Ferris, 2009; Reid, 2005). Generation 1.5 students are often enrolled in developmental writing classes in tertiary education (Patthey, Thomas-Spiegel, & Dillon, 2009), yet little is known about how their writing differs from L1 developmental writers or other L2 learners. Patthey et al. (2009) suggest that Generation 1.5 students may be slightly more persistent than other developmental students; however, a report by the Education Commission of the States (Smith, 2011) suggests that only about 15% of all developmental students persist in taking college-level work one year later, and even fewer achieve a postsecondary credential. If developmental Generation 1.5 student writing involves a unique set of language-related difficulties (Ferris, 2009; Reid, 2005), understanding those differences is an important first step in improving educational outcomes.
The current study explores the usefulness of conceptualizing the student group designation Generation 1.5 for the purposes of writing research by investigating textual features of three groups of student writing: Generation 1.5, L1, and L2 texts. Based on similarities and differences in the writing of these three groups, theoretical implications are linked to existing scholarship claiming that Generation 1.5 students are a unique type of language learner. Using comparable research methods to those Doolan (2013) applied to first-year composition students, the current study uses a large corpus of tertiary developmental student writing for analysis of these three groups (N = 407), advancing a much-needed empirical foundation for discussion of Generation 1.5 writing in an attempt to advance an understanding of whether Generation 1.5 writers produce language that is distinct from their L1 and L2 classmates.
Defining Generation 1.5 Students
The term Generation 1.5, taken literally, describes an individual between generations of migration. First-generation immigrants most often move to their new country of residence as adults, and second-generation immigrants are born in the new country of residence. Generation 1.5 generally refers to students who arrive in the United States as children. The term 1.5 generation was first introduced by the sociologists Rumbaut and Ima (1988), though the term half-second generation can be traced back to 1918 in reference to foreign-born youth in the United States (Rumbaut, 2004). As research on Generation 1.5 students has evolved over the past 20 years, this criterion of arriving in the English-speaking country of residence during childhood has not remained consistent in the literature. While the focus of the current study is centered on Generation 1.5 students, it should be acknowledged that broader discussions about the definition of a “developmental” student are also possible (Matsuda, 2003).
The current study adopts a broad (but consistent with previous research) characterization of a Generation 1.5 student as one who (a) has been in the U.S. educational system for more than 4 years, (b) regularly speaks/spoke a language other than English at home, and (c) is younger than 22 years old.
Literature Review
The prevailing narrative is that Generation 1.5 students’ English acquisition is incomplete, but that they have acquired English with disproportionately strong oral and aural skills (e.g., “ear learners”) as compared to their literacy skills (Ferris, 2009; Reid, 2005). According to this narrative, these oral features transfer into their writing in the form of informality and accuracy issues influenced by spoken and colloquial language. Best practices often build on these themes, encouraging instructors to use Generation 1.5 students’ oral proficiency to maximize writing instruction (Goen-Salter, Porter, & Vandommelen, 2009; Matsuda, 2008). The second half of this narrative is that more traditional L2 students have acquired English primarily through reading and writing (e.g., “eye learners”) academic texts and thus have gained more exposure and proficiency with written academic discourse.
If the ear learner versus eye learner hypothesis accurately describes Generation 1.5 and L2 writers, we might expect to find more language features associated with spoken language in Generation 1.5 texts, and more features associated with academic writing in L2 texts (few claims are made regarding where L1 students are likely to land on this spectrum). Differences between spoken and academic language are carefully documented in Biber, Johansson, Leech, Conrad, and Finegan (1999) and summarized in Biber and Vasquez (2008), indicating 50 morphosyntactic variables with sizable quantitative differences. Though not explicitly drawing motivation from Biber and Vasquez, a number of studies have used linguistic features associated with spoken or academic language such as prepositional phrases (e.g., Connor, 1990; Ferris, 1994; Grant & Ginther, 2000; Jarvis, Grant, Bikowski, & Ferris, 2003), nominalizations (Ferris, 1994; Grant & Ginther, 2000; Jarvis et al., 2003), passive voice (Celce-Murcia, 2002; Ferris, 1994; Hinkel, 2002; Shaw & Liu, 1998), and contractions (Shaw & Liu, 1998) to distinguish groups of student writers. While none of these studies focused on Generation 1.5 writing, they represent some of the spoken and academic language variables most likely to distinguish student writing based on L2 research.
Turning to Generation 1.5 writing research, only three empirical studies were found providing evidence of spoken and written academic language features differentiating Generation 1.5 and L2 writing. Comparing Generation 1.5, L1, and L2 first-year composition (FYC) students, Connerty (2009) found a host of significant differences on linguistic variables, including more prepositional phrases, personal pronouns, and determiners for Generation 1.5 writers than for L2 students, and significantly more prepositions for Generation 1.5 writers than for the L1 group. She interpreted these results as creating a unique, self-representative, and conversational style for Generation 1.5 writers. In case studies by Frodesen and Starna (1999), two Generation 1.5 students named Min (L1 Chinese) and Alex (L1 Spanish) produced writing with a lack of idiomaticity, or nonidiomatic language. According to Frodesen and Starna, these difficulties with collocations (e.g., all at suddenly, instead of all of a sudden) may indicate spoken language influences. Other potential spoken language influences highlighted in this study of Generation 1.5 writing include a lack of subordination and a lack of elaboration. Another case study by Frodesen (2009) describes a Taiwanese Generation 1.5 student named Jinny and challenges with idiomatic language as well as difficulty with comparison structures, complement and relative clauses, cohesive devices, transitions, and structurally appropriate uses of that (e.g., complementizer, relativizer, comparative) upon entering her tertiary developmental class.Though limited in scope, these studies support the notion that Generation 1.5 writing may demonstrate more spoken language influences when compared to their L2 peers’ writing.
However, even more prevalent than discussions of spoken versus academic linguistic features, error patterns may be the most pervasive theme discussed in Generation 1.5 writing research. Using examples from developmental student writing, Ferris (2009) identifies the error types Generation 1.5 students are likely to share with L2 students such as verb tense, verb form, prepositions, and word choice errors while other Generation 1.5 written error patterns such as word form, determiners, and inappropriate use of relative pronouns are more likely to resemble L1 writing. Frodesen and Starna (1999) used Generation 1.5 student writing to demonstrate errors in verb tense, word forms, idiomatic usage, appropriacy of function words, and trouble with modal use. Frodesen’s (2009) Generation 1.5 case study also discusses Generation 1.5 error issues, including mention of a UCSB entrance writing exam in which every sentence exhibited one or more errors.
Several quantitative studies have also provided empirical evidence of error patterns. Doolan and Miller (2012) investigated the developmental writing from a Central California community college and found significantly more verb errors, prepositional phrase errors, word form errors, and total identified errors in Generation 1.5 writing compared with L1 writing. In studies of entrance exams at a northeastern university where the participants had already been preselected for L2 training based on survey information, di Gennaro (2009, 2013) compared international L2 (IL2) and Generation 1.5 student writing using a many-facet Rasch analysis. Findings from di Gennaro (2009) suggest comparable grammatical (accuracy) scores between the two groups, while findings from di Gennaro (2013) indicate that grammatical (accuracy) control was a greater strength in IL2 writing than in Generation 1.5 writing. In Levi (2004), Generation 1.5, L2, and L1 writing was sampled from three developmental ESL course levels and two developmental L1 course levels, with results indicating differences on more than 24 error variables, including article error, subject-verb error, verb form error, preposition error, word form error, lexical choice error, run-on error, spelling error distribution, punctuation error distribution, fragment error distribution, and many more error categories. The one remaining quantitative study providing evidence of Generation 1.5 error patterns in Generation 1.5 writing is Muchinsky and Tangren (1999). They compared Generation 1.5 errors to L2 error patterns in a preuniversity intensive English program through a composite correctness score. Using their holistic error measure, they found higher error scores in Generation 1.5 writing than in the writing produced by L2 students. Both the qualitative and quantitative studies cited above focus on developmental writers, and all point to error patterns in Generation 1.5 writing either comparable with, or occasionally, exceed those made by L2 students.
However, in the analysis of Generation 1.5 students’ written linguistic and error production, not all empirical evidence indicates clear differences between Generation 1.5 writers and their classmates. In comparisons between Generation 1.5 and L1 writing, Doolan (2011a) investigated a corpus of community college developmental writing and found no significant differences between Generation 1.5 (n = 41) and L1 (n = 20) students on 25 linguistic variables, including vocabulary measures and a series of corpus-based variables thought to distinguish student writing. Another study by Doolan (2013) using a larger data set and comparing three groups of writers (Generation 1.5 (n = 75), L1 (n = 121), and L2 (n = 41) students) at the FYC level also found no significant differences between Generation 1.5 and L1 writers, but differences between Generation 1.5 and L2 writers on error and linguistic development variables. Results from Doolan (2011a; 2013), cast doubt on the validity of claims that Generation 1.5 writers are, in fact, a distinct group of language learners. One possible explanation for the similarities between Generation 1.5 and L1 writers in Doolan (2013) is to hypothesize that Generation 1.5 student language issues are prevalent at the developmental level, but become less of an issue for the more advanced writers at the FYC level (sampled in Doolan, 2013).
With the exception of Doolan (2011a, 2013), the studies discussed in this review put forth an argument to suggest that Generation 1.5 writers form a unique group who can be identified by both their sociocultural background as well as their textual production. However, it remains unclear where the similarities and differences between Generation 1.5 writers and the writing of their developmental classmates are most pronounced. In research that compares Generation 1.5 writing and just one of the two student groups (e.g., L1 or L2), the group excluded from the comparison may or may not closely resemble Generation 1.5 writing (e.g., di Gennaro, 2009, 2013; Doolan, 2011a; Doolan and Miller, 2012; Mikesell, 2007). For case studies that have focused exclusively on Generation 1.5 textual issues (Frodesen, 2009; Frodesen & Starna, 1999), it is unclear whether the identified writing challenges are uniquely Generation 1.5 issues or, in fact, common L1 and/or L2 developmental writing issues.
The current study builds on the important Generation 1.5 research discussed above and addresses the gaps mentioned above by comparing the developmental writing of Generation 1.5, L1, and L2 students using a large student writing sample (N = 407). Employing relatively controlled data collection procedures, the current study addresses the following research questions:
Do holistic scores in Generation 1.5 expository writing distinguish their writing from their L1/L2 classmates’ writing within developmental writing classes?
Do error patterns in Generation 1.5 expository writing distinguish their writing from their L1/L2 classmates’ writing within developmental writing classes?
Do linguistic development patterns in Generation 1.5 expository writing distinguish their writing from their L1/L2 classmates’ writing within developmental writing classes?
Method
Participants
A total of 407 participants were included in the current study, with participation from nine institutions. Each of the nine participating institutions had its own procedures for placing students in developmental writing courses. L2 students were considered as those who (a) have been in the U.S. educational system for less than four years and (b) regularly speak/spoke a language other than English at home. The biographical information survey was used to place writers into one of three categories: (a) Generation 1.5, (b) L1, or (c) L2 writers. The L1 students self-reported that they do/did not regularly speak a language other than English at home. The Generation 1.5 definition was reported earlier. Appendix A provides a summary of the number of participants drawn from each institution for each student group. While all participants were enrolled in developmental writing courses, many community colleges have a two- or three-course remedial sequence that prepares students for FYC. 1 Table 1 presents the number of Generation 1.5, L1, and L2 students who participated in the current study from one and two levels below FYC.
Developmental Course Participants, One and Two Levels Below First-Year Composition (FYC).
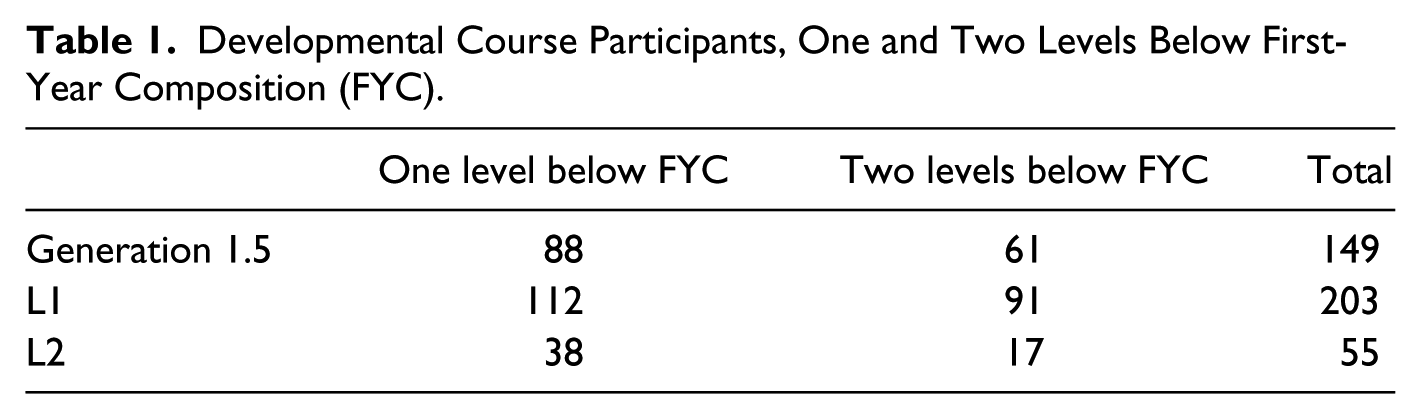
As shown in Table 1, approximate (though not identical) ratios were drawn from the two developmental course levels for the three student groups. While a larger number of participants were considered from the total number of essays collected, a number of students and their essays were excluded for a variety of reasons (see Appendix A for number of essays considered versus number included). Essays with fewer than 120 words per text were not included in the analysis. To avoid potential complications with institutional review board issues, Native American students (n = 8) were excluded. In addition, because of the ear learner versus eye learner theoretical underpinnings to this study, ASL students (n = 2) were also excluded from the L2 population.
A large amount of survey information was gathered from participants in the current study and is reported in Appendix B. As future researchers look to explain similarities and reconcile differences in the writing performance of their Generation 1.5 and L2 students in relation to the findings from the current study, this appendix documents important educational and language background information that could help account for patterns in student textual production. For example, the appendix would help to identify how similarly the Generation 1.5 student non-English-language education in the current study matches the education profiles in comparison studies.
Materials
Materials for data collection in the current study consisted of (a) a script for teachers’ implementation, (b) a biographical information survey, (c) a writing prompt, and (d) blank paper for students’ written responses. 2
The script for teachers included instructions detailing procedures for administering data collection. The script informed the teachers of how long each activity should last and drew attention to aspects of the materials seen as instrumental in facilitating smooth data collection procedures. The biographical information survey (see Appendix B for types of questions asked) contained 10 questions. The questions elicited information regarding education, language, and literacy practices.
The following prompt was used in the present study: “Do you agree or disagree with the following statement? People are never satisfied with what they have; they always want something more or something different. Use specific reasons and examples in your answer.” In choosing this prompt, five potential prompts were presented to 18 FYC students who were asked to rank the prompts based on relevant matrices (e.g., interest levels, ease versus difficult). Three to four students then wrote in-class essays on each of the potential prompts. The prompt used in this study was chosen after careful consideration of student performance on and opinion of the potential prompts (Kroll & Reid, 1994). Comparable expository writing prompts are used regularly to serve as writing diagnostics, high-stakes assessments (e.g., Test of Written English), and institutional writing proficiency exams (e.g., GWPE at Humboldt State University) and as part of writing studies course curriculum (e.g., in class writing). This prompt was used authentically in tertiary writing courses at many of this study’s participating institutions.
Procedures
Data collection was conducted over the 2009-2010 academic year. Writing samples were collected on multiple occasions (with different groups of students) throughout the academic year as populations became available. Efforts were made to maintain comparable testing conditions at the different data collection sites by providing the same materials to all students, the same time conditions, and the same script read by each teacher.
An introduction to the study and securing institutional review board compliance took approximately 5 minutes. Completion of the biographical information survey took approximately 4 to 8 minutes. Next, the 30-minute writing activity was conducted.
Design
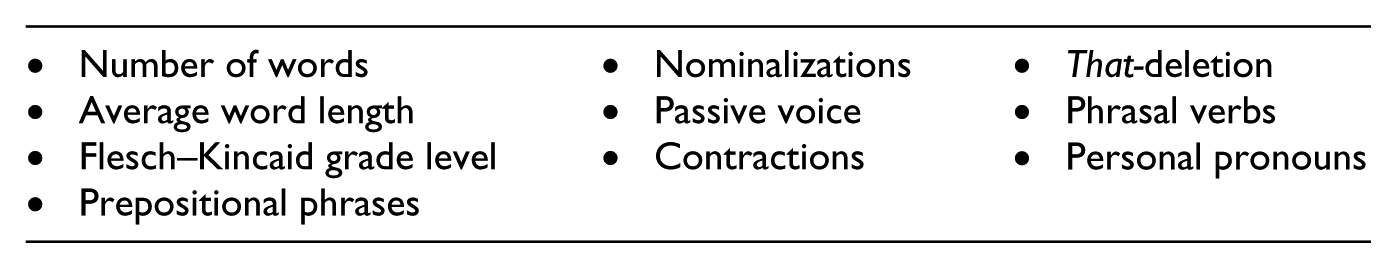
The current study uses a between-subjects design to compare the writing of three student groups: Generation 1.5, L1, and L2 students. These groups were analyzed based on three separate analyses corresponding to the three research questions: holistic writing quality, errors, and linguistic development. Holistic writing quality was determined through the use of a rubric discussed below. The error analysis involved the following 10 variables

The 10 linguistic development variables are listed below
The analysis section provides more details on features of this overarching design.
Analysis 3
Essays were scored using the 6-point holistic rubric used in the Test of Written English (TWE) as part of the Test of English as a Foreign Language. This rubric and this assessment was developed by the Educational Testing Service (ETS), a nonprofit organization with transparent and well-documented approaches to establishing validity and reliability (ETS, 2004; Kroll & Reid, 1994). That said, criticism of ETS (and by extension, the TWE rubric) for its large-scale, standardized-testing practices and the limitations of such tests for measuring writing ability are certainly part of a balanced presentation of these materials (Crusan, 2010). In an effort to ensure reliability of holistic scoring, training sessions were conducted with the researcher and four raters. Raters were doctoral students in applied linguistics with at least one year of experience in teaching FYC, and multiple years of language teaching experience. Each essay was scored by two raters. For discrepancies greater than one point (e.g., a score of 3 from one rater and a score of 5 from the other), a third rater was used to systematically resolve the difference.
In terms of general rating procedures, the two separate scores were added, resulting in possible scores between 0 and 12. The Pearson correlation among raters was .62, which is considered moderate agreement, and agreement within one scoring band was 90%. While higher interrater reliability would have been optimal, these holistic scores were not used for high-stake decisions, nor for fine-grained analysis between essays with scores that differed slightly. In addition, this measure provides a general sense of proficiency across institutional placements, and having a general sense of the holistic writing quality is an improvement over L2 writing research that analyzes various textual features without providing any measures of holistic writing quality.
Determining Error Variables and Conducting the Error Analysis
Following a comprehensive search of error analysis literature, no models for error analysis procedures were found that provided an easily replicable and reliable coding scheme. Informed by large scale error analyses such as Lundsford and Lundsford (2008), and Foin and Lange (2007), as well as a methodological review of error analyses by Polio (1997), and a meta-analysis of error studies in Wolfe-Quintero, Inagaki, and Kim (1998), a code scheme was developed in an effort to ensure interrater reliability and transparency in coding decisions.
Procedures for the current error analysis involved the creation of categories followed by multiple rounds of revision to categories. Descriptions of creating this coding scheme can be found in Doolan, 2011b. It should be mentioned that in the interest of achieving interrater reliability, certain categories of interest (e.g., plurals, oddly constructed phrases, uneven syntax) were not included because reliability could not be achieved. Nevertheless, a more abbreviated list of the error categories used in the current study can be found in Appendix C. For the current study, the primary researcher and a PhD student in applied linguistics, both with over 5 years of language teaching experience and professional affiliations with ETS as online scorers, rated 13% (n = 35) of the total essays analyzed for errors (n = 270). That is, interrater reliability was achieved by identifying the locations of errors in a random sample of naturally occurring texts and then checking agreement for the type of error assigned by the two raters. The number of exact agreements was 327 out of 360. This resulted in a Cohen’s kappa of .893. The strength of this agreement is considered to be very good. Furthermore, a small number of coding discrepancies were considered to be systematic, and with these differences resolved, exact agreement was 335 out of 360, resulting in a Cohen’s kappa of .919 (very good).
A feasible subset (n = 144) of the total essays was coded for the error analysis. While almost all of the L2 essays were coded (52 out of 55), stratified random sampling was conducted to select 46 Generation 1.5 and 46 L1 texts for the error analysis. The random stratification took into consideration student group and institution in order to ensure appropriate representation of the larger sample.
Determining the Linguistic Development Variables and Conducting the Analysis
The 10 linguistic development variables were identified using a corpus tagger or Coh-Metrix software (McNamara, Louwerse, Cai, & Graesser, 2005). After “cleaning” data by conducting a Microsoft Word spell check, all texts were tagged for the textual features using a computer program developed for the Longman Grammar of Spoken and Written English (Biber et al., 1999). Reliability checks of precision for the target linguistic features were performed on 35 essays (or 5% of the total number of essays). Precision is defined as the number of target features that were tagged correctly, divided by the number of the target features that were auto-tagged. Precision was greater than 95% for the final data set.
Operationalizations and theoretical justification of the linguistic development features are provided in Appendix D. A large number of linguistic development variables were considered, but ultimately not included in the final analysis. Determining which variables to include and exclude involved a three-step process. First, a comprehensive literature review was conducted to identify the linguistic variables discussed in Generation 1.5, L1, and L2 writing research used to distinguish groups of student writers. Second, two pilot studies were conducted using linguistic variables. From these pilot studies, empirical evidence was gathered for determining the usefulness of target linguistic development variables at distinguishing student groups. Finally, a large number of variables were included in preliminary analyses of the larger study and then excluded because informal analysis of descriptive statistics suggested that these excluded variables would not differentiate student groups. A list of the excluded variables in connection with the literature review, pilot testing, and/or preliminary analysis of the larger study is provided in Appendix E. This list may be of interest for two reasons. First, these excluded variables were seemingly less effective at distinguishing group differences, which itself is an interesting finding (especially in comparison with previous studies in which these variables did demonstrate group differences). Second, while no inferential statistics were run on these variables, their exclusion could be viewed as related to the inferential statistics and the major findings of this exploratory analysis.
Counts of structural features (e.g., prepositional phrases, personal pronouns, passives) and error counts were normalized to 1,000 words as detailed in Biber, Conrad, and Reppen (1998). Second, there is a growing body of publications reporting the use of the Coh-Metrix program (Graesser, McNamara, Louwerse, & Cai, 2004), a free text analysis program, to demonstrate potentially important textual differences among multiple comparison groups (see Crossley & McNamara, 2009, p. 122). All texts were run through Coh-Metrix program to get counts for the linguistic variables (e.g., number of words, Flesch–Kincaid grade level).
Statistical Analyses
In total, one analysis of variance (ANOVA) and two multivariate analyses of variance (MANOVAs) statistical tests were run for between-subjects comparisons. The ANOVA involved group comparisons (Generation 1.5, L1, or L2) for holistic scores. The two MANOVAs used the same groups, but divided the dependent variables into an error analysis, and a linguistic analysis. Assumptions were checked for all statistical analyses. An a priori alpha level was set at .05 for the holistic quality analyses, .0083 for the error analysis (.05 divided by 6, the number of dependent variables), and .00714 for the linguistic analysis (.05 divided by 7, the number of dependent variables).
While individual counts were obtained for each of the coded error types, combinations of variables were used for the statistical analysis. The reason for combining error types was to reduce the number of zero values and improve the robustness of the statistical results. The following combinations of variables were made in order to retain linguistically similar sets. It should be noted that while subject/verb agreement is more typically associated with verb issues, issues of plurality (perhaps more of a word form issue) were often responsible for these errors (e.g., Usually, the student work on their homework after school), thus subject/verb agreement errors were categorized as word errors.
Verb errors = verb form + verb tense—Difficulty controlling the verb phrase is a common error in student writing. Teachers rarely attend to form without also attending to tense issues (Foin & Lange, 2007; Mikesell, 2007).
Word error = word form + wrong word + subject/verb agreement—Students’ difficulty choosing the appropriate word and orthographically presenting the word in standard academic English was seen as thematically linked and included in one composite variable.
Clausal error = run-on sentences + fragments—Both of the variables included in this composite variable involve difficulties properly negotiating sentence boundaries.
Word class error = determiner + prepositional phrases—The variables included in this category represent the most common omissions, unneeded additions, or inappropriate uses of these selected word classes.
These four composite variables in combination with spelling and total identified errors resulted in six categories for statistical analysis.
For the linguistic variables, certain variables with excessive zero values were also combined. Once again, this was done to improve the robustness of statistical data analysis and was again done in a theoretically principled manner, resulting in the following categories:
Spoken features of language = that-deletions + contractions + phrasal verbs—Generation 1.5 writing research often includes mention of the spoken language features (e.g., “ear learners”) that are emblematic of Generation 1.5 writing (Reid, 2005). This composite variable speaks to this commonly discussed construct.
Academic features of language = nominalizations + passives—Again, the Generation 1.5 literature often emphasizes challenges with academic English, with more traditional L2 learners (e.g., “eye learners”), more likely to excel in the use of academic English (Reid, 2005).
These two composite variables combined with number of words, Flesch–Kincaid grade level, word length, prepositional phrases, and personal pronouns resulted in seven categories for statistical analysis.
Results
This section is organized with results from the data analysis in order of the research questions. The first research question investigates potential differences in holistic writing quality scores among the three groups, followed by a question regarding error patterns, and finally a question regarding linguistic patterns that may distinguish Generation 1.5 student writing from the writing of their classmates.
1. Will holistic scores in Generation 1.5 expository writing distinguish their writing from their L1/L2 classmates’ writing within developmental writing classes?
To answer this question a one-way ANOVA was conducted to determine whether the holistic scores of Generation 1.5 texts were significantly different from the writing of their classmates. Assumptions of normality and homogeneity of variance were within normal ranges.
An a priori alpha of .05 was used for this ANOVA. The one-way ANOVA of holistic writing quality revealed a statistically significant main effect, F(2, 404) = 5.83, p = .003, indicating that not all three of the student groups achieved the same holistic quality scores. The omega squared (ω2) = .023 indicated that approximately 2% of the variation in holistic quality scores was attributable to differences among the three student groups. This is considered a (very) small effect size.
Post hoc comparisons using Bonferroni procedures were used to determine which pairs of the three group means differed. These results indicated that both Generation 1.5 (M = 6.30, SD = 1.77) and L1 (M = 6.47, SD = 1.57) essays achieved statistically higher holistic quality scores than the L2 essays (M = 5.60, SD = 1.79). The Cohen’s d effect sizes for these significant pairwise differences for Generation 1.5–L2 and L1–L2 were 0.42 and 0.52, respectively. These are considered moderate effect sizes.
2. Will error patterns in Generation 1.5 expository writing distinguish their writing from their L1/L2 classmates’ writing within developmental writing classes?
A one-way MANOVA was performed on six dependent variables measuring error patterns: (a) spelling, (b) word errors, (c) word class, (d) clausal errors, (e) verb errors, and (f) total identified errors.
In general, the dependent variables were not normally distributed; however, because sample sizes were large enough, the central limit theorem indicates that nonnormal distribution is not a problem for continuing with this MANOVA (Johnson & Wichern, 2007). Because sample sizes were highly divergent for some of the MANOVAs run and because of violations of the assumption of homogeneity of variance and covariance, the Pillai’s trace MANOVA test statistic is reported instead of Wilks’s lambda. Means and standard deviations for the three student groups on each of the six dependent error variables are shown in Table 2.
Means and Standard Deviations for Developmental Error Variables.
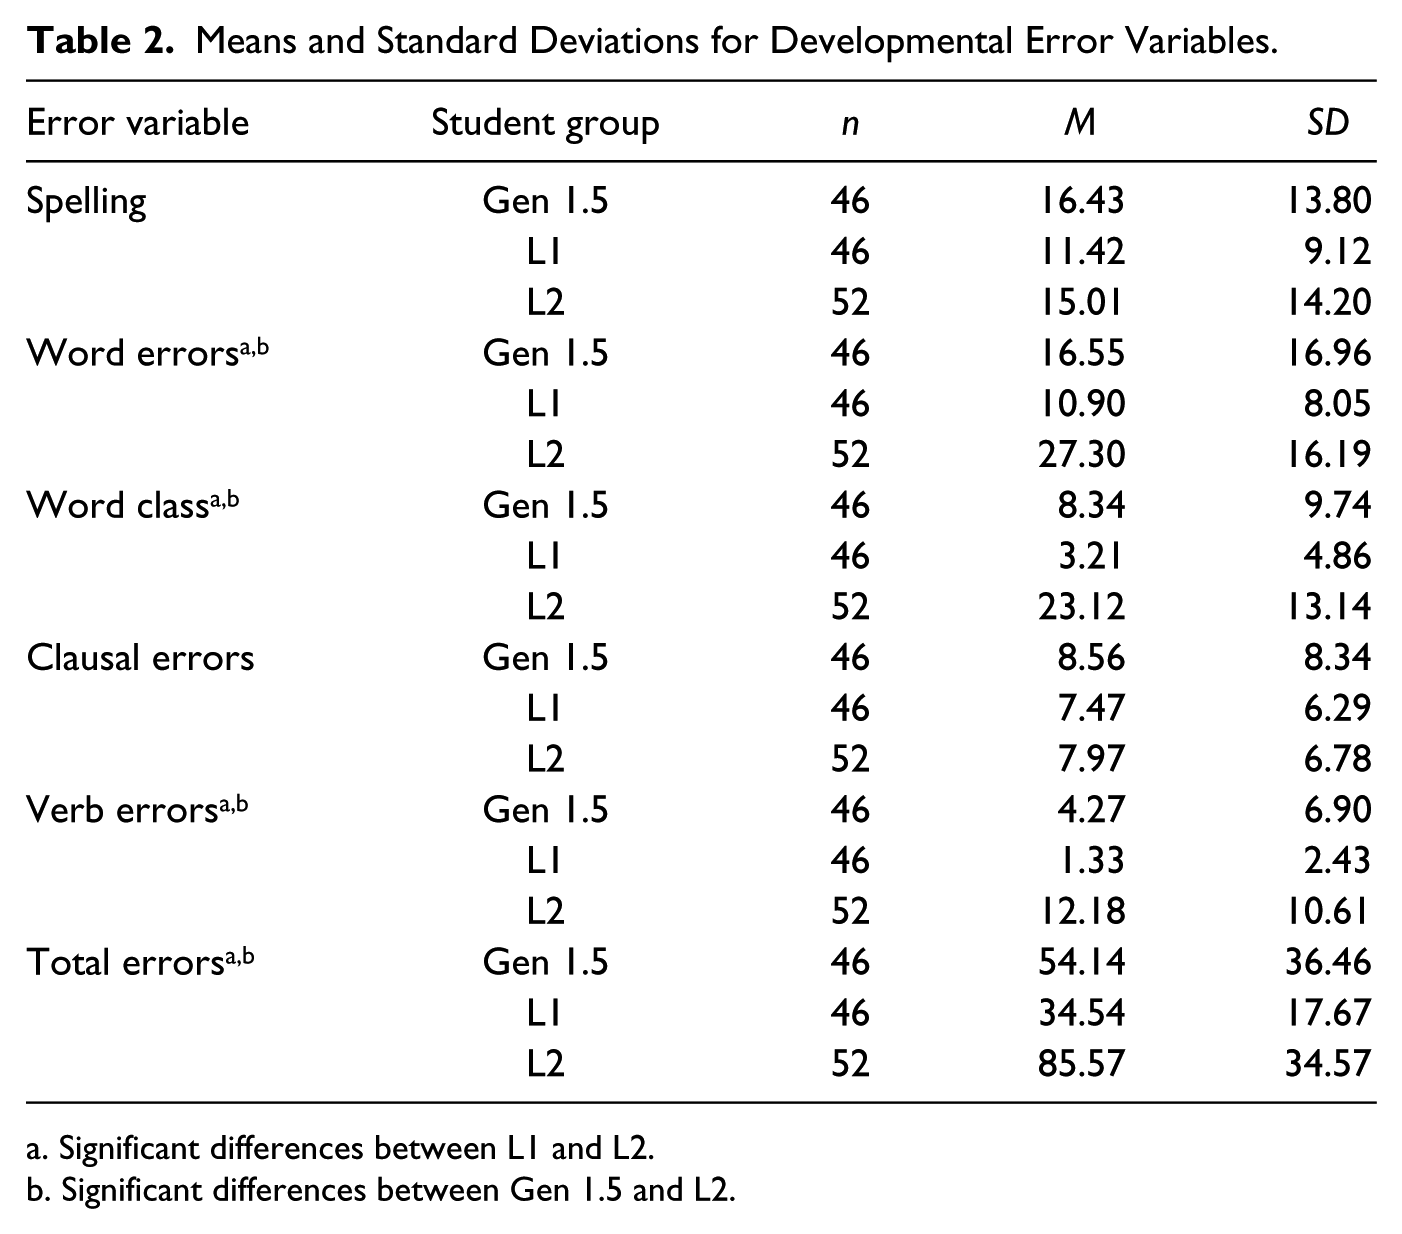
Significant differences between L1 and L2.
Significant differences between Gen 1.5 and L2.
To determine whether patterns of difference present in Table 2 represented significant differences, inferential statistics were conducted. The Pillai’s trace test was used to investigate the multivariate main effect and was significant, Pillai’s trace = .512, F(12, 274) = 7.85, p < .001. The partial eta-squared (η2) = .26 indicates that 26% of the variance in the six error variables could be accounted for by the independent variable: student group. This is considered a large effect size. An informal MANOVA was also run not including the total identified errors variables, and the changes to these reported statistics were negligible.
Univariate main effects were conducted on the six error variables. The assumption of homogeneity of variance was met. A univariate between-subject effects table for the six error variables is found in Appendix F.
As shown in Appendix F, significant differences were present in the word error (composed of word form, wrong word errors, and subject-verb agreement errors), word class (composed of determiner and prepositional phrase errors), verb errors (composed of verb form and verb tense errors), and total identified errors. The spelling and clausal error categories were not significantly different among the three groups.
In post hoc Bonferroni test of the error variables, no Generation 1.5–L1 comparisons generating significant differences for this set. By contrast, both the Generation 1.5–L2 and L1–L2 comparisons were significantly different for word error, word class, verb error, and total identified errors (see Table 2).
3. Will linguistic patterns in Generation 1.5 expository writing distinguish their writing from their L1/L2 classmates’ writing within developmental writing classes?
Once again, a one-way MANOVA was run to adequately investigate student group differences. The dependent variables were (a) number of words, (b) Flesch–Kincaid grade level, (c) word length, (d) spoken features of language, (e) prepositional phrases, (f) academic features of language, and (g) personal pronouns.
As with the previous MANOVA, the assumptions of normality were not met for some dependent variables, but the large sample size in coordination with the central limit theorem (Johnson & Wichern, 2007) alleviates concerns regarding normality issues. The assumption of homogeneity of variance and covariance was met. Table 3 provides means and standard deviations for each of the student groups on the linguistic development variables.
Means and Standard Deviations for Developmental Linguistic Variables.
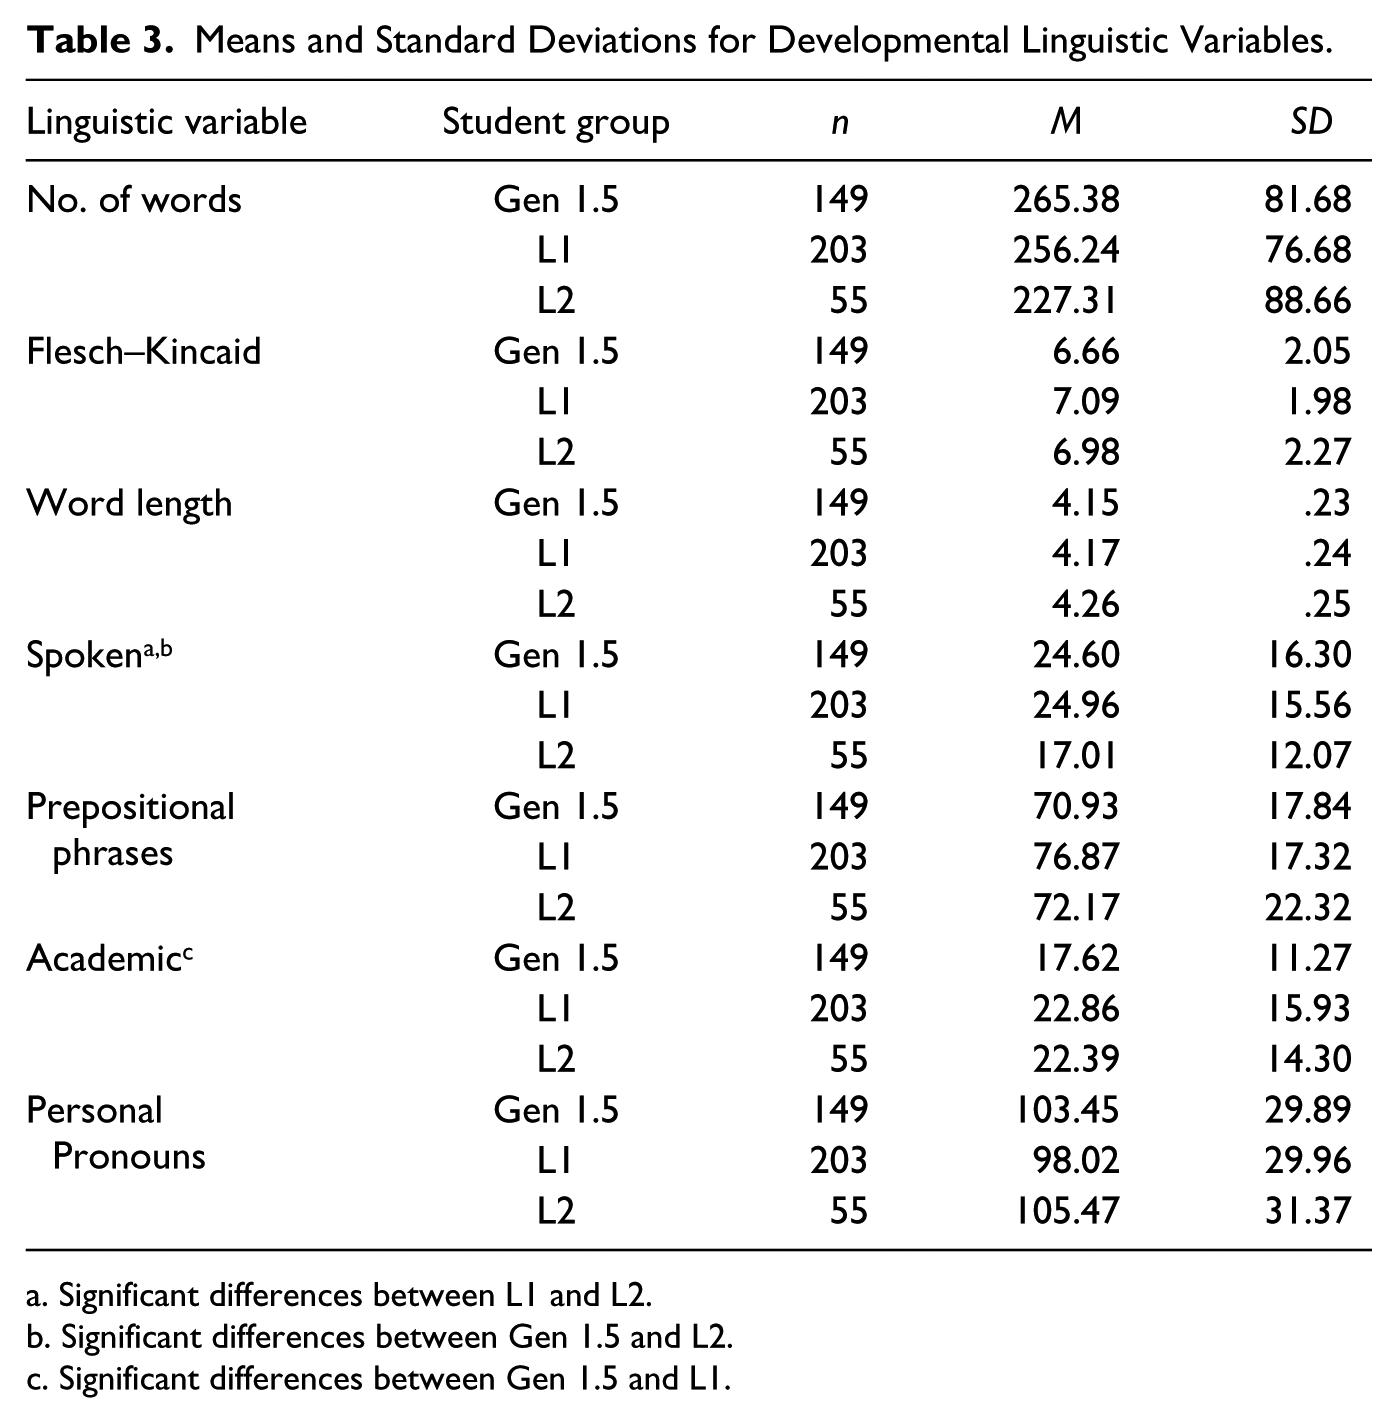
Significant differences between L1 and L2.
Significant differences between Gen 1.5 and L2.
Significant differences between Gen 1.5 and L1.
Inferential statistics once again help determine the meaningfulness of the perceived differences in Table 3. The Pillai’s trace test was significant, Pillai’s trace = .130, F(14, 798) = 3.95, p < .001, with the partial eta squared (η2) = .07, suggesting that 7% of the total variance in these seven variables, could be accounted for by the student groups. This is considered a moderate to low effect size. Results from the univariate analyses are available in Appendix F.
Finally, to determine the specific groups responsible for the significance found in this MANOVA, Bonferroni post hoc comparisons were made (see Table 3). Again, the assumption of homogeneity of variance was met.
As Table 3 demonstrates, the spoken features of language variable was not significantly different between Generation 1.5 and L1 students but was significant between Generation 1.5–L2, and L1–L2. Use of the academic features of language variable was significantly different between Generation 1.5–L1, but the academic features of language variable was not significantly different between Generation 1.5–L2 or L1–L2.
Discussion
The current study investigated potential language-use differences among three students groups: Generation 1.5, L1, and L2 students. Findings from the current study suggest that Generation 1.5 writers may produce texts that more closely resemble L1 writing than L2 writing. These patterns were particularly evident in the error analysis. However, findings from the current study can be linked to previous research to further our understanding of Generation 1.5 writing.
Holistic Quality of Writing for Generation 1.5 Students
Including holistic quality scores as one of multiple textual measures provides an overarching sense of the groups’ writing. That is, comparing language-use variables among different groups should take into account differences in written proficiency. While one 30-minute timed writing sample is not sufficient to measure the construct of “writing ability,” reporting holistic quality scores allows readers to consider how general similarities between Generation 1.5 and L1 holistic quality along with the lower writing proficiency of L2 writers might interact with scores on language-use variables. It should be acknowledged that placement into developmental classes may have been done based on similar writing samples using a similar holistic rubric, effectively ensuring similarities in the current study. That said, placement across institutions is not standardized, and having these holistic scores provides a better sense of the comparability of writing across groups and institutions. While readers may choose to accept these holistic quality results cautiously due to moderate interrater reliability, having a general sense of writing quality is useful as a frame of reference.
Error Patterns
Accuracy may seem like a rather given source of difference among the writing produced by L1 and L2 writers in this study. One might intuitively sense that, as an L2 English learner’s interlanguage develops, he or she will inevitably produce L2-like errors; however, because expected patterns of writing performance have not been established for Generation 1.5 students, it remains unclear whether their patterns of error will more closely resemble L1 tendencies or L2 tendencies or create a unique profile.
From the current study, it appears that Generation 1.5 writing at the developmental course level more closely resembles L1 writing in terms of error patterns. In fact, no significant differences among error variables emerged between Generation 1.5 and L1 writing at the developmental level. Furthermore, all significant differences between Generation 1.5 and L2 texts were also significant between L1 and L2 in the same direction (e.g., Generation 1.5/L1 fewer errors, L2 more errors). The similarities of error patterns between Generation 1.5 and L1 writers in the current study are surprising in light of previous research (e.g., di Gennaro, 2009; Ferris, 2009; Levi, 2004; Muchinsky & Tangren, 1999).
The combined pilot studies of Doolan (2011b) and Doolan and Miller (2012) indicated that error patterns may be the most useful area for distinguishing Generation 1.5 and L1 texts; however, these patterns were not evident in the current study. Because almost identical error coding procedures and research methods were used in Doolan and Miller (2012) and the current study, the lack of significant differences for any error category between Generation 1.5 and L1 texts is all the more surprising. Differences might be accounted for by the different writing prompt, different amounts of time provided, and different writing proficiency levels of participants.
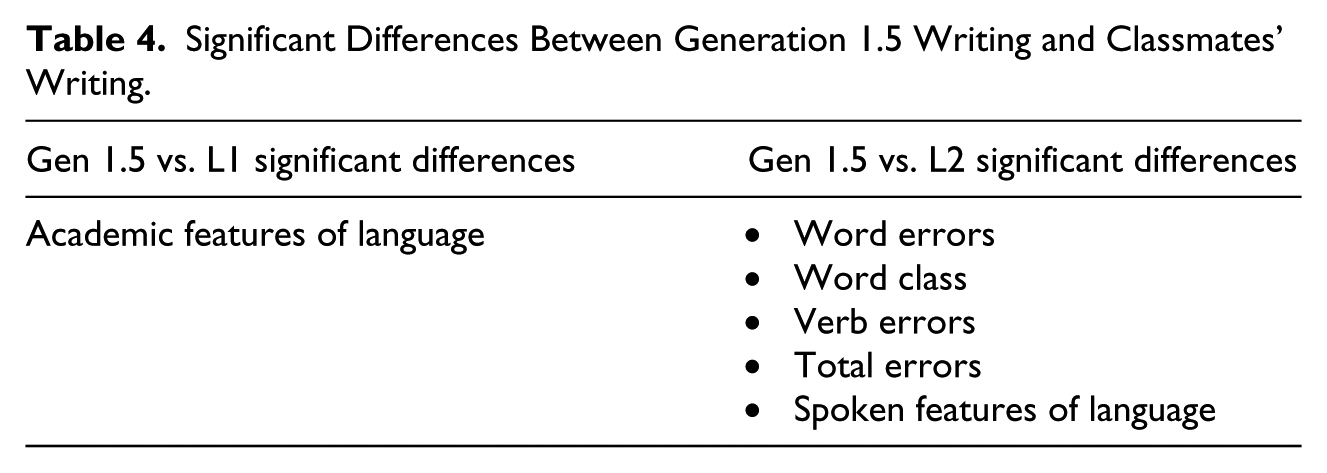
To summarize the differences between Generation 1.5 writing in comparison to L1 and L2 writing, Table 4 is provided. Findings from the current study do not support claims by Doolan and Miller (2012), Levi (2004), or Ferris (2009) on a host of expected differences between Generation 1.5 and L1 written error patterns. In addition, the current study does not confirm di Gennaro (2009, 2013), Ferris (2009), or Muchinsky and Tangren (1999), who identified similarities between Generation 1.5 and L2 written error patterns. Finally, studies by Frodesen and Starna (1999) and Frodesen (2009) did not compare Generation 1.5 writing to L1 or L2 groups, but, to the degree that the texts were comparable, the error patterns described in their case studies were not unique to Generation 1.5 in the current study. Generation 1.5 writers shared very few error patterns with L2 students, challenging the common claims of Generation 1.5 writing characterized by a mixture of L1 and L2 errors. On the other hand, because Generation 1.5 writing is being compared to other developmental writers, it should be acknowledged that error patterns are not absent, but simply comparable to L1 developmental students, who also exhibit patterns of errors.
Significant Differences Between Generation 1.5 Writing and Classmates’ Writing.
Ultimately, the error analyses in the current study provided the strongest support of differences among Generation 1.5/L1 versus L2 students. The number of significantly different variables coupled with large effect sizes, serve as persuasive evidence of the differences between Generation 1.5 and L2 texts, and the similarities between Generation 1.5 and L1 essays for this study. The next section reports the linguistic patterns, and similarly places findings within the broad context of Generation 1.5 literature.
Linguistic Patterns
For the linguistic variables that were included in the current analysis, a general comment should be made. Overall, there were very few significant and practically important differences found across the three groups. While two variables demonstrated significant differences among the seven developmental between-subjects comparisons made in these linguistic analyses, both of the effect sizes for significant differences were small (partial η2 of .03 and .03). As such, while there are significant differences to discuss in the linguistic development analyses, they are considerably less practically important than the differences observed in the error analyses. To speculate on why such small differences were observed in the linguistic development variables, it may be the case that these variables are more effective at identifying group differences when comparing writers at different course levels (e.g., sixth grade and 12th grade) than comparing writers within the same course level.
The only significant difference among the linguistic measures at the developmental level contrasting Generation 1.5 and L2 writing was the spoken features of language variable. For this variable, both the Generation 1.5 and L1 texts contained significantly more spoken features of language than the L2 students’ texts. One common element in Generation 1.5 literature is reference to the spoken language features that are likely to exist in Generation 1.5 academic writing. The argument of Generation 1.5 students as “ear learners” is mildly supported by the greater use of spoken features of language in Generation 1.5 texts than in L2 texts at the developmental course level (Reid, 2005). Findings from the current study do not confirm or refute Generation 1.5 oral proficiency, but it does suggest that some features commonly associated with spoken language may appear in their writing in native-like frequencies.
For all of the linguistic variable statistical analyses conducted in the current study, the academic features of language variable at the developmental level was the only one that indicated significant differences between Generation 1.5 and L1 students. Ultimately, the overall similarities between Generation 1.5 and L1 in the present sample are the clearest message taken from the current study; however, for scholars still interested in using a broad definition of Generation 1.5 and pursuing Generation 1.5 and L1 writing differences, the academic features of language variable at the developmental level might serve as a point of departure for further investigation, including exploration of other variables indicative of academic written English.
Finally, no significant differences were observed for the linguistic variables: number of words per text, word length, prepositional phrases, Flesch–Kincaid grade level, or personal pronouns at the developmental course level. As such, these five variables may be less successful at distinguishing the writing of student groups within the developmental course level under a timed-writing condition. Because no group differences were observed, the findings cannot be used as support of claims for Generation 1.5 writing as different from the writing of their L1 and L2 classmates, despite some such claims in prior literature. For example, claims that Generation 1.5 writing compared to L2 writing contain more prepositional phrases and personal pronouns (Connerty, 2009) were not confirmed. Empirical (Levi, 2004), anecdotal (Allison, 2009) and impressionistic (Ferris, 2009; Rodby, 1999) claims of vocabulary ability were not supported in the measure of word length, though clearly additional measures are needed to fully capture the larger construct of vocabulary ability. Finally, the current study did not support claims of more words per text in Generation 1.5 compared to L2 texts (di Gennaro, 2009; Muchinsky & Tangren, 1999).
Broader Implications
The study of social factors related to Generation 1.5 writers has received much greater attention in previous research than textual factors or comparative work, which is the focus of the current study. Yet both implicit and explicit in previous literature on Generation 1.5 student writing at the postsecondary level is the concept that their writing is linguistically different from the writing of their L1 and L2 peers. According to previous research, Generation 1.5 students are still language learners, with fossilized error patterns as well as patterns of informal, conversational language use that appear in their writing. These assumptions are often accepted in Generation 1.5 writing scholarship in theory, pedagogy, and curriculum, with recommendations for teachers and administrators on how to address language learning issues.
Based on findings from the current study, I could find little linguistic justification for using the demographically defined category of Generation 1.5 as defined here. In terms of error production, and linguistic variables (with the exception of the academic features of language variable), there were no significant differences between Generation 1.5 texts and L1 texts. As such, analysis of this sample using these language-use variables suggests that the Generation 1.5 students in this study are not disadvantaged with respect to language issues to a greater degree than L1 students who are within the same course level, if placed appropriately. In fact, these findings are supported by new census data for patterns of social stratification more broadly, indicating that 77.6% of those who self-report as speaking a non-English language at home also self-report as speaking English “very well” or “well,” with those numbers still higher for those going on to earn bachelor’s degrees.
In the larger discussion of Generation 1.5 writing then, it is possible that scholarship on Generation 1.5 writing research may be (a) underrecognizing the similarities between Generation 1.5 and L1 students, (b) overemphasizing the need for specific Generation 1.5 language instruction, and/or (c) using Generation 1.5 broadly defined instead of the subset of language learners subsumed within this larger definition. As such, results from the current study suggest that, at least in terms of language use, it may be more appropriate to approach Generation 1.5 and L1 writing groups as the same in developmental writing courses contrary to the popular belief of Generation 1.5 writers (broadly defined) as a type of language learner. Though more empirical evidence would be needed to validate this claim, the current study suggests that shifting Generation 1.5 into language classes—as Matsuda (2008) suggests may be necessary when resources are limited—may be inappropriate, because their language use, at least in this sample, is not significantly different from developmental L1 language use.
Limitations, Conclusion, and Future Research
Although efforts were made to control data collection procedures and follow transparent and easily replicable research methods, the current study has a number of limitations. First, this study used frequency counts as a point of departure for identifying differences in patterns of language use. It should be noted that one can make no claims as to how effectively these groups were using the linguistic variables based on frequency counts. That is, just because a group of writers is using a linguistic feature does not necessarily mean they are using it well, using it accurately, or using the same feature to serve the same function (thus the importance of ongoing qualitative research on this topic).
Another limitation is the potential differences in placement procedures at the different institutions. Because a single standard for placing students was not used across the participating institutions, using developmental course level data should be seen as reflecting approximate writing ability levels. Nevertheless, reporting holistic writing quality provides more control of writing proficiency than many Generation 1.5 research studies.
Finally, inferential statistics make generalizations about a larger population. However, because this researcher collected writing in a nonrandom fashion, readers should not overgeneralize results of the current study to the full Generation 1.5 population. That is, research at a number of additional institutions is needed before findings can be confidently generalized to the larger Generation 1.5 population.
As a cautionary example of not overgeneralizing these findings, it is important to mention the much underresearched issue of Generation 1.5 writing in secondary school contexts. Secondary-level Generation 1.5 students and Generation 1.5 postsecondary students might generate quite different patterns of writing production. The present study is clearly limited to postsecondary writing contexts.
Some reasonable conclusions for research can be advanced. With respect to Generation 1.5 developmental writing, findings from across studies are demonstrating conflicting results. Consequently, the assumption that Generation 1.5 writing resembles L2 writing in consistent ways should be treated cautiously until future empirical research demonstrates predictable patterns (reexamining these or perhaps investigating other variables). In fact, based on the current study, Generation 1.5 writing may resemble L1 writing more closely than has been portrayed in previous literature.
Based on the current study, teachers, administrators, and researchers should be careful to distinguish the long-term U.S. resident language learners from the multilingual students with highly functional English language proficiency. For researchers, two options seem most appropriate. First, as long as survey data are used as defining criteria for Generation 1.5 students, collecting and reporting a wide range of survey items (e.g., Appendix B) will allow readers to track patterns of difference in student backgrounds that may account for differences among separate studies. Second, greater attention to course placement may be appropriate for Generation 1.5 writing scholarship and administration. Based on the current study, Generation 1.5 students placed into mainstream classes may not demonstrate patterns of language learning; therefore, the Generation 1.5 writers in L2 writing classes, along with the placement procedures for assigning these students to language classes should be scrutinized to ensure that Generation 1.5 students with adequate English proficiency are not misplaced into language learning classes.
Generation 1.5 writing research has arisen in response to teachers’ desire to better address the needs of this growing segment of L2 classrooms. The number of well-attended conference presentations and publications of Generation 1.5 writing research in the past 15 years is a testament to the level of interest in the writing these students produce. Yet, to advance this area of inquiry, efforts such as the work by Goen-Salter, Porter, Swanson, and Vandommelen (2002) to gather groups of teachers and pinpoint markers of Generation 1.5 writing could be beneficial. Next, empirical efforts such as the current study will need to validate the claims that Generation 1.5 students are a type of language learner. Instructional and pedagogical suggestions can then build on theoretical efforts such as this one designed to demonstrate patterns of language use. The current study adds to existing research by providing one set of empirical evidence to suggest that stable language use patterns may not exist between Generation 1.5 (broadly defined) and L1 student groups. Additional research will further help writing teachers, administrators, and scholars link perceived Generation 1.5 writing issues with textual realities.
Footnotes
Appendix A
Appendix B
Appendix C
Appendix D
Appendix E
Appendix F
Acknowledgements
I would like to thank Dr. William Grabe for extensive feedback on this article. Thank you to Drs. Stoller, Biber, Glau, and Asención Delaney for providing a variety of perspectives and improvements to this research, and thank you to the anonymous reviewers for their attention to detail and suggestions for improvement on this article. Finally, I thank Dr. Fitzsimmons-Doolan for multiple readings and thoughtful comments to improve the quality of this article.
Declaration of Conflicting Interests
The author declared no potential conflicts of interest with respect to the research, authorship, and/or publication of this article.
Funding
The author disclosed receipt of the following financial support for the research, authorship, and/or publication of this article: The author received an English Department Dissertation Research Award (2010), Language Learning Dissertation Grant (2010), and AZ-TESOL Special Project Mini-Grant (2009) that partially supported this research.