
Abstract
This study investigated the impact of mathematics curriculum (standards based vs. traditional) on the performance of sixth and seventh grade students with disabilities on multiple-choice and open-ended assessments aligned to one state’s number and operations and algebra standards. It also sought to understand factors affecting student performance on assessments: ability status (students with and without disabilities), curriculum (standards based vs. traditional), and assessment type (multiple choice vs. open ended). In all, 146 sixth grade students and 149 seventh grade students participated in the study. A linear mixed model for each grade revealed students with disabilities did not perform better in either curriculum. Furthermore, curriculum type was not a significant factor affecting student performance; however, ability status, time, and assessment type were. The implications of these results are discussed.
The teaching and learning of mathematics has been and continues to be a major issue for schools in the United States (Ellis & Berry, 2005). No Child Left Behind (NCLB) has increased the importance and focus on mathematics teaching and learning as student performance in mathematics, including students with disabilities, is one of the components for determining a school’s adequate yearly progress (Individuals with Disabilities Education Improvement Act of 2004; Yell & Drasgow, 2005). With elevated significance, critical questions in the field of mathematics education arise regarding what are the most effective means of educating students, including students with disabilities. One major question involves if a particular curriculum approach (traditional or standards based) is more successful in engaging and educating these students.
Mathematics Education
The ideas and beliefs on how best to educate U.S. students in mathematics have been contentious at best. The discussions have become so intense and heated they have often been referred to as a war (Reys, 2001; Ross, 2001; Schoen, Fey, Hirsch, & Coxford, 1999). The “math wars” center on the teaching of mathematics in a traditional manner, one more focused on computation and learning rules and procedure, versus an approach that is standards based, more focused on problem solving, understanding mathematical concepts, developing procedures, and aligned with the standards documents developed by the National Council of Teachers of Mathematics (NCTM, 1989, 2000). The NCTM standards, originally proposed in 1989 and refined in 2000, set in motion the pedagogical debate when they advocated raising curriculum content expectations with regard to the depth of mathematics students should know, understand, and demonstrate on assessments. The NCTM standards also pushed a different pedagogy—a more student-centered, constructivist approach where the teacher is more of a facilitator for student learning rather than a disseminator of information (i.e., rules and procedures), now referred to as standards based or reform based (Miller & Mercer, 1997; NCTM, 2000; Shenk & Thompson, 2003; Woodward & Montague, 2002). Contributing to the ongoing debate is the recent report by the National Mathematics Advisory Panel (2008), which stated an all one or the other (i.e., traditional vs. standards based) approach to mathematics teaching and learning is not beneficial and is, in fact, contrary to research.
Standards-based curricula are considered the curricula derived from projects sponsored by the National Science Foundation (NSF) to develop curricula aligned with the NCTM (1989) standards (Shenk & Thompson, 2003). Thus, standards-based curricula represent curricula developed after the 1990s across the three grade spans (elementary, middle, high school) to be comprehensive approaches to the teaching and learning of mathematics. They are a reaction to traditional curricula, which were thought to be ineffective by some following the Second International Mathematics Study (McKnight et al., 1987). Standards-based curricula emphasize the development and understanding of mathematics concepts and connections between mathematical ideas and are less focused on straightforward computation (NCTM, 1989, 2000). Standard-based curricula have students using mathematics to solve problems from more real-world contexts as well as working on problems in which a means to an answer is not immediately evident and which require mathematical reasoning, problem solving, and multiple procedures to arrive at a solution (NCTM, 1989, 2000). The standards-based curriculum materials incorporate the use of calculators as well as small group instruction into their lessons, all within heterogeneous classrooms (Shenk & Thompson, 2003).
Traditional mathematics curricula are considered those focusing more on computational fluency with the teacher demonstrating how a procedure is to be done and then students repeatedly practicing the procedure (Battista, 2001; Shenk & Thompson, 2003). Critics often refer to traditional curricula as a drill and grill or drill and kill approach to teaching and learning mathematics (Shenk & Thompson, 2003). Traditional curricula are considered to be more focused on rote memorization of facts and skills with students needing “mastery” of those skills or rules before moving to context (i.e., story) problems (Battista, 2001).
The math wars over pedagogy have a direct impact on curricula (i.e., textbooks and other instructional materials). And research has shown textbooks influence the mathematics content teachers teach and students learn (Porter, 1989; Schmidt et al., 2001). The approach in a mathematics textbook is often similar to the approach teachers use in presenting the content (Reys, Reys, Lapan, Holliday, & Wasman, 2003). Studying student performance and achievement across different textbook curricula, such as a traditional set of instructional materials compared to a standards-based set of instructional materials, is critical in determining if differences in curriculum affect student achievement.
Mathematics in the Middle Grades
Although mathematics education at all grades has endured the math wars, the middle grades have received much attention and are recognized as a critical time in a student’s education (Honig, 1987; “An Open Letter,” 1999; Riordan & Noyce, 2001). Mathematics at the middle grades level has been and continues to be a concern to mathematicians and educators. In the 1980s and 1990s, middle grades mathematics curriculum was criticized as being nothing more than a repeat of elementary mathematics, with little to no new content expected for students to learn (Flanders, 1987). Although there has been some change, the curriculum and student achievement during these years still lag behind those in high-achieving countries by as much as a year or more (Schmidt, Houang, & Cogan, 2002).
Although the debate regarding mathematics teaching and learning, including curricula, at the middle grades level has remained intense, researchers have demonstrated the benefits of standards-based curricula for students without disabilities at this level (Carroll, 1998; Cobb et al., 1991; Fuson, Carroll, Drueck, 2000; Reys et al., 2003; Riordan & Noyce, 2001; Wood & Sellers, 1997). Reys et al. (2003) found that eighth grade students educated for at least 2 years using either MATH Thematics or Connected Mathematics, both standards-based mathematics curricula, outperformed students educated with more traditional curricula. The higher achievement was particularly noted in the mathematical strands of algebra and data analysis, probability, and statistics. Riordan and Noyce (2001) also found eighth grade students, without any documented disability, educated with Connected Mathematics performed better on a statewide mathematics assessment than did students who received a traditional mathematics curriculum. The results by Riordan and Noyce were consistent across the top, middle, and bottom levels of student performance.
Although research exists on general education students’ achievement with standards-based curricula and traditional curricula (Carroll, 1998; Fuson et al., 2000; Reys et al., 2003; Riordan & Noyce, 2001; Wood & Sellers, 1997), there is little evidence as to the effectiveness of one approach versus the other for students with disabilities. Students with disabilities are still largely excluded from research on mathematics standards and the curricula aligned with these standards (Kroesbergen & Van Luit, 2003; Woodward, 2004). Thus, the questions remain, what is the best curriculum to use with these students in the limited time schools have? And “what is the most worthwhile use of the always limited instructional time for these students?” (Woodward & Montague, 2002, p. 95).
Mathematics Education and Students With Disabilities
Of the limited research conducted on standards-based mathematics curricula and students with disabilities, only one published study focused on the middle grades levels (Woodward & Brown, 2006). Woodward and Brown (2006) compared two different middle school mathematics curricula both aligned to the NCTM 2000 standards: Connected Mathematics and Transitional Math Level 1. The researchers found that for sixth grade students with learning disabilities or at risk for special education services the Transitional Math Level 1, which was designed using research and principles from special education literature, produced greater academic outcomes for this group of students and that they had more positive attitudes toward mathematics.
Other standards-based mathematics curriculum studies involving students with disabilities have been conducted but at different grade levels (Baxter, Woodward, & Olson, 2001; Jackson & Neel, 2006; Woodward & Baxter, 1997). For example, Woodward and Baxter (1997) examined third grade students with and without disabilities educated using either Everyday Mathematics (a standards-based elementary mathematics curriculum) or a traditional mathematics curriculum. Although Woodward and Baxter found students in general who were educated using Everyday Mathematics outperformed those who received a traditional curriculum, students with disabilities and low-achieving students did not show as much improvement as average or above average students. However, the lower performance of students with disabilities in this standards-based mathematics curriculum could be the result of these students being minimally involved in the lessons, which was found by Baxter and colleagues (2001) when they studied Everyday Mathematics and students with and without disabilities. Baxter and colleagues suggested that students with disabilities and other low-achieving students might need additional support when in standards-based mathematics curricula, as these curricula expect students to learn more mathematics—both concepts and procedures and rules.
The lack of research as well as the equivocal findings regarding students with disabilities and their participation in standards-based middle school mathematics curricula have resulted in many stipulating that more research is needed. Cawley (2002) indicated research is needed to study if students with disabilities are successful in mathematics classrooms that employ a standards-based curriculum. This research project sought to address the charge and explore the following questions: (a) What impact does middle school mathematics curricula (standards based vs. traditional) have on the performance of students with disabilities on assessments aligned to state standards? and (b) What factors affect the performance of middle school students on assessments aligned to state standards, considering ability (students with and without disabilities), curriculum type (traditional vs. standards based), assessment type (multiple choice vs. open ended), and time (e.g., first, second, third)?
Method
Participants
A total of 146 6th grade students and 149 seventh grade students participated in this research project. Participation rates represented 78.5% and 78.7% of the eligible populations of students, respectively. Participation rates of 100% were not achieved because of parents either not signing the consent forms or indicating that they did not want research data collected on their student. Of the 146 sixth grade students, 28 were identified as a student with a disability, representing 18.5% of the population. Just more than half of the 28 students with a disability were identified as having a learning disability (n = 14, 51.9%), but none with a learning disability in mathematics; rather, the majority were identified as having a learning disability in reading (n = 10). Teachers in all the schools indicated students with a recognized disability in mathematics were not included in general education mathematics classes but were taught mathematics in a pull-out special education setting. The next most frequent disability category was speech and language impairment (n = 6, 22.2%), followed by attention-deficit/hyperactivity disorder (ADHD; n = 4, 14.8%), autism (n = 2, 7.4%), and hearing impairment (n = 1, 3.7%). The sixth grade students were evenly dispersed across gender: 72 males (49.3%) and 74 females (50.7%).
The 146 sixth grade students were spread across seven teachers in eight separate inclusive mathematics classes across five school districts. Four teachers and four classes composed the students who received a traditional curriculum (n = 65, 44.5%). Three teachers and four classes (one teacher taught two inclusive classes) composed the students who received a standards-based curriculum (n = 81, 55.5%). Students with a disability were relatively evenly split across the two curricular approaches: 13 received a traditional curriculum and 15 a standards-based curriculum. Of these seven teachers, six taught in middle school and one in an elementary school. Three of the teachers were elementary certified and four were certified in mathematics education. Two of the seven were male; five were female. The average number of years teaching across the seven teachers was 15.2 years, with a range of 3 to 25. For two teachers it was their 1st year teaching sixth grade mathematics (one previously taught elementary and one seventh grade mathematics), and for one it was her 2nd year (previously taught elementary).
The 149 seventh grade students were dispersed across four teachers in four school districts and seven separate inclusive mathematics classrooms. Of the seventh grade students participating in the project, 53% (n = 79) received a traditional curriculum from two teachers in four classes (teachers each taught two classes), whereas the other 70 students (47%), were taught the standards-based curriculum by the other two teachers across three classes (one teacher taught two classes). There were slightly more seventh grade females who participated in the study (n = 80, 53.7%) than males (n = 69, 46.3%). All four of the seventh grade teachers were located in a middle school and all were certified in mathematics education at the middle grades level. The average number of years of teaching was 9.25 (range = 8–10), and each had been using the respective curricula for a minimum of 6 years. Three of the seventh grade teachers were female; one was male.
Of the seventh grade students, 22 (14.8%) were identified as a student with a disability. More than half of the students with disabilities were identified as having a learning disability (n = 14, 63.6%). The next most frequent disability categories were autism (n = 3, 13.6%) and ADHD (n = 3, 13.6%), speech and language impairment (n = 1, 4.6%), and hearing impairment (n = 1, 4.6%). Ten students with a disability were educated with the traditional mathematics curriculum and 12 with the standards-based mathematics curriculum.
Setting
The study took place across five school districts in a Midwestern state. Four of the five school districts were located in the same county; one was in another county. The four schools had similar demographic features, such as ethnic representation (i.e., largely Caucasian), socioeconomic status, and community features. The four schools in the same county were chosen because two schools used the same standards-based mathematics curriculum (Connected Mathematics; Lappan, Fey, Fitzgerald, Friel, & Phillips, 2004) and two schools used equivalent traditional curricula (i.e., the same curriculum, just one used an earlier edition; Chapin, Illingworth, Landau, Masingila, & McCracken, 2000; Charles et al., 2008). The implementation of either curricular approach was a result of alignment with the pedagogical philosophy of each district’s middle school mathematics department, at a minimum, but often the entire district’s mathematics department. Schools in the two curricular types had adopted the curricular approach for multiple years. The two schools using the standards-based curriculum had used it for 12 years in one district and 6 years in the other. The two school districts that implemented a traditional approach had also been using their particular materials for several years and had no history of ever using standards-based curriculum at any level. The first author was aware of the district-implemented curricular arrangement across schools because of a preexisting relationship with the individual schools.
The fifth school district was selected because the two schools implementing a standards-based mathematics curriculum initially indicated lower enrollments of students with disabilities in their inclusive mathematics classrooms. The fifth school had been using the same standards-based mathematics curriculum for the same number of years as one school in the initial group (12). The first author had a preexisting relationship with the school district and was aware of the district-implemented middle grades mathematics curriculum.
Research took place in inclusive mathematics classes, meaning all classes included at least one student with a disability in the general education mathematics class. All inclusive sixth and seventh grade mathematics classes at the five participating schools were included in the research project. Thus, classes were selected on a consensus basis in the schools. Classes were not assigned to use a particular curriculum; rather, teachers taught using the curriculum adopted by their district for sixth and seventh grade. For the purposes of the research project, no change was made to the curriculum implemented in any class. All the classes in the study received mathematics instruction for just one class period a day. An average of 59.2 min per day was spent on mathematics instruction in the sixth grade classes across all schools (range = 49–71). Those using the standards-based curriculum averaged 62.3 min (range = 56–71), and those using the traditional 59.5 min (range = 59–60). For seventh grade, mathematics instruction was an average of 53 min per day across all schools (range = 45–60). Within seventh grade, the schools using the standards-based curriculum averaged 57 min of mathematics instruction per day (range = 55–60) and the schools using a traditional curriculum averaged 47 min per day (range = 45–49).
Procedure
All students who had consent to participate in the project completed bimonthly assessments—one multiple-choice assessment and one open-ended problem-solving assessment. In total, there were eight assessments of each type spread across 9 months (note: 9 months to account for breaks and state general large-scale assessment testing). All teachers conducted all the assessments with their respective classes. For every assessment, teachers instructed their students that they had 10 min to complete each assessment. All students were allowed to use a calculator on all assessments. The teachers were also instructed to allow students with disabilities to have the accommodations listed in their individualized education program (e.g., test read aloud).
During the year, teachers taught their curriculum (traditional or standards based) as typical; no intervention aside from the assessments occurred. Teachers who taught a traditional curriculum (i.e., the one more focused on rote computation and procedures and rules and that was teacher directed) used Prentice Hall Mathematics (Charles et al., 2008) or Prentice Hall Mathematics in the Middle Grades (Chapin et al., 2000). Both of these curricular materials are considered traditional curricula because of their content, which directly suggests teaching rules and procedures and having students mainly practicing computation. Teachers who taught using a standards-based curriculum (i.e., the one more focused on understanding concepts and developing procedures and that was student centered) used Connected Mathematics (Lappan et al., 2004). Connected Mathematics is considered a standards-based mathematics curriculum as it was developed during the 1990s with funding from NSF to align to the NCTM (1989) standards. Teachers taught their respective curricula consistent with the pedagogical practices of the curriculum (i.e., small group student-directed learning in the classrooms that implemented Connected Mathematics; more individual work, teacher-directed learning in classrooms that implemented the Prentice Hall textbooks).
Instruments
The primary means of data collection in the study was the bimonthly assessments, which alternated between multiple-choice and open-ended problem solving. Assessments were evaluated for whether students answered each problem correctly or incorrectly. To determine reliability (i.e., to determine if the instruments are dependable), the split-half reliability technique was used for both the sixth grade and seventh grade data sets. Each data set was randomly split into two halves and the model was run for each data set. This provided predictions for each assessment for each combination of ability and condition, which resulted in 64 predictions. The correlation was then computed among the predictions for each grade. The overall correlation (i.e., across both assessment types) for the sixth grade data set was 0.87, and the correlation for the seventh grade data set was 0.93, both indicating a high degree of reliability.
The multiple-choice assessments for each grade consisted of 10 questions (see Appendix A), with the majority of the questions being just that, multiple-choice problems, each with four given answers. However, it should be noted that there were a few fill-in-the-blank procedural questions on the multiple-choice assessments (fewer than one per assessment). An example of such questions is, 434 × 3 = ____. The open-ended problem solving assessments each consisted of three questions; however, the questions could elicit multiple responses by having parts a, b, and c (see Appendix B). For the sixth grade, the fewest number of responses requested on an open-ended problem-solving assessment was three and the greatest number was nine. For the seventh grade, the fewest number of responses requested on an open-ended problem-solving assessment was three and the greatest number was seven.
The multiple-choice and open-ended problem-solving assessments reflected only two of the NCTM (2000) content area strands: number and operations and algebra. These two were selected because of their heavy emphasis at the sixth and seventh grades in the state standards where the research study was conducted. The assessments were created by the researchers by adapting released items from the state’s general large-scale assessment (note that the assessment changes questions yearly but the format remains the same; the state releases half of the items on its tests each year on its Web site). This ensured that problems were aligned to state standards. All problems selected were reviewed by a mathematics education expert, with sample assessments then reviewed by grade-appropriate teachers.
The sixth grade multiple-choice assessments were evenly split across the number and operations and algebra standards, meaning five problems per standard, per assessment. Each open-ended problem-solving assessment consisted of one number and operations problem and one algebra problem. The third problem was randomly selected from a pool of all open-ended problem-solving questions across the two standards. The seventh grade multiple-choice assessments were weighted slightly more toward algebra than number and operations. Six of the ten problems on each multiple-choice assessment were from the algebra and four were from the number and operations standard. For the open-ended problem-solving assessments, each consisted of one number and operations problem and one algebra problem. The third problem was randomly selected from a pool of all open-ended problem-solving questions with the pool weighted the same as the multiple choice—three algebra for every two number and operations problems. To construct each assessment (either multiple choice or open ended) for each grade, all possible problems were randomly selected within their represented quantities.
In addition to the assessments, each teacher in the study was interviewed. A semistructured interview protocol was used, which consisted of 7 questions with subparts, for a total of 15 questions. The questions focused on the curriculum materials teachers used, their perception of the effectiveness of their curricular materials for students with disabilities, their perspective of calculators, the type of students with disabilities they educated in inclusive classes, and the mathematical challenges they saw students with disabilities face in mathematics classes. Interviews averaged 20 min per teacher, and all were completed by the first author.
Fidelity of Implementation
Teacher interviews, observations of mathematics classes, and reviews of teaching practices were used to assess fidelity of implementation of the curriculum used by each teacher (i.e., standards based or traditional). All teachers were assessed to be moderate to high implementers of their respective curriculum. Implementation within a curriculum had substantially less variability than across curricular approaches (i.e., greater differences in teaching and learning mathematics across traditional and standards-based approaches than within).
Data Analysis
All three authors graded the assessments and entered data into SPSS databases. An answer key for each assessment was developed by the first author and checked by each of the other authors. Each used the answer key to evaluate the correctness or incorrectness of each answer. There was only one correct answer for each problem regardless of if it was multiple choice or open ended.
Data on student performance for each grade were separately analyzed using a linear mixed model. For both grades, the dependent measure was students’ scores on each assessment (i.e., eight multiple choice and eight open ended) standardized out of 10. For example, if the open-ended assessment had four answers, students’ raw number correct was multiplied by 2.5 (e.g., 2 correct would be 5 correct out of 10). Assessment responses for each question were marked as correct (1), incorrect (0), or did not respond (99) within a SPSS database. These were then summed for each assessment to get a raw number correct (i.e., score) for each assessment. This sum was then multiplied by a number to standardize it out of 10. Descriptive data on the number correct were determined for each grade across test time, exam type, curriculum type, and ability status.
The linear mixed model for each grade included fixed and random factors. The fixed factors included time of the assessment (e.g., first, second, third), exam type (multiple choice vs. open ended), ability status (students with and without disabilities), and curriculum (standards based vs. traditional). The full factorial for these four fixed factors was also included—the one 4-way interaction, four 3-way interactions, and six 2-way interactions. The random factors were id (representing individual student) and class (encompasses the dimensions of school and teacher). These factors were nested: Id was nested within class to reflect the variation among student within each class, class was nested within curriculum to represent the variation among classes, and exam by id (exam × id) was nested within class to provide for the variation of students between the two types of exams. Nesting was necessary as the assignment of curriculum was done at the class level but analysis was conducted at the student level.
Results
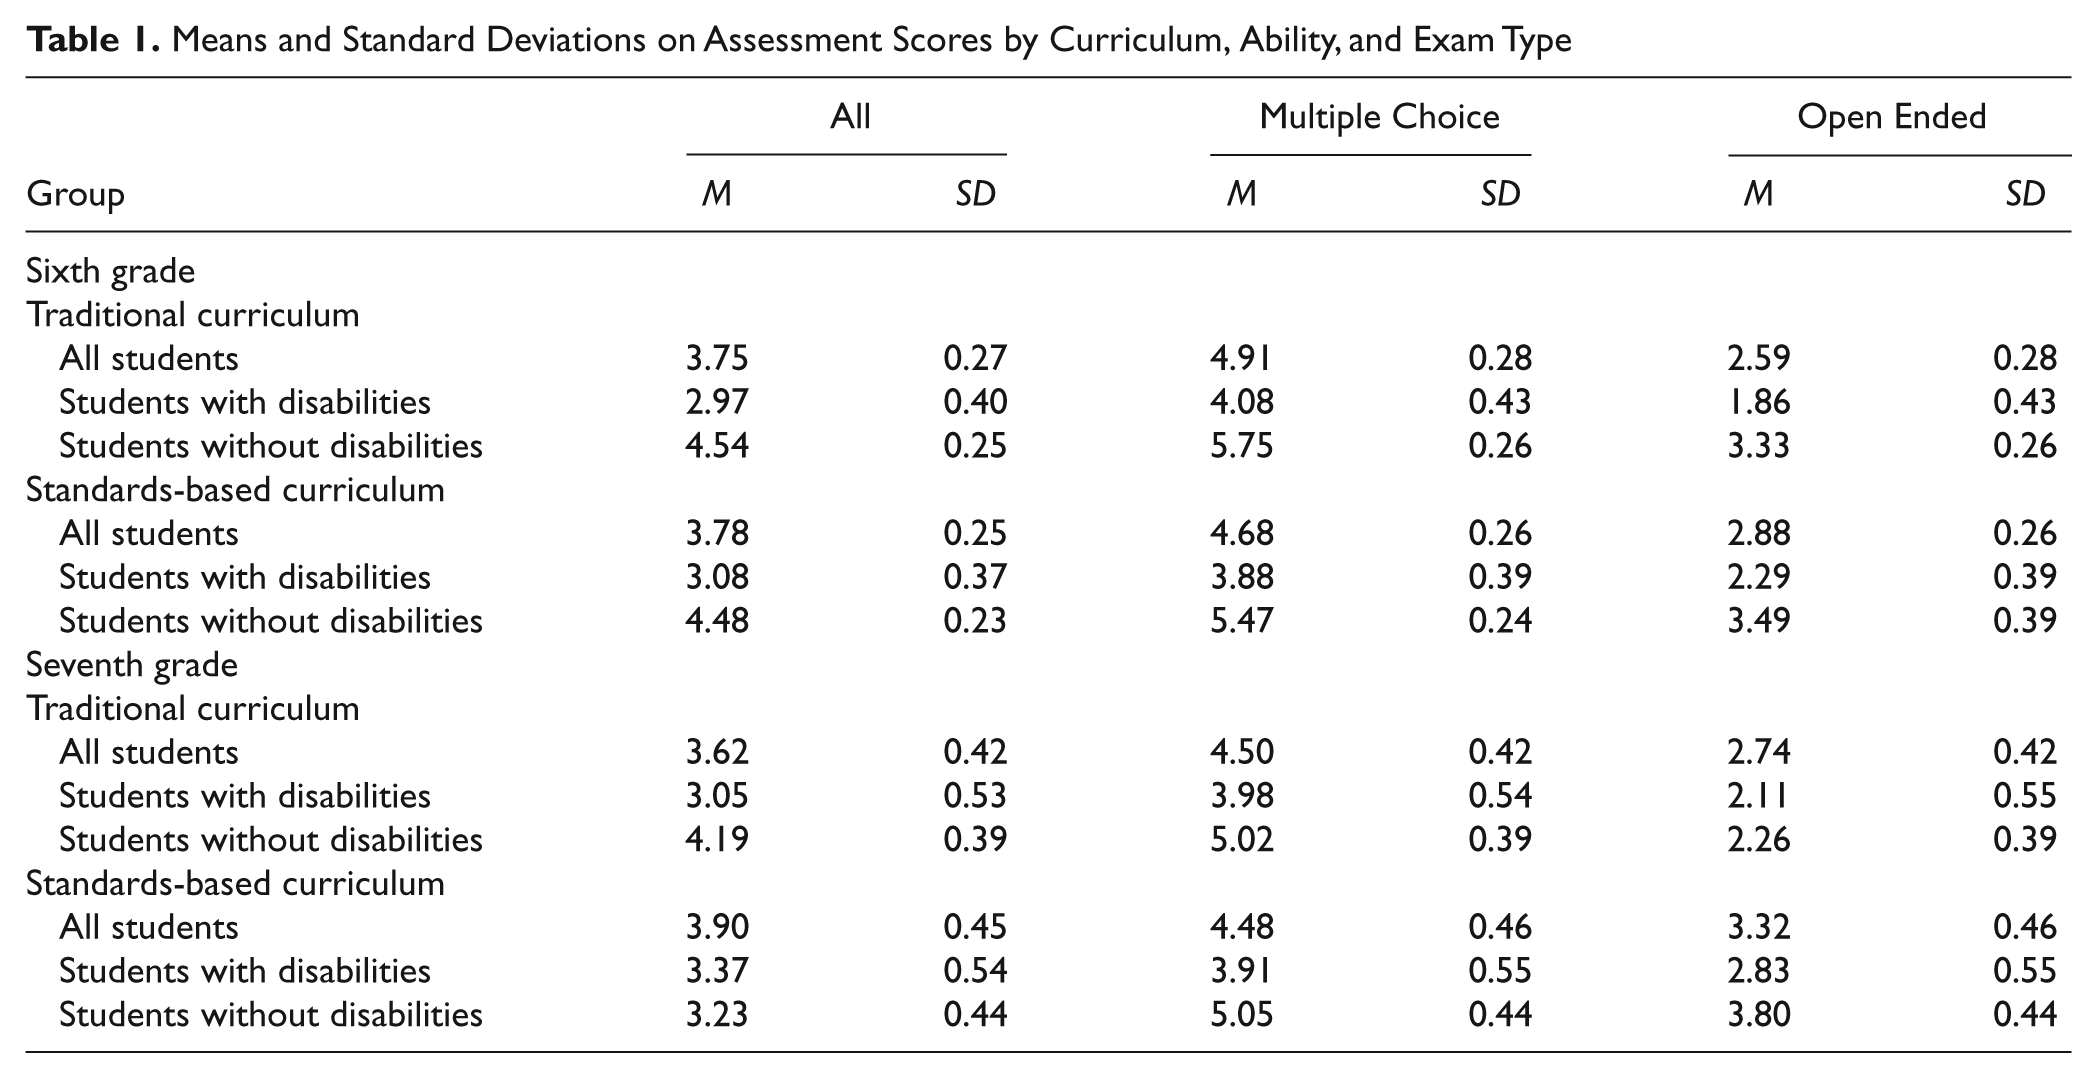
The descriptive statistics indicate sixth and seventh grade students without disabilities answered more problems correctly than students with disabilities and did so regardless of curriculum or exam type (4.51 vs. 3.02, p < .000; 4.31 vs. 3.21, p < .000; respectively). The descriptive statistics also illustrate that students, regardless of curriculum or ability, on average, answered more questions correctly on the multiple-choice than on the open-ended assessments (4.79 vs. 2.74, p < .000 for sixth grade; 4.49 vs. 3.03, p < .000 for seventh grade). Table 1 shows the means and standard deviations for the standardized number correct for each grade across ability, curriculum, and exam type (see Table 1). Table 2 provides the means and standard deviations for the standardized number correct for each grade across ability status, curriculum, exam type, and time (see Table 2).
Means and Standard Deviations on Assessment Scores by Curriculum, Ability, and Exam Type
Means and Standard Deviations for Scores Across Grade, Curriculum, Ability, Exam Type, and Time
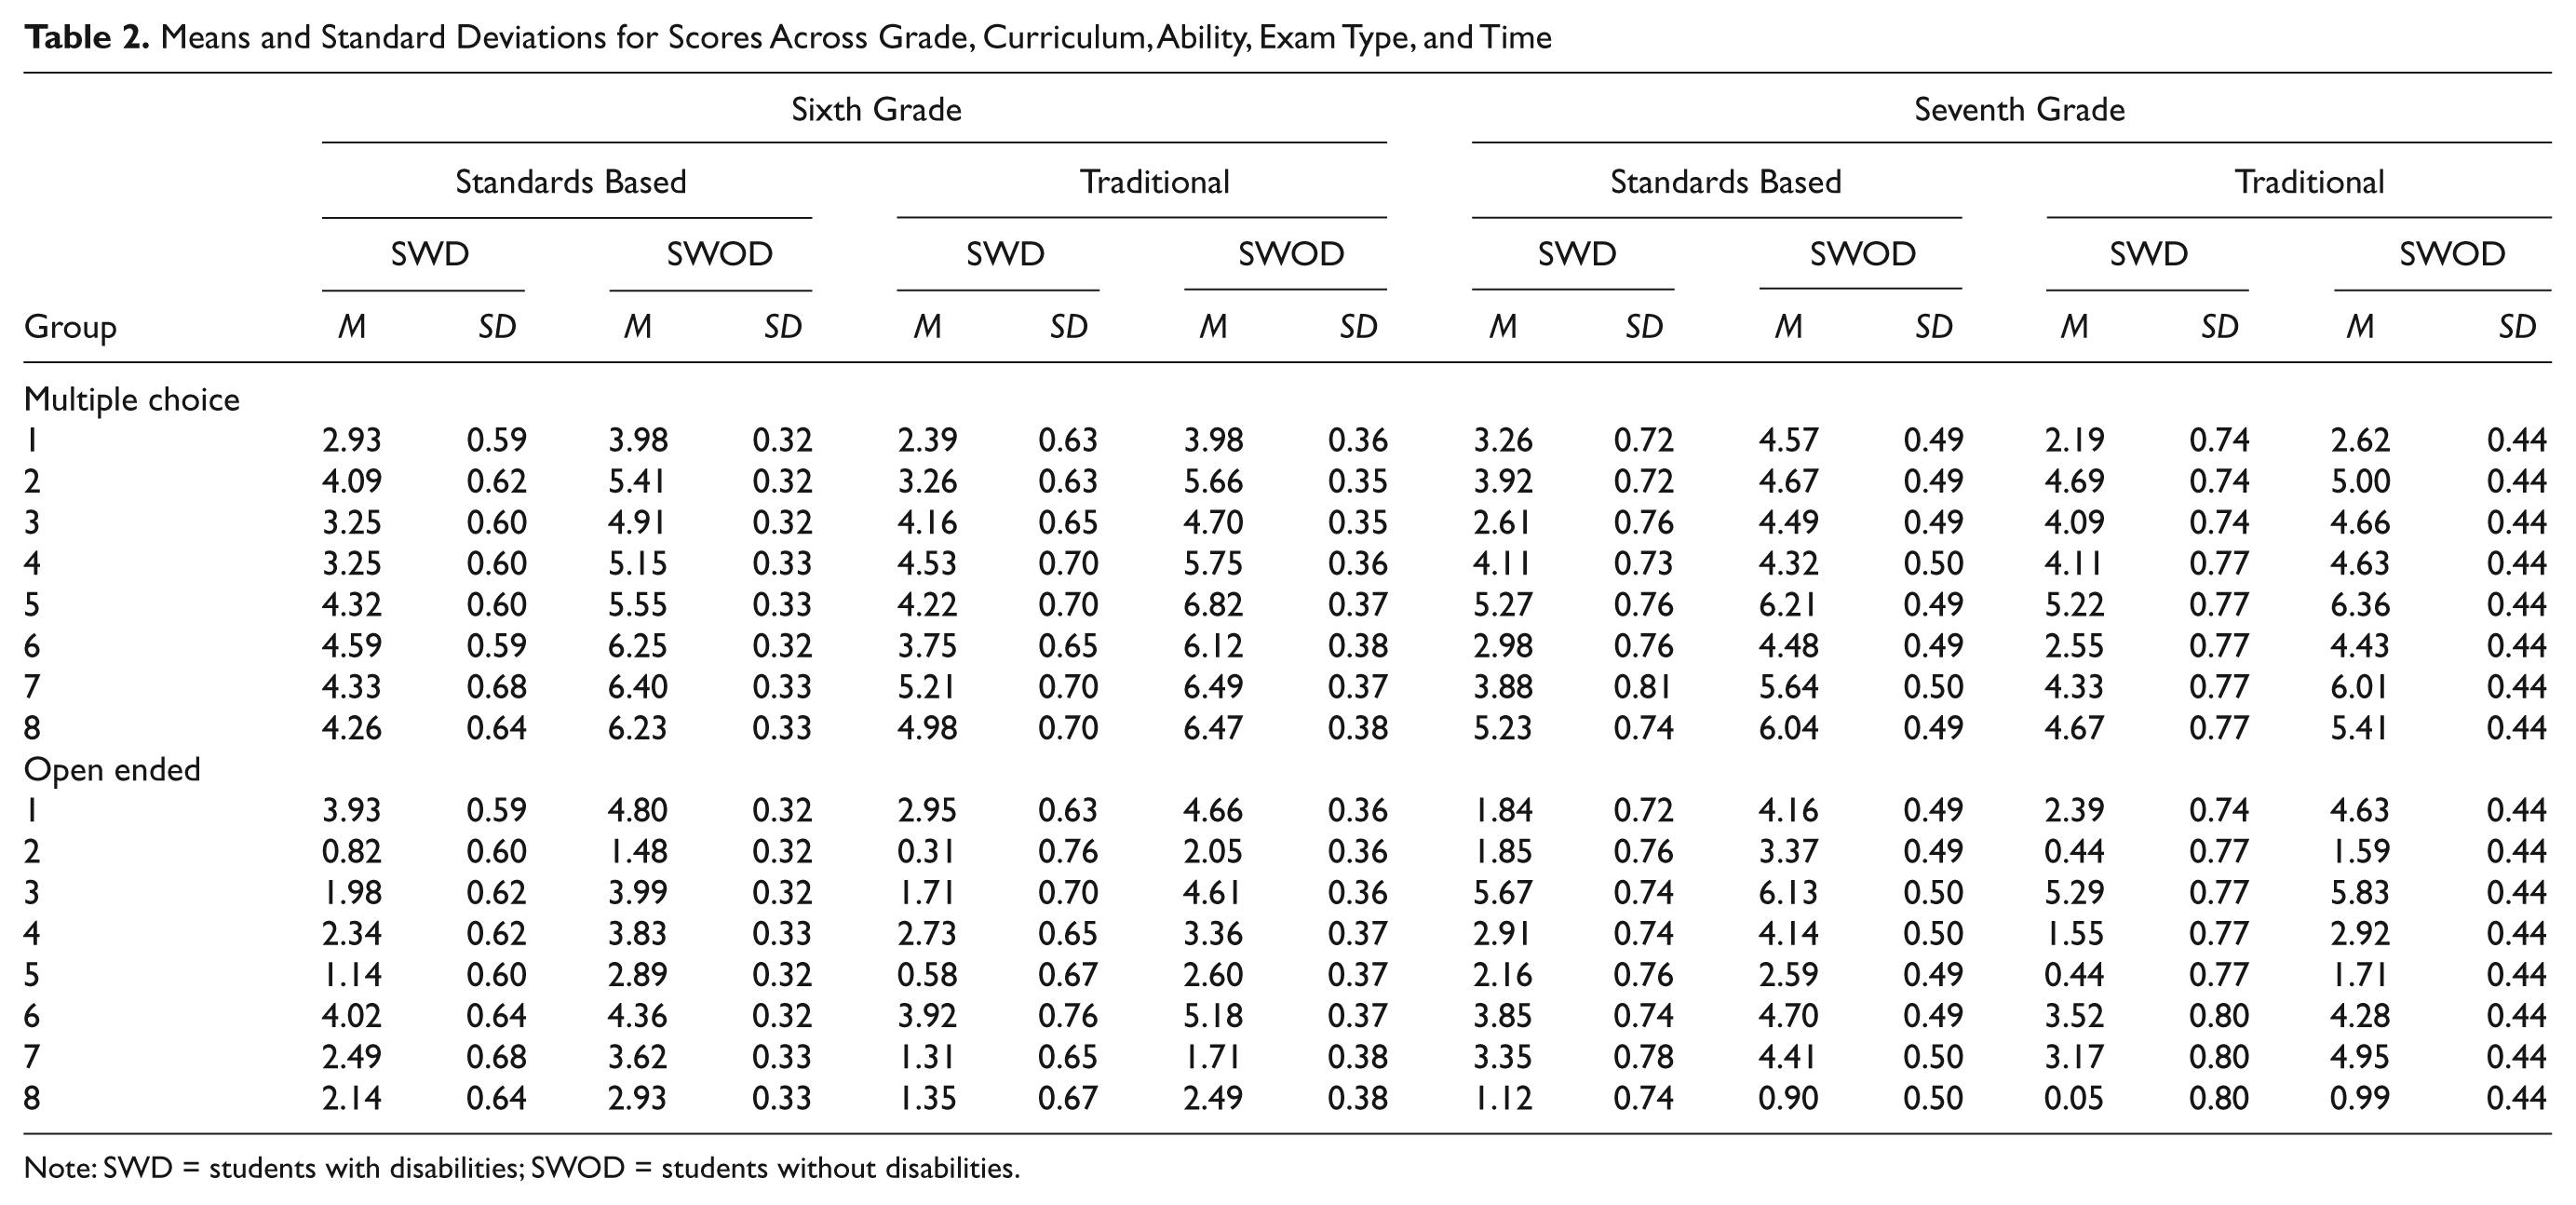
Note: SWD = students with disabilities; SWOD = students without disabilities.
The results of the linear mixed model across both sixth and seventh grade data were consistent in terms of statistically significant factors. For both grades, time of assessment, exam type, and ability status were statistically significant; curriculum was not (see Tables 3 and 4). The lack of statistical significance for curriculum indicates the type of curriculum students received had no impact on their performance on the assessments. The statistical significance of ability in both grades and the descriptive statistics suggest students without disabilities performed better on assessments than students with disabilities. For the statistically significant variable of exam type, sixth and seventh grade students answered more questions correctly on the multiple-choice assessments than the open-ended problem-solving ones. Although time of the assessment was statistically significant, frequency data and graphs illustrate that it was not as linear of a relationship as hypothesized (see Table 2). Researchers hypothesized that time would be a statistically significant factor, with student scores increasing in a linear fashion from Time 1 to Time 8. Results indicate that the impact of time of assessment was a bit more sporadic; it approximated a linear relationship for the multiple-choice assessments more so than the open-ended assessments. This relationship was more evident in sixth grade than seventh grade.
Linear Mixed Model for the Standardized Number Correct on Assessments for Sixth Graders
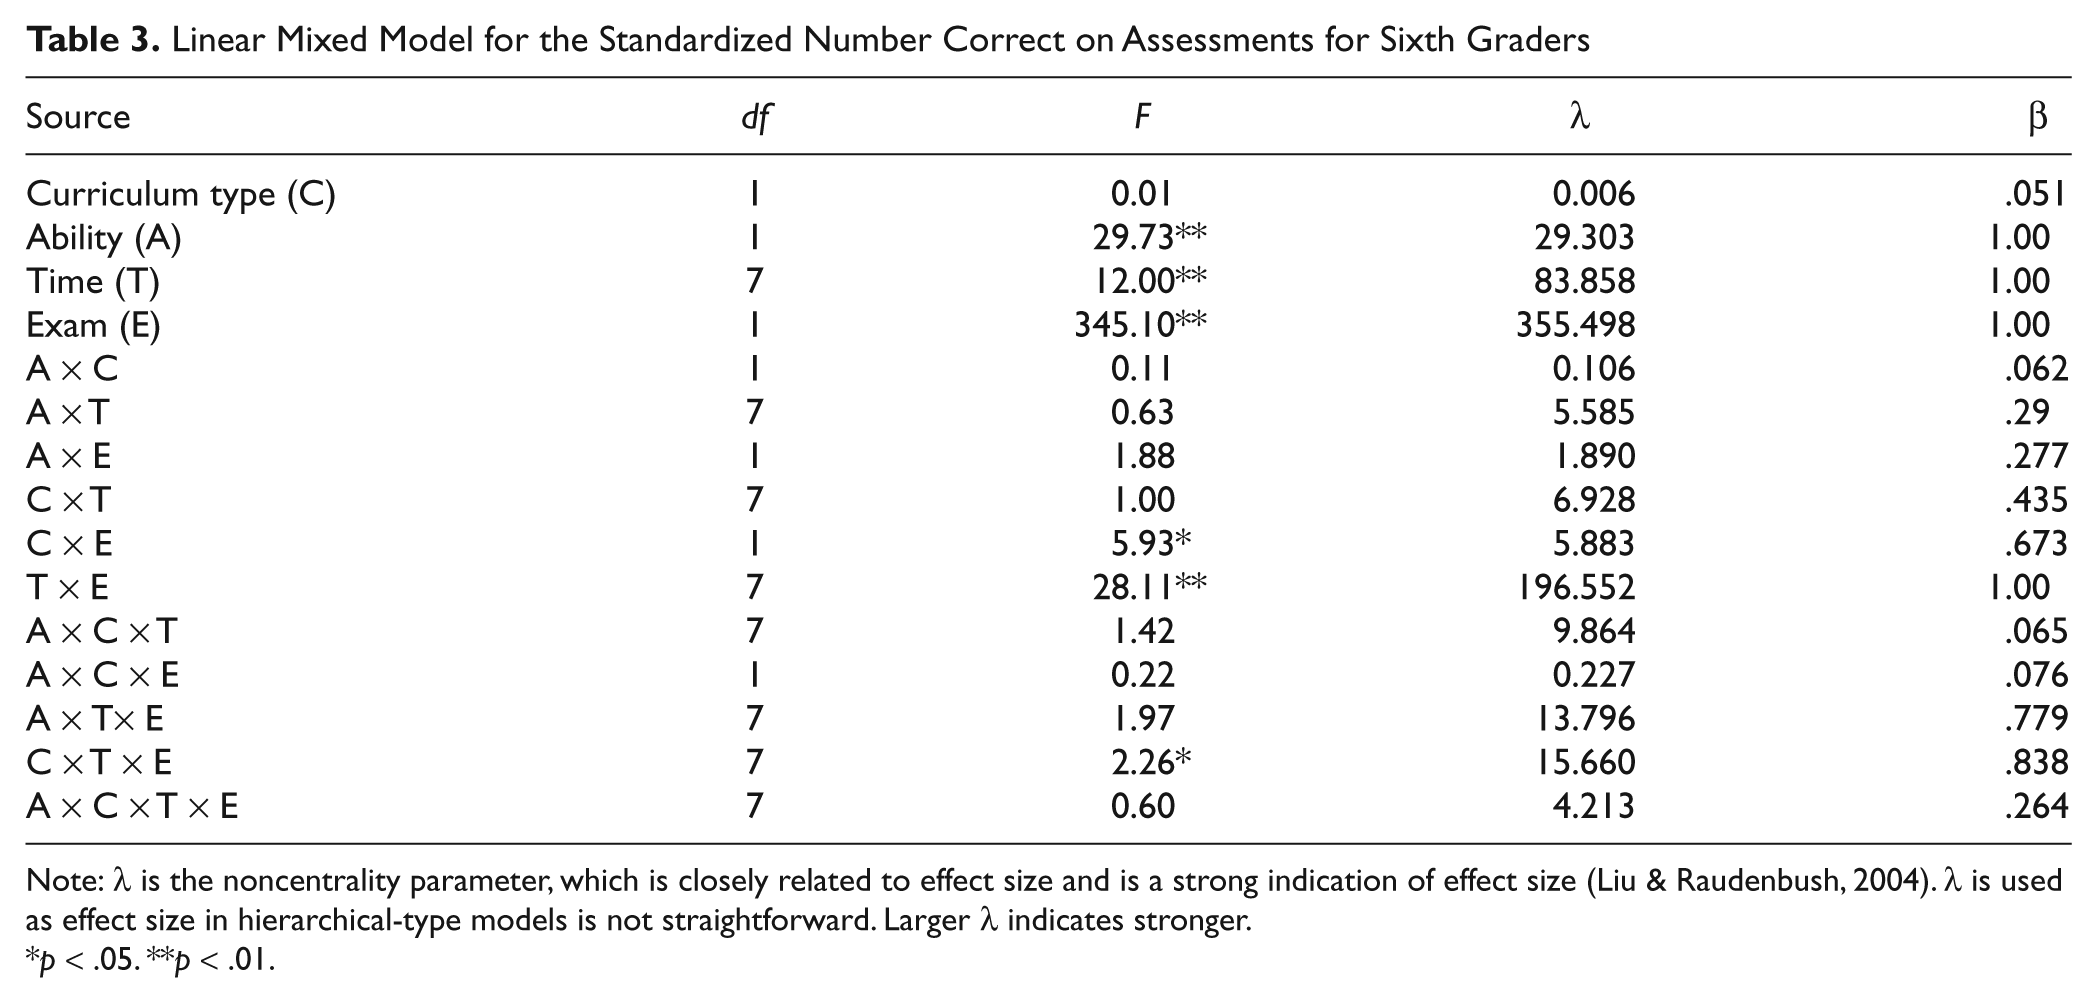
Note: λ is the noncentrality parameter, which is closely related to effect size and is a strong indication of effect size (Liu & Raudenbush, 2004). λ is used as effect size in hierarchical-type models is not straightforward. Larger λ indicates stronger.
p < .05. **p < .01.
Linear Mixed Model for the Standardized Number Correct on Assessments for Seventh Graders
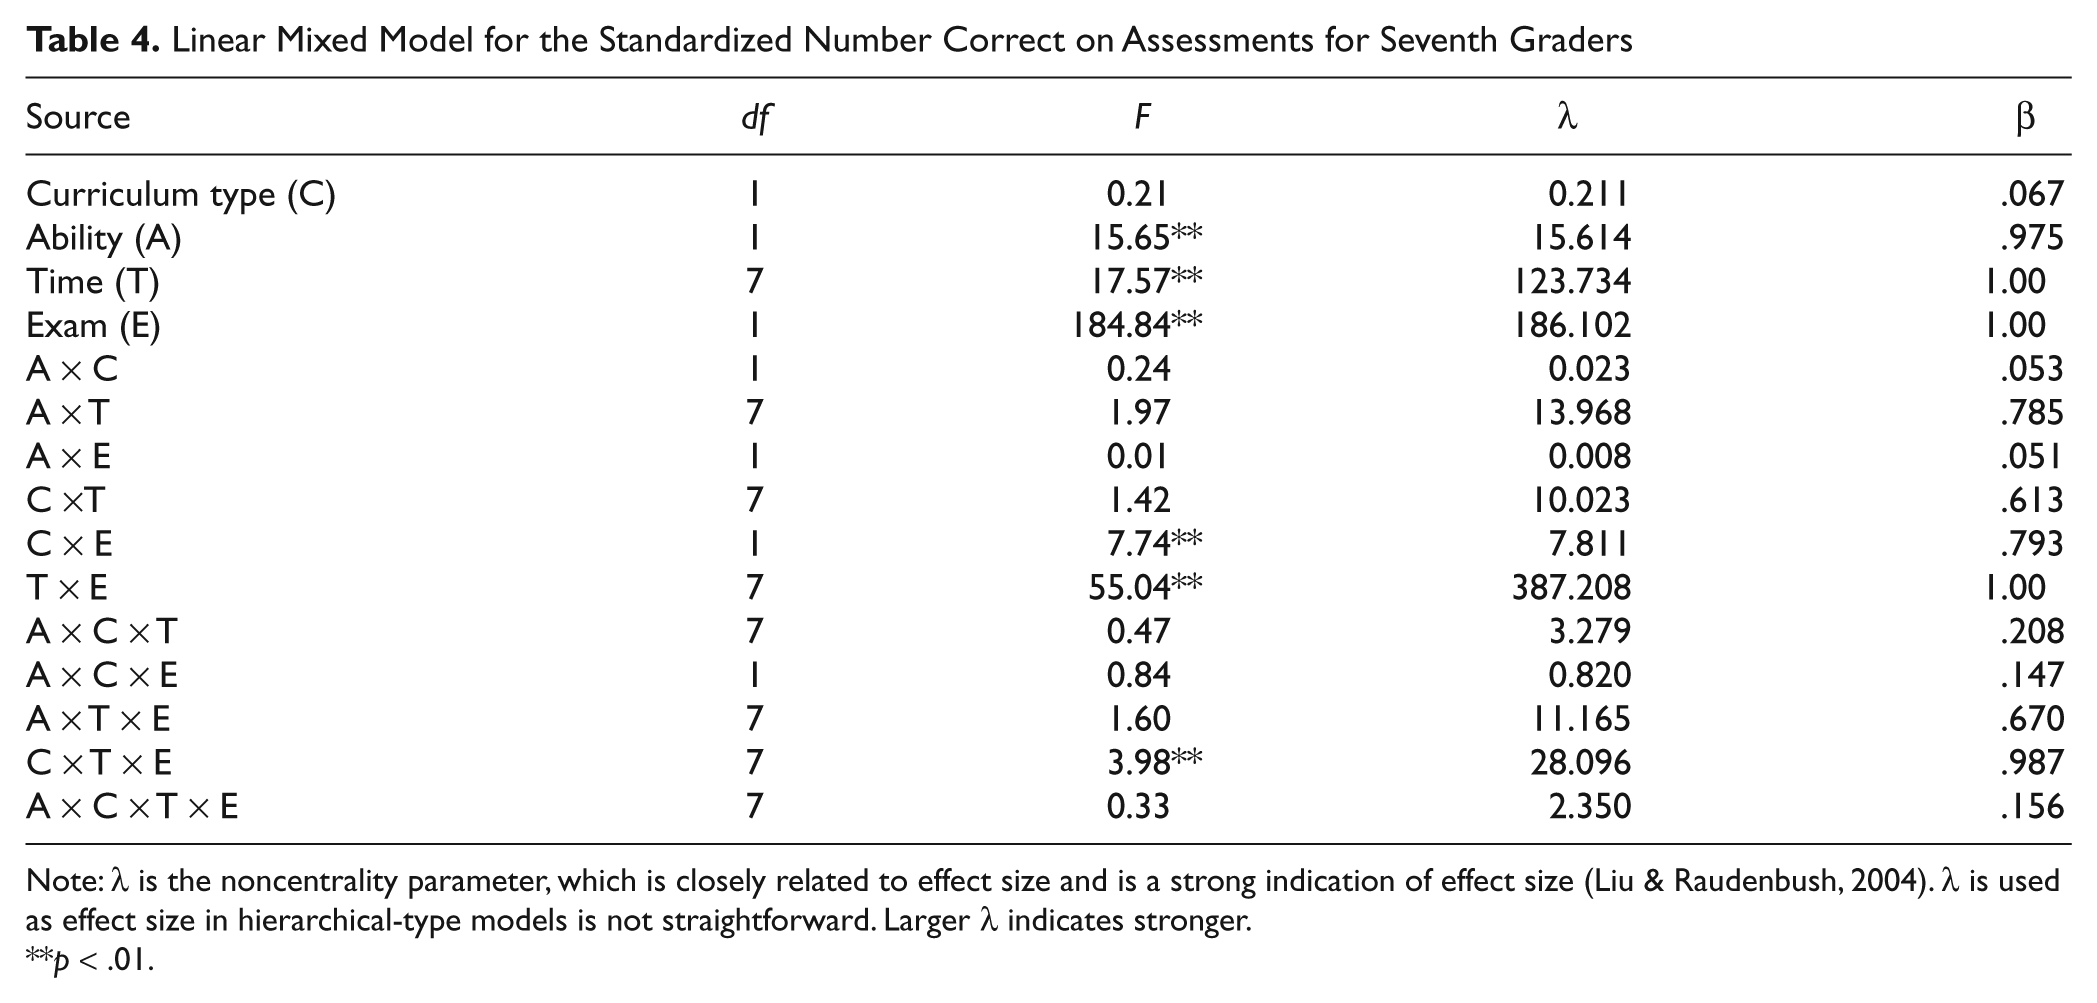
Note: λ is the noncentrality parameter, which is closely related to effect size and is a strong indication of effect size (Liu & Raudenbush, 2004). λ is used as effect size in hierarchical-type models is not straightforward. Larger λ indicates stronger.
p < .01.
The linear mixed model tables (refer to Tables 3 and 4) also reveal that certain interactions of factors were statistically significant: two 2-way and one 3-way. Specifically, Condition × Exam, Time × Exam, and Condition × Time × Exam were statistically significant for both sixth and seventh grades. The statistically significant interaction of Condition × Exam and descriptive statistics indicate students with and without disabilities in the standards-based curriculum condition answered, on average, more questions correctly on the open-ended assessments than students who received a traditional curriculum but vice versa for the multiple-choice assessments (refer to Table 1; see Figure 1). The statistically significant interaction of Time × Exam reinforces the more sporadic nature of students’ performance on assessments rather than the hypothesized linear approach for both exam types (see Figure 2).
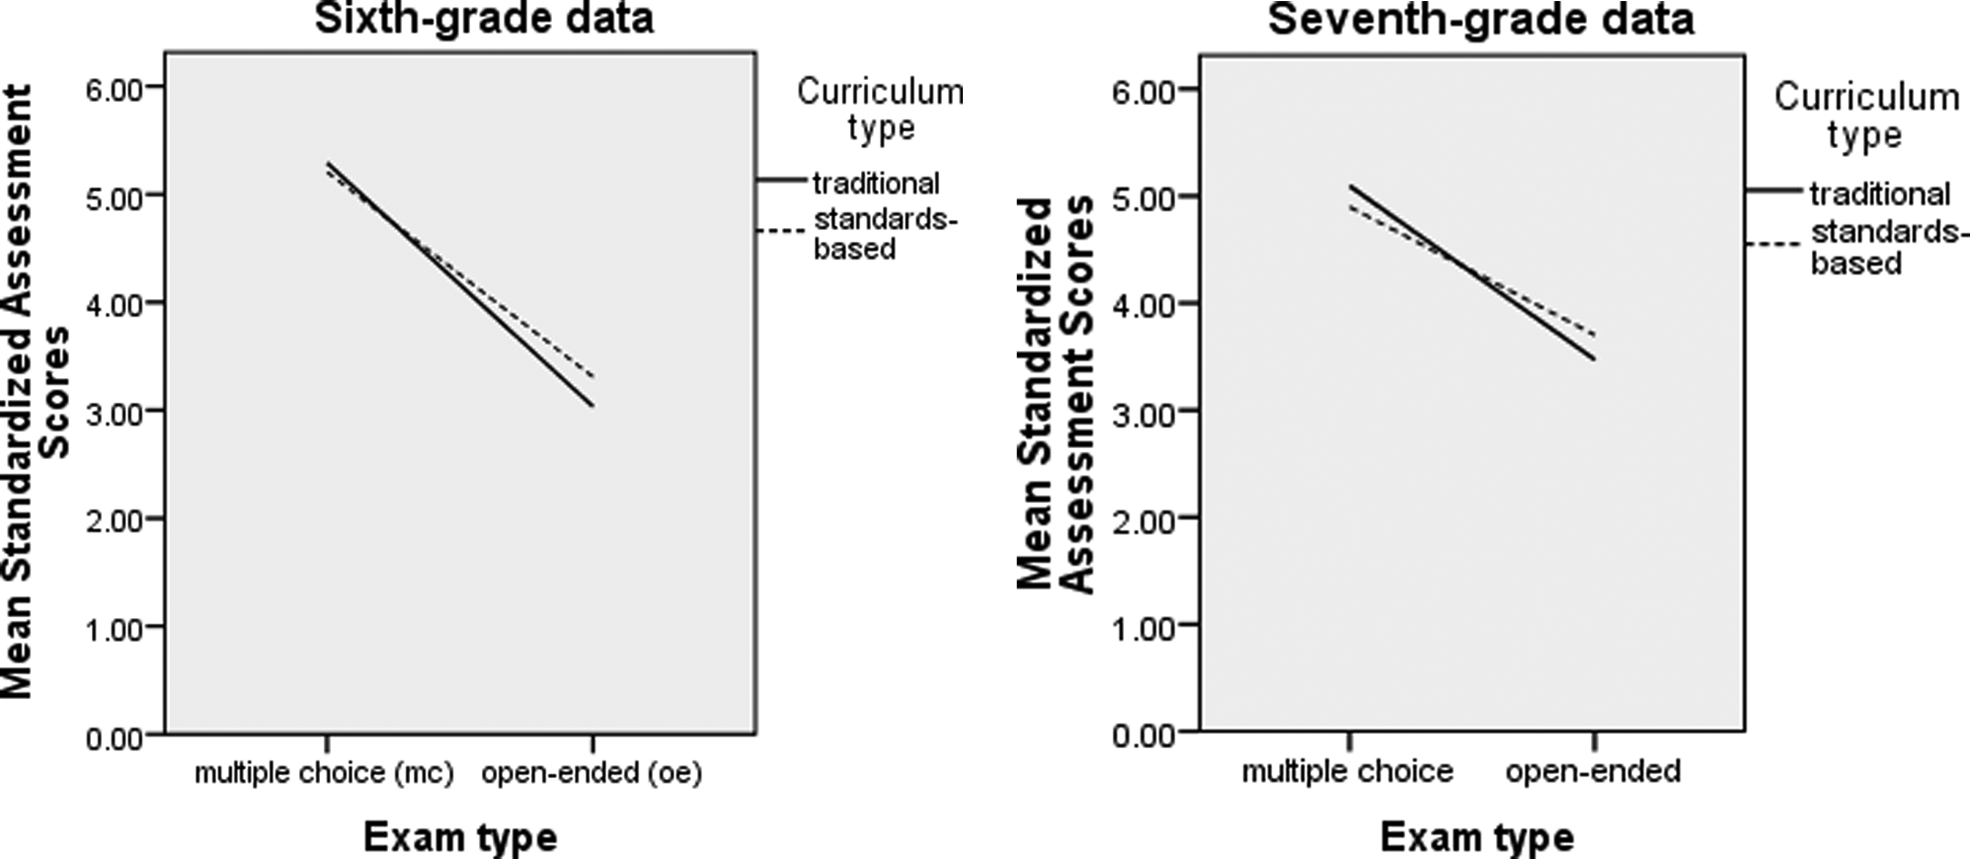
The interaction of curriculum × exam for sixth and seventh grade
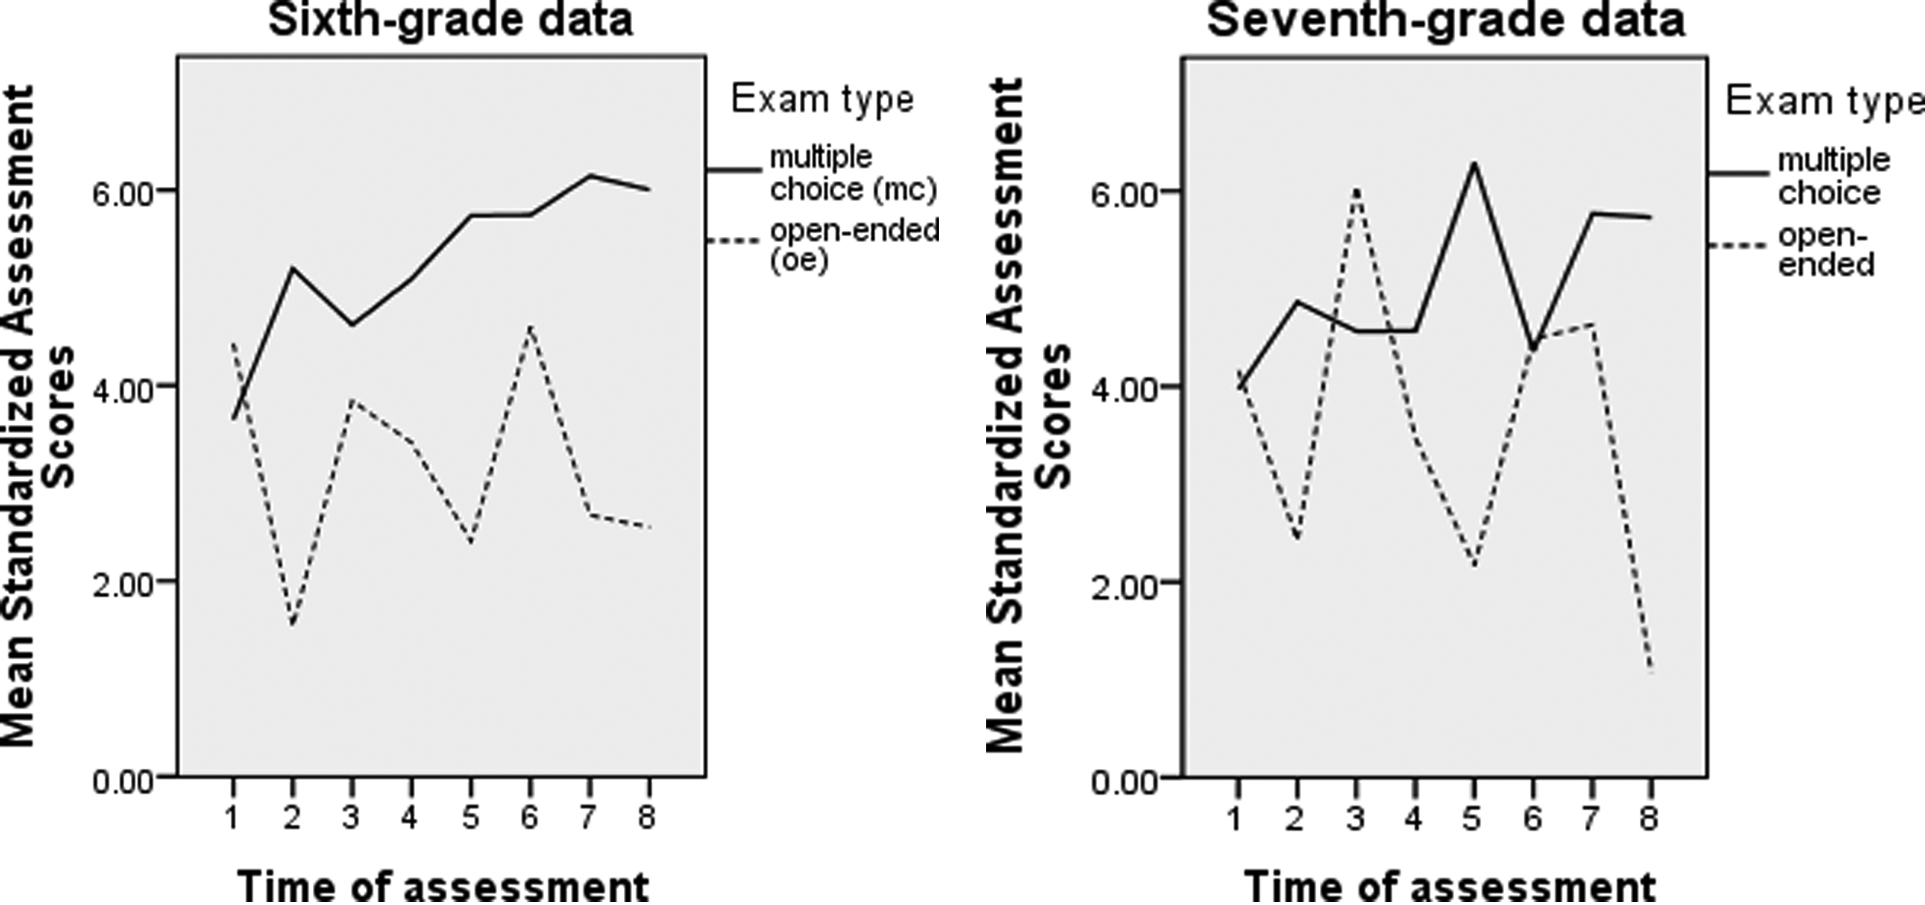
The interaction of time × exam for sixth and seventh grade
In terms of the model for sixth grade, 68.3% of the variance in the model was accounted for by student performance over time (i.e., the residuals), 63.9% of the variance in the seventh grade model. Student-to-student differences (id nested within class) accounted for the next largest percentage of variance within both the sixth and seventh grade models (28.8% and 24.9%, respectively). This was followed by the class differences (class nested within condition; 2.3% and 11.0%, respectively) and student performance between exam type (exam by id nested within class; 0.7% and 0.3%, respectively). Overall, both models are similar to each other, which is an indication of high reliability (refer to Tables 3 and 4).
Discussion
This study investigated the impact of mathematics curriculum (standards based vs. traditional) on the performance of sixth and seventh grade students with disabilities on multiple-choice and open-ended assessments aligned to state number and operations and algebra standards. It also sought to understand factors affecting student performance on assessments: ability status (students with and without disabilities), curriculum (traditional vs. standards based), assessment type (multiple choice vs. open ended), and time of assessment (e.g., first, second, third). Overall, the results indicated middle school mathematics curricula (standards based vs. traditional) did not affect students with disabilities; students with disabilities did not perform better on assessments in one curriculum versus the other. The lack of the statistically significant interaction of ability and curriculum indicates neither curriculum was more beneficial to students with disabilities. Descriptive statistics suggest the students performed poorly in both. The lack of curricular difference for students with disabilities downplays an often suggested reason why students with disabilities would do worse in standards-based curriculum and should be educated in a more traditional manner—the reading requirements of standards-based curricula. Because standards-based curricula are more problem centered and often require more reading, teachers in the interviews indicated students with disabilities are taxed to a greater extent. However, statistically speaking, students with disabilities performed in an equivalent manner in both curricula; thus, the argument that the heavy reading in standards-based curriculum “hurts” students with disabilities does not hold. Yet support was also not found for using a standards-based curriculum for educating students with disabilities.
The results also revealed ability status, assessment type, and time were statistically significant factors affecting student performance on assessments. To begin with, students without disabilities outperformed students with disabilities on both types of assessments regardless of curricula. Although this was not surprising, it should be noted that the students with disabilities were not students identified with a mathematics disability. The majority of students with disabilities in these inclusive classes were diagnosed with a literacy-based learning disability (primarily reading). Teachers indicated students with a mathematics disability were taught in pull-out classes because they would not be successful in general education mathematics classes. Hence, in theory, the students with disabilities were those without recognized official mathematical challenges and yet still answered fewer assessment questions correctly as compared to students without disabilities.
A caveat is that although students with disabilities included in the study did not have mathematical disabilities, particularly those with learning disabilities (the largest disability represented), research exists suggesting students with reading disabilities have challenges in mathematics and struggle with some of the content (Geary, Hamson, & Hoard, 2000; Hanich, Jordan, Kaplan, & Dick, 2001; Jordan et al., 2002; Russell & Ginsburg, 1984). However, the research regarding the impact of reading disabilities on mathematics achievement is equivocal; research supports that students with reading disabilities struggle with specific mathematics content as well as shows that students with reading disabilities perform similarly to peers without any disabilities (Andersson, 2008; Jordan & Hanich, 2000).
Although the lower performance of students with disabilities as compared to students without disabilities is consistent with the literature, it raises issues (Cawley, Parmar, Foley, Salmon, & Roy, 2001; Miller & Hudson, 2007; Parmar, Cawley, & Miller, 1994; Woodward & Montague, 2002). Why do students with disabilities answer fewer mathematics questions correctly, and what can be done to bridge the gap between students with and without disabilities? As suggested by Baxter and colleagues (2001), it may be that students with disabilities are not getting enough support in their inclusive mathematics classes in either the standards-based curriculum or the traditional curriculum. The lack of difference between curricula for students with disabilities supports this hypothesis.
As stated earlier, assessment type was also a statistically significant factor affecting student performance. All students, regardless of ability or curriculum, answered more questions correctly on the multiple-choice assessments than on the open-ended assessments. This is not surprising as it has been found that students with and without disabilities struggle with word problems and problem solving (Algozzine, O’Shea, Crews, & Stoddard, 1987; Parmar, Cawley, & Frazita, 1996). However, students who received standard-based curriculum did answer more questions correctly on the open-ended problem-solving assessments than those receiving the traditional curriculum. Standards-based curricula tend to focus on problem solving and particularly real-world problem solving. Students would spend a greater portion of the mathematics learning to solve problems rather than doing pure computation, and thus it is not surprising students receiving this curriculum would do better on the open-ended assessment. Similarly, traditional curricula focus more on computational fluency and spend a greater portion of their time in mathematics classes solving problems akin to the ones of the multiple-choice assessments (Shenk & Thompson, 2003). However, it might be a bit concerning that students who received a traditional curriculum answered more questions correctly on the multiple-choice assessments, if only for the fact that the vast majority of high-stakes assessments given to students are of the multiple-choice nature (Woodward & Montague, 2002).
Finally, the factor of time was a statistically significant factor affecting student performance on assessments. However, the impact of time was not as hypothesized. Researchers hypothesized students would improve in performance on both types of assessments over time as they learned more mathematics during the school year that was aligned to state standards and hence reflected on the assessments (i.e., students would be progressing in learning state standards through instruction via their curriculum; Stecker, Fuchs, & Fuchs, 2005). In general this was not the case. Although the sixth grade data on the multiple-choice assessments approximated a linear relationship, the performance was more varied for seventh graders on both assessment types and sixth grade on the open-ended assessments.
Similar to the lack of influence of curricula for students with disabilities, curricular approach—traditional (i.e., teacher directed, focus on computational fluency and rules and procedures) versus standards based (i.e., student centered, student-constructed understanding of mathematical concepts)—was not a factor in students’ overall performance on the assessments. The lack of statistical significance for curriculum type is contrary to previous research (Carroll, 1998; Cobb et al., 1991; Fuson et al., 2000; Reys et al., 2003; Riordan & Noyce, 2001; Wood & Sellers, 1997; Woodward & Baxter, 1997). One reason for the lack of statistical significance for curriculum as a factor on the overall assessments might be a lack of real difference between the implementation of the two curricula—standards-based curriculum and traditional. The researchers downplay this hypothesis as the nested factor of class within curriculum accounted for a small percentage of the variance of the model in sixth grade (2.3%) and seventh grade (11.0%). Furthermore, all three schools in the study using the standards-based curriculum had been using it for several years, and in fact two of the schools were involved in piloting the curriculum during its development. Also worth noting, teacher interviews suggested differences in philosophies toward various aspects of teaching and learning across the two curricula. For example, teachers of the standards-based curriculum reflected more positive attitudes toward calculator use, in alignment with the calculator stance presented in their materials and the NCTM (2000) standards, than those who taught the traditional curriculum, who were more negative toward their students using calculators.
Another reason for not finding any statistical significance between student achievement and the two types of curricula might be a lack of sensitivity of the assessments. The assessments attempted to address the different orientations of the two curricula by utilizing multiple-choice and open-ended questions, as the open-ended questions are more aligned with the standards-based curriculum philosophy and problem type presented in the materials. And with all questions taken directly from released items of the state’s general large-scale assessment—the test students are expected to take annually—the assessments were designed to measure what students were to be learning for that particular school year.
In conclusion, curricular approaches to educating students with disabilities in mathematics continue to be an area in need of more research. Mathematics education has been and continues to be a critical content area for students with disabilities, not only because of its place in current legislation (i.e., NCLB) but also because of the role it plays in student success in and after high school (National Research Council, 2001; Xin, Jitendra, & Deatline-Buchman, 2005). The performance of students with disabilities in different curricula needs to be better understood. This project began to explore students with disabilities educated in inclusive classes by considering the mathematics curriculum students receive—standards based versus traditional. Although it sheds some light, more research is needed.
Limitations
This study has some design and analysis limitations. One limitation of this research involved the participants—both the participation rates for all students and then the small number of students with disabilities. However, the small number of students with disabilities is a result of the focus of the research—inclusive mathematics classes. Also note that a power analysis was not done in advance to determine appropriate sample size. Furthermore, classes were taken on consensus rather than on random assignment, and the condition was at the level of the class and the analysis at the level of student. Although nesting was included in the model and analysis to account for this, the lack of random assignment at the level of student is still a limitation. A limitation also existed with regard to the researcher-created assessments, although they were taken from released items from the state’s general large-scale assessment. A final limitation involves the situation in which one class had to be excluded. This occurred because the teacher in that class gave the wrong assessment, resulting in the entire class of data for that assessment missing, and hence the researcher opted to exclude the class from all analyses.
Future Directions
Future research should continue to examine the issue of standards-based versus traditional curricula for students with disabilities. The performance of students with disabilities in both types of curricula needs to be better understood. Additional research should connect curricula to performance in high-stakes testing, such as states’ general large-scale assessments. And the research should take a longitudinal approach to understand the long-term impact of curricula on student performance and outcomes, looking at success in high school mathematics courses, high school graduation, and entry to college. This would involve studying students using the same type of curriculum, standards based or traditional, for multiple years.
Implications for Practice
Although additional research is needed, the results of this study suggest students with disabilities do not perform differently in a standards-based versus traditional curriculum. Thus, for these students, a standard-based curriculum did not improve their mathematical performance, but neither were they advantaged by receiving a more traditional approach. However, there was an interaction between curriculum and exam type, suggesting students who received a traditional curriculum performed better on multiple-choice assessments, which are more aligned with the assessment type of general large-scale state assessments. Yet the standards-based curriculum resulted in better performance on problem-solving questions (i.e., open ended). The results of this study make it difficult to advocate for either approach for students with disabilities but do suggest that the performance of students with disabilities in general needs to be improved. The need to improve the performance of students with disabilities is especially true in the area of problem solving. Regardless of curriculum, students with disabilities need additional instruction on solving open-ended word problems.
Footnotes
Appendix A
Appendix B
The authors declared no potential conflicts of interests with respect to the authorship and/or publication of this article.
The authors disclosed receipt of the following financial support for the research and/or authorship of this article: This research in this article was supported by a grant to the first author from the Spencer Foundation.