






Abstract
School districts offer specialized programming for secondary students who experience high rates of course failure or low credit accumulation. While these alternative programs are meant to increase student success, little research evaluates outcomes for students attending them. In this study, we used propensity score matching (PSM) to investigate the effectiveness of secondary alternative schools on four student outcomes: school attendance, credits earned, number of office referrals, and number of suspensions. Findings from Poisson regression analyses indicate that attending an academic remediation–focused alternative school is associated with significantly lower attendance but also with earning significantly more credits than enrollment in a traditional school. In addition, enrollment in an alternative school is associated with significantly less office referrals and suspensions than enrollment in a traditional school. Implications for policy, practice, and further research are discussed.
Since the 1960s, local education agencies (LEAs) have fashioned alternative schools—and specialized programs within schools—to address the unique needs of students who are flagged as being at risk of school failure (Lehr, Tan, & Ysseldyke, 2009). Although the charter school movement and advances in distance learning have broadened the array of educational options available to students nationwide over the last decade, Raywid’s (1994) conceptualization of three broad types of alternative schools still has applicability today. Those categories of alternative schools include (a) schools that offer innovative educational approaches and are often accessible only through an application process, (b) schools with a behavior or disciplinary focus designed for students who exhibit social or behavioral needs, and (c) schools designed to provide academic support to students who experience credit deficiencies or are otherwise struggling to stay on track for high school completion. The latter, which we refer to as “academic remediation–focused” (AR) alternative schools, are the focus of this study. These alternative schools provide specially designed programs for academic remediation and credit recovery as well as offer social and behavioral supports.
Educating students in a specialized setting away from their same-age peers is accompanied by a responsibility to ensure that the students who receive their instruction in those settings are not being systematically subjected to lower quality experiences that exacerbate, rather than remedy, educational opportunity and achievement gaps. When an LEA either allows or mandates that a designated subset of the school population be educated separately, it is incumbent on the LEA to insure that placement in that alternative, segregated setting does indeed result in the desired positive outcomes for the affected students. This responsibility is heightened when the designated subset of students is comprised disproportionately of students from historically marginalized groups (e.g., students of color and students who live in poverty), as is the case for alternative schools (Kleiner, Porch, & Farris, 2002). Indeed, federal education policy provides justification for contemplating alternatives to traditional schooling by demanding that attention be given to students who struggle. According to the No Child Left Behind Act (2002), each LEA should provide students who are at risk of school failure with effective programs; students so designated include students with disabilities, English language learners, students who identify as an ethnic minority, and students from low socioeconomic status households. However, a recent report summarizing data from the Office for Civil Rights (U.S. Department of Education, Office for Civil Rights, 2012) reminds us of the importance of ensuring that schools and programs created to serve students from these groups are not also inadvertently relegating students to inequitable, and ultimately substandard, school experiences.
Evidence of the impact of attending AR alternative schools on short- and long-term academic and behavioral outcomes for students is limited. Whereas the presumption is that AR alternative schools hasten students’ progress toward degree completion, few published studies document their effectiveness. Those that do provide a mixed, but generally positive, picture; for example, Franklin, Streeter, Kim, and Tripodi (2007) evaluated the effectiveness of a solution-focused, academic alternative school on students’ credit accrual, attendance, and graduation rates. The researchers used a quasi-experimental pretest–posttest comparison group design with a total of 85 students to show that students attending the academic alternative schools earned significantly more credits than their counterparts in the comparison group. On the other hand, the comparison group had significantly higher school attendance and graduation rates than those attending the alternative schools. In another study, Franco and Patel (2011) investigated the effectiveness of a pilot summer credit recovery program on students’ credit accruals. The participants were 23 high school freshmen who had been unsuccessful in at least one core content course. The researchers reported that after the pilot credit recovery program, 70% of the students earned sufficient credits to catch up with their chronological age peers; on the other hand, the program did not have an impact on the students’ overall GPAs. In yet another study, Kelly, Kim, and Franklin (2008) reported findings from a solution-focused brief therapy program in an urban alternative school setting. This school was designed to prevent high school dropout and help students designated as at-risk of school failure to finish high school with a diploma. Kelly et al. reported that students attending the alternative school earned more credits toward graduation and had higher graduation rates than their counterparts attending traditional schools. In another study, Dynarski and Wood (1997) examined the impact of three alternative high school recovery programs designed to provide additional chances for students to earn a high school diploma. The programs offered an intensive reading program that included small class sizes and a positive school climate. The researchers reported mixed results. They found that the program was successful in improving attendance, credits earned, and reading and math scores in one school. Moreover, after 4 years students were more likely to graduate from the alternative high school than the students who were not admitted to the school. However, the two other alternative schools were not successful in improving student attendance, credits earned, or graduation rates. The researchers reported that many students earned General Education Development (GED) certificates rather than regular high school diplomas across the three schools.
Whereas these studies provide some evidence of alternative program effectiveness, research at the national level has identified gaps in the availability of information on student outcomes in alternative schools as a concern. Specifically, Lehr et al.’s (2009) survey of state-level administrators revealed that state-level data on student outcomes in alternative schools is lacking, making it difficult to know if alternative programs are beneficial to the students who are educated in them. Similarly, Lange and Sletten (2002) found that rigorous evaluation research at the national level was relatively limited on the links between characteristics of alternative schools and academic outcomes of students at risk of school failure. Although LEA reliance on alternative schools continues to increase as traditional schools still struggle to meet the needs of all learners (Martin & Brand, 2006), outcome data providing evidence of the effectiveness of these schools is still relatively sparse.
Determining the effectiveness of alternative schools can be approached in a multitude of ways. Because the focus in this study is on the academic needs of secondary students who are educated outside of traditional schools in an effort to provide them with academic support, we focus on variables that reflect student engagement and the accumulation of credit. Because AR alternative schools have a focus on academic remediation, but also provide social and behavioral programming to support students’ eventual transition back to traditional schools (Raywid, 1994), we would expect to see benefits of these programs in both academic and behavioral domains.
Past researchers have used frequency and total number of office referrals to measure students’ attachment to school or their engagement in learning (e.g., Putnam, Luiselli, Handler, & Jefferson, 2003; Sugai, Sprague, Horner, & Walker, 2000). Frequency and total number of suspensions has similarly served as an indication of student investment in learning (e.g., Lassen, Steele, & Sailor, 2006; Luiselli, Putnam, Handler, & Feinberg, 2005). School attendance is another variable commonly used by researchers as an important and easily measured proximal outcome that is linked to the distal outcome of student academic achievement (e.g., Dugger & Dugger, 1998; Klem & Connell, 2004; Vandamme, Meskens, & Superby, 2007). Credit accrual is yet another variable that signifies a student’s performance relative to grade- and course-level standards, and serves as a measure of a student’s progress toward degree completion (e.g., Allensworth & Easton, 2005; Chaney, Burgdorf, & Atash, 1997). A combination of these measures allows for a more nuanced assessment of outcomes.
Being identified in high school as at risk of school failure is preceded, for many students, by a history of academic and behavioral difficulties. For example, previous research has shown that, from middle school forward, rates of suspension predict later suspensions (Hemphill, Toumbourou, Herrenkohl, McMorris, & Catalano, 2006). Moreover, students from low socioeconomic backgrounds and students with emotional and behavioral disability (EBD) are more likely to receive behavioral referrals in middle school (Skiba, Peterson, & Williams, 1997). Similarly, being African American and male is associated with disproportionate experience with office referrals, suspensions, and expulsions in middle school (Skiba, Michael, Nardo, & Peterson, 2002). Middle school academic achievement has also been identified as a predictor of high school outcomes. For example, Balfanz, Herzog, and Mac Iver (2007) found that middle school students who received failing grades in reading and math were less likely to graduate from high school and students with the lowest reading test scores in the fifth grade had significantly lower rates of reaching 12th grade on time. Based on these previous findings, we identified several middle school demographic, academic, and behavioral indicators that could potentially predict high school outcomes of interest in this study.
To determine if AR alternative schools are meeting the goal of increasing students’ abilities to experience academic success, it is useful to compare outcomes for students served in AR alternative schools with those of students with similar trajectories and experiences who continue to be served in traditional school settings. Therefore, the purpose of the current study was to examine outcomes for students who are educated in AR alternative schools compared with a matched sample of peers who remained in traditional secondary schools to provide evidence of the effectiveness of these alternative schools. This research extends the literature by comparing student outcomes in AR alternative schools with a matched sample of students in traditional schools who share characteristics that are associated with risk of school failure, rather than simply comparing student outcomes in alternative schools with students in traditional schools more generically.
This study addresses the following overarching research question: Do students who attend AR alternative secondary schools experience improved school outcomes—both academic and behavioral—compared with students with similar trajectories who remain in traditional schools? Student outcomes examined include (a) days in attendance, (b) credits earned in one semester, (c) number of office referrals, and (d) number of suspensions.
Method
We conducted this quasi-experimental design study to investigate the impact of enrollment in AR alternative schools on identified behavioral and academic student outcomes compared with enrollment in traditional secondary schools. In some situations, making a causal inference from observational data may be misleading due to potential estimate bias in the comparison of two groups. Rosenbaum and Rubin (1983) introduced the propensity score matching (PSM) technique to make an unbiased estimate of difference on outcomes. Use of PSM helps to balance two unequal groups based on identified covariates so that comparisons may be made between treatment and control groups (Rosenbaum & Rubin, 1983). Therefore, we used PSM to match students from different educational settings and to allow for unbiased estimates of differences in student outcomes. In the subsequent sections, we describe detailed information on the sample, coding, and analysis procedures.
Participating District
We used longitudinal data from one urban school district in the Midwestern United States for this study. The participating school district serves approximately 70,000 students in Grades Kindergarten through 12 each year in approximately 200 schools. According to publicly reported high school completion data, the regular diploma graduation rate for this district was approximately 65% in 2012 to 2013. In addition, scores on standardized tests of reading and math as of 2011 to 2012 were below average compared with districts of similar size in the same state. The participating district provided the researchers with de-identified data including student demographics, attendance, and standardized test scores, as well as data on suspensions, expulsions, and office referrals for all secondary students (i.e., those enrolled in any of Grades 9–12 as of October 1st, 2012).
Coding Procedure
Because we focused on a conceptualization of alternative schools that is generalizable across LEAs, and the participating district uses a distinct LEA-specific categorization system for their schools, members of the research team coded the schools independent from the LEA. For training purposes, the research team members initially coded a sample of 10 schools. All coders reached at least 90% agreement with the trainer (first author) on an item-by-item basis (i.e., responses to the four coding prompts), as well as on the determination of the overall school type for each school. Coders discussed any discrepancies as a team until 100% agreement was reached. Following the training, the two coders with the highest coding reliability rates coded all 53 secondary schools in the participating district.
Four coding options for school type were available: traditional, innovative alternative school, behavior-focused alternative school, and AR alternative school. Although all schools were coded, only those with codes of traditional and AR alternative schools were used for the current study. The research team coded schools based on information collected using a researcher-developed protocol. Questions included (a) Is the school identified as alternative, charter, intensive, transformative, or something other than High School? (in the publicly reported descriptions provided to the research team by the LEA); (b) Do the majority of students attend by choice or by referral/assignment?; (c) Does the school curriculum focus on a specific skill area (e.g., arts, technology) or does the school target a select student demographic other than students identified as “at risk”?; and (d) Is this school aimed at academic recovery or behavior modification? The resulting information was used to determine a final school type. Schools coded as traditional met the following criteria: They were not identified as anything other than a comprehensive, regular high school; they served a majority of students who attended by choice; they did not target any particular student demographic or specific skill area; and they were not aimed primarily at academic or behavioral remediation. To be coded as an AR alternative school, a school had to be identified by the district as a non-traditional setting to which students are either assigned or elect to attend to receive services that emphasize academic remediation and/or credit recovery as a primary aim.
Coders initially achieved 89% agreement. Coding disagreements were discussed and resolved so that 100% agreement was reached. However, for nine of the 53 secondary schools in the participating district, the information initially provided by the LEA for coding purposes was incomplete. To extract enough information about those nine schools to complete the four coding prompts, a member of the research team searched online for publicly available information. Individual school websites provided sufficient information for six of the nine protocols. Information for two of the three remaining schools was procured online via two separate sources: the district’s accountability website and a local newspaper database. Complete information for the final school in our sample could not be located through online search procedures; information necessary to code that final school was retrieved via a phone call to the participating district. After coding was completed, we shared the results with an administrator in the participating LEA who concurred with our coding.
In total, 9 out of 53 schools (17%) were coded as traditional high schools. The average enrollment in these traditional high schools was 942 students. An additional 14 schools (i.e., 26% of the 53 total schools) were coded as AR alternative schools. While the AR alternative schools, by definition, all offered services to meet the needs of secondary students considered to be at risk of school failure, variation across the schools were noted, with schools offering, for example, portfolio assessment; project-based learning; a combination of online and in-person courses; weekend, evening, and half day schedules; and mental health services. The average enrollment for the AR alternative schools was 59 students.
Only students who attended schools coded as traditional or AR alternative at the time of data collection were included in ensuing analyses for the current study. The remaining 30 schools were coded as either innovative or behavior-focused alternative schools and were not included in analyses for this study.
Selected Sample
The original sample included 21,162 secondary students, (i.e., students in Grades 9–12). To select a sample that contained all relevant longitudinal data, demographic data files were merged with student outcome data files, including attendance, assessment, and behavioral outcome data. This process reduced the sample to 12,893 students.
Analytical Sample
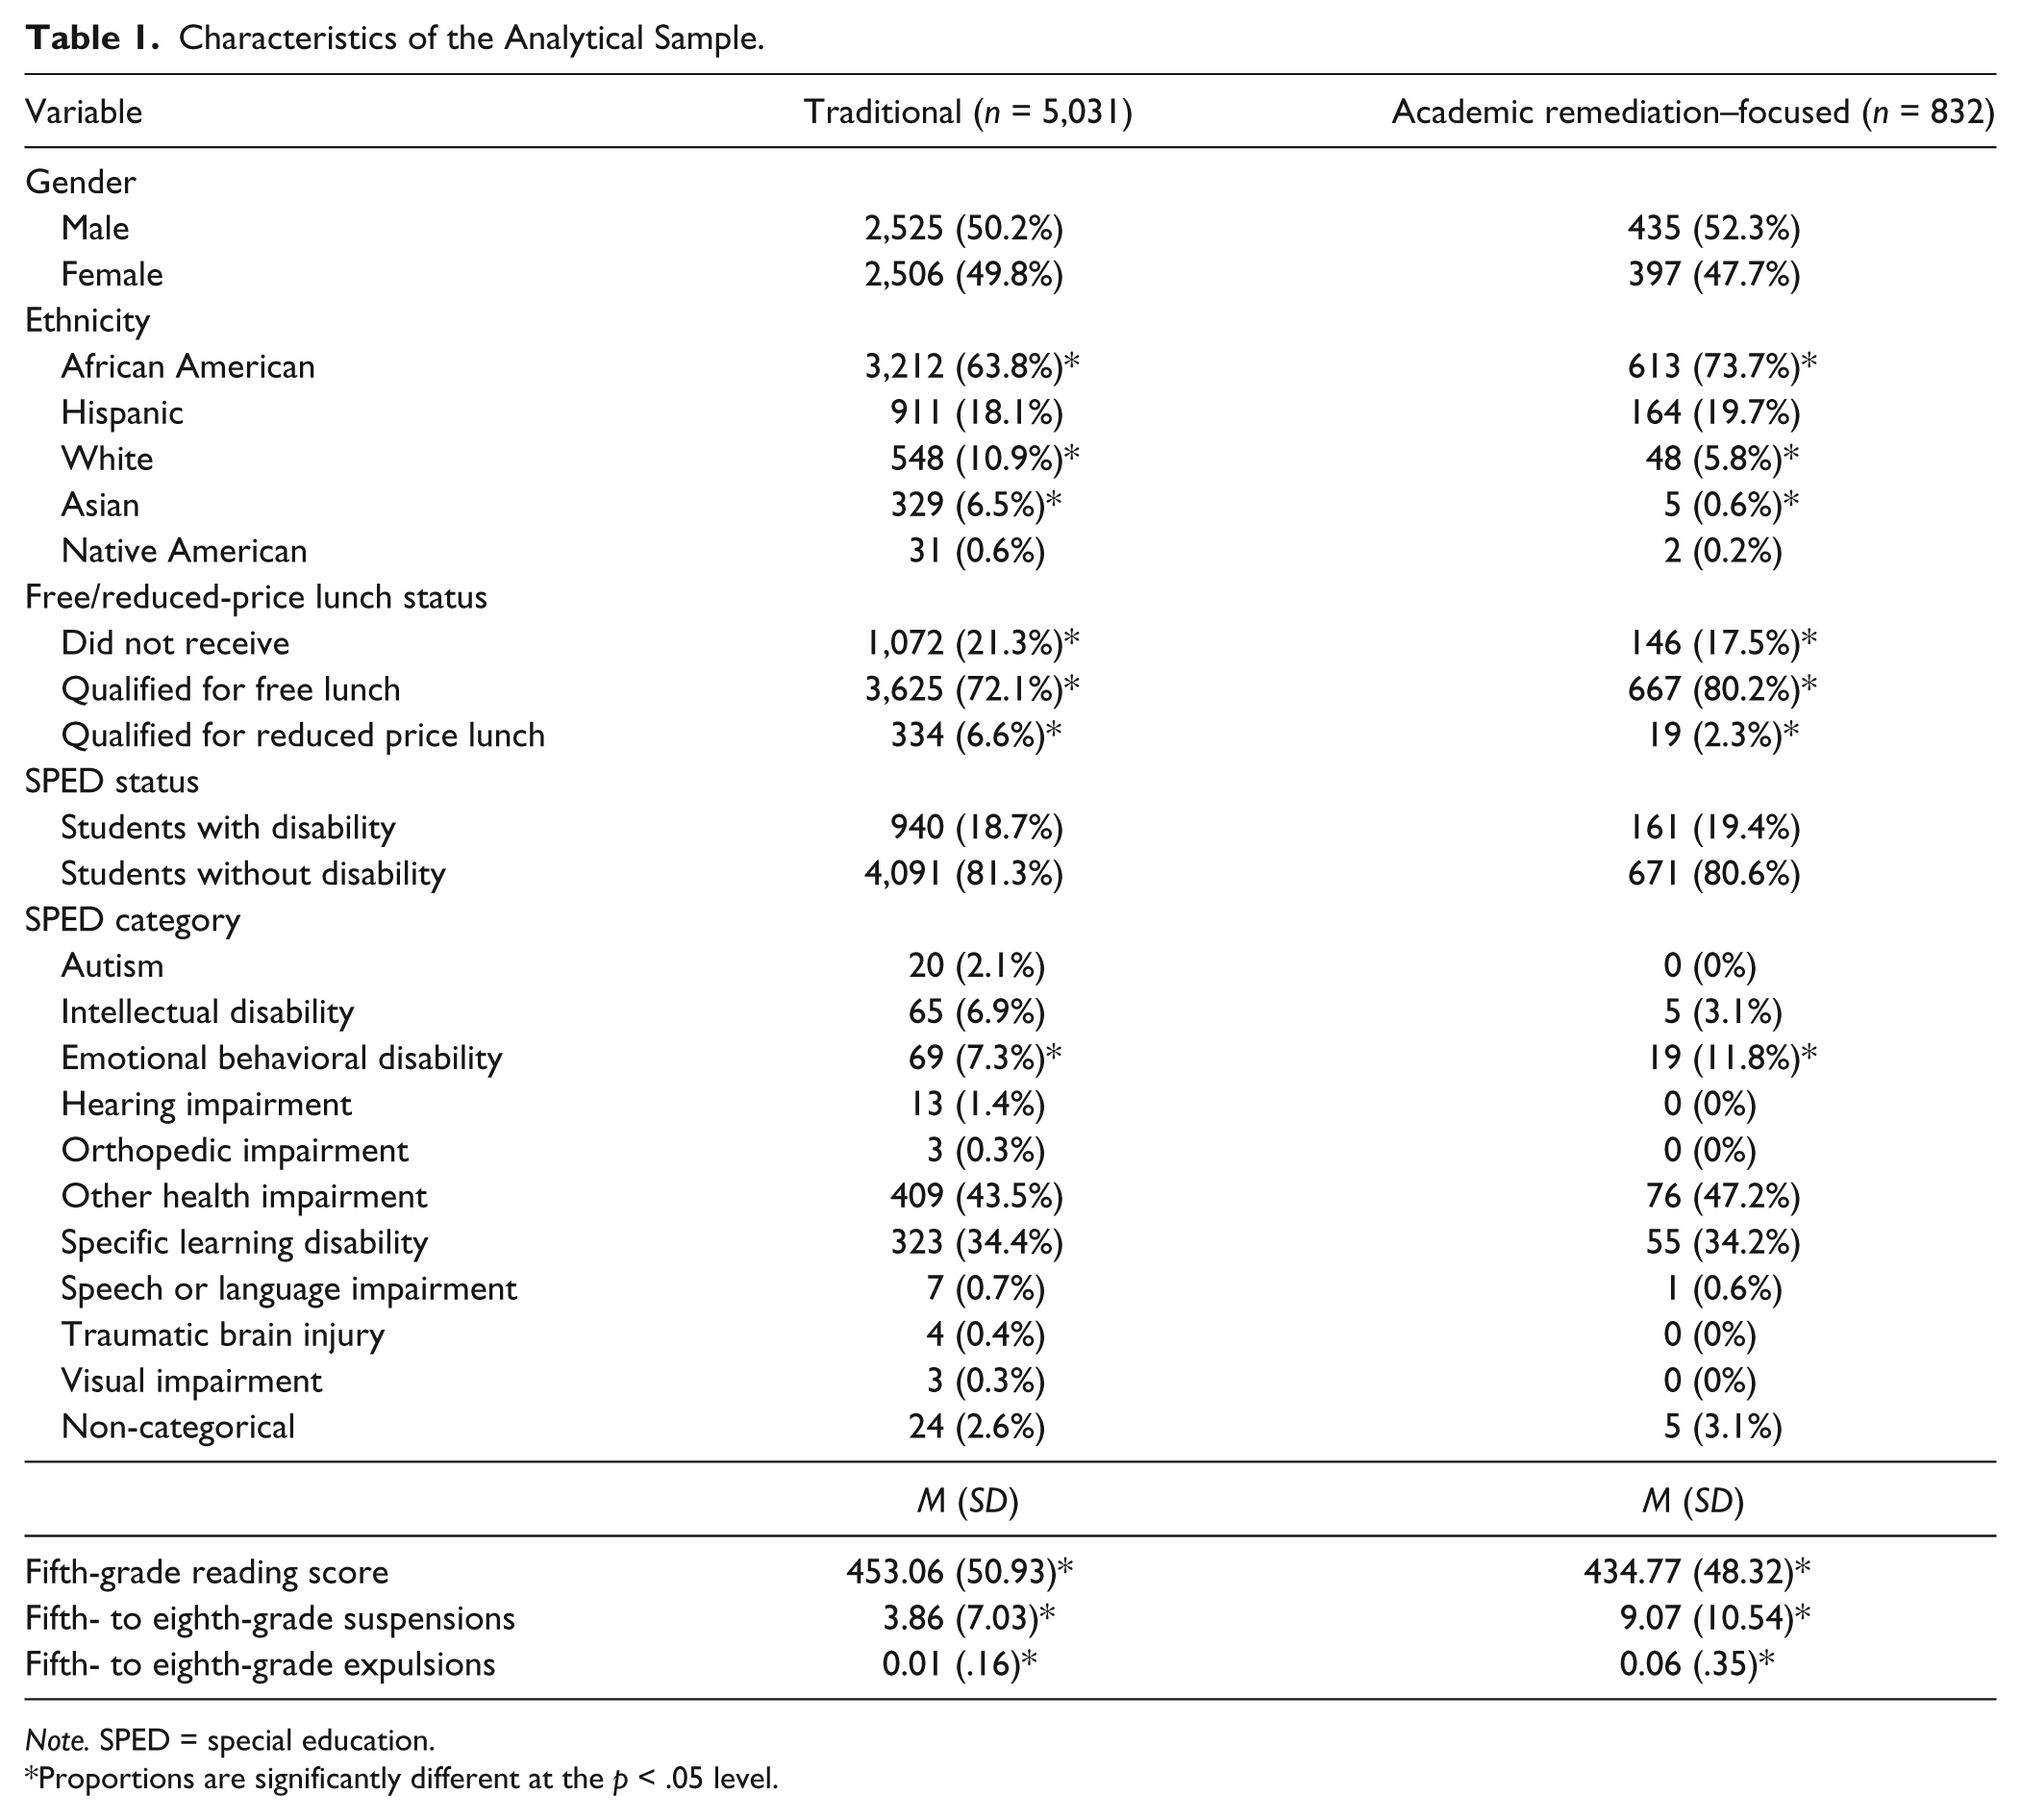
Of 12,893 students for whom we obtained complete data, 5,031 attended traditional schools and 832 attended AR schools; the remaining students in the sample were coded as attending other school types. Therefore, a total of 5,863 students were included in the analytical sample. Table 1 shows a summary of demographic characteristics of students in the analytical sample.
Characteristics of the Analytical Sample.
Note. SPED = special education.
Proportions are significantly different at the p < .05 level.
Data Analysis
We analyzed demographic characteristics from the two types of schools in the analytical (unmatched) sample using chi-square tests of independence for categorical variables and independent sample t-tests for quantitative variables. Table 1 includes a summary of the results of these analyses.
Propensity scores were calculated by performing logistic regression analysis with school type (i.e., AR alternative or traditional school) entered as a dichotomous dependent variable. The propensity score is defined as the conditional probability of assignment to a treatment group based on specific observed covariates (Rosenbaum & Rubin, 1983). The purpose of our logistic regression was to estimate the probability that a student would be assigned to an AR alternative school given the student’s values on the covariates. Covariates were selected from among available data to reflect student demographic characteristics known to be disproportionately represented in alternative schools (Kleiner et al., 2002), as well as data that capture behavioral and academic performance that would suggest risk of eventual placement in an alternative school (e.g., standardized state reading assessment scores). The list of covariates was then narrowed to create the best statistical model; individual t-test results showed which covariates significantly predicted changes in the dependent variable and were therefore retained in the analysis.
Eight covariates were ultimately identified to use in the logistic regression analysis: number of expulsions in fifth to eighth grades; number of suspensions in fifth to eighth grades; fifth-grade score from the state’s standardized reading assessment, EBD status (i.e., a dummy-coded variable indicating whether or not the student received SPED services for an EBD), other health impairment (OHI) status (i.e., a dummy-coded variable indicating whether or not the student received special education services for an OHI); and three additional dummy-coded variables indicating whether or not the student was identified as White, Asian, or African American. None of the slope coefficients changed significantly as we added each of these single covariates to the model, confirming that the addition of these covariates did not result in a potential increase in bias. We used the psmatch2 command in Stata 13 to run the logistic regression analysis and completed nearest neighbor matching with 1–1 matching and the no-replacement option based on the calculated propensity scores (see Guo & Fraser, 2010, for examples). Moreover, we used the pstest command to check the balance of covariates before and after matching.
As a next step, we ran Poisson regression analyses on the matched sample. The purpose of this analysis was to determine the causal effect of school placement on student outcomes. The effectiveness of placement in AR alternative schools was evaluated using four student outcome (i.e., dependent) variables measured during the 2012–2013 school year: (a) number of days attended (i.e., number of days the student attended at least 60% of the day); (b) number of office discipline referrals (ODRs); (c) number of suspensions; and (d) credits earned in one semester (i.e., fall 2012). As these four student outcomes are count variables, we used Poisson regressions for analyzing each outcome variable. For two of the four outcome variables that contained a high number of zeros (i.e., suspensions and ODRs), we conducted zero-inflated Poisson (ZIP) regressions. We applied Vuong’s hypothesis test to check the zero inflation in these two outcomes. The test results showed that the ZIP model was appropriate for both suspensions (z = 8.02, p < .001) and ODRs (z = 10.82, p < .001). All four analyses began with entering a binary categorical variable representing school type: One category represented traditional schools and the other category represented AR alternative schools. In addition to the binary school type variable, seven variables were entered into Poisson regression analyses for the attendance and credit outcome variables. Those seven variables included: (a) Male (i.e., status on a dummy-coded variable indicating gender), (b) White, (c) African American, (d) Asian, (e) SPED status (i.e., a dummy-coded variable indicating whether or not a student received SPED services), (f) number or suspensions in fifth to eighth grades, and (g) fifth-grade scores on the state standardized reading assessment. We entered six variables in the ZIP regression analyses for the suspension and ODR outcome variables: male, White, African American, Asian, EBD, and number of suspensions experienced in fifth to eighth grades. School type was added to the logit part of the ZIP analyses to check if it was significant in predicting excessive zeros in the models.
Results
Baseline Characteristics of the Analytical Sample
Baseline analysis results showed that student gender did not differ significantly across AR alternative schools and traditional schools, χ2(1, N = 5,863) = 1.25, p = .14. However, student ethnicity differed significantly across school types, χ2(4, N = 5,863) = 76.0, p < .001. The percentage of African American students was significantly higher in AR alternative schools than in traditional schools (73.7% vs. 63.8%). On the other hand, the percentage of White (5.8% vs. 10.9%) and Asian (0.6% vs. 6.5%) students was significantly lower in AR alternative schools. The percentage of Hispanic students (19.7% vs. 18.1%) and Native American students (0.2% vs. 0.6%) did not differ significantly by school type.
The overall test statistic was not statistically significant for disability categories, χ2(10, N = 1,101) = 14.54, p = .15, meaning that the percentage of students with specific disability categories was not significantly different across school types. Chi-square test of independence showed significant association between student socioeconomic status (i.e., as measured by whether or not they qualify for and receive free and reduced price lunches [FRL]) and school type, χ2(1, N = 5,863) = 33.7, p < .001, with significantly more students receiving FRL in the traditional schools than in the AR alternative schools. Nearly equal percentages of students received SPED services in AR alternative schools and traditional schools (19.4% vs. 18.7%). This difference was not statistically significant, χ2(1, N = 5,863) = .20, p = .34. The mean fifth-grade reading scores of students attending the AR alternative schools was significantly lower than students attending the traditional schools, t(5861) = 9.66, p < .001. The students attending AR alternative schools had significantly higher mean fifth- to eighth-grade suspensions than the students attending traditional schools, t(5861) = −18.23, p < .001. Similarly, the mean number of fifth- to eighth-grade expulsions was significantly higher for students enrolled in AR alternative schools than traditional schools, t(5861) = −6.20, p < .001.
Balancing Analysis
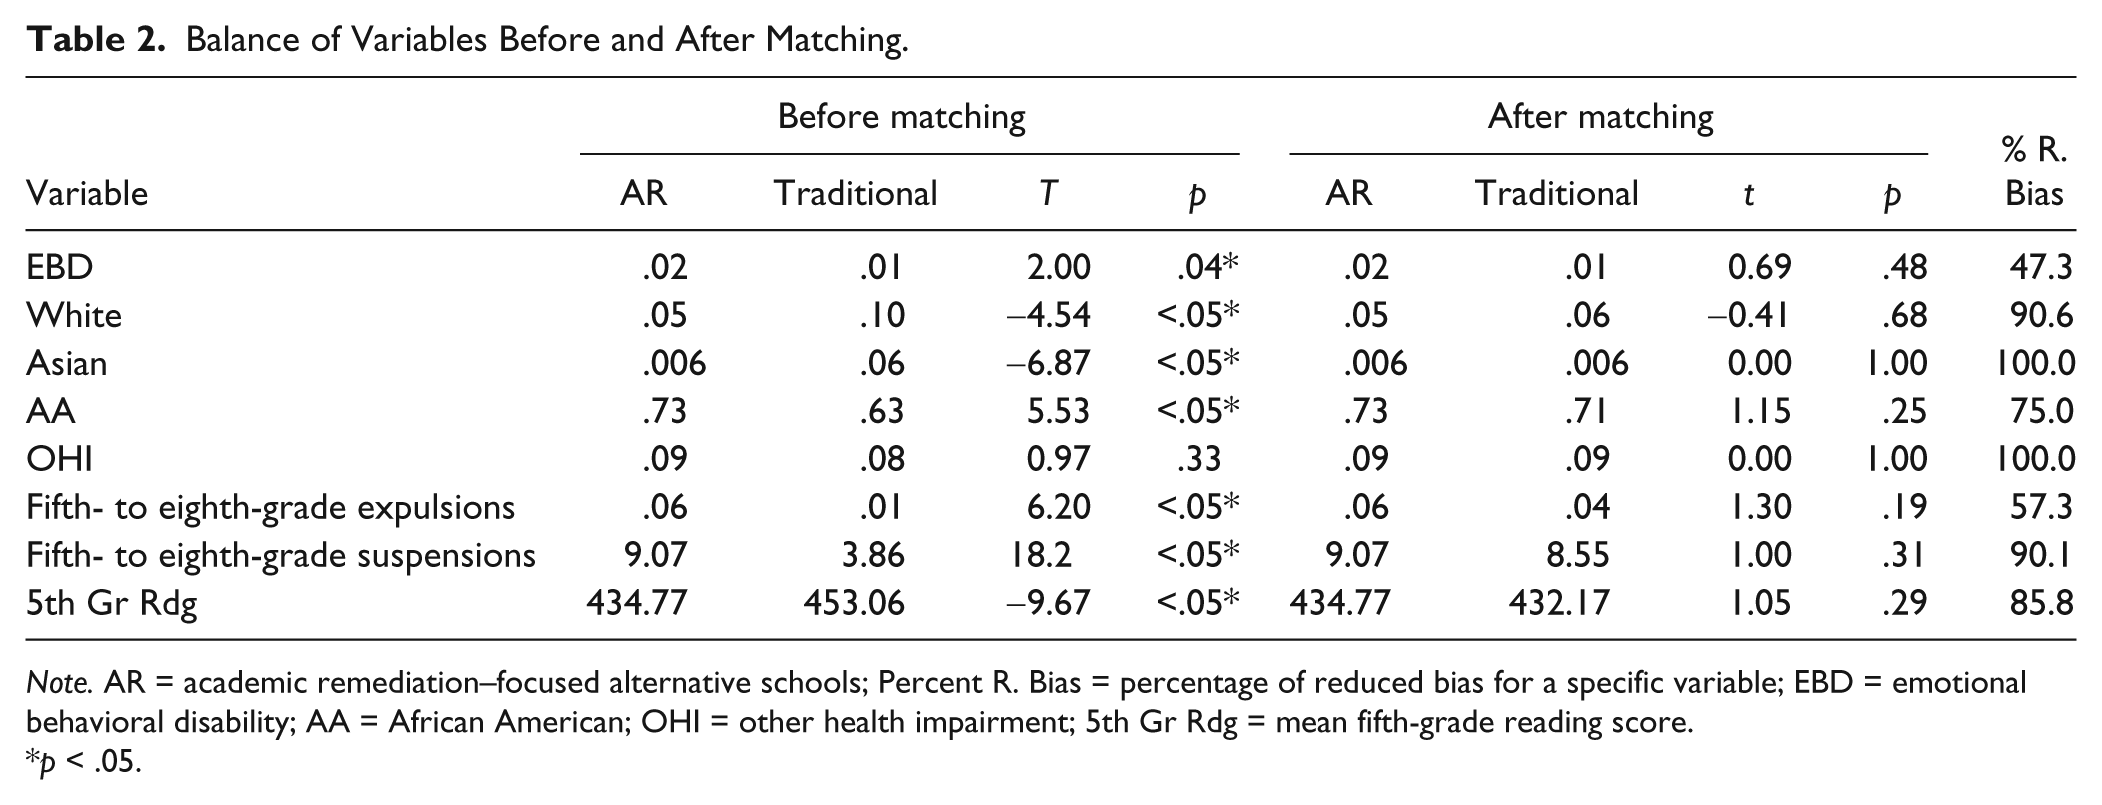
A total of 832 students who attended AR alternative schools (i.e., the treatment group) were matched to 832 students who attended traditional schools (i.e., the matched control group). See Table 2 for a list of balance statistics comparing the treatment group with the matched control group. Balance analysis showed that all variables used to calculate propensity scores were significantly different at the α = .05 level between the two school types before the matching, with the exception of the OHI variable. However, after matching, all differences between the two school types were removed. Overall, mean bias was reduced by 81% after matching in comparison with the mean bias that was present before matching.
Balance of Variables Before and After Matching.
Note. AR = academic remediation–focused alternative schools; Percent R. Bias = percentage of reduced bias for a specific variable; EBD = emotional behavioral disability; AA = African American; OHI = other health impairment; 5th Gr Rdg = mean fifth-grade reading score.
p < .05.
Effects of Participation in AR Alternative Schools
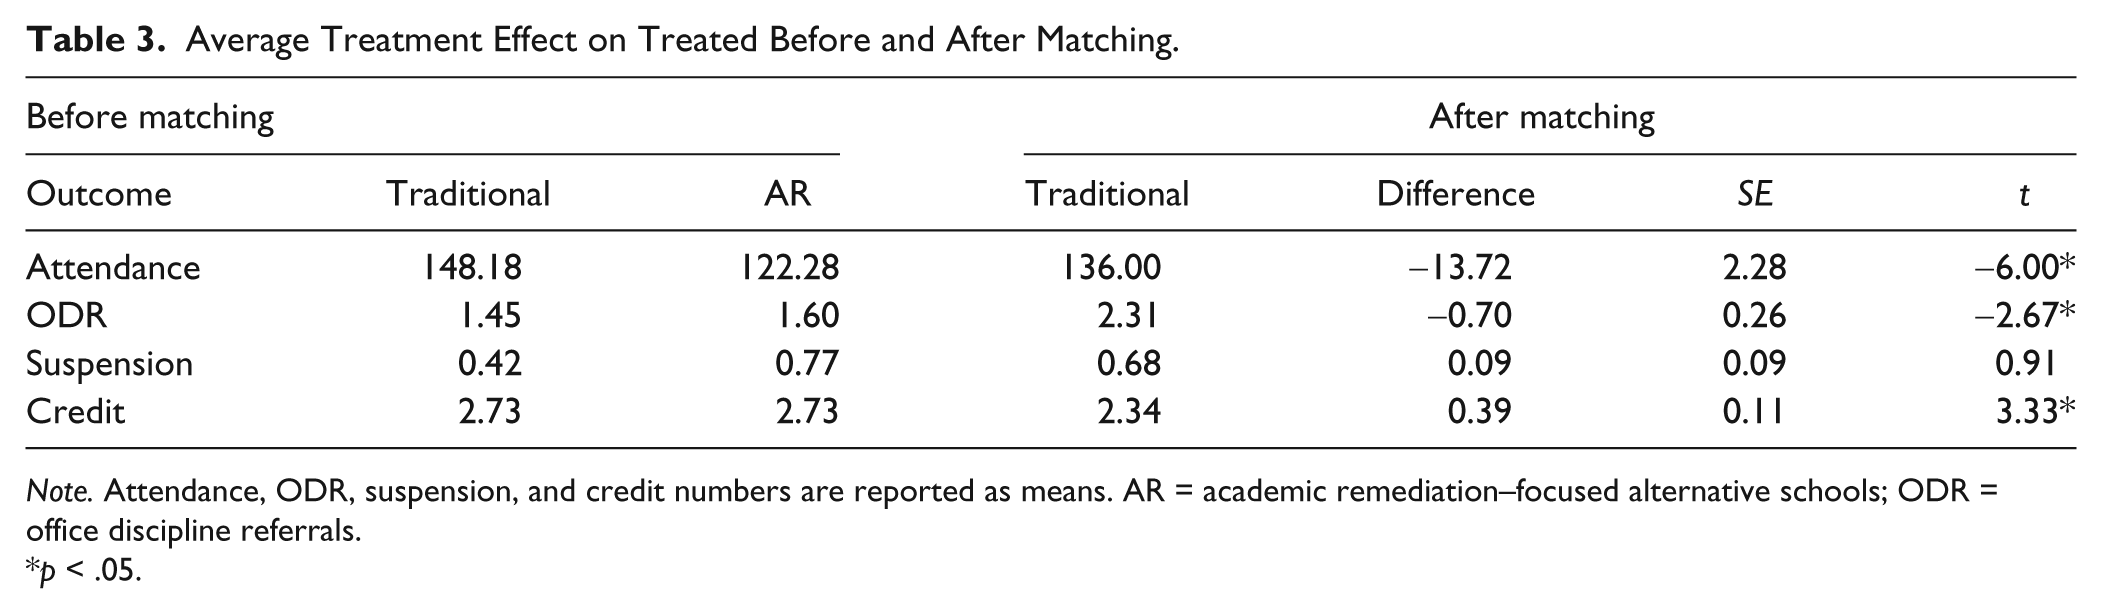
Prior to the regression analyses, the average treatment effect on treated (ATT) was calculated for each student outcome. Table 3 includes a summary of mean differences for each student outcome before and after matching. Results indicate that the mean number of school days attended was lower in AR alternative schools than in traditional schools (M = 122.28 vs. M = 136.00, SE = 2.28). This difference was statistically significant (p < .001). In the matched group, students attending AR alternative schools had fewer ODRs than students attending traditional schools (M = 1.60 vs. M = 2.31, SE = .26). This difference was statistically significant (p < .001). Students attending AR alternative schools had slightly more suspensions than students attending traditional schools (M = .77 vs. M = .68, SE = .09). This difference was not statistically significant (p = .36). Last, students enrolled in AR alternative schools earned more mean credits in one semester than students who attended traditional schools (M = 2.73 vs. M = 2.34, SE = .11). This difference was statistically significant (p < .001).
Average Treatment Effect on Treated Before and After Matching.
Note. Attendance, ODR, suspension, and credit numbers are reported as means. AR = academic remediation–focused alternative schools; ODR = office discipline referrals.
p < .05.
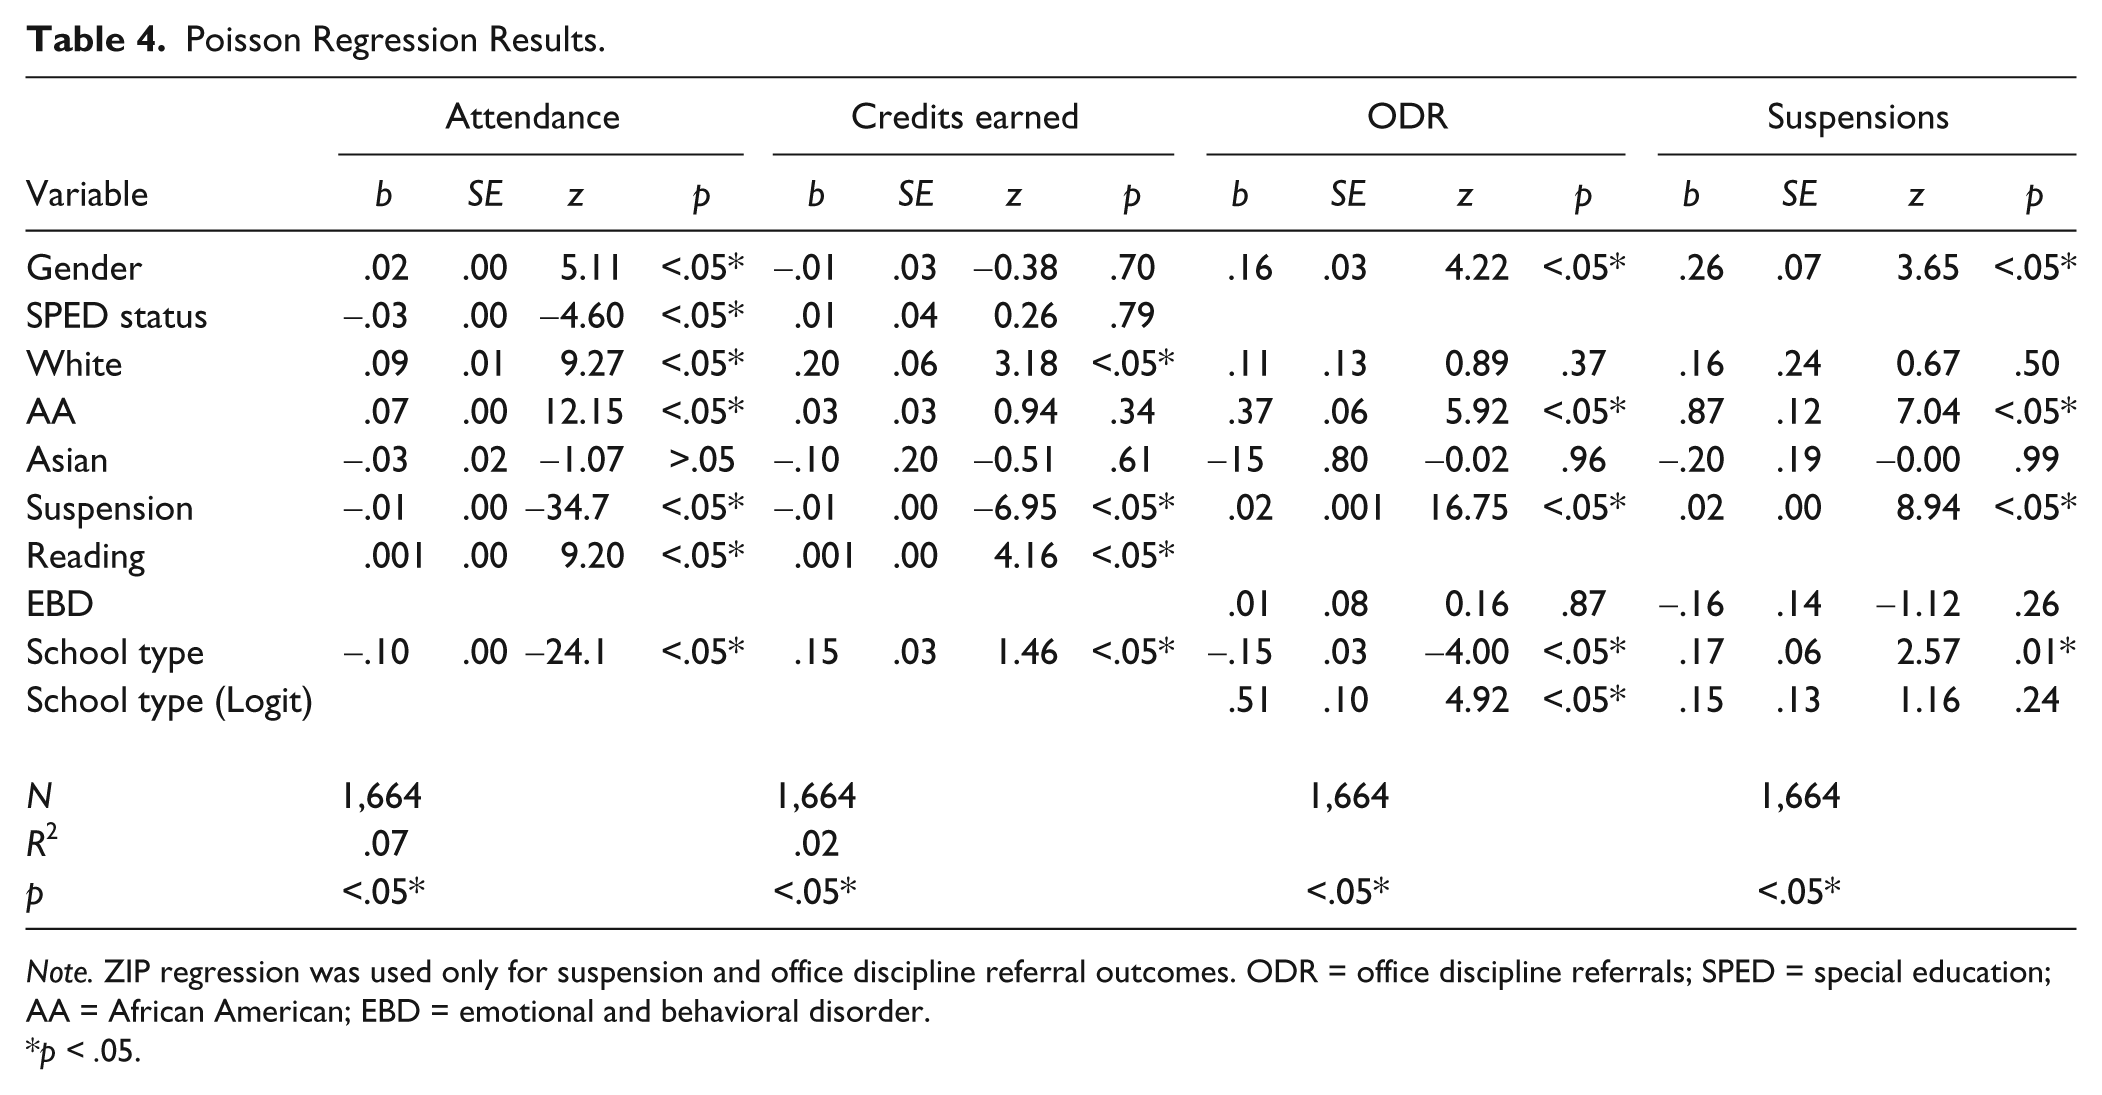
To determine the extent to which participation in AR alternative schools is effective, four outcome variables were entered into Poisson regressions along with the eight control variables for a doubly robust analysis. Table 4 shows the results from the Poisson regression analysis for each student outcome variable.
Poisson Regression Results.
Note. ZIP regression was used only for suspension and office discipline referral outcomes. ODR = office discipline referrals; SPED = special education; AA = African American; EBD = emotional and behavioral disorder.
p < .05.
School attendance
Results show that school type significantly predicted school attendance, (b = −.10, z = −24.1, p < .001). For a one-unit increase in AR alternative school enrollment, the log count of school attendance is expected to decrease by .10, controlling for other variables in the model. In addition to school type, each variable, except Asian, significantly predicted school attendance, controlling for other variables in the model. The log count of school attendance is expected to increase by .02 for male (b = .02, z = 5.11, p < .001), .09 for White (b = .09, z = 9.27, p < .001), .07 for African American (b = .07, z = 12.15, p < .001), and .001 for having higher fifth-grade reading assessment scores (b = .001, z = 9.20, p < .001). However, the log count of school attendance is expected to decrease by .03 for receiving SPED services (b = −.03, z = −4.60, p < .001) and .01 for a one-unit increase in middle school suspensions (b = −.01, z = −34.7, p < .001).
Credits earned in one semester
Results of this model illustrate that school type significantly predicted high school credits earned in one semester, (b = .15, z = 1.46, p < .001). For a one-unit increase in AR alternative school enrollment, the log count of credits earned in one semester is expected to increase by .15, controlling for other variables in the model. This model also showed that the log count of credits earned in one semester is expected to decrease by .01 for a one-unit increase in middle school suspensions (b = −.01, z = −6.95, p < .001). The log count of credits earned in one semester is expected to increase by .001 for a one-unit increase in fifth-grade reading assessment score (b = .001, z = 4.16, p < .001) and .20 for White (b = .20, z = 3.18, p = .001), controlling for other variables in the model.
ODRs
With regard to the log odds of an inflated number of zeros, school type was significant (b = .51, z = 4.92, p < .001). This means that enrollment in an AR school is associated with a significantly higher chance of zero office referrals. In the Poisson part of the ZIP, school type significantly predicted ODRs (b = −.15, z = −4.00, p < .001). For a one-unit increase in AR alternative school enrollment, the log count of ODRs is expected to decrease by .15, controlling for other variables in the model. This model also showed that the log count of ODRs is expected to increase by .37 for African American (b = .37, z = 5.92, p < .001), .02 for a one-unit increase in number of middle school suspensions experienced (b = .02, z = 16.75, p < .001), and .16 for male (b = .16, z = 4.22, p < .001). White, Asian, and EBD did not significantly predict ODRs.
Suspensions
Results from the ZIP regression showed that school type did not significantly predict excessive zeros in the logit model (b = .15, z = 1.16, p = .24). The Poisson regression results of this model showed that school type significantly predicted secondary suspensions, (b = .17, z = 2.57, p = .01). This means that for a one-unit increase in AR alternative school enrollment, the log count of secondary suspensions is expected to increase by .17, controlling for other variables in the model. This model also showed that the log count of secondary suspensions is expected to increase by .26 for male (b = .26, z = 3.65, p < .001), .87 for African American (b = .87, z = 7.04, p < .001), and .02 for a one-unit increase in the middle school suspensions experienced (b = .02, z = 8.94, p < .001). White, Asian, and EBD did not significantly predict secondary suspensions in the model.
Discussion
The purpose of providing an alternative school option to secondary students who are at risk of school failure is to allow those students access to a learning environment that is more conducive to their successful mastery of academic content and timely progress toward degree completion than traditional schools have afforded them (Lehr et al., 2009). AR alternative schools, specifically, are defined as those that have a primary aim of providing students with specialized curriculum or instruction to address academic needs, with or without additional services targeting behavioral or mental health needs (Raywid, 1994). Our study was designed to determine whether students who attend AR alternative schools do indeed experience improved outcomes compared with a matched sample of peers who remained in traditional high schools. Our findings indicate that enrollment in an AR school is associated with significant differences on all outcome variables, some in the predicted positive direction, others in a negative direction.
School Attendance
Placement at AR alternative schools was associated with significantly lower attendance than enrollment in the traditional high schools. Because attendance at school is a necessary precursor of benefitting from school, this finding is, by itself, problematic. However, our research design did not allow us to examine the context surrounding these findings. It is possible that daily attendance in an alternative program is negatively affected by the location or hours of the program. We know that some AR schools in our sample offered half day or evening and weekend programs. While these schedules are designed to better meet students’ needs, it is possible that the atypical schedules may have adversely affected attendance. In addition, because the alternative schools serve students from multiple home schools, the AR alternative programs can be housed in locations far from students’ regular home schools. Transportation to these programs may be challenging. Given the important relationship between attendance and school completion and other long-term outcomes (Hallfors et al., 2002; Nichols, 2003; Roby, 2004; Wang, Blomberg, & Li, 2005), it would be helpful for future research to investigate the factors that influence rates of school attendance at AR alternative schools.
Credits Earned in One Semester
Our study confirmed some past research findings related to the benefits of attending an AR school (e.g., Franco & Patel, 2011; Franklin et al., 2007), in that students attending AR alternative schools demonstrated higher rates of credit accrual compared with their matched peers attending traditional high schools (i.e., the control group). This is particularly promising given the concurrent finding that students in AR alternative schools also demonstrated a significantly lower rate of attendance, similar again to findings noted by Franklin et al. (2007).
Students in our sample who attended an AR alternative school earned an average of 2.73 credits in one semester of high school compared with the average of 2.34 credits earned by their matched peers in traditional schools. The state requires students to earn at least 24 credits to graduate. Therefore, students need to earn an average of at least 3.0 credits per semester to graduate in 4 years. Some AR alternative high schools in the participating LEA have been granted permission to allow students to graduate with 22 credits, meaning a student could graduate in 4 years by earning an average of 2.75 credits per semester. The average number of credits earned per semester was lower than that required to graduate in 4 years for students in both the treatment and control groups. However, placement in an AR alternative school is associated with stronger performance, indicating that the schools are providing students with support that boosts their performance in this most basic and critical way. Whereas this finding only confirms that the AR schools are associated with at least this one positive academic outcome, it is comforting given that not all alternative schools are able to accomplish even this basic level of success (e.g., Wilkerson, Afacan, Perzigian, Justin, & Lequia, in press). Improving daily attendance in the AR schools could lead to even stronger performance.
ODRs
Students who attended the AR alternative schools also had significantly fewer office referrals than their counterparts in traditional schools. Certainly, students who are absent more frequently have less opportunity to be referred to the office for disciplinary reasons. However, the fact that enrollment in the AR alternative schools was associated with significantly less office referrals is a positive finding. AR alternative schools also have much smaller average enrollments than traditional schools (i.e., 59 vs. 942 on average in our sample) and at least some of the students are enrolled in the schools by choice. These two factors may also lead to a more positive school climate and less office referrals generally. Future observational research could provide more context for the lower use of ODRs in AR alternative schools.
Suspensions
Conversely, enrollment in an AR alternative school was also associated with a significantly higher incidence of suspension. Although the number of overall suspensions is low compared with ODRs, it is nevertheless troubling that the use of this punishment strategy is inflated at the alternative schools. Observational and interview research may shed light on educators’ use of suspensions in AR alternative schools.
Demographic Variation by School Type
It is important to note that, overall, significantly more Black students and students receiving FRLs were enrolled in our AR alternative school sample than were enrolled in the district’s traditional schools. A recent report from the Office for Civil Rights (U.S. Department of Education, Office for Civil Rights, 2012) draws attention to the nationwide problem of pervasive poor outcomes in schools that serve disproportionately high percentages of students of color and students living in poverty. Our study revealed that poor students and students of color were more likely to be enrolled in this particular type of alternative segregated school setting, designed to serve students at risk of school failure. However, at the same time, our study also demonstrated that students in these schools experience better outcomes associated with credit accrual and office referrals, when compared with peers who experience similar early school-based risk factors.
Recommendations for Future Research
Given that students in AR alternative schools earned significantly more credits than their counterparts in traditional schools, a closer examination of the factors that lead to higher credit accumulation among AR alternative schools may be merited. Also, in light of the fact that many of the alternative schools in our sample operated on a shortened school day schedule, the difference in credit accrual is all the more impressive. Identifying program characteristics that are associated with the highest rates of credit accumulation would be of benefit to traditional and alternative school staff alike, as well as LEA administrators. Identifying and capitalizing on effective practices is particularly important for LEAs in which a disproportionate number of the students who are assigned to AR alternative schools are students of color or students with disabilities.
Further research is also needed to understand the cause of the lower number of office referrals experienced by students in AR alternative schools along with the higher number of suspensions. Given that the average enrollment at the AR alternative schools in our sample was 59, compared with 942 in the traditional schools, it is certainly worth exploring the role, if any, that smaller classes, overall school climate, levels of support, and individualization play in predicting the number of office referrals and/or suspensions experienced.
Another recommendation for future research would be to follow the progress of students after they have matriculated in AR alternative schools and examine an expanded set of academic outcomes. In the current study, we looked at the relationship between enrollment in one of two types of secondary schools and outcomes. Following students in these two settings across their high school careers, including investigation of how long students remain in AR alternative schools and whether they also enroll in summer school programs, would give us a fuller picture of students’ school completion trajectories.
The current study did not allow for examination of individual school characteristics; future research focusing on successful schools might also allow us to ascertain what aspects of the alternative settings are most responsible for their positive outcomes. We relatedly recommend future research investigate the experiences of students and teachers in AR alternative schools. If educators in alternative programs are indeed serving students at risk of school failure more productively than those in traditional schools, it is important for policy makers, LEA administrators, and educators to understand the mechanisms that are driving improved outcomes to determine which, if any, of those mechanisms might also be replicated in traditional school settings. As not all students who are struggling academically want to attend separate, segregated school settings, and not all LEAs have the resources or desire to maintain separate alternative settings, it is important to consider what pedagogy, instructional practices, or structural elements of alternative schools (e.g., schedules, attendance policies) might lend themselves to adoption in traditional school settings.
Limitations
One limitation of this study is that we have likely oversampled students with stable school trajectories. In the selection of our sample, we started with the entire population of secondary students in the participating district. We then limited our analytic sample to just those students for whom we had access to both academic and behavioral data for fifth to eighth grades. We did this to create propensity scores based on early school behavioral trajectories. In doing so, however, we eliminated from our sample all students who had moved into the district some time after fifth grade. Knowing that students with disability labels are more mobile than typical students (Blakeslee et al., 2013; Malmgren & Gagnon, 2005), we acknowledge that we both decreased our pool of students with disability labels, and oversampled “stable” students, in that the students in our sample were selected only from those who remained in the same school district for at least 5 years (i.e., fifth-ninth grade). It is possible that the inclusion of more geographically mobile students may have resulted in a sample with poorer outcomes. However, because we compared outcomes of students in AR alternative schools with a matched group of students in traditional schools, the impact of the oversampling of stable students is a factor for both the treatment and control condition groups, minimizing any adverse impact on our ability to draw conclusions.
Conclusion
Our research suggests that attendance at AR alternative schools aids students in achieving improved outcomes—specifically in the area of earning credits toward graduation and decreased experience with office referrals. Future research is needed to determine the extent to which these improved outcomes extend beyond 1 year and the feasibility of translating improved outcomes from these settings back into the traditional public schools.
Footnotes
Authors’ Note
Whitney Justin is now at the Madison Metropolitan School District.
Declaration of Conflicting Interests
The author(s) declared no potential conflicts of interest with respect to the research, authorship, and/or publication of this article.
Funding
The author(s) received no financial support for the research, authorship, and/or publication of this article.