
Abstract
In this single-subject study, we examined the effects of a summarizing strategy on the written summaries of children with emotional and behavioral disorders (EBDs). Six students with EBDs in fifth and sixth grades learned a mnemonic-based strategy for summarizing taught through the self-regulated strategy development (SRSD) approach. Visual analyses were conducted, along with estimated effect sizes using quantitative methods at both the individual level and across cases. Visual analyses revealed evidence for a functional relation between the treatment program and quality points. Quantitatively, very large effects were noted for all six students. Anecdotal evidence suggested the students understood the purpose of the strategy and could independently recall the steps of the mnemonic by the end of the intervention. Results suggest that the strategy has the potential to improve the summary writing skills of students with EBDs. Limitations and future directions are discussed.
Keywords
Summarizing is a critical element of reading and writing (Graham & Perin, 2007) that can improve the understanding and remembering of texts (Dollins, 2012). Writing a summary of a reading selection is a valuable skill for many academic and work-related tasks, including essay and report writing, presentations, and post-reading activities. Creating a summary in writing involves multiple cognitive activities such as decoding and comprehending a text, identifying relevant content, and generating an accurate, shortened, yet comprehensive version of the original text that briefly restates the original authors’ main ideas, purpose, and intent while accurately providing a few paraphrased key supporting details (Westby, Culatta, Lawrence, & Hall-Kenyon, 2010). When summarizing, students must weigh the relative significance of textual elements, which can lead to higher comprehension than reading alone (Graham & Hebert, 2010).
The skills involved in summarization are documented in the Common Core State Standards for both reading and writing. For example, for students in fifth and sixth grades (the grade range of the students in this study), Common Core requirements include determining main ideas of a text and explaining how they are supported by key details, along with providing a summary of the text distinct from personal opinions or judgments; writing informative or explanatory texts to examine a topic and convey ideas, concepts, and information through the selection, organization, and analysis of relevant content; developing a topic with relevant facts, definitions, concrete details, quotations, or other information and examples; gathering relevant information from multiple sources and quoting or paraphrasing information gathered from multiple sources while avoiding plagiarism; and providing a concluding statement that follows from the information presented (National Governors Association Center for Best Practices & Council of Chief State School Officers, 2010).
Despite the value of summarizing in writing, many students struggle with this important skill for several possible reasons: first, summarizing in writing is a more complex and fundamentally different literacy task than the typical composing task, in that summarizing requires comprehension, evaluation, and the reduction of existing text, rather than the planning, drafting, and revising of new ideas (Newell, Van der Heide, & Wilson, 2013). Second, summarizing depends not only on writing skill but also on the writers’ ability to recall and comprehend the text read (Graham & Hebert, 2010). Finally, although students often are asked to summarize what they have read, they may not be taught how to produce written summaries (Frey, Fisher, & Hernandez, 2003). As a result, they create products that lack essential genre characteristics. One particular group of students who may struggle with writing summaries is children with emotional and behavioral disorders (EBDs).
Many students with EBDs have difficulty with written expression. In fact, researchers have suggested that writing may be the most significant academic deficit for these students (Sreckovic, Common, Knowles, & Lane, 2014). Although students with EBDs tend to struggle with all stages of the writing process, they are, unfortunately, an underresearched category of writers (Mastropieri et al., 2009). The research that does exist suggests that writers with EBDs may not exhibit overt planning behaviors, even after being taught a planning strategy (Little et al., 2010). If written plans are created, students with EBDs often lack motivation to translate the information from their plans into a cohesive piece of writing, leading to short compositions that contain simple sentences bereft of complex, rich vocabulary (Adkins & Gavins, 2012). Students with EBDs also may display low levels of motivation for writing, making writing an even more daunting task, because motivation is vital in sustaining engagement in drafting and revising (Adkins & Gavins, 2012). If a writer lacks motivation to persevere through the writing process, he or she may become frustrated and engage in inappropriate behaviors (Bak & Asaro-Saddler, 2013).
Students with EBDs also may struggle with utilizing self-regulatory behaviors (Menzies, Lane, & Lee, 2009). Use of self-regulatory behaviors while writing is important because it allows an individual to apply strategies, assess progress toward accomplishing a task, and encourage persistence when encountering frustration (K. L. Lane, Graham, Harris, & Weisenbach, 2006). A lack of self-regulatory behaviors may prevent students with EBDs from being successful writers (Bak & Asaro-Saddler, 2013). For these reasons, it is logical to assume that students with EBDs who struggle with writing may struggle with the challenging task of creating written summaries.
One intervention that has been promising with individuals with EBDs in writing is the self-regulated strategy development (SRSD; Graham & Harris, 2005) approach. SRSD combines instruction in specific strategies for creating genre-related content (e.g., persuasive writing) with training in self-regulation strategies (Graham & Harris, 2005). Typically, six instructional stages are included: develop background knowledge, discuss it, model it, memorize it, support it (guided practice), and independent practice (Graham & Harris, 2005). Within these stages, four self-regulation processes are included: goal setting, self-monitoring, self-instructions, and self-reinforcement. Direct instruction and modeling are used to make these processes overt.
Several recent reviews of research and meta-analyses found that SRSD met the criteria for an evidence-based practice for students with EBDs (Ennis & Jolivette, 2014; Losinski, Cuenca-Carlino, Zablocki, & Teagarten, 2014; Sreckovic et al., 2014). Studies utilizing SRSD as an instructional framework with students with EBDs have shown positive outcomes in terms of planning behaviors and overall quality of persuasive and story writing, as well as written retells. While one study taught a student with EBD summarizing as part of a comprehension and retell strategy (Mason, Snyder, Sukhram, & Kedem, 2006), no known studies have used SRSD to directly teach summary writing to children with EBDs.
The current study adds to the existent body of knowledge on SRSD by exploring an intervention designed to teach the critical skill of summary writing to children with EBDs and writing difficulties. In this project, six students with EBDs who struggled with writing were taught a strategy to create written summaries using a mnemonic taught through the SRSD approach. The mnemonic was designed to help writers work through several important steps to help them plan and write effective summaries of passages they read. We hypothesized that the summarizing strategy would improve the overall quality of the participants’ written summaries from baseline to post-test and would also have a positive effect on planning behaviors.
Method
Participants and Setting
After obtaining approval from the Institutional Review Board (IRB), the study began in an inner-city district in the Northeastern United States. The K-6 school that hosted the research project included 315 students, 28% of which were Black or African American, 48% White, 10% Hispanic or Latino, 8% Asian, 5% Multiracial, and 1% American Indian. Twelve percent of the students were classified as English language learners, 14% had identified disabilities, and 41% were considered economically disadvantaged.
Six students from a self-contained 12:1:1 (12 students, one special education teacher, and one teacher assistant) mixed fifth- and sixth-grade classroom for students with EBDs from that school met our criteria for inclusion in this study. The special education teacher selected these students to participate because they met the following criteria: diagnosed with an EBD and writing difficulties, writing goals on their Individualized Education Programs (IEPs), and the ability to write complete sentences with a pen or pencil. The six participants were all English-speaking, African American students ranging in age from 10 years 9 months to 11 years 10 months. Five were male and one was female. All had goals in writing and behavior on their IEPs and received counseling services both individually and in a group to support their emotional and behavioral growth and to acquire coping skills. Each also had individual behavior intervention plans and participated in regular state and district assessments with accommodations for extended time and separate location. The special education teacher said that none of the students enjoyed writing or engaged in any planning or revising. Typically, their compositions were brief and of low quality.
The special education teacher paired the students for instructional sessions based on social emotional factors more than academic ability, in an attempt to limit negative interpersonal factors as much as possible. Pairs were then randomly assigned to instructional order. The first pair was Chuck and Kwante. Chuck was 11 years 0 months old, and was diagnosed with emotional disturbance and other health impaired. He received individual counseling services once a week for 30 min and small group counseling twice a week for 30 min. The second student, Kwante, was 11 years 10 months old, and was diagnosed with emotional disturbance and asthma. He was reported to exhibit high levels of verbal aggression. He received counseling therapy twice a week for 30 min, once in a small group and once individually.
The second pair was Zephram and Nicki. Zephram was 10 years 11 months old at the time of the study. In addition to his emotional disturbance, he was also diagnosed with attention deficit hyperactivity disorder (ADHD), asthma, and mood disorder. He received one session each of individual and group counseling services per week. He also received 12-month programming to support his academic needs. Nicki, the only female participant in the study, was 11 years 5 months old. She was diagnosed with emotional disturbance and also received 12-month programming. In addition to her academic supports, she received counseling services once a week in a group and once a week individually for 30 min.
The final pair was Ryan and Victor. Ryan was 10 years 9 months old at the time of the study. He was diagnosed with emotional disturbance, asthma, and ADHD, for which he took medicine. He was noted to have a history of theft and to display both verbal and physical aggression. At the time of the study, Ryan left his self-contained classroom for one period a week for both English language arts and math. He received counseling once a week and group counseling once a week. Victor, the sixth participant, was diagnosed with emotional disturbance and mood disorder. He received small group counseling services once per week for 30 min.
Materials
The book used as the textual source for our intervention, If You Lived With the Iroquois by Ellen Levine, was selected after consultation with the special education teacher. The book had a grade level equivalent of 4.5 and a Q guided reading level (Scholastic, n.d.). The special education teacher believed the students would have no difficulty decoding or understanding the book as they were on or near grade level in both reading fluency and comprehension. Furthermore, the special education teacher confirmed that the passages closely aligned with the social studies Native American content covered during the intervention. The book is organized into short topics approximately one to two pages long. Each topic contained one main idea with three to five short paragraphs that included key details about the topic. Topics were randomly selected and assigned to testing (baseline and post-test) or the intervention lessons.
For the intervention lessons, students were given a mnemonic chart (see Figure 1) and a simple graphic organizer for planning. The mnemonic, WIN, was a three-step strategy that encouraged the students to
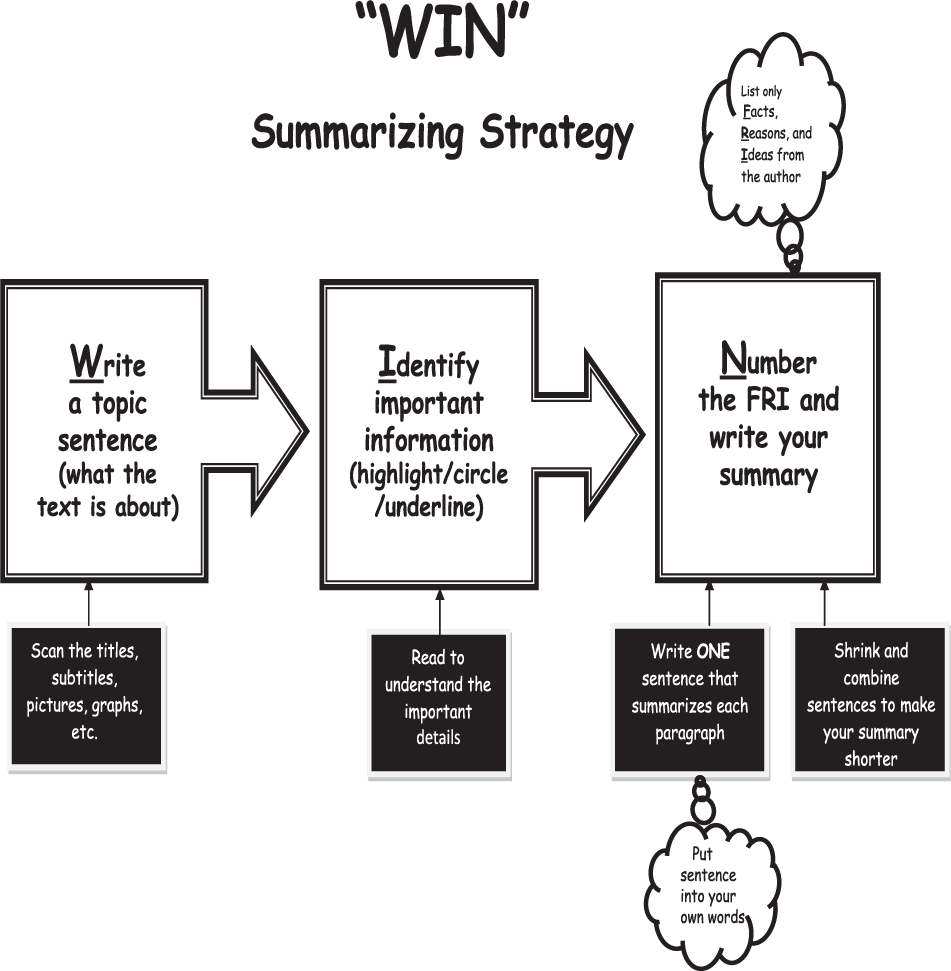
WIN mnemonic.
Procedures
Assessment and instruction occurred in an instructional space within the students’ school during the school day. The fourth author provided instruction to all three pairs of students after receiving extensive training and practice from the first author in implementing the experimental procedures. This instructor was a doctoral candidate at the time of the study. She was a former special education classroom teacher with more than 10 years of classroom teaching experience with students with disabilities, including students with EBDs.
The intervention consisted of three consecutive phases: baseline, treatment, and post-test. Baseline began on January 23, and the final post-test was given to the third group of writers on May 13. Although the intervention encompassed several months, at no point during the phases of this study did the students receive additional writing instruction in their classrooms aside from the writing activities in which they typically engaged, which consisted of journaling and other free-writing assignments. Furthermore, according to the special education teacher, the students had received no instruction in summarization, nor had they been exposed to any type of writing strategy instruction during the school year the study took place. Prior to the baseline phase, the authors met with all of the participants to thank them for participating and explain the intervention. This meeting served two purposes: (a) to enhance student commitment to the project and (b) to begin to establish rapport between the instructor and the student.
Baseline
During baseline, each student was asked to plan and write a minimum of three summaries to establish pre-treatment skill level. All student pairs wrote a single probe on the first day of baseline; then the first instructional pair of writers wrote two additional probes within 3 school days. To acquire the probes, the instructor read scripted directions, in which she directed the students to write summaries based on the passage they read. Students had 20 min to complete their summaries without assistance of any kind. Any written plans the students made in advance of or during composition were collected to document planning behaviors.
The remaining baseline probes for the second instructional pair were administered when the first pair entered the post-treatment phase. Similarly, the remaining baseline probes for the third pair were administered as the second pair entered post-treatment. For each pair of writers, instruction did not commence until a stable baseline for overall quality was demonstrated.
Treatment
The instructor worked for 30 to 40 min per day approximately 3 days a week with each pair of students outside of their classroom in a separate space within the school. Six lessons were taught to each pair. The lessons’ overall focus was to teach participants the characteristics of a written summary and the essential steps involved in creating an effective summary. Lessons followed the SRSD approach to strategy instruction, with initially high levels of instructor explanations, modeling, and guidance that were faded over time to allow for student independence with the strategy. Self-regulatory procedures common to SRSD instruction such as goal setting, self-monitoring, self-reinforcement, and generalization were embedded throughout the instruction (Graham & Harris, 2005). For example, goal setting was prompted by reminding the students that their summaries should include all of the elements of a good summary. Goal setting was practiced when the instructor prompted students to use WIN in their classroom. When the instructor finished writing, she self-monitored by checking her work against the Summary Characteristics Chart and made any necessary changes. Self-reinforcement was demonstrated by the instructor, stating phrases such as “We wrote a really good summary,” when her summaries met all the criteria of the Summary Characteristics Chart. Generalization of the strategy was prompted by asking the students how WIN could help them and where else they could use the strategy.
Lesson 1
During the first lesson, the instructor explained the purpose of summaries and discussed several characteristics of a good summary (they are shorter than the original and do not include all the details—only the important details; does not include your opinion or experiences; it only contains information from the reading, usually the facts or the ideas that the author writes; written with your own words, not words or sentences copied from the reading). She then introduced the importance of summary writing, saying that summarizing could help them understand and remember the important ideas from the reading. She told them that they were going to learn a strategy to help them remember how to write a good summary. Each letter of WIN was described one at a time, and the students practiced memorizing WIN orally and in writing. The WIN chart was kept out as a reference for the students in this and following lessons.
The instructor then read a short story with the students, and they wrote a summary together using WIN. While writing, the instructor provided specific prompting for each part of WIN. For example, for W, they needed to
The instructor then guided the students through the final step of WIN,
When the students completed the steps of WIN, they arranged the FRI into sentences. The instructor stated that they needed to “mostly use their own words” and that they needed to make sure to use all of the FRI they had noted. Next, they wrote a sentence for each paragraph of the original text together, checking off each FRI as it was used. Finally, to make the summary shorter, they scanned the composition to combine sentences as much as possible by eliminating non-essential words while still retaining all of the FRI and using appropriate connecting words.
After all of the sentences had been revised, the students used the Summary Characteristics Chart to verify that they included all of the features of a good summary. A discussion of how WIN helped the process of writing the summary followed, and the instructor emphasized that WIN could help them remember the steps to follow to write a summary. She reinforced the concept of generalization by asking where else the WIN strategy may be used. She suggested that WIN could be used for anything that they read in any class. They brainstormed a list of things that the students read together and how WIN could help with those readings, and they created a goal to use WIN in other classes or for other reading and writing tasks.
Lessons 2 and 3
These lessons were devoted to scaffolded practice writing summaries using WIN with the instructor gradually fading her support. At the beginning of these and all subsequent lessons, the students were asked to write out what each part of WIN stood for, and the instructor asked them whether and how they used WIN in their other classes. Next, another summary was written following the same process as in the first lesson; however, this time the instructor provided less help, letting the students direct the process as much as possible. Students wrote their own summary with the instructor providing feedback and encouragement as needed. After the summaries were completed, students checked them against the Summary Characteristics Chart to verify that all of the features of a good summary were included. The lesson ended by reviewing the purpose of WIN and encouraging the use of WIN for other assignments.
Lesson 4
In this lesson, another summary was written but without the WIN chart; instead, the instructor directed the students to write the mnemonic on the blank piece of paper they were using to write the summary. Students wrote their own summary with less support from the instructor. After the summaries were completed, they again checked the summaries against the Summary Characteristics Chart to verify that all of the features of a good summary were included, reviewed the purpose of WIN, and were encouraged to use WIN for other assignments.
Lessons 5 and 6
These lessons followed the exact same procedures as Lesson 4; however, even less instructor support was provided. The goal of Lesson 5 was to ensure the students could perform all steps of the strategy to write a summary with little or no prompting or support. In Lesson 6, no instructor support was provided.
Post-test
The day after instruction had been completed, students began the post-test phase. In this phase, students wrote three summaries under the same conditions as baseline. Upon entering the post-test phase, each pair completed the probes over a 1-week period.
Scoring procedures
Students were assessed on overall quality of the summary using a researcher-created rubric, developed in consultation with the special education teacher and written to reflect grade level standards. Categories included main ideas, supporting details, organization, conclusion, mechanics and grammar, and paraphrasing. Students could score a maximum of 17 points on the rubric. The second author scored each of the samples for overall quality using the rubric. In addition, a doctoral student in educational psychology who was unfamiliar with project goals scored one third of the samples to establish reliability. Scoring training was provided by the first author and consisted of an orientation to the rubric followed by a scoring session to develop reliability. Scoring reliability was calculated by dividing agreements by total number of writing samples. Inter-rater reliability was calculated as 79% for exact agreement and 100% for agreement within 1 point.
Treatment Fidelity
Two steps were practiced to assess treatment fidelity. First, the instructor followed lesson plans to ensure that the lessons were delivered the same way to each pair of students. Second, each of the sessions was tape-recorded, and one third of the tapes were randomly selected for review by a graduate student in educational psychology who listened with a copy of the lesson plan, checking each step off as it was completed. The review indicated that 90% of the steps (113 out of 125 total steps) were followed with precision, while other steps were followed but required slight modifications due to behavioral issues. These modifications included restating directions, redirecting statements, and applying motivational statements.
Experimental Design and Data Analysis
A multiple-baseline across-participants single-case design (Gast, 2010) was selected to document changes in participants’ skills from baseline to post-test. This method was selected because it has been used effectively in previous single-subject studies teaching writing to students with EBDs (e.g., Mastropieri et al., 2009). Data analyses followed the What Works Clearinghouse (WWC) single-case design guidelines for evaluating intervention effects (Kratochwill et al., 2010). First, visual analyses were conducted to determine whether there was a functional relation between the independent variable (i.e., treatment, “WIN”) and the dependent variable (i.e., outcome score, “quality points”). Second, if evidence for a functional effect was present, we proceeded to estimate the effect sizes using quantitative methods.
Visual analyses
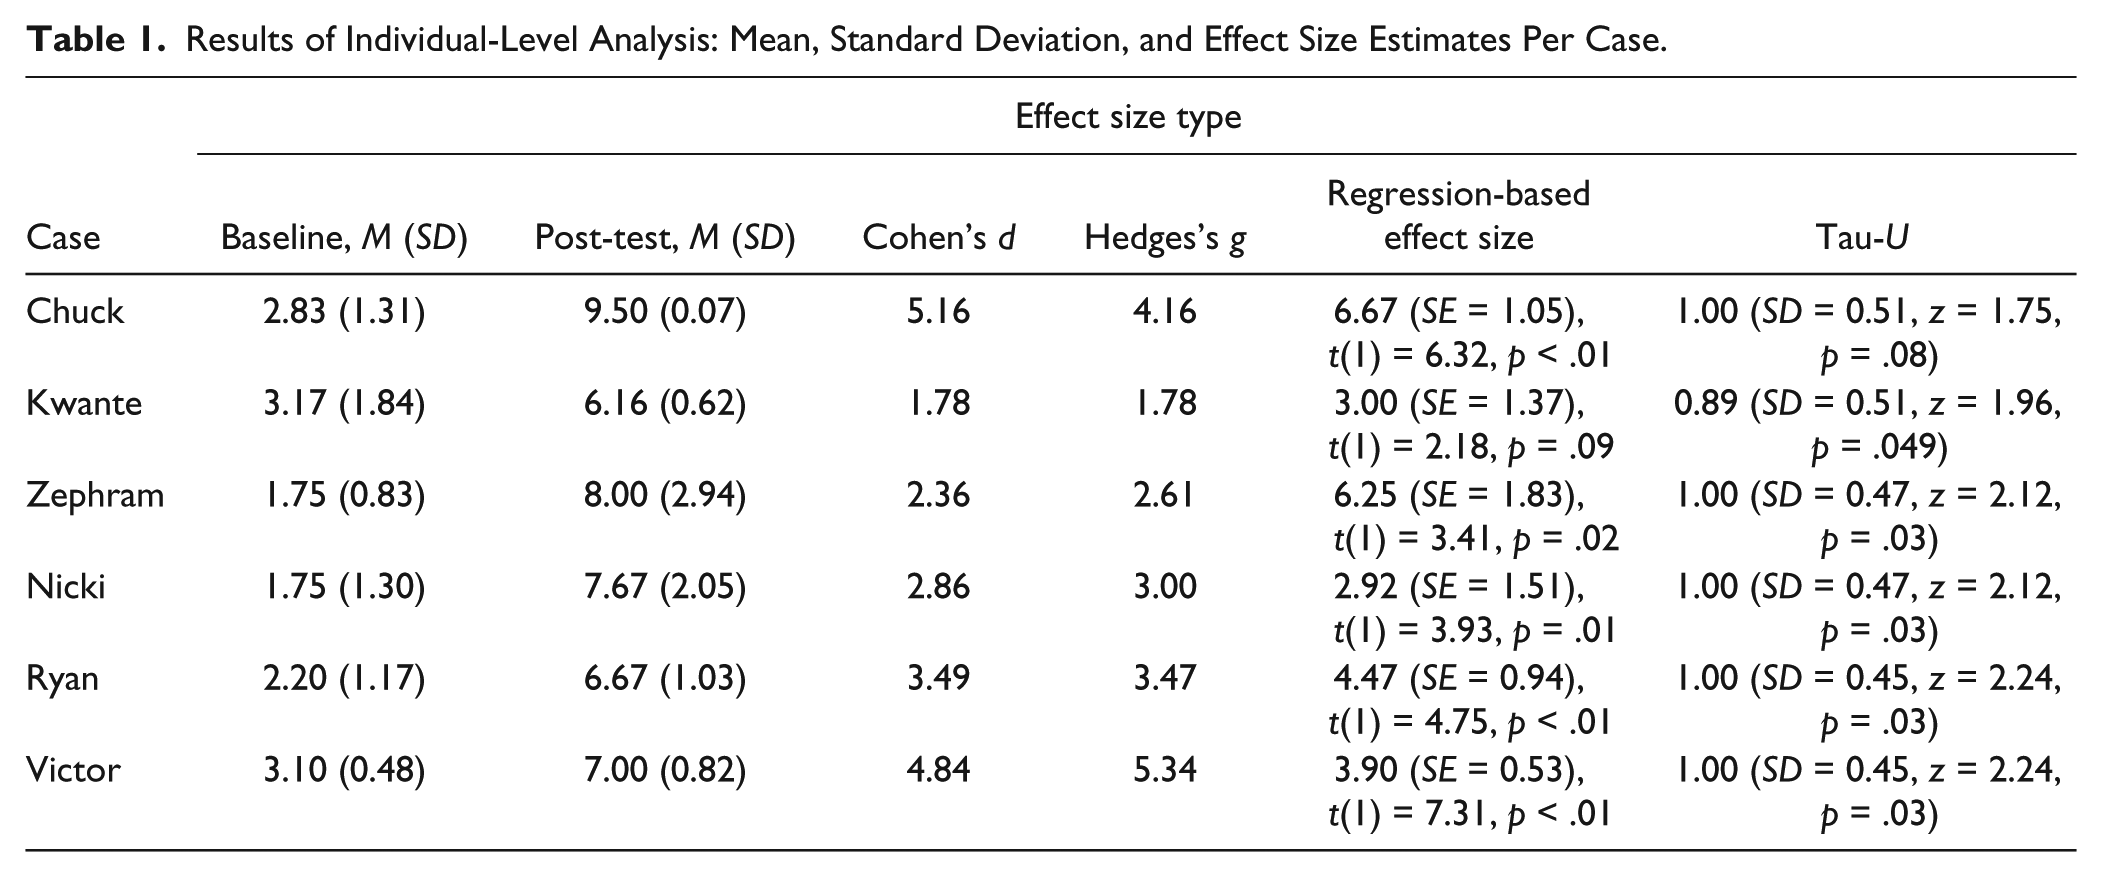
First, we examined the level, trend, and stability of the data within each phase (i.e., within-phase data examination). We evaluated within-phase stability by calculating the percentage of data points within 15% of the phase median. Neuman and McCormick (1995) indicated that this should be about 85% (80%–90%). Second, we examined the immediacy of effect, consistency of data patterns, and overlap of data between baseline and post-treatment phases (i.e., between-phase comparisons) using percentage of treatment data points exceeding the median of the baseline (PEM) and the percentage of non-overlapping data (PND). We examined between-phase changes in level by evaluating the relative, absolute, median, and mean level change (J. D. Lane & Gast, 2014). Three demonstrations of an intervention effect were necessary for establishing a functional relation (Kratochwill et al., 2010). Table 1 displays the means and standard deviation for each participant at baseline and post-intervention.
Results of Individual-Level Analysis: Mean, Standard Deviation, and Effect Size Estimates Per Case.
Quantitative analyses
If the visual analysis indicated a functional relationship, we proceeded with quantitative analyses. First, we estimated effect sizes per participant (individual-level analysis) and continued with combining effect sizes across cases to achieve an overall average effect sizes estimate (across-case effect size). We conducted all statistical analyses using SAS 9.4 (SAS Institute Inc., 2011–2014) and used a significance level of .05 for all statistical tests.
Individual-level analysis
The WWC standards strongly recommend conducting sensitivity analysis and reporting multiple effect size estimators believing that results are more credible if consistency across different effect size estimators is identified (Kratochwill et al., 2010). Effect sizes calculated in this study were as follows: (a) standardized mean difference: Cohen’s d, (b) standardized mean difference with correction for small sample sizes: Hedges’s g, (c) a non-parametric index of the non-overlap minus overlap and that allows for the control of baseline trends: Tau-U (Parker, Vannest, & Davis, 2014) and the regression-based approach (Van den Noortgate & Onghena, 2003a, 2003b), which has the most potential and is strongly recommended by the WWC standards to be reported (Kratochwill et al., 2010).
Across-case effect sizes
We calculated Tau-U for each participant and a weighted, across-case Tau-U using an online calculator (Vannest, Parker, & Gonen, 2011; http://www.singlecaseresearch.org/calculators/tau-u). The Tau-U should be implemented across cases because it is a non-parametric effect size, and Parker and Vannest (2009) provided tentative guidelines for interpreting the Nonoverlap of All Pairs statistic, which can be transformed into Tau-U (Parker et al., 2014). Effect sizes from 0 to .31 are small, from .32 to .84 are medium, and from .85 to 1.0 are large (Parker & Vannest, 2009).
We also used multilevel modeling to estimate the effects of WIN across cases. Multilevel modeling is recommended by the WWC standards because it takes the hierarchical nature of multiple-baseline designs into account. After checking the tenability of regression assumptions prior to the analyses, we used the multilevel model suggested by Van den Noortgate and Onghena (2003a, 2003b, 2008) to estimate (a) the overall average effect of WIN across participants without losing information about the individual cases and (b) the within- and between-participant variability. Using a multiple-baseline design across six participants with six measurement occasions provided sufficient power (>.80) to detect large treatment effects (see Ferron, Moeyaert, Van Den Noortgate, & Beretvas, 2014).
In addition, we estimated the HPS, or single-case educational design (SCED)–specific mean difference index, developed by Hedges, Pustejovsky, and Shadish (2012, 2013) as a standardized mean difference index specifically designed for SCED data, with the aim of making it comparable with Cohen’s d of group-comparison designs. The standard deviation takes into account both within- and between-participants variability (and so is applied to get an across-case estimator for a standardized change in level). The advantage of using the HPS across-case effect size estimator is that is directly comparable with Cohen’s d for group-comparison research, and as a consequence, the Cohen’s (1992) benchmarks can be used.
Results
Visual Analysis
Chuck
As shown in the first panel of Figure 2, Chuck’s performance during baseline was low with a slightly decreasing trend in baseline performance. His performance was relatively stable (i.e., 2 out of the 3 data points fall within ±15% of the phase median). Chuck’s performance during the post-intervention phase increased in level. His performance was stable (i.e., all data points fell within ±15% of the phase median), and there was no clear upward or downward trend. The observed between-phase change in performance was immediate and consistent (e.g., median level change = 6.5). There was little overlap of the data between the two phases: The PEM and the PND was 100% (i.e., PEM = 1 and PND = 1). These results give evidence for a functional relation between the treatment program and quality points.
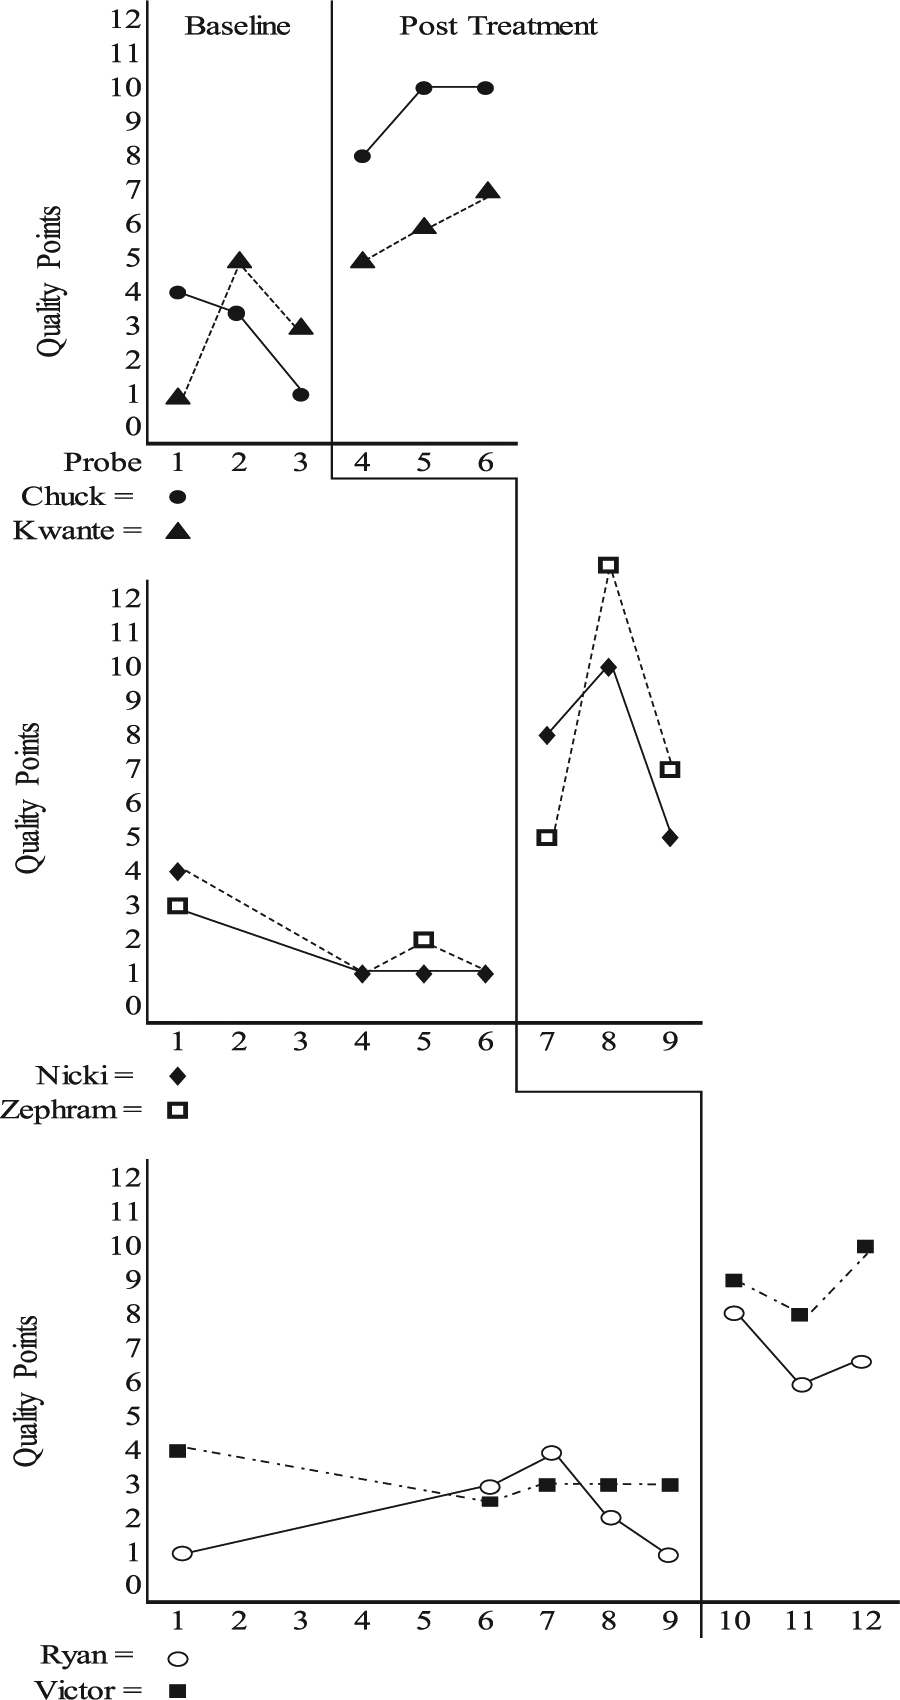
Overall quality of summaries.
Kwante
As shown in the first panel of Figure 2, Kwante’s performance during baseline was low with the negative slope, indicating that the performance for Kwante was getting worse across time. His baseline was not stable (i.e., 2 out of the 3 data points fall outside ±20% of the phase median); however, this is not a problem because this was due to a downward trend in the opposite direction of the expected change in outcome score based on the intervention. The WWC clearly states that the slope during the baseline should be zero or in the opposite direction of the expected change. Kwante’s performance during the post-intervention phase increased in level. There was a slightly positive upward trend that indicates that the effect of the intervention improved across time, and his performance was stable (i.e., all data points fell within ±15% of the phase median). The observed between-phase change in performance was immediate and consistent (e.g., median level change = 6.5). There was very little overlap of the data between the two phases: PEM = 1 and PND = .67. These results give evidence for a functional relation between the treatment program and quality points.
Zephram
Zephram’s performance during baseline was low, and there was a slightly decreasing trend in baseline performance. His performance during the post-intervention phase increased in level, and there was no clear upward or downward trend. His performance was relatively stable (i.e., 2 out of the 3 data points fell within ±15% of the phase median), and the observed between-phase change in performance was immediate and consistent (e.g., median level change = 5.5). There was no overlap of the data between the two phases: PEM = 1 and PND = 1, which gives evidence for a functional relation between the treatment program and quality.
Nicki
Nicki’s baseline and post-treatment performance was very similar to that of Zephram. Her performance during baseline was low with a slightly negative trend and was relatively stable (3 out of the 4 data points fell within ±15% of the phase median). Nicki’s performance during the post-intervention phase increased in level, and there was no clear upward or downward trend. Her performance was relatively stable (i.e., 2 out of the 3 data points fell within ±15% of the phase median), and the observed between-phase change in performance was immediate and consistent (e.g., median level change = 7). There was no overlap of the data between the two phases: PEM = 1 and PND = 1. These results give evidence for a functional relation between the treatment program and quality points.
Ryan
Similar to the previously discussed participants, a low baseline performance was identified for Ryan. No upward or downward trend was observed, and the baseline was relatively stable. The post-intervention performance was high and stable (all data points fell within ±15% of the phase median). The observed between-phase change in performance was immediate and consistent (e.g., median level change = 4.5). There was no overlap of the data between the two phases: PEM = 1 and PND = 1. These results give evidence for a functional relation between the treatment program and quality points.
Victor
Victor’s performance prior to intervention was low and stable (all data points fell within ±15% of the phase median) with no upward or downward trends. The post-treatment performance was in line with the performance of the other participants, and all data points fell within ±15% of the phase median. The observed between-phase change in performance was immediate and consistent (e.g., median level change = 4.5). There was no overlap of the data between the two phases: PEM = 1 and PND = 1. These results give evidence for a functional relation between the treatment program and quality points.
Quantitative Analysis
Individual-level analysis
As discussed in the “Individual-Level Analysis” section, a sensitivity analysis was conducted to enhance the scientific credibility of the findings. Table 1 displays the effect size estimates per participant and estimator (i.e., Cohen’s d, Hedges’s g, Tau-U, and the regression-based approach). The effect size estimates per participant are consistent and confirm each other, giving confidence in the research findings. For all participants, very large effect size estimates for Cohen’s d (range = 1.78–5.16) and Hedges’s g (range = 1.78–5.34) were obtained. A value larger than 0.80 is considered to be large (Cohen, 1992). For all participants except for Kwante, a Tau-U of 1 was obtained (which is the maximum). For Kwante, the Tau-U equals .89, which exceeds .85, so that also supports evidence for a large intervention effect for Kwante (Parker & Vannest, 2009). Finally, the regression-based approach indicated statistically significant changes in level for all participants except from Kwante: 3.00, SE = 1.37, t(1) = 2.18, p = .09. However, the p value is close to the significance level of .05 and as a consequence is marginally statistically significant. In sum, we found strong evidence for a functional relation between the intervention and change in outcome and can conclude that the intervention is highly effective.
Across-case analysis
The weighted Tau-U (the non-parametric statistic) across the six participants is statistically significant and equals .96 (SD = 0.20, z = 5.09, p ≤ .01). This gives evidence for a highly effective intervention as this value is close to the maximum value of 1. In addition, all values larger than .85 give evidence for a highly effective intervention effect.
The results of the two-level hierarchical linear model indicate that the initial baseline level across the six participants equals 2.43 quality points, SE = 0.32, t(35) = 7.55, p < .001. The intervention caused a statistically significant and large increase in quality points across all participants: An increase of 5.06 quality points is obtained, SE = 0.58, t(10.2) = 8.71, p < .001, and this is in line with the findings of Tau-U and the HPS. An additional advantage of the multilevel model is that the between-case variability in treatment effect can be estimated. This is an important indicator, as it can be the case that an overall average effective intervention effect is found but that there is a lot of variability in the effectiveness between participants (which means that for some participants, the treatment is highly effective, but for some, it is not). We found a non-statistical significant variability in treatment effect between cases: s2 = 0.57 (SE = 0.91, z = 0.62, p = .27), which indicates that the treatment is effective for all participants.
We also estimated the HPS or SCED-specific mean difference index (Hedges et al., 2012, 2013). We found a very large effect size: An increase of 2.91 (SE = 0.22) standard deviations. The raw index (+5.03) suggests an average increase of more than 5 quality points due to the intervention, which indicates a highly effective intervention.
Discussion
In this project, six students with EBDs who struggled with writing were taught how to create written summaries using a mnemonic-based strategy. The intervention improved the overall quality from baseline to post-treatment for all six students as measured by our rubric with large effect size estimates from Cohen’s d (range = 1.78–5.16) and Hedges’s g (range = 1.78–5.34) obtained across all participants.
Anecdotal evidence collected by the instructor suggested the students understood the purpose of the strategy and could independently recall the steps of the mnemonic by the end of the intervention. Furthermore, whereas none of the writers overtly planned at baseline, each student engaged in planning at post-treatment by writing the mnemonic on their papers; we believed even this limited example of planning to be a positive finding, given that students with EBDs often do not create plans in advance of writing (Little et al., 2010).
To enhance the visual and quantitative analyses, we also examined the pre- to post-differences for the six elements of our rubric, discovering that scores were greater for all students in main ideas, details, and mechanics and grammar at post-test. All students except Kwante and Victor displayed improved scores for organization. Similarly, all students but Kwante improved their scores for paraphrasing at post-test. However, only Chuck and Zephram were able to write a strong concluding statement. Though disappointing, this was not unexpected because it was not the primary focus of the strategy.
A reading of the students’ post-treatment products seemed to support the rubric scores as the post-treatment compositions included more of the characteristics of typical summaries (e.g., inclusion of important details from the passage, paraphrasing of original text) than the baseline samples, which read more like stories or personal narratives about the passages. For example, at baseline, a student wrote the following response to a passage about Iroquois use of longhouses: I live with my mom in my long house and my brothers and my sister. but it is a lot of people in there long house. In mines there is my mom brothers sister my my boyfriend thats it.
This response was not surprising, as summary writing is a different task than students are accustomed to (Westby et al., 2010), and if a writer is not explicitly taught how to write a summary, they may not be successful (Frey et al., 2003). However, after learning the intervention, the same student, in response to a passage about naming children, wrote the following at post-test: The Iroquois had special ceremonies naming you. Naming was a very special event. The different clans in different nations owned collections of names handed down through the generations. These ceremonies were performed twice a year in two events. The end.
While some of the ideas were copied, the student did rearrange the text and put the ideas into his own words. He also had a solid main idea statement and included the important details from the text. Therefore, although the summaries were slightly underdeveloped, they were a substantial improvement from baseline.
Although the overall findings of this study indicated a very effective treatment, we believe there were several barriers to strategy acquisition that prevented stronger results. Most notably, several of the students faced considerable difficulty throughout the intervention with personal issues unrelated to the intervention. For example, the instructor noted behavioral concerns and lack of motivation to engage in the task as significant barriers to strategy acquisition. Students often were not engaged in the task and required frequent redirection to attend. This trend was also observed in previous research, which found that students with EBDs often exhibit lower levels of on-task behavior (Mastropieri et al., 2009). Lack of motivation to write, another barrier to strategy acquisition, was not surprising, given that students with EBDs often lack the intrinsic motivation to persevere through difficult tasks such as writing (Adkins & Gavins, 2012). Although we incorporated the reinforcement system that was effective in the special education teachers’ classroom, in this case, the external reinforcers were not strong enough to motivate the participants for the writing tasks. In the first post-test, for example, Zephram produced only two sentences earning a score of 5, yet he was able to state all of the important elements of a summary. In this case, the instructor noted that he lacked the motivation to complete the task.
Absences and suspensions were another barrier. All students evidenced poor attendance, missing on average 4 days during the study, resulting in an extended intervention to accommodate these absences, because pairs of writers needed to work together. Therefore, although the study was meant to be short and minimally intrusive, the absences forced the time spent in the school to be longer than we originally planned. For example, the intervention was designed to be taught over six lessons, which we planned to teach every other day over 2 consecutive weeks. However, due to absences, the first pair of writers took 3 weeks to finish the intervention, while the second and third pairs took 4 weeks. This finding is supported by previous research (Mastropieri et al., 2009), which reported that students with EBDs required more lengthy intervention periods to be successful academically.
Limitations and Future Research
There are several limitations of this study that are important for future researchers and practitioners to consider. First, as with most single-case research, there were only six participants in this study; therefore, generalization of results must be considered carefully. Second, the majority of the participants were males, and all students were African American. Given the diverse nature of students with EBDs, future research should explore the use of this strategy with a more diverse sample of students with EBDs.
Third, although the students were able to memorize the steps of WIN, and were generally successful in creating a topic sentence and identifying the important information, the mnemonic did not elaborate on the “stylistic” elements of composing that may have improved overall quality, such as opening and concluding sentences and transition words. Future research should include these additional elements within an expanded strategy.
Fourth, while this study measured the quality of written summaries, writing a summary may also affect other academic areas, most notably reading comprehension. Therefore, teachers and future researchers should consider utilizing other measures, such as reading comprehension outcomes, along with overall writing quality. Finally, we could not collect maintenance data. Future research must address the durability of the intervention over time.
Implications
Results provided several interesting educational implications. First, despite being only six lessons, the intervention was able to improve writing behaviors such as planning, while also helping students develop an awareness of the typical structure and key elements of written summaries. This result suggests that even minimal strategy instruction can improve student writing. However, we believe that students may have benefitted even more from the intervention if provided increased opportunities to practice writing summaries. Therefore, teachers may consider implementing the intervention over a longer period of time throughout the school year. Teachers could also improve the generalization of the strategy by utilizing WIN across other content areas, such as science.
Second, the nature of the students’ disability led to some social and behavioral difficulties throughout the course of the intervention. Even though we followed the special education teachers’ behavioral system during the sessions, the system was not potent enough to reduce inappropriate behaviors that interfered with writing and strategy acquisition. Writing can be a difficult task even under the best circumstances, and even for students who enjoy composing. For students who struggle with the skills of writing or with the will to persevere through the challenges of writing, teachers will need to include motivational reinforcements and behavioral supports that may help students engage more fully with the tasks, hopefully resulting in better overall writing outcomes.
Footnotes
Declaration of Conflicting Interests
The author(s) declared no potential conflicts of interest with respect to the research, authorship, and/or publication of this article.
Funding
The author(s) received no financial support for the research, authorship, and/or publication of this article.