
Abstract
To prevent academic failure and promote long-term success, response-to-intervention (RtI) is designed to systematically increase the intensity of delivering research-based interventions. Interventions within an RtI framework must not only be effective but also be implemented with treatment fidelity and delivered with the appropriate level of treatment intensity to improve student mathematics achievement. The purpose of this systematic review was to explore the mathematics intervention research for students at risk of mathematics failure by examining intervention characteristics related to treatment fidelity and intensity. Results from 66 math intervention studies conducted from 2004 to 2015 were summarized. The majority of studies monitored treatment fidelity and provided details of some aspects of treatment intensity (i.e., dose, group size). However, interventionists’ characteristics, implementation characteristics, and treatment design were less frequently reviewed. Implications for future research and educational practices are discussed.
Response-to-intervention (RtI) is a three-tiered problem-solving, student-centered framework that entails (a) high-quality classroom instruction, (b) universal screening, (c) research-based interventions delivered with fidelity based on student need, and (d) continuous progress monitoring (Bradley, Danielson, & Doolittle, 2005; D. Fuchs & Fuchs, 2006). The primary prevention level of RtI, or Tier 1, includes core classwide instruction for all students with meeting the instructional need of at least 80% of students (Mellard, McKnight, & Jordan, 2010; Stoiber, 2014). Tier 2, or the secondary prevention level, includes targeted academic interventions that supplement Tier 1 instruction for students who are at risk of difficulties (Mellard et al., 2010; Stoiber, 2014). Finally, Tier 3, or the tertiary prevention level, includes individualized, intensive instruction for students who do not respond to Tier 2 services and require instruction from a specialized educator (Mellard et al., 2010).
RtI research-based guidelines (e.g., Institute of Education Sciences [IES] Practice Guide) for practitioners delivering reading interventions provide relatively clear and consistent recommendations (e.g., Berkeley, Bender, Gregg Peaster, & Saunders, 2009; D. Fuchs & Fuchs, 2006; L. S. Fuchs & Vaughn, 2012). However, there is less consistency among recommendations for mathematics interventions within an RtI framework (i.e., Bryant et al., 2008; L. S. Fuchs, Fuchs, et al., 2008; Gersten, Beckmann, et al., 2009). This presents a major concern considering that nationwide, majority of students (i.e., 60% Grade 4 students, 77% of Grade 8 students) are failing to meet proficient levels in the area of mathematics (National Center for Education Statistics, 2016). These statistics suggest that core mathematics instruction is not meeting the needs of at least 80% to 90% of students (Stoiber, 2014). In addition, core mathematics instruction should be effectively designed and delivered to all students to not only promote student math achievement but also prevent and reduce the number of students at risk of math difficulties (Doabler et al., 2016).
The IES Practice Guide (Gersten, Beckmann, et al., 2009) provides eight recommendations for practitioners delivering math interventions within an RtI framework for students at risk of math failure:
universal screening;
whole number interventions for students in kindergarten to Grade 5 and rational number interventions for students in Grades 4 through 8;
math interventions that include problem solving, guided practice, and corrective feedback;
word problems;
opportunities to practice using visual representations;
10 min targeting math fact fluency during the intervention;
continuous progress monitoring; and
strategies to motivate students.
Notably, only two of eight recommendations (i.e., universal screening, progress monitoring) for mathematics are aligned with strong empirical support (Gersten, Beckmann, et al., 2009). That is, consensus exists among Tier 1 recommendations requiring high-quality instruction and universal screening for all students to identify those at risk of future mathematics failure (Bryant et al., 2008; Clarke et al., 2014; L. S. Fuchs, Fuchs, et al., 2008; L. S. Fuchs, Seethaler, et al., 2008; Gersten, Beckmann, et al., 2009; Hunt, 2014). Inconsistencies exist, however, among Tier 2 recommendations.
The IES RtI Mathematics Practice Guide (Gersten, Beckmann, et al., 2009) suggests that students at a Tier 2 level should receive supplemental, small-group interventions to build targeted mathematics skills, with specific dose parameters (i.e., 20–40 min, 4–5 times each week) and group size ratios. Although researchers are in agreement with these general principles, there are conflicting guidelines around students served, intervention dosage, and group size. In some cases, student identification for Tier 2 interventions is described based on screening data, whereas other researchers provide specific criteria for Tier 2 (i.e., 10th to 25th percentile; Burns, Kanive, & DeGrande, 2012; L. S. Fuchs, Fuchs, et al., 2008). In addition, varied recommendations for Tier 2 interventions include (a) small-group tutoring with undefined dosage or specific group size, (b) 20 to 40 min of small-group instruction 4 to 5 times a week for 18 to 23 weeks, and (c) 20 to 30 min of individual tutoring 3 times a week for 12 weeks (L. S. Fuchs, Fuchs, et al., 2008; L. S. Fuchs, Seethaler, et al., 2008; Hunt, 2014). This lack of consensus presents significant implications and uncertainty for school-based practitioners consulting the literature (i.e., guidelines, research) on how to deliver Tier 2 or research-based math interventions for students at risk of math difficulties.
Treatment Intensity
How an intervention is designed and delivered is referred to as treatment intensity (Codding & Lane, 2015). Historically, research has focused solely on intervention effectiveness, and there has been a paucity of research attending to how to define and describe treatment intensity (Barnett, Daly, Jones, & Lentz, 2004; Codding & Lane, 2015; Mellard et al., 2010; Warren, Fey, & Yoder, 2007; Yoder & Woynaroski, 2015), despite the need for school personnel to consider treatment intensity when students are not responding at desired levels within an RtI framework (Codding & Lane, 2015). Unfortunately, there is a lack of agreement on how to conceptualize and examine the construct (Barnett et al., 2004; Mellard et al., 2010; Warren et al., 2007). Traditionally, researchers define treatment intensity solely by treatment dosage, a term and conceptualization adapted from the medical model (Yoder & Woynaroski, 2015). However, within an RtI framework, intensity tends to be a broader umbrella term under which treatment dosage represents one aspect. Dosage might be better represented within RtI by the phrase “treatment strength,” which involves increasing the (a) dose, or the number of teaching episodes delivered per session, length of intervention sessions, and distribution of episodes over the session; (b) dose frequency, or the number of sessions offered per day/week/month; (c) total treatment duration, or the number of days, weeks, or months over which treatment is offered; and (d) dose form, or the physical form in which the active ingredient is dispensed, may be adjusted in terms of the group size, or implementer-to-student ratio.
Treatment intensity might also encompass treatment complexity and treatment expense (Codding & Lane, 2015; Yeaton & Sechrest, 1981). Each of these elements addresses important implementation considerations that, if reported, may help to bridge the research to practice gap often noted in literature. Plenty of evidence suggests that interventions themselves serve as a substantial barrier to implementation (e.g., Long et al., 2016; Spectrum K–12, American Association of School Administrators, Council of Administrators of Special Education, National Association of State Directors of Special Education, & State Title 1 Directors, 2010). Teachers have described notable challenges as (a) compatibility with typical classroom routines, (b) time and training required, and (c) materials needed. Treatment complexity includes the number and type of treatment components, goal specificity, and pace of instruction (Barnett et al., 2004; Mellard et al., 2010). Treatment expense includes (a) intervention expertise; (b) intervention management, planning, and training; (c) materials required; and (d) deviation from classroom routines (Barnett et al., 2004; Mellard et al., 2010; Yoder & Woynaroski, 2015).
Overall, researchers agree that treatment intensity, or in what form does the intervention work best, is a crucial component to consider when delivering interventions (Codding & Lane, 2015; Yoder & Woynaroski, 2015). However, there is a lack of consensus on how to conceptualize treatment intensity within the field of education. We propose that treatment intensity is an umbrella term that includes treatment strength (Yeaton & Sechrest, 1981), treatment complexity (Yoder & Woynaroski, 2015), and treatment expense (Yoder & Woynaroski, 2015). In addition to defining and describing treatment intensity, it is also important to ensure that treatment fidelity in assessed (Yeaton & Sechrest, 1981).
Treatment Fidelity
Once the intervention is sufficiently defined (per treatment intensity), the extent to which that intervention is implemented as intended (i.e., treatment fidelity) must be evaluated. Beyond the importance of adequate treatment fidelity for facilitating efficient improvements in student outcomes (e.g., DiGennaro Reed, Reed, Baez, & Maguire, 2011), monitoring treatment fidelity is critical to ensure that intervention outcomes and related conclusions are not due to extraneous variables (Sanetti & Kratochwill, 2009). Although the importance of treatment fidelity is clear, it is inconsistently assessed across domains in education research (Hill, King, Lemons, & Partanen, 2012; O’Donnell, 2008; E. Swanson, Wanzek, Haring, Ciullo, & McCulley, 2013). A review of general and special education journals with high impact factors (range = 1.717–3.259) found that approximately 65% of articles included some information on treatment fidelity (E. Swanson et al., 2013). Specifically targeting general education literature, O’Donnell (2008) examined the relationship between treatment fidelity of kindergarten through Grade 12 (K–12) core curricula. With respect to treatment fidelity, the K–12 core curriculum intervention literature lags behind the public and mental health fields with fewer than 25% of studies reviewed including evaluation criteria to measure treatment outcomes and treatment fidelity (O’Donnell, 2008). A review of RtI reading intervention literature found that 77% of studies reported some information on treatment fidelity (Hill et al., 2012). Despite knowledge of the importance of monitoring treatment fidelity, to date, there are no systematic reviews examining its inclusion in the mathematics intervention literature.
Purpose of Study
Interventions delivered within an RtI framework must not only be effective but also be delivered with the appropriate level of treatment intensity and implemented with treatment fidelity to prevent academic failure and promote long-term success (L. S. Fuchs, Fuchs, et al., 2008). Documentation of the treatment intensity and treatment fidelity that math interventions for students at risk are delivered in research can help to define the implementation of these interventions in practice and for further research replication. Furthermore, documentation of these constructs can inform research (e.g., Bryant et al., 2008; L. S. Fuchs, Fuchs, et al., 2008) and practice guides (Gersten, Beckmann et al., 2009) for delivery of mathematics interventions to students at risk within RtI. Despite this importance, treatment intensity and treatment fidelity are understudied (Codding & Lane, 2015; DiGennaro Reed & Codding, 2014; Sanetti & Kratochwill, 2009). The purpose of this systematic review is to document dimensions of treatment intensity and treatment fidelity in mathematics interventions for students at risk of math failure.
Method
Identification of Articles
Systematic searches
To ensure that all relevant studies evaluating mathematics interventions targeting students at risk of math failure were included, we conducted three systematic searches (see Figure 1). The first search targeted articles published between the years 2004 and 2015. Based on a previous systematic review of Tier 2 reading interventions (Hill et al., 2012), we initially included a total of 17 special education, school psychology, and educational journals in the search. The search was conducted in PsycINFO and EBSCOhost databases using the terms math and intervention in addition to additional specifying terms Tier 2 or supplemental. A total of 313 articles were identified. The second search included articles from years 2004 to 2015 in the same databases using the phrase math intervention without any limits on the journal name. This search produced 376 articles. The third search examined math intervention websites (e.g., What Works Clearinghouse Practice Guide, interventioncentral.org, National Center for Intensive Interventions) through which an additional 52 articles were identified. Across all three searches, a total of 741 articles were identified (see Table A1 in the Online Appendix).
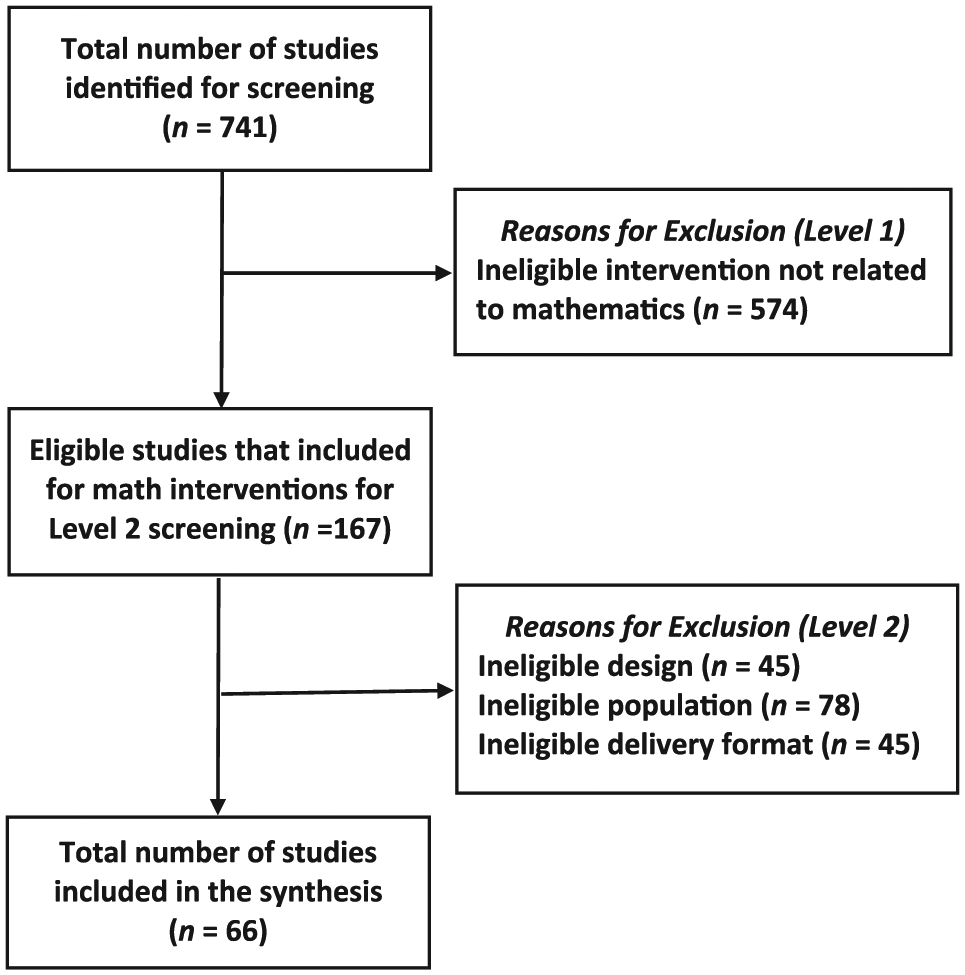
Schematic overview of search procedures with reasons for exclusion of studies.
Inclusion criteria
Articles were screened through two levels of systematic inclusion criteria. The first level required that the independent variable was a mathematics intervention. Of the 741 studies found in the search, 167 (22.5%) met this criterion and were included in the second screening. The second level required the study to include (a) an experimental or quasi-experimental design, (b) participating students identified as at risk of mathematics difficulties but without explicitly stating a specific mathematics disability (e.g., learning disability for math, specific math disability), and (c) intervention delivery that was provided individually or in a small-group format. Sixty-six studies (39.5%) met all three requirements (see Figure 1 for details and Online Appendix B for a complete list of the studies).
Coding
Based on previous reviews (e.g., Hill et al., 2012; Sanetti, Gritter, & Dobey, 2011) and the RtI, treatment intensity, and treatment fidelity literature (Codding & Lane, 2015; D. Fuchs & Fuchs, 2006; L. S. Fuchs & Vaughn, 2012; Sanetti & Kratochwill, 2009), we developed a coding manual with 57 variables related to study, student, intervention, treatment intensity, and treatment fidelity characteristics.
Study Characteristics
For each study, coders documented the year of publication, journal name, and type of experimental design. Specifically, the coders categorized the type of experimental design as (a) group design, (b) withdrawal design (applied behavior analysis [ABA], ABAB), (c) multiple baseline design, (d) alternating treatments design, (e) changing criterion design, or (f) other.
Student Characteristics
Coders reviewed participant demographics. To do so, coders documented the number of participants as total number participated and noted the age of participants as specific age. Coders documented the stated criterion for students at risk as (a) below 15th percentile, (b) below 25th percentile, (c) below 35th percentile, (d) below 50th percentile, (e) student did not respond to previous intervention, or (f) no explicit criteria. They coded grade of participants as (a) preschool, (b) elementary (K–5), (c) middle (Grades 6–8), or (d) high (Grades 9–12). In addition, they coded students’ instructional placement as (a) general education or full inclusion, (b) self-contained classroom, or (c) general education with supports. To be included in this review, students needed to be indicated by the study as at risk in math, but not have a math disability. Specifically, the study authors needed to label, or refer to, the students as at risk of math failure through the article. However, students with other disability statuses (e.g., attention deficit hyperactivity disorder [ADHD]) were included. Coders noted race/ethnicity as (a) Latino, (b) African African, (c) Caucasian, (d) Asian, (e) Multiracial, (f) American Indian, or (g) Other. Also, they coded participant gender as male or female. More than one code could be selected for grade, instructional placement, race, and gender.
Intervention Characteristics
Coders documented the math intervention for various characteristics and were able to select all that applied. Tiered level of support was reported as (a) Tier 1, (b) Tier 2, (c) Tier 3, or (d) level not reported. These levels needed to be explicitly stated to be coded for the tiered level of support. The intervention target skill was coded as (a) early numeracy, numerosity, or number sense; (b) math calculations, number combinations, or computation; (c) math reasoning; (d) word problem solving; (e) fractions; (f) algebra; (g) geometry; (h) measurement; or (i) other. The primary dependent variable, or outcome measure, was coded as (a) fluency, automaticity, mental math; (b) accuracy; (c) general achievement; or (d) other. The primary dependent variable, measurement, was coded as (a) standardized broadband math achievement test (e.g., Wechsler Individual Achievement Test [WIAT], Woodcock Johnson Tests of Achievement [WJ], KeyMath), (b) high-stakes statewide mathematics assessment, (c) curriculum-based measurement (CBM)—digits correct per minute, (d) CBM—percentage correct, (e) researcher-created measure, or (f) other (e.g., computer program, nonempirical measures).
Treatment Strength
Based on previous research (Barnett et al., 2004; Codding & Lane, 2015; Mellard et al., 2010; Warren et al., 2007), coders noted various aspects of treatment intensity as treatment strength, treatment complexity, and treatment expense. Coders documented aspects of treatment strength as (a) no information; (b) no quantitative data, but aspects mentioned; or (c) quantitative data reported. Dose was assessed in two separate codes: (a) learning trial/sessions (i.e., the number of delivered teaching episodes during each session; Warren et al., 2007) and (b) the implementer providing opportunities for the student to practice or respond (Barnett et al., 2004; Mellard et al., 2010; Warren et al., 2007). Session length was assessed for the number of minutes per intervention session (Warren et al., 2007). Coders noted dose frequency as the number of sessions delivered per week (Barnett et al., 2004; Mellard et al., 2010; Warren et al., 2007). Length of treatment was coded as the total treatment duration (e.g., weeks; Mellard et al., 2010; Warren et al., 2007). Finally, if possible, they coded cumulative intensity (i.e., product of multiplying dose × dose frequency × total treatment duration; Warren et al., 2007).
Coders noted dose form (i.e., the physical form in which the active ingredients are dispensed) as the treatment form if each intervention component had (a) no information; (b) aspects mentioned, but not fully described; or (c) information fully described to facilitate replication (Warren et al., 2007) and implementer-to-student ratio or group size (Warren et al., 2007). Group size was coded as implementer-to-student ratio (e.g., 1:1, 1:2–5, 1:6–10; Mellard et al., 2010), and intervention delivery format as (a) small group, (b) individual, or (c) small group and individual. The number of student participants attending each intervention session was coded as (a) one participant, (b) between two and five participants, or (c) more than five participants. Coders also documented positive corrective feedback as (a) fully describing the amount, immediacy, and quality of interventionist feedback on student responses during individual treatment sessions; (b) mention of some aspects; or (c) no information provided (Mellard et al., 2010).
Treatment Complexity
Coders documented treatment complexity as the number and activity type of each intervention component provided (Barnett et al., 2004). They coded goal specificity if information was provided on how broad or focused the instructional goals were (Mellard et al., 2010). In addition, coders noted the pace of instruction if adjusting the speed of instruction in which new concepts or skills were taught according to skill mastery or student’s needs were fully described (Mellard et al., 2010).
Treatment Expense
Coders indicated the implementer of the intervention as (a) parent, (b) teacher, (c) paraprofessional, (d) school psychologist, (e) researcher, (f) peer, (g) tutors, (h) computer assisted, (i) student/self-administered, or (j) other. In addition, they coded implementer training support as (a) coaching, (b) consultation, (c) professional development, (d) feedback (i.e., explicit statements), and (e) other. For both implementer and training support, coders had the option to select all codes that applied. They coded interventionists’ characteristics, experience, knowledge, skills such as training, certification, and mastery of intervention delivery (Barnett et al., 2004; Mellard et al., 2010) as (a) no information provided, (b) some aspects described, or (b) all aspects fully described.
Intervention setting was coded as (a) general education classroom, (b) general education with resource support (e.g., resource room), (c) special education classroom, (d) separate room (e.g., library, conference room) within the school building, or (e) other. In addition, coders documented implementation characteristics (i.e., intervention management and planning, materials and tangible resources, deviation from classroom routines) as (a) no information; (b) aspects mentioned, but not fully described; or (c) components fully described. Intervention management and planning were coded if the time the interventionist spent outside of the intervention on planning activities (e.g., progress-monitoring, consultation) was reported. Materials and tangible resources were coded if the cost for purchased materials or time required to develop intervention materials was reported (Barnett et al., 2004). Coders documented deviation from classroom routines if the number and type of activities the implementer engaged in that were modified from traditional routines was noted (Barnett et al., 2004).
Treatment Fidelity Characteristics
Coders noted the inclusion of treatment fidelity information for interventions at core curriculum and interventions for students at risk as (a) no information, (b) no quantitative data but mentioned monitoring of fidelity, or (c) quantitative data reported for monitoring fidelity for both the percentage of sessions assessed and percentage reported of treatment fidelity (Chard, Ketterlin-Geller, Baker, Doabler, & Apichatabutra, 2009). They also coded treatment fidelity measurement method as (a) direct observations in-person or via audio or video recording, (b) self-report, or (c) other (e.g., permanent product; Sanetti & Kratochwill, 2009). They examined dimensions of treatment fidelity assessed in the study, which included (a) adherence, (b) quality, (c) exposure, or (d) participant responsiveness (Sanetti & Kratochwill, 2009). For measurement method and fidelity dimensions, coders were able to select all that apply.
Core Curriculum Alignment
To determine the development alignment indicators between core curriculum instruction and targeted intervention for students at risk (Baker, Fien, & Baker, 2010), coders documented core curriculum instruction as including (a) no information, (b) some aspect of core curriculum mentioned, or (c) specific curriculum was completely described. If aspects of core curriculum were mentioned or fully described, then coders noted these studies for having (a) insufficient information to evaluate the alignment, (b) some connections between the instruction and targeted intervention are apparent, or (c) the authors explicitly addressed how curriculum and targeted interventions were aligned with instruction.
Interrater Agreement
The studies were coded by two of the study authors. The first author, a doctoral student in school psychology, screened and coded all articles. The fourth author, also a doctoral student in school psychology, was trained in searching, screening, and coding procedures using the coding manual. The first and fourth authors screened and coded an article together to ensure agreement. Independently, the coders screened and coded two articles and reached 100% agreement on both the screening and coding to establish interrater agreement during training. Interrater agreement was calculated as the total number of agreements divided by the total number of codes or articles. The fourth author conducted a second search using the terms in five randomly selected journals and interrater agreement was 98.9%. In addition, the fourth author screened 30% of studies (n = 223) and coded 30% of the articles (n = 20) for an interrater agreement of 92.9% and 90.6%, respectively.
Data Analysis
We used descriptive statistics (i.e., frequency counts and percentages) to summarize the coding variables across all 66 studies that met inclusionary criteria. Relative cumulative frequencies summarized the distribution of studies across the 2004 to 2015 year span.
Results
Study Characteristics
As illustrated in Figure 2, most studies included in this review were published recently, with more than half of the studies published after 2011 (n = 39, 59.1%). Studies were published in a range of education, school psychology, and special education journals (see Table A1), with the Journal of Educational Psychology, Journal of Learning Disabilities, and Remedial and Special Education including the most candidate articles. Group designs (n = 41, 62.1%) were the most frequent experimental designs employed, though multiple baseline designs (n = 20, 30.3%) were also utilized often.
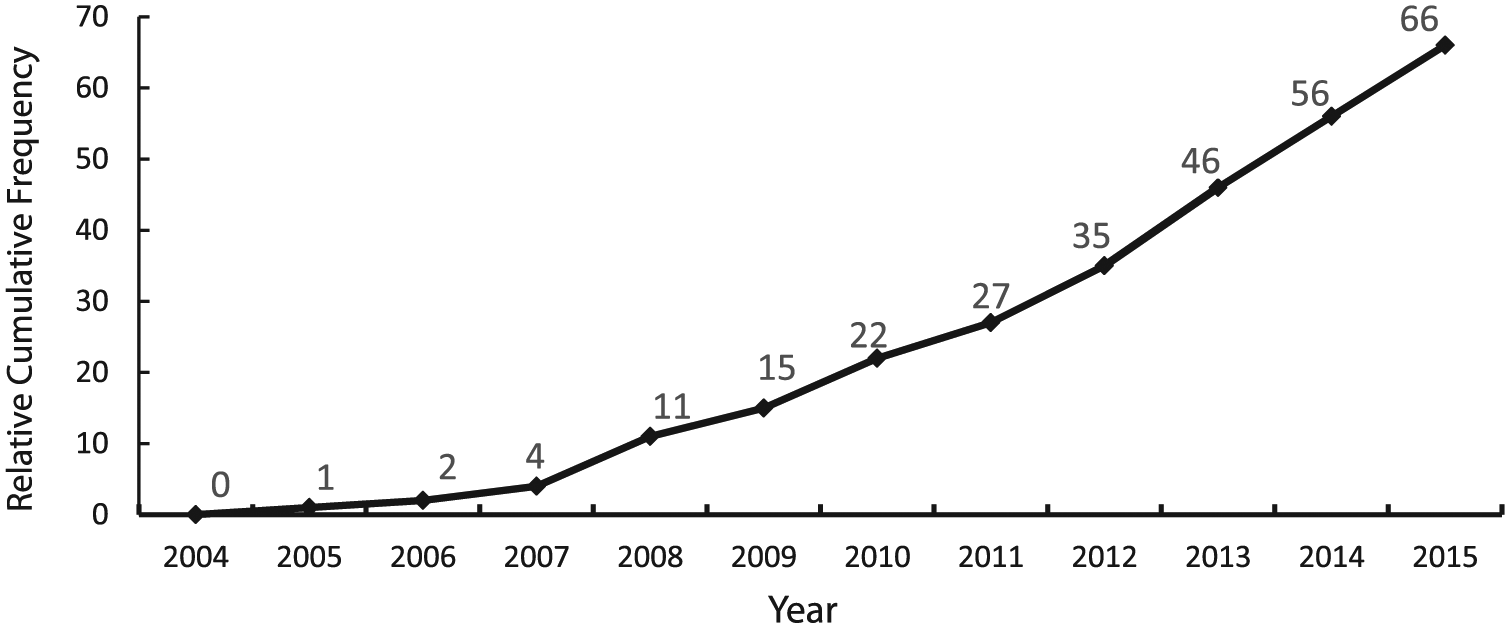
Cumulative frequency of articles meeting screening criteria published across years.
Student Characteristics
Per the review screening criteria, all studies involved students at risk of mathematics difficulties and no studies included students with math learning disabilities. When reported (n = 43, 65.2%), the specific criteria for students determined to be at risk was defined differently across studies. Of the 43 studies that provided specific criteria for students as at risk, almost half included criteria as below the 25th percentile (n = 29, 43.9%). Student participants were almost exclusively enrolled in elementary school (n = 62, 93.9%), participated in general education only (n = 55, 83.3%) or with supports (n = 13, 19.7%), and, when the information was reported, had a nonmathematics disability (e.g., ADHD; n = 8, 12.5%). Most frequently, studies included students who identified as Caucasian (n = 44, 66.7%), Latino (n = 42, 63.6%), or African American (n = 40, 60.6%). When compared with the U.S. Census Bureau data, White participants in the studies relatively represented a sample of the U.S. population (61.3%; U.S. Census Bureau, 2016), whereas Latino and African American participants overrepresented a sample of the U.S. population (17.8% and 13.3%, respectively; U.S. Census Bureau, 2016). Across the studies, participants were almost evenly male (50.2%) and female (49.8%). Further information about student characteristics can be found in Table A2 in the Online Appendix.
Intervention Characteristics
The purported tier, intervention target, and dependent variables varied across studies (see Table A3 in the Online Appendix). Most studies did not report the tiered level of intervention (n = 52, 78.8%), but when identified, studies most frequently indicated the intervention was Tier 2 (n = 12, 18.2%). Math interventions targeted a range of skills, with math computation occurring most frequently (n = 36, 54.5%), followed by word problem solving (n = 21, 31.8%), and early numeracy, or counting and understanding number knowledge and relationships (Bryant et al., 2011; n = 20, 30.3%). To evaluate progress, the primary dependent variable measure was researcher developed (n = 31, 47.0%) and most often measured fluency for addition, subtraction, and multiplication (n = 39, 59.1%).
Treatment Strength
Elements of treatment strength, complexity, and expense are described below and illustrated in Table 1. Most studies provided information about session length (n = 57, 86.4%) and dose frequency (n = 51, 77.3%) as well as the total treatment duration (n = 49, 74.2%). On average, interventions included 31.75 sessions (SD = 19.58 sessions) that occurred 3.17 days per week (SD = 0.85 days) for 26.61 min (SD = 9.59 min). However, as no study provided information about the dose, or number of learning trials or opportunities to respond/practice per session, it was not possible to calculate the cumulative intensity (Warren et al., 2007).
Treatment Intensity Dimensions.
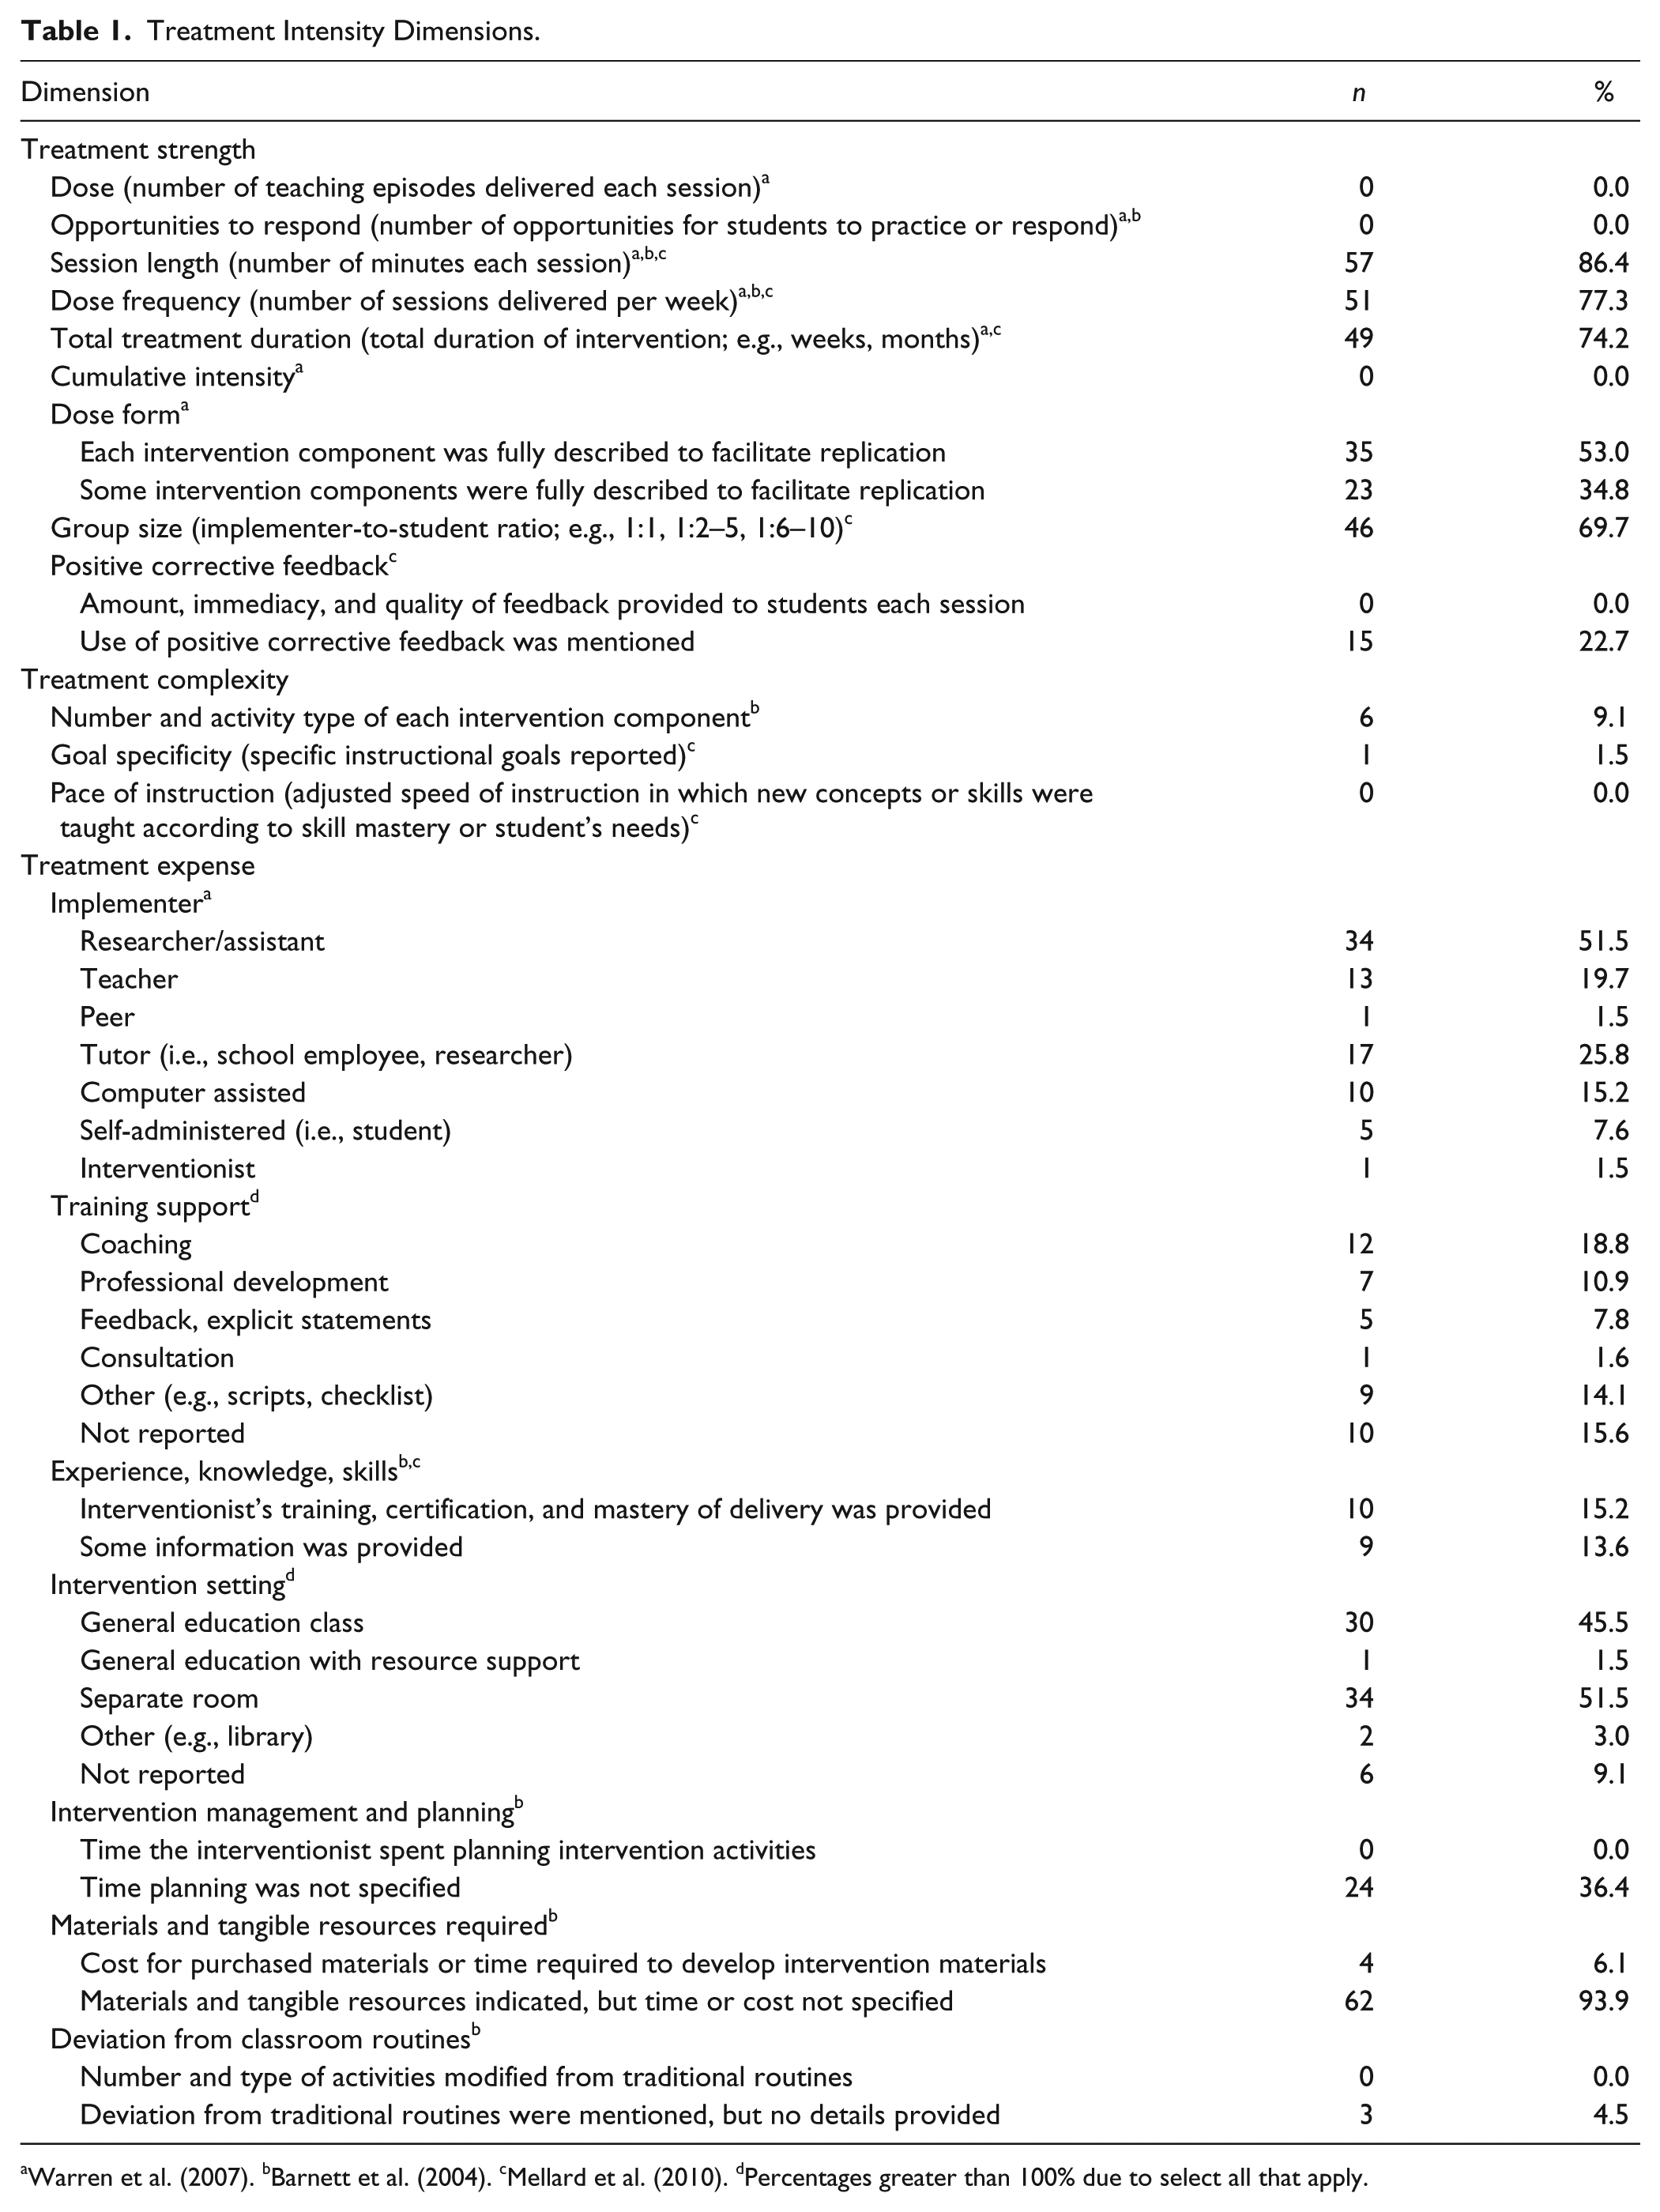
Warren et al. (2007). bBarnett et al. (2004). cMellard et al. (2010). dPercentages greater than 100% due to select all that apply.
Dose form refers to the mechanism through which the learning trials or intervention is delivered (Warren et al., 2007) and, for this review, included student-to-implementer ratio as well as group size. Almost 70% of studies (n = 46) provided information about the implementer-to-student ratio (i.e., 1:1, 1:2–5, 1:6–10). Most interventions occurred within a small group format (n = 28, 42.4%) with either more than five participants (n = 4, 6.1%) or two to five participants (n = 24, 36.4%). In addition, 18 (36.4%) interventions were delivered individually.
Treatment Complexity
Approximately half of the studies (n = 35) included complete descriptions of each intervention component to facilitate replication and the total number and types of intervention components, whereas approximately a third (n = 23) included this information for only some intervention components. In addition, only six studies included complete information of the number and activity type for each intervention components. As an example of complete treatment complexity information, Hassinger-Das, Jordan, and Dyson (2015) indicated their Storybook Number Competencies intervention included six components across the 24 activities. One intervention component, assessing vocabulary words (e.g., divide, equal, part/whole, piece, bigger/smaller, half) by having the “children explain the words in the context of the story,” was taught with seven objectives: (a) reading the story, (b) introducing words/vocabulary by highlighting new words during a second reading, (c) directly explaining the meaning of the words, (d) having children identify other examples of the word in the story, (e) applying new words to math context during math instruction, (f) guiding play activities to apply words to other contexts outside of the story, and (g) playing the Snakes and Ladders to reinforce new vocabulary learned (Hassinger-Das et al., 2015). Only one study provided instructional goal specificity, which was described as 90% accuracy (Gross & Duhon, 2013). No studies included detail about the pace of instruction and opportunities to respond.
Treatment Expense
Most interventions were delivered by a researcher (n = 34, 51.5%), followed by a tutor (n = 17, 25.8%), teacher (n = 13, 19.7%), or were computer assisted (n = 10, 15.2%). No information about the interventionists’ training, certification, and/or mastery of intervention delivery was provided for most studies (n = 47, 71.2%), although 10 studies (15.2%) included all information. Many studies noted the type of support provided to facilitate implementer’s intervention delivery. Supports included coaching (n = 12, 18.8%), professional development (n = 7, 10.9%), feedback (n = 5, 7.8%), and other methods (n = 9, 14.1%).
Interventions were most frequently delivered in a separate room (n = 34, 51.5%) or general education class (n = 30, 45.5%). The implementation context was described in a few articles, but not for most studies. Specifically, 24 studies (36.4%) included some mention of intervention management and planning without providing specific time allotted to prepare for the intervention. The materials and resources needed, but not the time or cost, were specified in four studies (6.1%). Other studies did not mention this information. In only three studies (4.5%) were deviations from the typical classroom routines mentioned, although specifics were not noted.
Treatment Fidelity
Most studies included quantitative treatment fidelity data to document the delivery of the math intervention (n = 43, 65.2%; see Table 2). Other studies mentioned that treatment fidelity was monitored (n = 16, 24.1%), whereas few did not include any mention of treatment fidelity (n = 7, 10.6%). When reported, the mean level of treatment fidelity across studies was 96.45% (SD = 4.77) and it was assessed during 39.5% of sessions, although there was a high level of variability across studies (SD = 31.51). Implementation of the math intervention was typically monitored via direct observations (n = 42, 63.6%). Although quality and exposure were monitored in a few studies, most often only adherence was assessed (n = 56, 87.5%).
Treatment Fidelity Characteristics (N = 66).
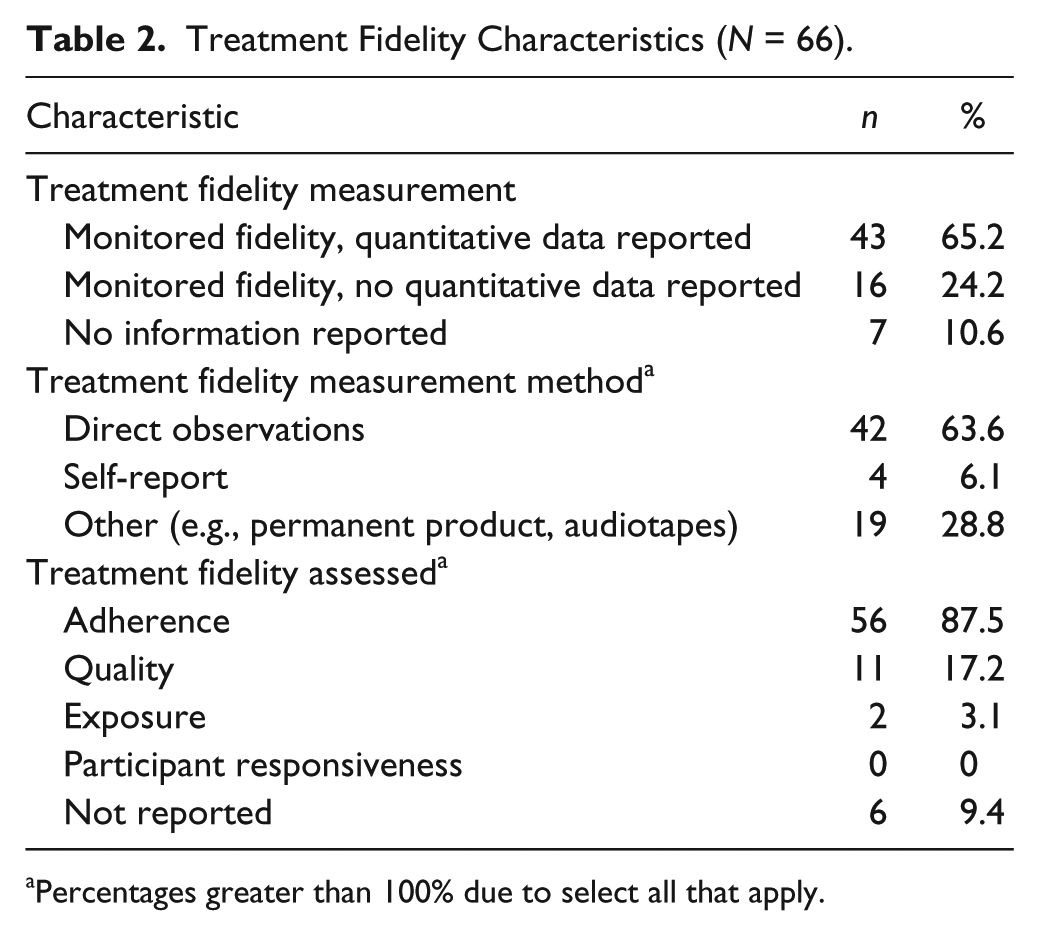
Percentages greater than 100% due to select all that apply.
Core Curriculum Alignment
Information about the core curriculum was not provided in most studies (n = 37, 56.1%), and only nine provided full information about the curriculum (n = 9, 13.7%). When information about the core curriculum was provided (n = 29, 43.9%), most studies did not provide information on the alignment between the math intervention in the study and core curriculum (n = 14, 21.2%), although others explicitly described the alignment (n = 9, 13.6%). Only two studies (3.0%) included quantitative core curriculum treatment fidelity data.
Discussion
Intervention effectiveness, the improvement in some aspect of mathematics achievement as a result of an intervention, is only one aspect required for treatment success. To accurately document treatment success requires accounting for treatment intensity and treatment fidelity (Yeaton & Sechrest, 1981). Treatment intensity, which, for the purposes of this review, includes treatment strength, treatment complexity, and treatment expense, has received relatively less consideration even though the variables that are defined within this construct provide practitioners with, potentially, the most flexibility when attempting to make adjustments to serve students’ needs (Codding & Lane, 2015; Yoder & Woynaroski, 2015). Treatment fidelity has received more attention in recent years as practitioners and researchers, alike, have recognized that definitive changes in student performance cannot be attributed to an intervention unless implementation is documented (DiGennaro Reed & Codding, 2014; Sanetti & Kratochwill, 2009). The purpose of this review was to summarize the existing mathematics interventions for students at risk of math failure along with dimensions of treatment intensity and treatment fidelity.
Characteristics of the Mathematics Intervention Literature for At-Risk Students
According to the 2010 RtI adoption survey administered by Spectrum K–12 School Solutions, the lack of intervention resources was listed as one of the most substantial barriers to RtI implementation. Our review suggests that the cumulative number of mathematics intervention articles has increased considerably, providing more intervention options available for adoption by schools. However, the fact that in just more than half of the studies reviewed (51.5%), researchers were the primary implementers and nearly half of the outcome measures were researcher-created tools might indicate that many of these interventions are in the development stage. This factor has implications for the feasibility and usability of these intervention options when delivered and evaluated by school-based intervention agents (Kratochwill, Volpiansky, Clements, & Ball, 2007). That is, the current status of the evidence base for Tier 2 math interventions reviewed herein might be classified as efficacy or transportability research, which falls more under the purview of researchers as opposed to practitioners (Chorpita, 2003). A logical next step for researchers is to evaluate the outcomes of these interventions when delivered by school-based professionals with lessening support from investigators.
The vast majority of intervention articles included participants in elementary school with only about 6% of articles investigating interventions for middle or high school–level participants. Considering that when RtI is applied to mathematics, it occurs at the primary level, this finding appears to coincide with practice (Spectrum K–12, American Association of School Administrators, Council of Administrators of Special Education, National Association of State Directors of Special Education, & State Title 1 Directors, 2010). Given that most of the studies were conducted with elementary students, it is not surprising that the skills these interventions targeted primarily addressed aspects of whole number knowledge such as early numeracy, computation, word problem solving, and reasoning. Whole number knowledge is a critical target area for intervention delivery with elementary students (Gersten, Chard, et al., 2009). Only a small proportion of studies examined fractions and no intervention studies directly targeted geometry or measurement. It is also noteworthy that 59.1% of studies measured outcomes with fluency metrics that pertained to a specific area of math as opposed to accuracy or general mathematics achievement. Research has indicated that measures of fluency, which capture students’ rate of performance as well as accuracy, yield stronger psychometric properties than measures of accuracy alone (Burns, VanDerHeyden, & Jiban, 2006). CBM utilizes a fluency metric and was the primary dependent measure in about 31% of studies. However, more distal measures of intervention effects were less frequently examined, suggesting the impact to a broader conceptualization of mathematics outcomes is unknown.
The specific criteria used to determine whether students were considered to be in need of Tier 2 supports was reported in 65.2% of studies reviewed and the most frequent criterion applied was that students performed below the 25th percentile on a screening tool. This criterion has been generally represented in previous literature as separating students in need of additional supports from those who do not need supplemental interventions (D. Fuchs, Mock, Morgan, & Young, 2003; Mazzocco & Myers, 2003; VanDerHeyden, Witt, & Naquin, 2003). Nearly all participants received core instruction within the general education setting either with or without additional supports. Only a small handful of participants were also diagnosed with a nonmathematics disability and 24% of studies failed to report such disability status. The fact that students with nonmathematics disabilities were either not included or their presence was not reported is cause for concern given the co-occurrence of math difficulties with reading disabilities (Barbaresi, Katusic, Colligan, Weaver, & Jacobsen, 2005; Dirks, Spyer, van Lieshout, & de Sonneville, 2008) as well as attention and behavior problems (Wu, Willcutt, Escovar, & Menon, 2011). Without better information about participants, it is difficult for educators to select appropriate interventions for students, or research to support students with co-occurring challenges will be stilted. This is problematic as some research suggests either more intensive or different interventions components are required for students exhibiting comorbid conditions (Cirino, Fuchs, Elias, Powell, & Schumacher, 2013; L. S. Fuchs, Fuchs, & Compton, 2013). Furthermore, directly addressing math skills can affect other co-occurring problems. For example, a recent meta-analysis documented that interventions to address academic skills generate a small effect size on disruptive behavior and a moderate effect size on academic engagement (Warmbold-Brann, Burns, Preast, Taylor, & Aguilar, 2017).
In more than half of the studies, no information was reported on the characteristics of the core mathematics curriculum employed. This is problematic because the RtI framework is predicated on the idea that core instruction is strengthened as a first step toward improving students’ outcomes (Lembke, Hampton, & Beyers, 2012). Furthermore, analysis of commonly used mathematics curricula suggested wide variability in the inclusion of research-based instructional design principles, including absence of explicit instruction as well as limited practice opportunities (Doabler, Fien, Nelson-Walker, & Baker, 2012). Therefore, the instructional context within which various Tier 2 interventions are applied and successful, or not, will depend on author reports of the core curriculum. When information was reported on Tier 1 instruction in the current study, it was unclear whether or not the Tier 2 intervention was designed to align with or address gaps in the core curriculum. Gersten, Beckmann, et al. (2009) suggest that alignment between Tier 2 interventions and core instruction is not necessary as long as gaps in students’ foundational and prerequisite skills are addressed by Tier 2 supports. However, there is some research reporting that Tier 2 interventions produce better outcomes when Tier 1 instruction is aligned (e.g., L. S. Fuchs, Fuchs, & Hollenbeck, 2007), suggesting that these details might be necessary to determine when or whether this alignment is important. Finally, the fidelity of core curriculum implementation was often not described. Once again, if Tier 1 instruction is delivered without fidelity, then providing Tier 2 supports may not be successful (Lembke et al., 2012).
Treatment Fidelity
Consistent with recent trends in intervention literature (e.g., Barnett et al., 2004; DiGennaro Reed & Codding, 2014; Sanetti et al., 2011), most studies are reporting that treatment fidelity is monitored, and a majority of those studies are providing data to support this assertion. Given the importance of treatment fidelity to the internal validity of any intervention study, it is still surprising that data are not reported in all studies (Gresham, MacMillan, Beebe-Frankenberger, & Bocian, 2000). The majority of studies used direct observation to determine treatment fidelity. This finding is encouraging because direct observation can capture all intervention steps, has been shown to be more directly related to student outcomes, and can more quickly produce a dependable indicator of implementation (Gresham, Dart, & Collins, 2017; Sanetti & Collier-Meek, 2014). For the vast majority of studies, treatment fidelity was defined as adherence to treatment steps or components; however, this finding is inconsistent with best practices. That is, multiple dimensions of implementation fidelity such as quality and participant responsiveness should also be reported (e.g., Roach & Elliott, 2008; Sanetti & Kratochwill, 2009).
Although session adherence was reported across nearly all studies, adherence to key components of the interventions was not reported. Discussion of the effectiveness of these Tier 2 interventions can only be generated when it is clear that the active treatment ingredients—the central aspects of the intervention—are implemented consistently as intended (Sanetti & Kratochwill, 2009). Successful and sustainable implementation of intervention programs in school settings depend on school personnel implementing the core components of the program and determining how to adapt other aspects of the program to the local context (Berkel, Mauricio, Schoenfelder, & Sandler, 2011; Forman et al., 2013). It is widely recognized that perfect adherence to an intervention script may not be necessary to improve student outcomes (e.g., Gresham et al., 2000); however, students will be better served if educators who are implementing interventions know which aspects of the script must be delivered as intended.
As hypothesized earlier, if many of the interventions that were applied in these studies are still in the developmental stages, then core active ingredients may not yet be known. A more detailed analysis of the fidelity with which each step or subcomponent was implemented may help tease apart the most critical ingredients in any given specific intervention (Gresham et al., 2000). Because there are a number of meta-analyses that have identified effective instructional practices for students at risk of or with math disabilities (e.g., Codding, Burns, & Lukito, 2011; Gersten, Chard, et al., 2009; H. L. Swanson, 2009), it is also possible for authors to articulate which of these elements are embedded within their intervention packages (Damschroder & Hagedorn, 2011; Fixsen, Naoom, Blase, Friedman, & Wallace, 2005; Forman et al., 2013).
Treatment Intensity
Reviewing the school psychology literature, Sanetti et al. (2011) found that the actual intervention was only described in a replicable manner in approximately 32% of studies. Providing sufficient operational definitions of an intervention is essential for external validity and necessary to promote a systematic body of research that replicates the initial work of developers across student populations, settings, situations, and implementers (Gresham et al., 2000; Sanetti et al., 2011). In this study, the result was higher, as 53% of studies fully described each intervention component. Only one study specified the instructional goals that were associated with the intervention, and no studies discussed how students progressed through the curriculum or intervention skill sequence. Evidence suggests that curricular scope affects intervention outcomes and might be an important variable to alter, particularly if students are not responding to intervention effects (Duhon, House, & Stinnett, 2012; Poncy et al., 2015).
Given the reality that practitioners are likely to adapt treatments to improve ownership of the intervention or to alter the intervention’s efficiency, it is necessary to know the active ingredients (Barnett et al., 2004; Berkel et al., 2011; Lilienfeld, Ammirati, & David, 2012). Active ingredients are the minimum number of intervention components critical to improving student outcomes (Barnett et al., 2004). Research suggests that deviations from treatment protocols can both help and hinder student outcomes emphasizing the need to report what elements are essential (Forman et al., 2013). It is incumbent upon authors to report these critical treatment components and link the components to math and instructional design principles so that generally effective practices can be defined across interventions.
Across these studies, interventions were conducted for a little more than 10 weeks, 3 times weekly, for about 26 min. The majority of studies delivered interventions in small groups that primarily ranged in size from two to five students. In practice, group size might be affected by the number of available interventionists and the similarity of students’ needs (Mellard et al., 2010). The total duration and number of sessions applied in the empirical literature is slightly below expert recommendations (Gersten, Beckmann, et al., 2009) and at least one empirical study suggested that for some math outcomes, more frequent delivery is required (Codding et al., 2016). It is possible that treatment strength is specific to particular interventions such that each mathematics intervention comes with explicit instructions regarding how much of the intervention is required to maximize success (Yoder & Woynaroski, 2015).
Interestingly, no studies report highly specific aspects of the learning trials presented to students within each session (i.e., dose; Warren et al., 2007). That is, the number of opportunities students had to respond, the type and amount of feedback students received, and the total number of teaching episodes were not reported. Therefore, we know little about what learning is actually occurring within each intervention session, and this might be a powerful aspect of treatment that can be manipulated to improve student outcomes. Some experts suggest that computing the learning rate (i.e., the amount of student improvement divided by the total time spent in learning activities in a particular session) is more useful to determine intervention effectiveness than other global measures of dose (Daly, Martens, Barnett, Witt, & Olson, 2007; Skinner, 2008; Warren et al., 2007).
Perhaps expected, few treatment expense variables were reported or described in a comprehensive manner. Although treatment dosage and complexity reflect variables directly connected to student outcomes, treatment expense is indirect, but still important, as these factors affect intervention adoption, feasibility, and sustainably. In one survey, teachers indicated intervention compatibility, time required for intervention services, and intervention materials/resources as the top barriers to implementation (Long et al., 2016). In the current review, few studies provided any information on intervention management or planning, the extent to which the intervention procedures deviated from typical routines was largely unreported, and required materials and resources were reported but cost in terms of time and money were unspecified. Specific dedication to treatment planning alone has proven to enhance the accurate delivery of interventions (Sanetti, Collier-Meek, Long, Byron, & Kratochwill, 2015). If researchers are anticipating that school professionals use empirically supported interventions, then providing information on aspects of intervention expense will assist practitioners with making selections that are more likely to be implemented and sustainable.
Another commonly known barrier to intervention implementation is intervention support, defined in this review as intervention training, experience, consultation, and coaching (Fixsen et al., 2005; Sanetti & Collier-Meek, 2015). Only 15.6% of studies did not report the types of support required for intervention implementation, which is encouraging. Support varied across multiple options ranging from providing intervention scripts to coaching. However, implementer experience with the intervention and knowledge of mathematics in general was rarely reported. In practice, ideally, school professionals would target the level of support provided to interventionists according to skill level, experience, and knowledge. The level of expertise required also has implications for whether or how interventions can be delivered in schools. The simplicity of an intervention might be a key consideration for RtI teams during intervention selection given that simple interventions make it possible for any number of available personnel (with a range of training and expertise) to deliver interventions (e.g., Daly et al., 2007). School professionals might also allocate resources according to intervention expertise such that the students with intensive needs receive the interventions that require more expertise (Lembke et al., 2012).
Limitations and Future Directions for Research
The intention of this review was to evaluate the mathematics intervention literature to examine variables of intensity and fidelity. Thus, we do not provide information pertaining to intervention effectiveness. Future research might employ meta-analytic techniques to determine whether and how treatment strength is related to student outcomes, and, more empirical studies are needed to identify the importance of various aspects of dosage. We conceptualized treatment intensity as a comprehensive term under which treatment strength (dosage), complexity, and expense are incorporated (Barnett et al., 2004). We did so believing that this definition of intensity is more aligned with the description of intensity provided within an RtI framework (Batsche, Kavale, & Kovaleski, 2006) and some previous conceptualizations (Yeaton & Sechrest, 1981). We acknowledge that this conceptualization of intensity is not consistent across the literature. It is possible, as posited by Yoder and Woynaroski (2015), that what we described as treatment strength is the most important variable to manipulate to optimize intervention effects. Future research should consider examining the variables we described as treatment intensity and organizing them into a framework based on empirical data. It is also possible that our inclusion criteria inadvertently omitted some mathematics intervention articles. For instance, research to document the treatment intensity and treatment fidelity for students with math disabilities could be valuable to evaluate and compare with the findings presented here. Last, we did not include dissertation studies, and, thus, might be missing some recent research.
Implications for Practice
Treatment fidelity and treatment intensity are important dimensions to document when evaluating intervention effectiveness in schools (Codding & Lane, 2015; Fixsen, Blase, Duda, Naoom, & Van Dyke, 2010; Gresham et al., 2000; Sanetti & Kratochwill, 2009; Yeaton & Sechrest, 1981). However, based on the current state of the literature (e.g., Codding & Lane, 2015) and the fact that this review did not include an analysis of the relationship among dimensions of these constructs and student outcome data, explicit guidelines for practice are premature. Rather, at present, we can offer general recommendations for documenting and manipulating treatment fidelity and treatment intensity. When selecting interventions, educators can make sure to account for intervention components as well as document the treatment intensity and treatment fidelity dimensions reported in the research. In this way, when preparing to deliver the intervention, they can be assured that they are doing so in a manner that has been successful in prior research. When actually delivering interventions, educators can document aspects of treatment intensity (Codding & Lane, 2015) and evaluate treatment fidelity (Collier-Meek, Fallon, Sanetti, & Maggin, 2013). Having these data will allow for a more accurate evaluation of intervention effectiveness. If the intervention fails to sufficiently improve student outcomes, educators will be able to systematically modify treatment intensity and/or promote treatment fidelity, rather than quickly jumping to a different intervention (Sanetti & Collier-Meek, 2018). If the intervention successfully improves student outcomes, educators can use treatment intensity and treatment fidelity data to systematically fade the intervention while monitoring outcomes to support generalization.
Conclusion
As many as 59% of elementary and 48% of middle schools report RtI implementation in math; however, one of the largest barriers is the lack of intervention resources (Spectrum K–12, American Association of School Administrators, Council of Administrators of Special Education, National Association of State Directors of Special Education, & State Title 1 Directors, 2010). This review suggests there are an increasing number of intervention articles that ought to provide options for school professionals working in elementary schools or addressing student gaps with whole number proficiency. The included interventions were primarily delivered in small groups of up to five students who performed at or below the 25th percentile on various screening measures. On average, intervention sessions tended to be about 25 min in length delivered 3 times weekly for 30 total sessions (about 10 weeks). The extent to which time allocated to each included intervention is feasible for school-based professionals to implement and results in high levels of student responsiveness is unknown. For the most part, data on treatment fidelity were reported using the most rigorous method (direct observation), which strengthens confidence in the findings. In the future, dimensions other than adherence should be evaluated. More research is needed on interventions for older students and for improving rational number knowledge as well as geometry. It is possible that secondary students would benefit from existing interventions that address foundational skills or existing interventions need to be altered by adding intervention components (increasing complexity), or increasing dose, frequency, and/or duration of the intervention (increasing the time students participate in intervention services). Unfortunately, just more than half of the interventions were only delivered by researchers, so it is unclear how implementation or student outcomes will be affected when delivered by school personnel. Related, few variables that affect implementation such as cost of materials, level of expertise required, amount of training needed, or deviation for traditional routines were reported. These factors may impact adoption of the math interventions in the literature. Greater transportability to school settings might be afforded if common treatment components can be extracted from the math intervention literature. Although more than half of the studies reviewed provided replicable detail for these components, the type and number were not provided. Finally, although broader dimensions of treatment strength were reported, little is known about the number of learning opportunities students are provided with during sessions and this factor may be the most critical indicator of treatment strength.
Supplemental Material
Appendix_A – Supplemental material for Examining Dimensions of Treatment Intensity and Treatment Fidelity in Mathematics Intervention Research for Students at Risk
Supplemental material, Appendix_A for Examining Dimensions of Treatment Intensity and Treatment Fidelity in Mathematics Intervention Research for Students at Risk by Emily R. DeFouw, Robin S. Codding, Melissa A. Collier-Meek and Kaitlin M. Gould in Remedial and Special Education
Supplemental Material
Appendix_B – Supplemental material for Examining Dimensions of Treatment Intensity and Treatment Fidelity in Mathematics Intervention Research for Students at Risk
Supplemental material, Appendix_B for Examining Dimensions of Treatment Intensity and Treatment Fidelity in Mathematics Intervention Research for Students at Risk by Emily R. DeFouw, Robin S. Codding, Melissa A. Collier-Meek and Kaitlin M. Gould in Remedial and Special Education
Footnotes
Declaration of Conflicting Interests
The author(s) declared no potential conflicts of interest with respect to the research, authorship, and/or publication of this article.
Funding
The author(s) received no financial support for the research, authorship, and/or publication of this article.
References
Supplementary Material
Please find the following supplemental material available below.
For Open Access articles published under a Creative Commons License, all supplemental material carries the same license as the article it is associated with.
For non-Open Access articles published, all supplemental material carries a non-exclusive license, and permission requests for re-use of supplemental material or any part of supplemental material shall be sent directly to the copyright owner as specified in the copyright notice associated with the article.