
Abstract
The efficacy of a research-based fraction sense intervention for sixth graders with or at risk for mathematics difficulties (N = 52) was examined. The intervention aimed to build understanding of fraction magnitudes on the number line. Key concepts were taught with a narrow range of denominators to develop deep understanding. The intervention was centered on a visual number line in the meaningful context of a color run race. Students were randomly assigned to the fraction sense intervention (n = 25) or a business-as-usual control group (n = 27). Students in the intervention condition received 21 lessons in small groups (45 min each) during their regular mathematics intervention period. Students in the intervention group performed significantly better than those in the control group on a measure of fraction number line estimation and a more general measure of fraction concepts, both at immediate posttest and delayed posttest, with large effect sizes; lesser effects were shown for fraction arithmetic.
Keywords
Poor achievement in mathematics has far-reaching educational, vocational, and personal consequences (National Mathematics Advisory Panel [NMAP], 2008). Within the mathematics domain, fractions are problematic for many children, especially those with learning difficulties and disabilities (Jordan, Resnick, Rodrigues, Hansen, & Dyson, 2017). Fractions are foundational for learning algebra (Booth & Newton, 2012; NMAP, 2008), which is a gateway to careers in science, technology, engineering and mathematics (STEM; Chen, 2009). Proficiency in fractions is also important for performing everyday tasks. As such, interventions for helping students learn fractions must be an educational priority in general education and in special education (SPED).
The present study evaluated a newly developed intervention aimed at improving foundational fraction knowledge in sixth graders with mathematics difficulties. The U.S. Department of Education’s What Works Clearinghouse (WWC) Practice Guide recommends that intervention curriculum for students at-risk should not be oversimplified and that in-depth coverage of key topics and concepts involving whole numbers (kindergarten- grade 5) and then all rational numbers (grades four through eight) is critical for future success in mathematics. (Gersten, Beckmann, et al., 2009, p. 18)
Fractions are typically a student’s first introduction to rational number topics (National Governors Association Center for Best Practices & Council of Chief State School Officers [NGACBP & CCSSO], 2010), making fraction knowledge foundational to rational number understanding more generally. Students entering middle school who have not responded to classroom instruction and typical intervention in fractions are especially vulnerable to further mathematics failure (Mazzocco & Devlin, 2008).
Why Fractions Are So Difficult
Before students learn about fractions in a formal mathematics setting, their exposure to number is primarily limited to whole numbers. As a result, students often misapply whole number principles to fractions. This whole number bias (Ni & Zhou, 2005) can interfere with fraction learning because whole numbers and fractions differ in several ways. For example, students must learn, unlike with whole numbers, there is an infinite number of symbolic representations for each magnitude on the number line, and between any two magnitudes, there is an infinite number of magnitudes (Schneider & Siegler, 2010).
Furthermore, the relative magnitude of a whole number can be determined by its place in the counting sequence. In contrast, fractions require students to think about the difficult concept of two numbers working together to yield a single magnitude (DeWolf, Grounds, Bassok, & Holyoak, 2014; Stafylidou & Vosniadou, 2004). When asked to select the larger of two fractions, struggling students tend to select the fraction that includes larger numbers overall, particularly in the numerator (Rinne, Ye, & Jordan, 2017; Stafylidou & Vosniadou, 2004).
Reasoning about fraction magnitude also requires multiplicative reasoning, which assists students in finding common denominators and simplest form. Multiplicative reasoning assists students in benchmarking to one half when comparing fraction magnitude (e.g., knowing a denominator is or is not twice the numerator to determine the fractions’ relative size to one half; Reys, Kim, & Bay, 1999). Unfortunately, students who struggle with fractions often have poor multiplication skills (Rodrigues, Dyson, Hansen, & Jordan, 2016).
Arithmetic operations with fractions can also be confusing. For example, although the meaning of addition does not change with fractions, the strategy is more complex. Students must now consider both the numerator and the denominator, making sure there is a common denominator and then remember only the numerators are added while the denominator, which indicates the size of the part, stays the same (Lortie-Forgues, Tian, & Siegler, 2015). To add to the confusion, some rules taught in lower grades no longer apply. For example, the notion that multiplying two numbers always gives you a number bigger than either factor no longer applies when operating with fractions whose magnitudes are less than one.
Importance of Magnitudes on the Number Line
The third grade Common Core State Standards for Mathematics (CCSS-M) state that a student should understand and be able to represent a fraction as a number on the number line (NGACBP & CCSSO, 2010). The number line, an important tool for teaching fraction (Fuchs et al., 2013; Fuchs et al., 2014) and whole number magnitude (Ramani & Siegler, 2008), provides an underlying structure for learning a range of fraction concepts and skills (Siegler, Thompson, & Schneider, 2011). Teaching students to represent rational numbers on a number line improves their general knowledge of rational number concepts, such as fractions (e.g., Keijzer & Terwel, 2003; Rittle-Johnson, Siegler, & Alibali, 2001; Schneider, Grabner, & Paetsch, 2009). Both whole number and fraction magnitude knowledge predict mathematics achievement more generally (Bailey, Hoard, Nugent, & Geary, 2012; Jordan et al., 2013). Thus, it is important to consider fraction magnitude understanding on a number line when designing an intervention for students struggling with mathematics.
Procedure
We developed and tested a novel small-group fractions intervention for low-performing sixth graders centered on the number line. Until recently, a part-whole (pie) interpretation of fractions has been the focus within U.S. mathematics curricula (Siegler, Fuchs, Jordan, Gersten, & Ochsendorf, 2015) especially for students with special needs (Gersten, Schumacher, & Jordan, 2017). These curricula may use a number line model, but sparingly. Instead, we center our instruction on a number line model and use part-whole (pie) models sparingly.
Using a number line approach, the intervention aimed to build fraction sense, which we define as understanding (a) the meaning of a fraction, (b) fraction relations, and (c) fraction operations. The meaning of a fraction refers to knowledge that a fraction’s numerator and denominator work together to determine its magnitude, rather than either number alone. Understanding fraction relations involves correctly comparing magnitudes of two or more fractions, ordering fractions on a number line, and showing different fractions can have equivalent values (i.e., the same magnitude). Understanding fraction operations refers to being able to apply understandings of whole number operations to fractions (i.e., addition as joining, subtraction as separating, multiplication as repeated addition or “groups of”). Procedures to solve fraction operations should only be applied when accompanied with an understanding of the logic of the procedures.
Many curricula introduce several fractions simultaneously. For example, Investigations (Wittenberg et al., 2012) begins its third-grade fractions unit with halves, fourths, eighths, thirds, and sixths in the first lesson and continues to use these denominators throughout the unit. As there are a limited number of key concepts to be applied to an infinite number of fractions, we aimed to establish core fraction concepts employing a small set of fractions typically encountered in everyday life. Students were then challenged to apply these same understandings to a wide variety of fractions.
Our intervention used explicit and systematic instruction throughout the activities. The National Dissemination Center for Children with Disabilities (NICHCY) determined explicit and systematic instruction was one of the four approaches in mathematics education that impact learning of students with learning disabilities (Steedly, Dragoo, Arafeh, & Luke, 2008).
The term explicit instruction in mathematics refers both to the goals of the instruction and the method of instruction. The main goals of explicit instruction are to (a) make clear connections between various mathematical concepts (which often go unnoticed by students with learning difficulties) and (b) to provide students with specific strategies for problem solving supported by these connections. Explicit instruction can take a variety of forms but components that make it most effective are teacher modeling of problem-solving strategies, opportunities for students to practice those strategies, and regular feedback (Doabler & Fien, 2013; Gersten et al., 2009).
Using a randomized pre-, immediate post-, and delayed posttest design, we predicted sixth graders who received our intervention would outperform students in a business-as-usual control condition on fraction outcomes. Outcomes included a measure of fraction number line estimation (FNLE; proximal measure) as well as measures of general fraction concepts and fraction arithmetic (distal measures). We expected results at immediate posttest to hold at delayed posttest due to intensity of the intervention.
Method
Participants
Sixth-grade students were recruited from two schools in the Northeast region of the United States. Both schools serve an ethnically diverse population of students (School A: 13.9% Black, 26.1% White, and 56.7% Hispanic; School B: 32.7% Black, 36.9% White, and 24.0% Hispanic). Schools varied in their percentage of students who were English Learners (EL), who were from families of low socioeconomic status (SES), or who were identified as needing SPED (School A: 30.3% EL, 25.0% low SES, 5.7% SPED; School B: 4.9% EL; 34% low SES; 16% SPED). Both schools served populations at risk for mathematics failure. In 2015, 61% of students in School A and 75% in School B did not meet sixth-grade state standards in mathematics. Both schools used similar mathematics curricula consistent with the CCSS-M.
Participant Selection
Data collection was conducted during the first marking period of the academic year. All sixth graders not enrolled in an honors mathematics class were administered a fraction screener in their third week of school. Of the 235 students tested, 146 (62.13%) scored below a predetermined cutoff score (see “Measures” section for criteria) and were invited to participate in the study.
The participating institution’s Institutional Review Board approved the study and informed consent procedure. In School A, 22 students returned consent forms, and in School B, 40 students returned consent forms. The low consent rate is likely due to the brief time frame (i.e., 5 days) during which informed consent and assent needed to be returned to accommodate the schools’ request to administer the intervention during the first report period. Of the 62 consenting participants, we could accommodate a maximum of 16 students in each school for the intervention condition due to limited resources (i.e., number of research instructors and classroom space). All 22 students from School A were selected to participate and 33 students from School B were randomly sampled from the 40 eligible students. The remaining seven students did not participate in any way. An a priori power analyses using G*Power (Faul, Erdfelder, Lang, & Buchner, 2007) suggested a sample size of N = 42 would provide power of .95 to detect large effects. We expected large effects, particularly on fraction concepts and number line estimation measures, based on pilot data collected during the development phase of the current intervention (Rodrigues et al., 2016).
Participating students within each classroom were randomly assigned to either the fraction sense intervention or a business-as-usual control. An equal number of students was assigned to intervention and control groups within each classroom and within each school. The 27 students assigned to the intervention condition were then randomly assigned to groups of four within each school so any differences found between schools or classrooms would not systematically differ by condition. This resulted in small groups of students from a range of classrooms, ensuring intervention groups were not nested within classrooms. This assignment was possible because all sixth-grade mathematics interventions took place during the same class period. Attrition was low; two of the intervention students and one of the control students relocated to a new school between posttest and delayed posttest; thus, our analysis sample includes more than 94% of our original sample with 25 remaining participants in the intervention group (12 male, 13 female; M screener score = 10.40, SD = 2.062) and 27 in the control group (11 male, 16 female; M screener score = 10.33, SD = 1.710). More detailed demographic information at the student level was not available.
Measures
Fraction screener
Nineteen released fraction items from the National Assessment of Education Progress (NAEP; U.S. Department of Education, Institute of Education Sciences, National Center for Education Statistics, NAEP, 1990–2009) served as our fraction screener. The items were chosen because they assess key concepts such as part-whole understanding (e.g., “Which shows 3/4 of the picture shaded?”) and fraction equivalence (e.g., “Which picture shows that 3/4 is the same as 6/8?”). Internal reliability of the measure is acceptable (α = .77) in sixth grade (Rodrigues, 2017). Receiver operating characteristic curve (ROC) analyses indicate the fraction screener has high diagnostic accuracy for identifying students who will not meet mathematics standards on a state test at the end of sixth grade (Rodrigues, 2017), demonstrating predictive validity. A specified cut point was determined, which predicted 81% of true positives (students who did not meet sixth-grade mathematics standards) and approximately 80% of true negatives (students who did meet sixth-grade mathematics standards; Rodrigues, 2017). The diagnostic accuracy of the screener meets guidelines for good diagnostic tests for determining risk status (Cummings & Smolkowski, 2015).
Outcome measures
The three outcome measures assessed fraction magnitude understanding, fraction concepts, and fraction arithmetic.
FNLE task
An established FNLE task (Siegler et al., 2011) was used as a proximal measure of fraction magnitude understanding. Students estimated the location of 14 fractions on 0 to 1 and 0 to 2 individual number lines within a paper-and-pencil task. The Number 0 was placed below the left end of the number line and the Numbers 1 and 2, respectively, were placed at the right end of the number line. The target number was placed in the center below the number line. The number lines were staggered across the page so students could not easily use their estimates on other number lines to inform their next placement. For the 0 to 1 number line task, a completed sample problem displayed where 1/8 would be located on the number line. The students then estimated the locations of proper fractions (one fourth, one fifth, one third, one half, one nineteenth, and five sixths). The same procedure was used on the 0 to 2 number line task, with two sample problems showing the locations of one eighth and one and one eighth. For the 0 to 2 number line, students estimated the location of proper fractions (three eighths, five sixths, one half, one nineteenth), improper fractions (seven fourths, five fifths), and mixed numbers (one and eleven twelfths, one and one half). Students’ estimates on each number line were calculated by measuring the distance between zero and their mark in millimeters. To gauge students’ accuracy of their estimates, percent absolute error (PAE) was calculated for each estimate by dividing the absolute difference between the estimated and actual magnitudes by the numerical range of the number line (one or two) and then multiplying by 100. Thus, PAE represents how inaccurate a student’s estimate is from the actual location of the target number with lower scores representing better accuracy. A single score of an average PAE was computed for each student. Internal reliability for the fraction number line task was previously demonstrated to be high in sixth grade (α = .88). Test–retest reliability has been demonstrated with a sample with similar demographics from the same region (r = .833, Hansen et al., 2015).
Fraction concepts
The fraction concepts measure was used as a distal measure of understanding of general fraction concepts. It included the 19 items of the aforementioned fraction screener, along with five additional more difficult NAEP fraction items to avoid ceiling effects. Internal reliability for the measure was previously demonstrated to be high (α = .85) in sixth grade (Rodrigues, 2017).
Fraction arithmetic
The fraction arithmetic measure included 12 written fraction computation items: four addition, five subtraction, and three multiplication problems. The addition and subtraction problems had both like and unlike denominators, whole and mixed numbers. Students were instructed to write their final answers in simplified form. Students received one point for each correct response and one additional point for a final answer in simplified form. The maximum score for the 12-item measure was 24 points. The internal reliability for this measure was previously demonstrated to be high (α = .82).
Procedures
Overview
Our 21-lesson fraction sense intervention was administered during the schools’ first 6-week mathematics intervention period. The intervention was delivered each day the school was in session (typically 5 days per week) for approximately 45 min, when all sixth-grade students with mathematics difficulties received specialized help. Trained researcher-instructors carried out the intervention. Lessons were administered in small groups of four students, an optimal group size for struggling learners (Fuchs et al., 2014). The lesson plans were highly detailed to increase ease of administration and instructor fidelity. Lessons were taught in separate rooms dedicated to the intervention for that class period. Student desks were arranged to form one table, allowing all students to have a clear view of the instructor and intervention materials. Classroom teachers did not observe the lessons and were not informed of their content other than their focus on fractions. This was done to ensure there was no diffusion of treatment to the control group or to regular classroom instruction.
Meanwhile, students in the business-as-usual control group received varying supplemental instruction by their school during this intervention period. In School A, all students in the control group received intervention instruction in mathematics provided by classroom teachers in a small group setting. The focus of instruction was at the teacher’s discretion based on student need and reflected core classroom instruction (see above), which included work in fractions and topics related to fractions such as factors. In School B, students in the control group were assigned to a computer lab where they used Think Through Math software (Think Through Learning, 2016) for instruction. This computer adaptive program assesses student needs and provides instruction and practice based on this assessment. After all data collection for the efficacy study was completed, all students in our control group received the fraction sense intervention as a courtesy.
Participants’ school day included both the intervention period and their regularly scheduled mathematics class. During the first and second report periods, School A used Big Ideas Math (Larson & Boswell, 2014) and covered units addressing factors, division of fractions, and decimal operations; School B used Connected Math Project (Lappan, Difanis Phillips, Fey, & Friel, 2014) and covered factors, models, and fraction operations.
Pre- and posttesting
Trained research assistants administered the fractions screener in Week 3 of the school year in students’ regular mathematics classroom during the mathematics class period. In Week 4, participants were administered the FNLE task and the fraction arithmetic measures in their regular mathematics classroom. Research assistants administered posttests (FNLE, fraction concepts, and fraction arithmetic) the day after completion of the intervention. The delayed posttests, which were identical to the posttests, were administered in the same manner 7 weeks after the posttest, a time frame that was determined by school schedules.
Instructional Approach
Table 1 summarizes the scope and sequence of the intervention lessons. Lesson goals reflect the CCSS-M with respect to fraction instruction for third to fifth grades (NGACBP & CCSSO, 2010) as well as the three components of fraction sense stated earlier. Individual intervention activities were designed to also reflect the following instructional approaches that aim to improve fraction sense:
Scope and Sequence of the Fraction Intervention Lessons.
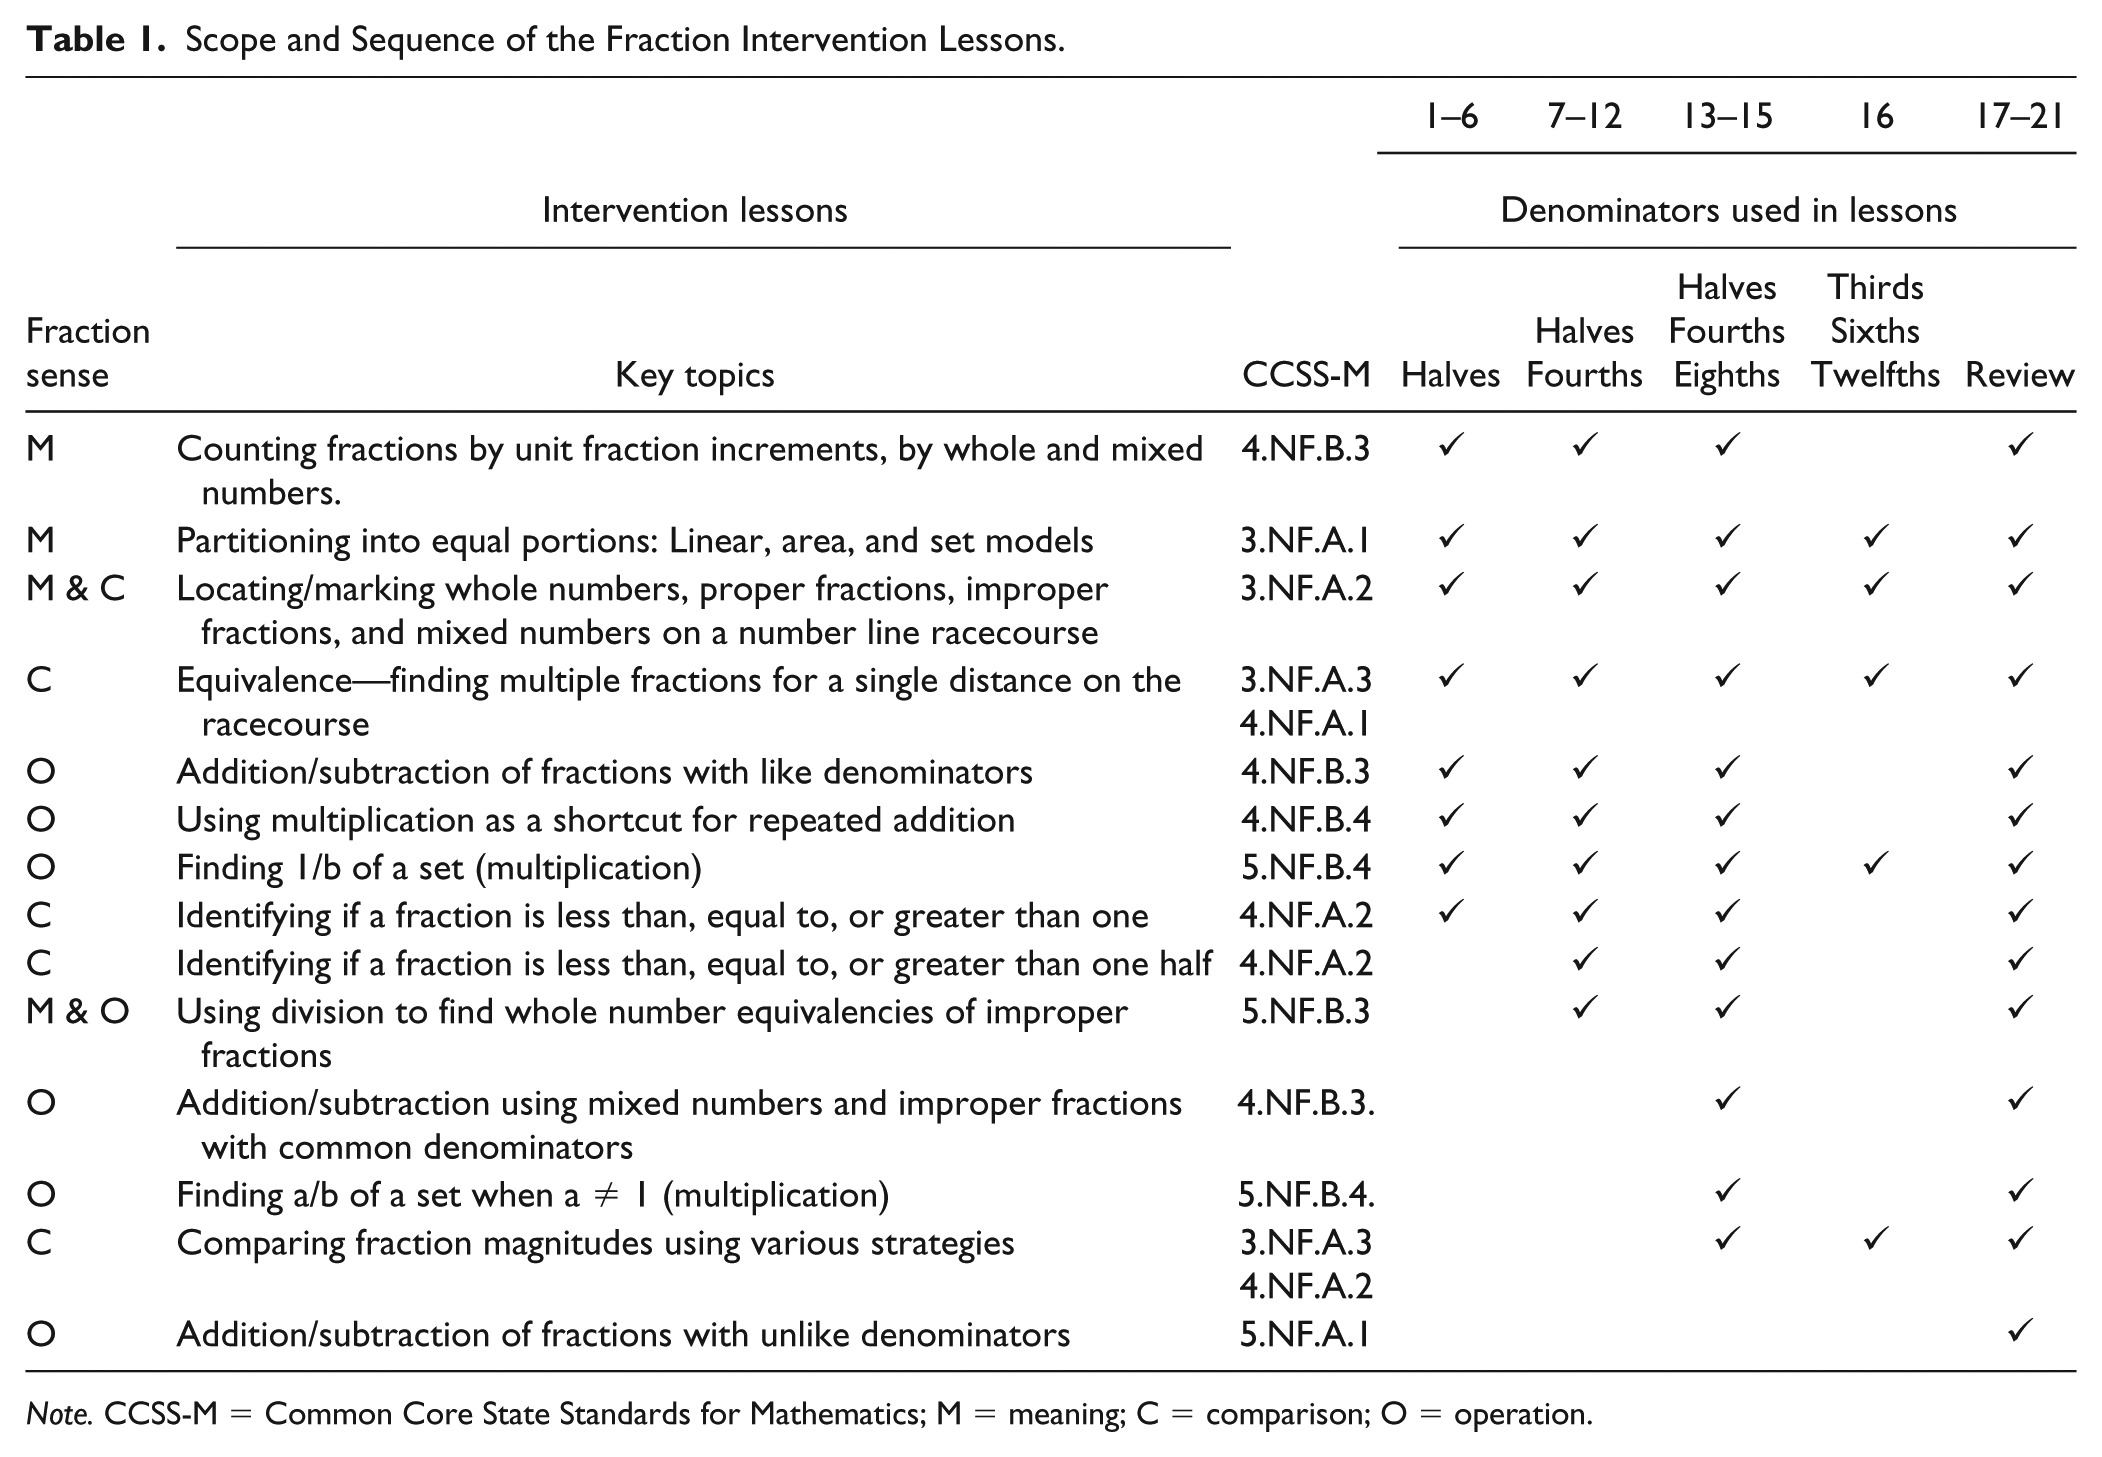
Note. CCSS-M = Common Core State Standards for Mathematics; M = meaning; C = comparison; O = operation.
Using a meaningful context centered on a visual number line
We anchored instruction within a meaningful narrative, namely, a color run race for charity, to help struggling learners think about fractions in a practical sense (Bottge et al., 2014). The race context allowed the use of the number line to build fraction concepts (e.g., finding fractions of a mile). Number lines encouraged students to (a) think about fractions as numbers that have magnitudes just as whole numbers do, (b) see relationships between whole number magnitudes and fraction magnitudes, and (c) visually represent relationships between fractions of different or equivalent magnitudes. Intervention activities also incorporated more familiar representations such as fraction bars and set models to strengthen understanding and promote flexibility (Dienes, 1971).
Presenting a narrow range of denominators
Previous research shows struggling learners develop number sense when key concepts are introduced with just a few familiar numbers (e.g., Dyson, Jordan, Beliakoff, & Hassinger-Das, 2015). Similarly, our intervention began with the familiar denominator of two, or halves (Siegler et al., 2011). Students consolidated their understanding of fraction concepts (e.g., fraction notation, equal-sized portions, the nature of the whole, fraction magnitude, fraction addition and subtraction) without adding the confusion of changing the number of partitions. New denominators were introduced one at a time in lessons following a logical progression (i.e., halves, fourths, eighths, and later thirds, sixths, and twelfths).
Enhancing understanding of fraction equivalence through partitioning
Students with mathematics difficulties often use inappropriate strategies when approaching problems involving fractions, because they have a limited understanding of fraction equivalence (Jordan et al., 2017; Newton, Willard, & Teufel, 2014). Beginning with the familiar fraction of one half, students partitioned linear representations into two equal lengths or distances. In subsequent lessons, students created fourths by separating each half into two equal parts, and finally eighths by separating fourths into two equal parts. This process encouraged students to think about equivalence of fractions with varying denominators as they marked equivalent fractions on the racecourse and to apply this understanding to fraction operations.
Fostering flexibility through mismatch of denominators and partitions
Problems such as “Shade 3/4 the rectangle” when the rectangle is separated into four equal parts are easy for even students who are low-performing (Jordan et al., 2017). However, the problem, “Shade 3/4 of a rectangle” when it is partitioned into eight equal parts requires deeper knowledge (Bright, Behr, Post, & Wachsmuth, 1988). Thus, our intervention provided practice in denominator/partition mismatch problems.
Working with improper as well as proper fractions
Typical fractions instruction, at least in the early stages, focuses on fractions less than one (even when a number line approach is used; Vosniadou, Vamvakoussi, & Skopeliti, 2008), which contributes to the common misunderstanding among low achievers that fractions are small numbers less than one (Resnick et al., 2016). Early in our intervention, students were required to locate fractions on number lines that extended beyond the value of one.
Developing multiplicative reasoning and fluency
Students engaged in speeded practice of whole number multiplication problems with products up to 24 to develop fluency and lessen the load on working memory. Using these multiplication skills, students also found equivalent fractions as well as whole number/fraction equivalencies and mixed number/fraction equivalencies.
Lesson Structure
Each intervention lesson included six predictable activities. Shorter activities, rather than one long lesson, hold students’ attention and provide a variety of contexts for learning (Gersten et al., 2009). The six activities were as follows:
Warm up
Warm ups were individual activities, which reviewed content from the previous lesson(s) to activate prior knowledge, encourage cumulative understanding, and allow instructors time to work one-on-one with students to address individual needs.
Exercises
Exercises consisted of oral counting activities. Using a four-mile racecourse as a visual model, students counted aloud from left to right using fractions only, focusing attention on increasing fraction magnitude (e.g., one fourth, two fourths, three fourths, four fourths, five fourths, . . .), or using whole and mixed numbers, focusing attention on patterns and regularities in the counting sequence (e.g., one fourth, two fourths, three fourths, 1, one and one fourth, one and two fourths, one and three fourths, 2, . . .).
Huddle
This was the explicit instruction time of the intervention using the above-mentioned instructional approaches. Students worked on a paper-and-pencil or hands-on activity during this instructional time. This, together with regular feedback from students, allowed instructors to monitor individual student understanding throughout the lesson. The huddle segment also included fast-paced games that targeted fluency with fractions (Fuchs et al., 2014) such as showing a fraction and asking, “Is this fraction greater than, less than, or equal to one?” The game time provided another opportunity for instructors to monitor individual student progress and give feedback.
Practice
Each practice segment had an activity sheet with problems similar to those used in the instruction phase of the intervention. These problems were interleaved with problems from previous activities to provide cumulative review and skill maintenance. Students worked independently and instructors provided individual corrective answer and strategy feedback.
Sprint
Students participated in speeded games in an attempt to increase multiplication fluency. Multiplication combinations corresponded to fractions covered in that lesson as well as those in previous lessons. Students were given immediate corrective feedback for errors such that students’ final response was always correct.
Cool down
In the final 3 min of each lesson, students were given an independent activity, which served as a formative assessment to monitor student progress.
Training of Intervention Instructors
Trained research assistants (three graduate students trained in development and administration of interventions with struggling students, two postdoctoral fellows with expertise in mathematics learning, and two former mathematics teachers), who also participated in lesson design, delivered intervention lessons. Intervention instructors received a total of 8 hr of training before the intervention began. Training included practice in use of gestures, error correction procedures, and instructor/student dialogue. Weekly 1-hr meetings throughout the intervention period provided instructors opportunities for debriefing on lessons already taught and training on upcoming lessons.
Fidelity of Implementation
Lessons were scripted and audio recorded to ensure fidelity of implementation. After the conclusion of the intervention, trained research assistants listened to six randomly selected lessons per instructor. Required activities completed per lesson were recorded on a chart. A percentage of completeness was calculated using a weight of time per activity out of a total of 45 min (e.g., if a 5-min activity was not completed, one ninth or 11% was removed from that lesson fidelity). Each lesson was coded by two research assistants and any discrepancies found were resolved. Instructors administered an average of 93% of all scripted intervention activities to students. Missing activities primarily resulted from lack of time due to natural classroom disturbances (e.g., announcements, fire drills, student tardiness, behavioral issues, etc.).
Data Analysis Procedures
Prior to analyses, data entry for all measures was entered and checked for accuracy by two trained research assistants. All discrepancies were resolved until there was 100% agreement. Chi-square analyses and t tests were conducted to ensure equivalence between conditions and between schools on pretest measures.
To test overall effectiveness of the intervention, we ran a series of one-way ANCOVA for each measure (FNLE, fraction concepts, and fractions arithmetic) at immediate and delayed posttest controlling for its corresponding pretest score (Field, 2009; Maxwell & Delaney, 2004). Effect sizes were calculated using Hedges’s g, as recommended for relatively small sample sizes. Hedges’s g can be interpreted using Cohen’s (1988) convention of small (.2), medium (.5), and large (.8). However, according to What Works Clearinghouse: Procedures and Standards Handbook, Version 3.0 (U.S. Department of Education, Institute of Education Sciences, 2014), when evaluating the effectiveness of an intervention, a g of .25 is indicative of effective educational practice. Cohen’s U3 and improvement indices were calculated to determine the percentile rank of students in the intervention group who performed at the level of an average control student who, by definition, ranks at the 50th percentile (U.S. Department of Education, Institute of Education Sciences, 2014). For example, a U3 of .70 corresponds to an improvement index of 20% (.70 – .50 = .20); that is, the average intervention student scored 20 percentile points higher than the average control group student.
Results
There were no significant differences between the intervention and control groups at pretest on measures of fraction concepts (MControl = 12.89, SD = 2.36; MIntervention = 13.32, SD = 2.66), fraction magnitude (MControl = 23.25, SD = 6.77; MIntervention = 20.47, SD = 8.59), or fraction arithmetic (MControl = 3.19, SD = 4.36; MIntervention = 4.20, SD = 1.87; ps > .05). Results of six ANCOVAs assessing differences in each of the three outcomes at immediate and delayed posttest controlling for corresponding pretest along with effect size are displayed in Table 2.
ANCOVA Results With Corresponding Pretest of Each Measure as a Covariate and Effect Sizes.
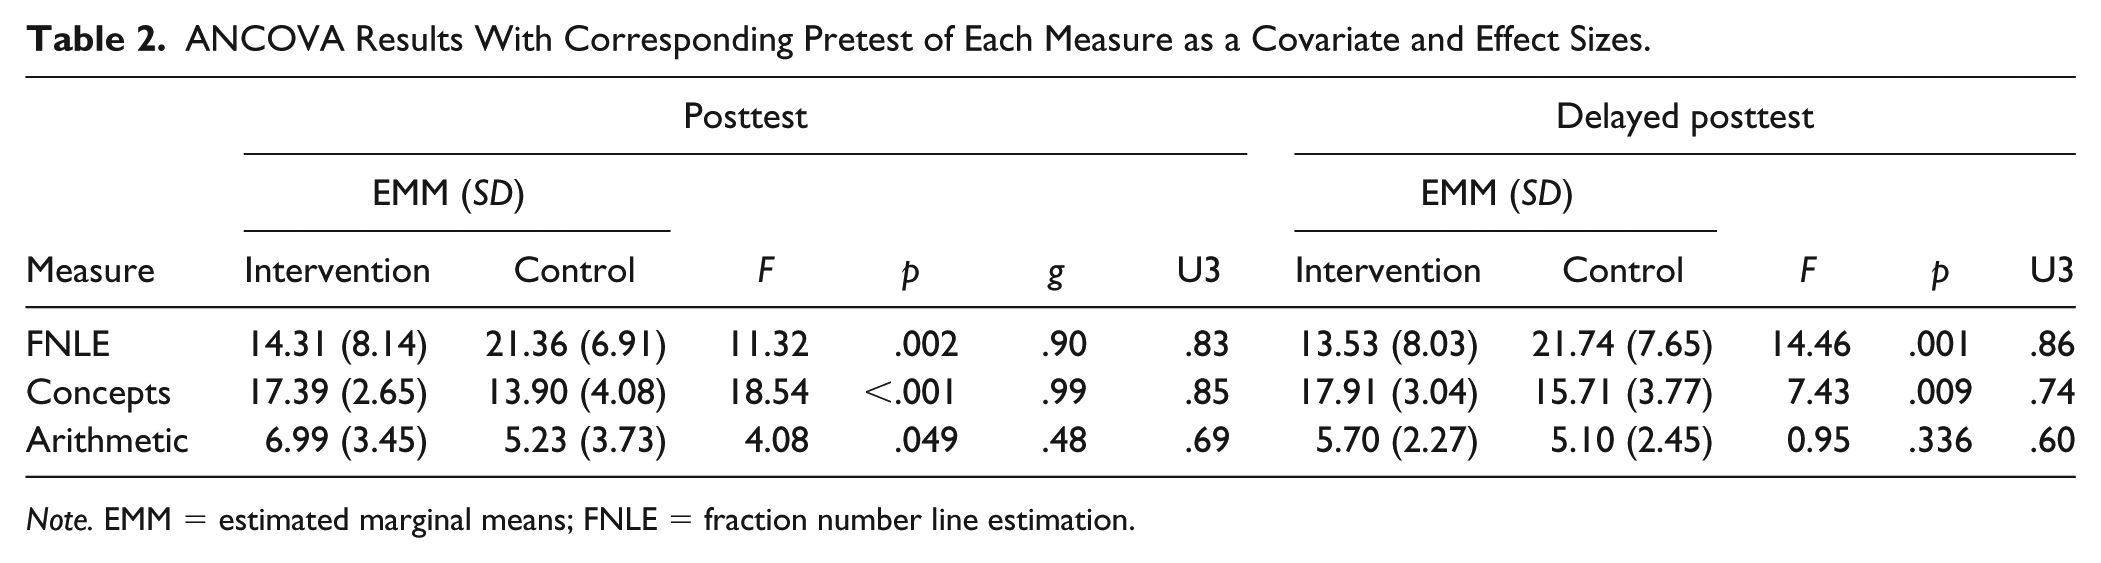
Note. EMM = estimated marginal means; FNLE = fraction number line estimation.
The intervention group’s FNLE performance was significantly higher than the control group and yielded a large effect at posttest, F(1, 36) = 11.316, p = .002, g = .90, and delayed posttest, F(1, 36) = 14.459, p = .001, g = 1.02. According to U3 indices, the average intervention student had higher accuracy/less error on the FNLE task than 83% and 86% of the students in the control group at posttest and delayed posttest, respectively.
The intervention group’s fraction concepts performance was significantly higher than the control group and yielded a large effect at posttest, F(1, 49) = 18.540, p < .001, g = .99, and a medium-large effect at delayed posttest, F(1, 49) = 7.434, p = .009, g = .63. The average intervention student had higher performance on the fraction concepts measure than 85% of the students in the control group at posttest and 74% of the students in the control group at delayed posttest. Although the effect at delayed posttest was smaller than at pretest, it was still medium-large and practically meaningful. This is a particularly important finding, as many interventions experience a fade-out effect at delayed posttest (e.g., Bailey et al., 2016).
The intervention group’s fraction arithmetic performance was significantly higher than the control group and yielded a medium-large effect at posttest, F(1, 49) = 4.077, p = .049, g = .72, but was no longer significant at delayed posttest, F(1, 48) = 0.946, p = .336, g = .35. According to U3 indices, the average intervention student had higher performance on the fraction arithmetic task than 69% of the students in the control group at posttest.
Discussion
Our intervention, which focused on developing fraction magnitude knowledge, improved fraction outcomes for sixth graders with or at risk for mathematics difficulties. Students who received the intervention outperformed their peers in the control group on measures of fraction magnitude, fraction concepts, and to a lesser extent, fraction arithmetic. The findings extend previous work by Fuchs and colleagues (Fuchs et al., 2013; Fuchs et al., 2014) who found that an intervention with a similar focus improved fraction skills in younger children; however, we expand upon their work by showing many of the effects of the intervention held over time. We were heartened to see that for both fraction magnitude and fraction concepts, students in the intervention group continued to outperform the control group 7 weeks after the intervention.
Performance on the FNLE task in comparison with a normative sample reported in prior research was of particular interest. In a longitudinal study, Resnick et al. (2016) uncovered three empirically distinct growth trajectories on a parallel FNLE task starting in fourth but ending in sixth grade: students who started accurate and ended accurate (Group 1), students who started inaccurate but ended much more accurate—although lower than students in Group 1 (Group 2), and students who started inaccurate and ended inaccurate (Group 3). Growth group (i.e., one, two, or three) accurately predicted sixth-grade math achievement on a standardized state test, with students in Group 3 typically failing to meet standards. At pretest, our study participants achieved an average PAE score that was similar to students in Resnick et al.’s low Group 3 in sixth grade. At posttest, the control group continued to look like Group 3. This finding suggests neither classroom instruction nor the typical school intervention improved the fraction magnitude understanding of students who were low performing. However, students who received the intervention in the current study received a mean posttest PAE close to the average sixth-grade PAE score for children in Resnick’s middle growth group (Group 2). This narrowing of the gap between a low-achieving group to an average-achieving group is yet another indicator of a meaningful intervention effect (Lipsey et al., 2012).
Although the effect size for fraction concepts showed a slight decrease from post to delayed posttest, the effect was still medium-large at delayed posttest. The control group’s growth from posttest to delayed posttest in fraction concepts (which brought them closer to parity with students who received the intervention) most likely reflects general classroom instruction in fractions that was provided during the period between the immediate and delayed posttest. However, we conjecture fraction concepts learned through the intervention helped students benefit from general instruction in fractions, reflected by their sustained lead over the control group at delayed posttest.
Although fraction arithmetic was not targeted in the present intervention, we expected students who received the intervention would apply what they learned about fraction operations to solve fraction arithmetic problems accurately. For example, in our intervention, students practiced “trading” equivalent fractions to ensure fractions had same-sized parts (denominators) before adding. However, rather than applying these strategies to solve fraction arithmetic problems at posttest, students in both groups often misapplied procedures that presumably had been taught in school (e.g., using the procedure for converting a mixed number to an improper fraction when they should have been multiplying a whole number times a fraction). Prior work suggests students struggle to apply their knowledge of fraction magnitudes to fraction arithmetic (Bailey, Hansen, & Jordan, 2017). Going forward, future interventions should directly address procedures taught in classrooms and then scaffold students in connecting their new understandings of fraction magnitudes to these procedures.
Limitations and Future Direction
A limitation of the study was potential variability in instruction provided in the business-as-usual control condition, a problem associated with conducting research in schools. In School A, all students in the control group were in a mathematics intervention class while only some students in School B received a consistent mathematics intervention. As such, some of the results could be attributed simply to additional mathematics instruction, although the differential findings according to the intervention emphasis argue against this interpretation. Future studies should obtain specific information as to what topics students were exposed during their intervention class as well as data regarding students’ SPED and Individualized Education Program (IEP) status.
Another limitation was the delayed posttests assessed students’ accuracy on conceptual and arithmetic items but not on students’ maintenance of specific strategy use. Future studies should consider including an analysis of strategy use to see whether students maintain or continue to choose the strategies they were taught.
Finally, even though use of a fractions screener limited our sample to students at risk for difficulties, there was still a wide range of abilities in our students. Most of our randomized instructional groups included some students who were more advanced than others. Future interventions should more thoroughly consider individual differences. Collecting a range of cognitive measures could enable us to determine whether responses to our intervention might differ by certain abilities. This in turn might help teachers adjust activities to meet the needs of more students.
In conclusion, our intervention, which was situated in a meaningful context and focused on a number line representation of fractions, led to greater fraction magnitude understanding and fraction conceptual knowledge more generally, compared with business-as-usual practices in school. Because fraction magnitude understanding is crucial for success in algebra as well as in general mathematics (Siegler et al., 2012), the present findings add a key piece to the instructional puzzle for helping students with or at risk for mathematics difficulties and disabilities.
Footnotes
Associate Editor:
Nicholas Gage
Declaration of Conflicting Interests
The author(s) declared no potential conflicts of interest with respect to the research, authorship, and/or publication of this article.
Funding
The author(s) disclosed receipt of the following financial support for the research, authorship, and/or publication of this article: This research was supported by Awards R305B130012 and R324A160127 from the U.S. Department of Education, Institute of Education Sciences.