
Abstract
Special education teacher (SET) stress and burnout is a significant problem. A total of 490 special education teachers were surveyed across the United States. The purpose of this study was to (a) assess and compare three measures of burnout/work engagement, the Maslach Burnout Inventory (MBI), the Oldenburg Burnout Inventory (OLBI), and the Utrecht Work Engagement Scale (UWES) and (b) examine change over the course of a school year that coincided with the COVID-19 pandemic. Significant measurement quality issues were observed for the MBI and OLBI, including questionable convergent validity. Burnout of SETs was found to be highly stable for the MBI and OLBI. Teachers experienced little mean change in burnout over the school year, and perceptions of the effects of COVID and demographic and school variables were generally not predictive of change in burnout for any measure. Implications are discussed.
Attrition is the long-term consequence of chronic and unaddressed stress and burnout (Brunsting et al., 2014)—an issue especially pronounced for special education teachers (SETs) that has only worsened with the COVID-19 pandemic (Brunsting et al., 2023; McGrew et al., 2023). A nationwide survey of 468 SETs conducted in the winter of 2020 revealed that diagnostic prevalence rates of generalized anxiety disorder and major depressive disorder were 12.4 and 5.6 times the rate observed in normative samples in the United States, respectively (Cormier, McGrew, et al., 2022). Burnout is strongly related to depressive symptomatology (Bianchi et al., 2018), and when unaddressed, teacher burnout leads to poor teacher–student relationships, lower instructional quality, and most importantly, worse student educational outcomes (Covell et al., 2009; Dykstra et al., 2013; Jennings & Greenberg, 2009; Madigan & Kim, 2021; Maricuţoiu et al., 2023). For a workforce that was already experiencing significant issues of attrition (Billingsley & Bettini, 2019) with 98% of states in the United States reporting special education shortages (U.S. Department of Education, 2020), these alarmingly high rates of mental health impacts pose significant concerns that are costly for schools, teachers, and students.
Burnout has been assessed by different measures such as the Maslach Burnout Inventory (MBI; Maslach et al., 1986), the Oldenburg Burnout Inventory (OLBI; Demerouti et al., 2003), and the Utrecht Work Engagement Scale (UWES; Schaufeli et al., 2006). The MBI is the most common measure and has been used for more than 40 years representing more than 90% of studies around the world surrounding burnout (Schaufeli & Enzmann, 1998). A cursory search using the MBI as the search term in Google Scholar produced more than 25,400 results. With respect to educators, historically, the MBI is the primary measure for evaluating SET burnout (Bettini et al., 2017; Garwood et al., 2018; Hopman et al., 2018). The OLBI has been used less frequently than the MBI (Karavasilis, 2019), and the literature is even more sparse for the use of the OLBI with SETs. Studies on the UWES are available, but from other countries (c.f., Simbula et al., 2013), and none for SETs.
Burnout, as defined by the MBI (Maslach et al., 1986), is a three-dimensional construct characterized by emotional exhaustion (EE), depersonalization (DP), and reduced personal accomplishment (PA). EE refers to feelings of being emotionally overextended, DP refers to maladaptive and cynical attitudes and feelings toward others, and PA refers to the negative evaluation of oneself in relation to one’s job. The OLBI assesses exhaustion and disengagement from work. In addition to emotional aspects, exhaustion as assessed by the OLBI includes physical and cognitive aspects, which differentiates it from the MBI (Demerouti et al., 2003). The inclusion of cognitive aspects to one’s work is particularly relevant for SETs whose task demands include complex problem-solving skills involving assessment, development, and implementation of individualized student goals and education plans and collegial interaction and collaboration for support of implementation of instructional plans. The opposite of burnout, work engagement, has also been used to assess commitment to one’s work with the UWES. Work engagement represents a positive work-related experience representative of dedication, high levels of energy, and enthusiasm.
Despite the robust history of burnout research, researchers voiced concerns about its measurement. For example, questions for the MBI include the internal consistency of some of subscales (Wheeler et al., 2011), a focus on emotional vs. physical aspects related to burnout (Demerouti et al., 2010), use of the three-factor structure (Hawrot & Koniewski, 2018; Schwarzer et al., 2000; Szigeti et al., 2017), and unidirectional wording of the items (Demerouti et al., 2003, 2010; Halbesleben & Demerouti, 2005; Kristensen et al., 2005). Wheeler et al. evaluated the internal consistency reliability on the three MBI subscales. PA and DP alpha estimates fell below the levels recommended for determining burnout. Hawrot and Koniewski (2018) examined the construct validity of the MBI-Educators survey using confirmatory factor analysis. Rather than validating the oblique three-factor structure of the MBI, a bifactor model with a general burnout factor and three specific factors of PA, DP, and EE produced the best fit for the data. Further analysis suggested a unidimensional MBI total score was appropriate to use and interpret. Finally, each subscale of the MBI is worded in one direction: EE and DP are phrased negatively, while PA is phrased positively. It may be difficult for raters to endorse negatively worded statements while also agreeing with positively worded statements (Demerouti et al., 2010).
For intervention researchers, however, there are additional unknowns that may have important consequences. For example, it is not clear which burnout tool, if any, is the best outcome measure for evaluating the effectiveness of a burnout reduction intervention. If the burnout measure used is insensitive to the intervention, it has the potential to result in a Type 2 statistical error, falsely deeming a promising or even effective intervention as ineffective. Furthermore, issues of internal consistency and reliability may also mask effects and lower statistical power; studies involving SETs have frequently found low to moderate internal consistency in some burnout subdomains (e.g., Brunsting et al., 2022; Robinson et al., 2019; Squillaci, 2021). The chronicity, stability, and unvarying nature of burnout over time have been replicated (Brouwers & Tomic, 2000; Burke & Greenglass, 1995; Cece et al., 2021; Hakanen et al., 2008; Schaufeli & Enzmann, 1998; Taris et al., 2005) and for the MBI at the subscale levels for EE, DP, and PA (Brouwers & Tomic, 2000). Researchers of burnout interventions report no, small, or mixed effects with the MBI and its subscales when used as an outcome measure (Fraiman et al., 2022; Kestian, 2020). As an example, in a controlled study with classroom teachers, Montero-Marin et al. (2021) compared an instructor-less versus self-led mindfulness intervention. The frequency of use of mindfulness practice was associated with changes in several self-report measures of outcomes such as mindfulness, self-compassion, mental well-being, anxiety, depression, and stress in both conditions. The single exception was a failure to detect a change in MBI scores. In other words, while the intervention produced numerous positive effects on stress and well-being, ratings on the MBI were not one of them, a finding replicated from another test of a different mindfulness curriculum (Fraiman et al., 2022). To add further confusion, researchers may use a single score for the MBI rather than the subscale scores (Montero-Marin et al., 2021; Szigeti et al., 2017). The developers of the MBI recommend that separate scores for each of the subscales be used because of differential response patterns observed based on the burnout outcome assessed (Maslach et al., 1986). Thus, there may be a need to (re)consider the MBI as a primary intervention effectiveness outcome measure in future research and carefully use it in how the measure is applied (separate scores for each domain vs overall mean score). If burnout is truly a stable construct then negative results in intervention studies are to be expected. However, it may also be the case that the responsiveness of the burnout construct is not adequately captured by the burnout measures commonly employed in intervention studies.
Most of the research on special education teacher burnout has focused on understanding its antecedents rather than measurement. Several researchers have identified the job demands associated with teacher burnout, and several comprehensive reviews are available (Billingsley & Bettini, 2019; Brunsting et al., 2014; Park & Shin, 2020). Factors identified include student factors, school factors, working conditions, and teacher factors, including intrapersonal factors. For student factors, teachers of students who are older and with more complex diagnoses or behavioral disorders report higher burnout (Frank & McKenzie, 1993; McLeskey et al., 2004; Nichols & Sosnowsky, 2002; Singer, 1993). School factors have received the most attention and have identified teachers from high-poverty schools, high-minority schools, schools located in the southern United States, and schools located in urban areas as reporting higher burnout (Abel & Sewell, 1999; Carver-Thomas & Darling-Hammond, 2019).
Teacher factors associated with burnout include experience, race, and gender. Findings indicate that young or inexperienced special education teachers (Bettini et al., 2017; Billingsley, 2004; Zabel & Zabel, 2002) report higher burnout. Furthermore, the intersections of race and gender have been explored broadly, but they have received limited attention in special education. For example, Scott et al. (2021) conducted a literature review of attrition and retention of special education teachers. The review revealed that of 47 articles examined over a 10-year period, researchers have nearly ignored disaggregating results to explore factors of attrition and retention related to teacher ethnoracial identities. There are unique factors that exist that impact stress, burnout, and mental health among teachers of color broadly (Cormier et al., 2021), even more pressing is how these racialized experiences in schools impact special education teachers of color (Scott et al., 2022; Trainor et al., 2019). Among these are being hypervisible to take on additional roles as cultural brokers and schoolwide disciplinarians and being devalued as an educator in the field of special education (see Cormier et al., 2021), as well as issues associated with stress, burnout, and mental health of special education teachers of color compared with White special education teachers.
Given the limited research that has been conducted related to SET and burnout, the clinical significance of the study of burnout, and the equally important need for clarity of relevant and sensitive outcome measures for intervention researchers, the purpose of this study was twofold to (a) assess and compare three measures of burnout/work engagement, the MBI (Maslach et al., 1986), the OLBI (Demerouti et al., 2003), and the UWES (Bakker et al., 2003) with data collected at two timepoints during a school year coinciding with the COVID-19 pandemic, and (b) examine change in burnout/work engagement over the course of a school year that coincided with the COVID-19 pandemic and compare that change with teacher stress, teacher demographic variables, and school variables. Understanding how different burnout/work engagement measures compare may inform future research on SET burnout. Specifically, we address the following research questions:
Method
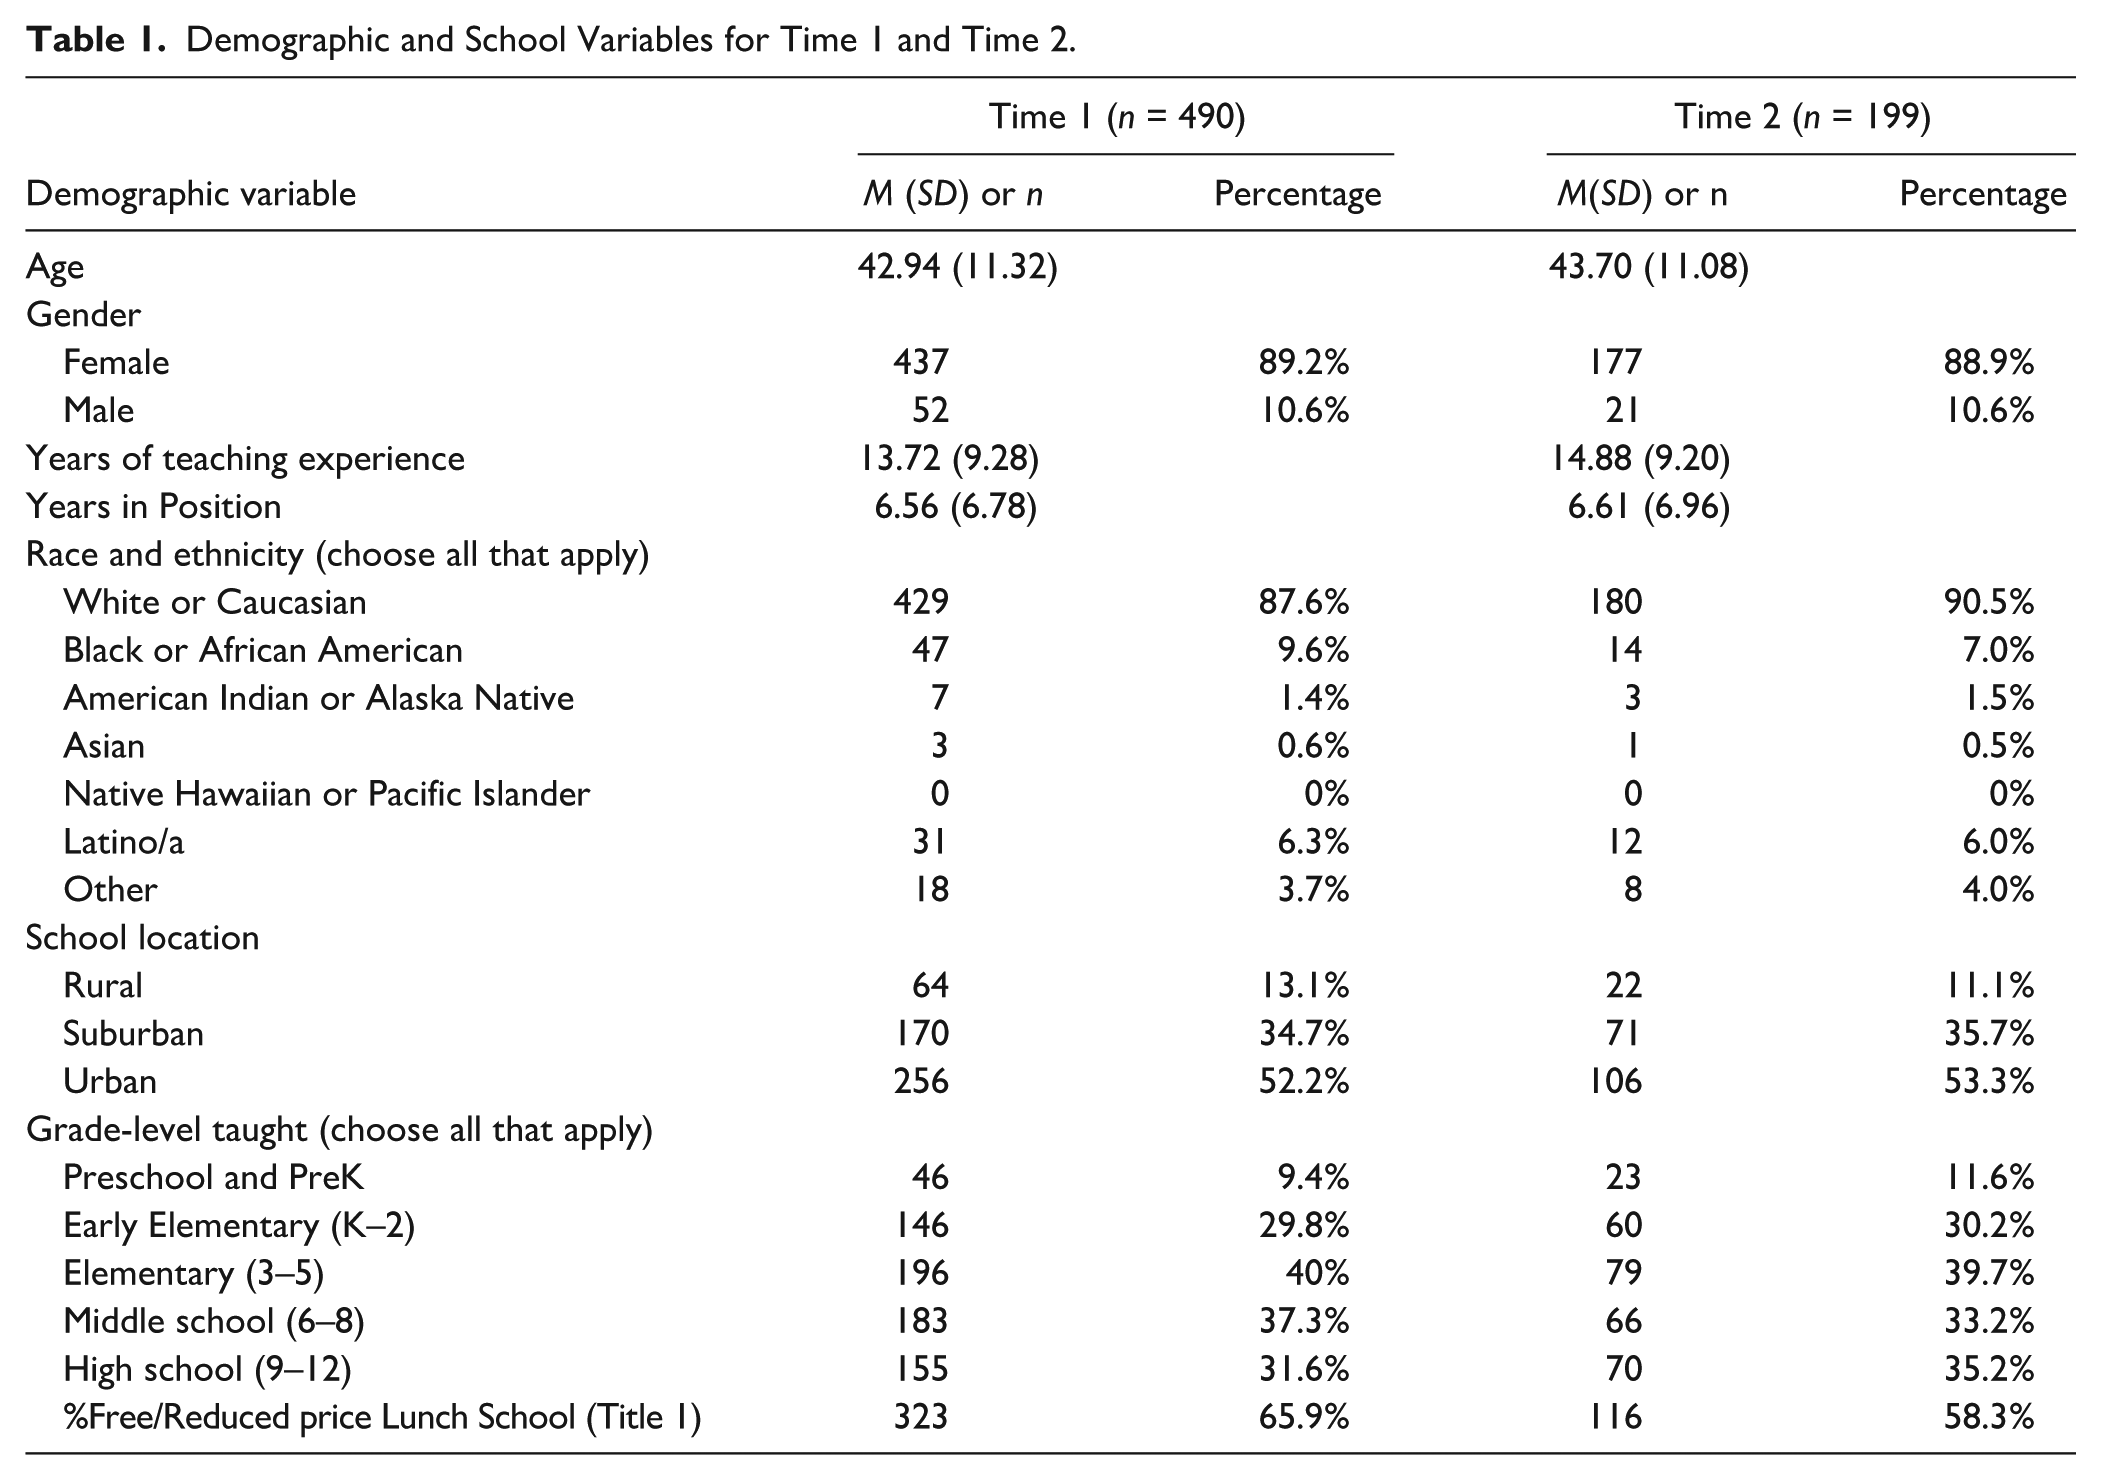
Participants were SETs at public or charter schools in the United States (see Table 1). A recruitment flyer was generated and distributed to personal and professional contacts, social media, school districts, and professional teacher organizations. Across the United States, participants completed surveys of the variables over two time points: Time 1 (October-November 2020) and Time 2 (May 2021). Participants who completed Time 1 were invited to complete Time 2 with no new teachers recruited. Participants received no incentives for participation. Teacher and school demographic information and teacher intrapersonal variables were obtained at Time 1 only. Time 2 included an assessment using all three outcome measures: the MBI, the OLBI, and the UWES. The survey was administered using Qualtrics®. The study was approved by the IRB at the institution of the first author.
Demographic and School Variables for Time 1 and Time 2.
Measures
Background Information
Teachers were asked to provide demographic and school background information. Information such as age, gender, race/ethnicity, type and location (state) of school, whether the school was a Title 1 school, years of experience teaching, years of experience in current position, number of IDEA category(ies) of students taught, type of classroom taught (resource, inclusive, self-contained; specialty school) and grade level taught (see Table 1).
Impact of COVID-19 on Emotional Exhaustion and Stress
To understand the impact of the pandemic on teachers, two single-item questions were asked at the end of the school year (Time 2): (a) how has the COVID-19 pandemic impacted your emotional exhaustion and (b) your stress. Participants were asked to rate these items on a 5-point Likert-type type response scale (1 = not at all to 5 = extremely).
Outcome Measures of Burnout and Engagement
Burnout
The Maslach Burnout Inventory, Educator’s Survey (MBI-ES; Maslach et al., 1986) assesses teacher burnout. The MBI-ES consists of three subscales: (a) emotional exhaustion (EE; 9 items), (b) depersonalization (DP; 5 items), and (c) personal accomplishment (PA; 8 items). Participants were asked to rate how frequently they felt burned out at work on a seven-point Likert-type type response scale (0 = never to 6 = every day). Items were averaged to produce overall subscale scores. Higher scores on the emotional exhaustion and depersonalization subscales and lower scores on the personal accomplishment subscale indicated higher levels of burnout. According to Squillaci (2020), emotional exhaustion scores below 18 are considered to represent a correct level, scores between 18 and 29 are considered at risk, and scores greater than 29 represent a dangerous level; for depersonalization, scores below 6 are correct, between 6 and 11 are at risk, and above 11 are dangerous; and for personal achievement, scores above 39 are correct, between 34 and 39 are at risk, and below 34 are dangerous. Internal consistency of the sample at Time 1 was ⍺=.899 and ⍵=.902 for the EE subscale, ⍺=.667 and ⍵=.636 for the DP subscale, and ⍺=.723 and ⍵=.719 for the PA subscale. Internal consistency of the sample at Time 2 was ⍺=.910 and ⍵=.919 for the EE subscale, ⍺=.631 and ⍵=.616 for the DP subscale, and ⍺=.708 and ⍵=.725 for the PA subscale.
The Oldenberg Burnout Inventory (OLBI) is a 16-item measure burnout (Demerouti & Bakker, 2008). The OLBI consists of two subscales, exhaustion (EXH; including affective, cognitive, and physical components) and disengagement (DIS; including distancing oneself from work goals and work content specifically and from work generally). The 16 items are distributed evenly across the two subscales and include positively and negatively worded items. Items that are positively framed are reverse-scored before creating subscale totals. Items on both subscales were summed to create total scores, with higher scores indicating higher levels of burnout. Internal consistency of the sample at Time 1 was ⍺ = .771 and ⍵ = .786 for the EXH subscale and ⍺ = .778 and ⍵ = .785 for the DIS subscale. Internal consistency of the sample at Time 2 was ⍺ = .740 and ⍵ = .783 for the EXH subscale and ⍺ = .785 and ⍵ = .759 for the DIS subscale.
Work Engagement
The abridged version of the Utrecht Work Engagement Scale was used to assess work engagement (Schaufeli et al., 2006). The UWES measures work engagement in three domains: vigor, dedication, and absorption. Participants self-report their perception of their work engagement on a five-point Likert-type response scale (0 = never to 5 = almost always). The original version of the UWES consists of 19 items, but the current study utilized a six-item version that assessed work engagement in the domains of vigor and dedication. Schaufeli and colleagues (2006) recommended using total scores for the shortened version to reduce issues of multicollinearity given the high correlations between domains. Therefore, items were averaged to produce an overall score, with higher scores indicating higher levels of work engagement. Internal consistency of the current sample was ⍺=.895 and ⍵=.888 at Time 1 and ⍺=.888 and ⍵=.881 at Time 2.
Data Analysis
Research Question 1: Internal Structure
To assess the longitudinal measurement invariance of the MBI, OLBI, and UWES, a longitudinal confirmatory factor analysis (CFA) framework was employed using Mplus (Muthén & Muthén, 2023) utilizing the MLR estimator to make standard errors and likelihood ratio tests robust to non-normality in item responses. Measurement invariance testing was performed by applying increasingly restrictive constraints to model parameters across time points. The first model tested for each instrument was a configural model, in which a standard correlated traits model was fit combining both time points. For example, the configural model for MBI had separate factors for EE, DP, and PA at each of the two time points. To account for item-specific variance, correlation between timepoints was allowed for each item individually. Model fit was evaluated by chi-square test, comparative fit index (CFI; adequate fit > .90, good fit > .95), root mean square error of approximation (RMSEA; good fit < .05), and standardized root mean square residual (SRMR; good fit < .08) (Browne & Cudeck, 1993; Hu & Bentler, 1999). In the event of a poor fit of the configural model, modifications were considered so that a well-fitting model could be used as the beginning of the measurement invariance testing procedure (Jorgensen, 2017). Modifications were considered and employed based on published empirical measurement studies, large residual correlations within the configural model, and exploratory factor analysis (EFA) models at each time point.
Once a well-fitting configural model was fit, a sequence of increasingly restrictive models was fit and their fit was compared. The first such model, the weak invariance model, adds equality constraints to factor loadings for each item across timepoints The second model, the strong invariance model, adds equality constraints to intercepts for each item across time points. The final model, the strict invariance model, adds equality constraints to residual variances for each item across time points. Model comparisons were conducted using a likelihood ratio test; models were deemed invariant if the was not significant (p > .05). Even if the likelihood ratio test was significant, measurement invariance was still concluded if differences in the root mean square error of approximation (ΔRMSEA) was ≤.015 (Chen, 2007) and the difference in comparative fit index (ΔCFI) was ≥−.01 (Cheung & Rensvold, 2002).
Research Question 2: Convergent Validity Evidence
To assess whether MBI subscales, OLBI subscales, and the UWES measure the same burnout construct, correlations among subscales at both time points were computed. In addition, an EFA was conducted in Mplus (Muthén & Muthén, 2023) using the six observed subscores as indicators. The number of factors to extract was determined by visual inspection of the scree plot (Cattell, 1966).
Research Question 3: Stability of Burnout
To answer the third question about the stability of burnout over the school year, descriptive and inferential statistics were used. Descriptive statistics for MBI subscales, OLBI subscales, and the UWES at Time 1 and Time 2 were computed. Next, repeated measures t tests for MBI subscales, OLBI subscales, and the UWES to determine whether any overall change in levels of burnout could be detected across time points were applied. As a sensitivity analysis, this t test was replicated in the strict measurement invariance models. All analyses for the third, fourth, and fifth research questions were performed using R (R Core Team, 2023).
Research Question 4: Impact of the COVID-19 Pandemic
To answer the fourth research question concerning the impact of COVID-19 on emotional exhaustion and stress, teacher responses were summarized and also correlated with both burnout at Time 2 and change in burnout (Time 2—Time 1) for each MBI, OLBI, and UWES domain. As the impact of COVID-19 items is ordinal, Kendall’s tau-b was used to assess correlations.
Research Question 5: Covariates of Burnout
For our fifth question on teacher and school predictor variables of change in burnout, we computed correlations for change scores (Time 2—Time 1) of subscales of the MBI, the OLBI, and the UWE with demographic and school-related variables. For ordinal predictor variables, Kendall’s tau-b was used to assess the relationship with change scores. For nominal predictor variables, analysis of variance was used to assess the relationship with change scores; the square root of eta-squared was reported as being a rough analog of a correlation coefficient.
Because participants were only required to respond to background questions and Time 1 MBI items to be included in the study, significant missingness for other measures at Time 1 and Time 2 was found. Time 1 UWES had 20% missing and Time 1 OLBI measures had 42% missingness. The dropout for MBI domains was 59% (total 59% missing at Time 2), the dropout for work engagement was 54% (total 63% missing at Time 2), and the dropout for OLBI domains was 32% (total 61% missing at Time 2). While substantial, this level of missingness is consistent with other large-scale longitudinal surveys (Gustavson et al., 2012). Continuers did not vary substantially from dropouts on any outcome at Time 1 (maximum Cohen’s d difference of 0.12).
Results
A total of 490 SETs completed the survey at Time 1. Participants came from all 50 states with the highest percentage from Pennsylvania (13.7), Georgia (10.8), and Illinois (8.8). Table 1 shows the participant demographics at Time 1 and Time 2; 40.6 % of participants were retained from Time 1 to Time 2. Overall, similar percentages for each of the variables were retained across the two time points for the variables. The mean age of the participants was 43, the large majority was female (89%). The mean years of teaching experience was 14 and the number of years in the current position was 7. Differences were noted between the two time points with respect to race and grade level. At Time 2, about 91% of participants were White (an increase of 3%), while the number of Black teachers was 7% (a decrease of 3%). For grade level, 11% of teachers taught pre-K and kindergarten (increase of 3% from time 1), 33% taught middle school (decrease of 4%), and 35% taught high school (increase of 3%). The highest percentage of teachers were from elementary schools; a large proportion, more than 50%, also represented Title 1 schools.
Evaluation of Time 2 MBI-EE scores indicated that 62.2% of teachers fell within the dangerous level of burnout while 27.8% more were at risk (Squillaci, 2020). According to Time 2 MBI-Depersonalization scores, 14.7% of teachers were at dangerous levels and 36.3% were at risk. Finally, according to Time 2 MBI-Personal Accomplishment scores, 24.5% of teachers were at dangerous levels and 38.6% were at risk. Note that the evaluation of teachers as falling into dangerous and at-risk categories was necessarily performed with the full items set (i.e., without removing Items 12 and 16).
Research Question 1: Internal Structure
Results of configural model fit and measurement invariance testing can be found in Table 2. Initial configural models for MBI and OLBI had poor fit and were modified to create a well-fitting configural model. The configural model for the UWES exhibited a good fit. For the MBI, EFA performed at Time 1 and Time 2 both revealed no substantial (>.30) loadings for Item 16 (“Working with people directly puts too much stress on me.”) and a stronger cross-loading of Item 12 (“I feel very energetic.”) on the EE factor than on the PA factor to which it belongs. A 2008 review of MBI measurement studies (Worley et al., 2008) indicated that significant problems with these two items were identified long ago and these items were commonly removed when EFA and CFA techniques are used. A configural CFA was refit after removing Item 12 and Item 16 but still exhibited poor fit, largely due to residual correlations between Item 5 (“I feel I treat some students as if they were impersonal objects.”) and Item 15 (“I don’t really care what happens to some students”); these residual correlations were .246 at Time 1 and .180 at Time 2. These large residual correlations were reported by numerous studies in Worley et al.’s (2008) review. After removing Item 12 and Item 16 and allowing the residuals of Item 5 and Item 15 to covary, the configural model exhibited an acceptable fit. Items 12 and 16 of the MBI were removed from subdomain scores for all subsequent analyses.
Measurement Invariance Testing.
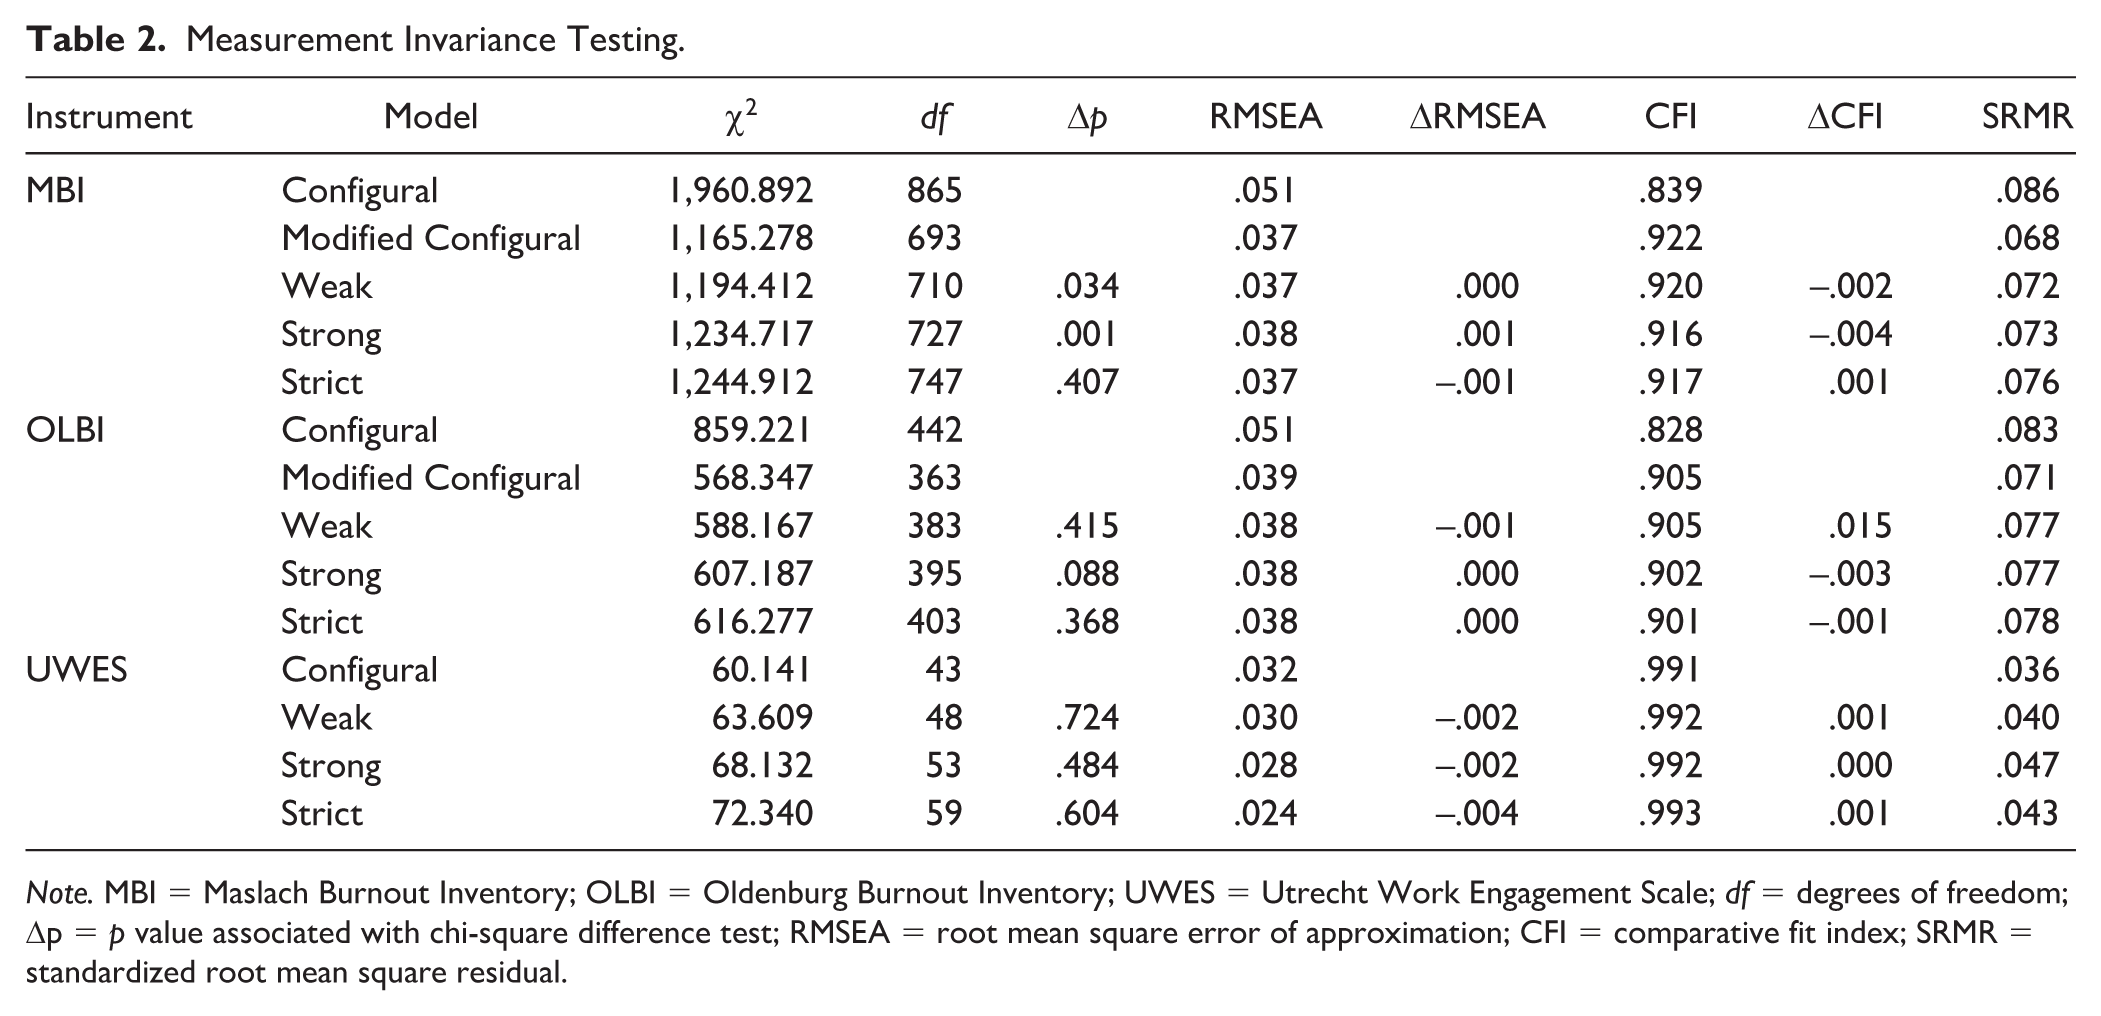
Note. MBI = Maslach Burnout Inventory; OLBI = Oldenburg Burnout Inventory; UWES = Utrecht Work Engagement Scale; df = degrees of freedom; Δp = p value associated with chi-square difference test; RMSEA = root mean square error of approximation; CFI = comparative fit index; SRMR = standardized root mean square residual.
For the OLBI, a review of measurement literature revealed that CFAs including a method factor for negatively phrased items result in substantially improved fit. A three-factor EFA model was fit at each time point which recovered the EXH, DIS, and negatively phrased method factor. However, Item 16 (“When I work, I usually feel energized.”) cross-loaded strongly (λ = .579 at Time 1 and λ = .621 at Time 2) on the DIS factor and had a small (λ = .182 and λ = .095 at Time 2) loading on the EXH factor. We did not find a replication of this finding in the literature; however, because the phenomenon was so pronounced, we removed Item 16 from the OLBI for all further analyses. A configural model for the OLBI which included a negatively phrased item method factor and from which Item 16 was removed fit adequately.
Following the fitting of acceptable configural models, longitudinal measurement invariance testing reported in Table 2 revealed that all three instruments exhibited adequate invariance across time points for all levels of invariance.
Research Question 2: Convergent Validity Evidence
A correlation matrix for all six burnout subdomains at both time points can be found in Table 3. When all six burnout subdomains were used as indicators in an EFA, inspection of the eigenvalues revealed a strong first eigenvalue (3.62 at Time 1 and 3.50 at Time 2) and very small second eigenvalue (1.01 at Time 1 and 0.93 at Time 2). Accordingly, a one-factor CFA model (equivalent to a one-factor EFA model) was fit at each time point so that residual correlations could be more easily examined. All six subdomains loaded significantly onto the general burnout factor; however MBI PA (λ = −.411 at Time 1 and λ=-.419 at Time 2) and MBI DP (λ = .644 at Time 1 and λ = .588 at Time 2) loaded less strongly than other domains (|λ| > .70). In addition, substantial residual correlations were found between OLBI EXH and MBI EE (r = .232 at Time 1 and r = .105 at Time 2) and between MBI PA and UWES (r = .171 at Time 1 and r = .150 at Time 2).
Correlations Among Burnout Subdomains.
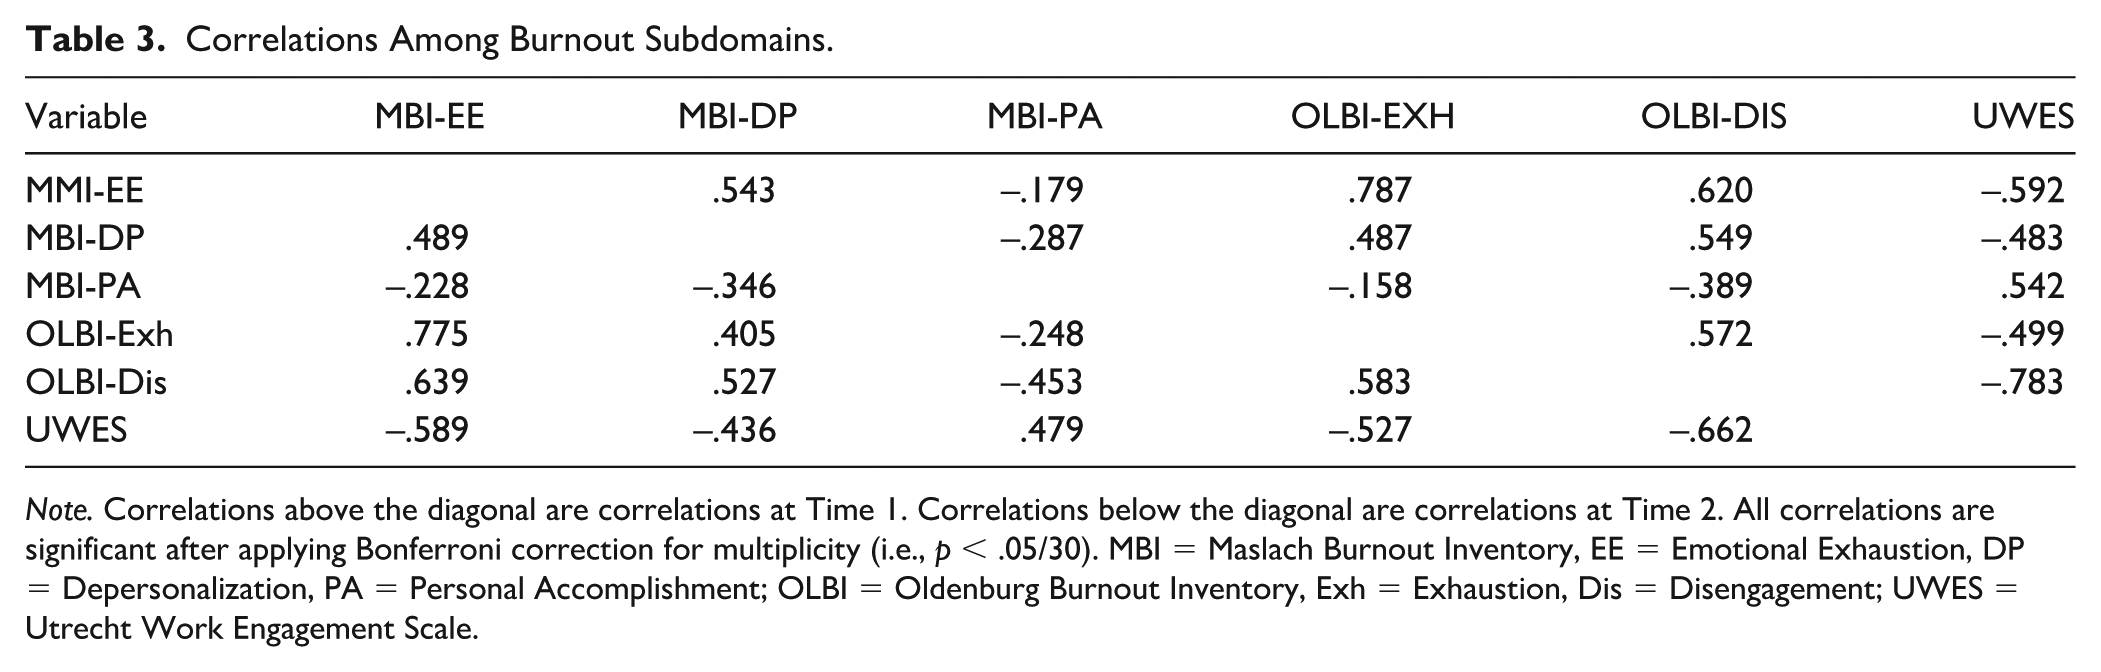
Note. Correlations above the diagonal are correlations at Time 1. Correlations below the diagonal are correlations at Time 2. All correlations are significant after applying Bonferroni correction for multiplicity (i.e., p < .05/30). MBI = Maslach Burnout Inventory, EE = Emotional Exhaustion, DP = Depersonalization, PA = Personal Accomplishment; OLBI = Oldenburg Burnout Inventory, Exh = Exhaustion, Dis = Disengagement; UWES = Utrecht Work Engagement Scale.
Research Question 3: Stability of Burnout
For evaluation of stability or change in burnout of SETs over the course of the school year using the three measures, Table 4 shows mean values at Time 1 and Time 2 as well as the correlations between scores at the two time points for each burnout measure. Baseline scores for each of the subscale measures significantly correlated with the Time 2 assessment, with between 35% (MBI-PA) and 55% (UWES) of variance in common between baseline and Time 2 scores. For the related question about change in burnout over the school year, when mean change in burnout scores was evaluated using t tests (Table 5), the UWES was the only measure that showed significant change, a decrease, from Time 1 to Time 2, t(180) = 2.73, p = .007, Cohen’s d = 0.15.
Stability of Burnout and Work Engagement.
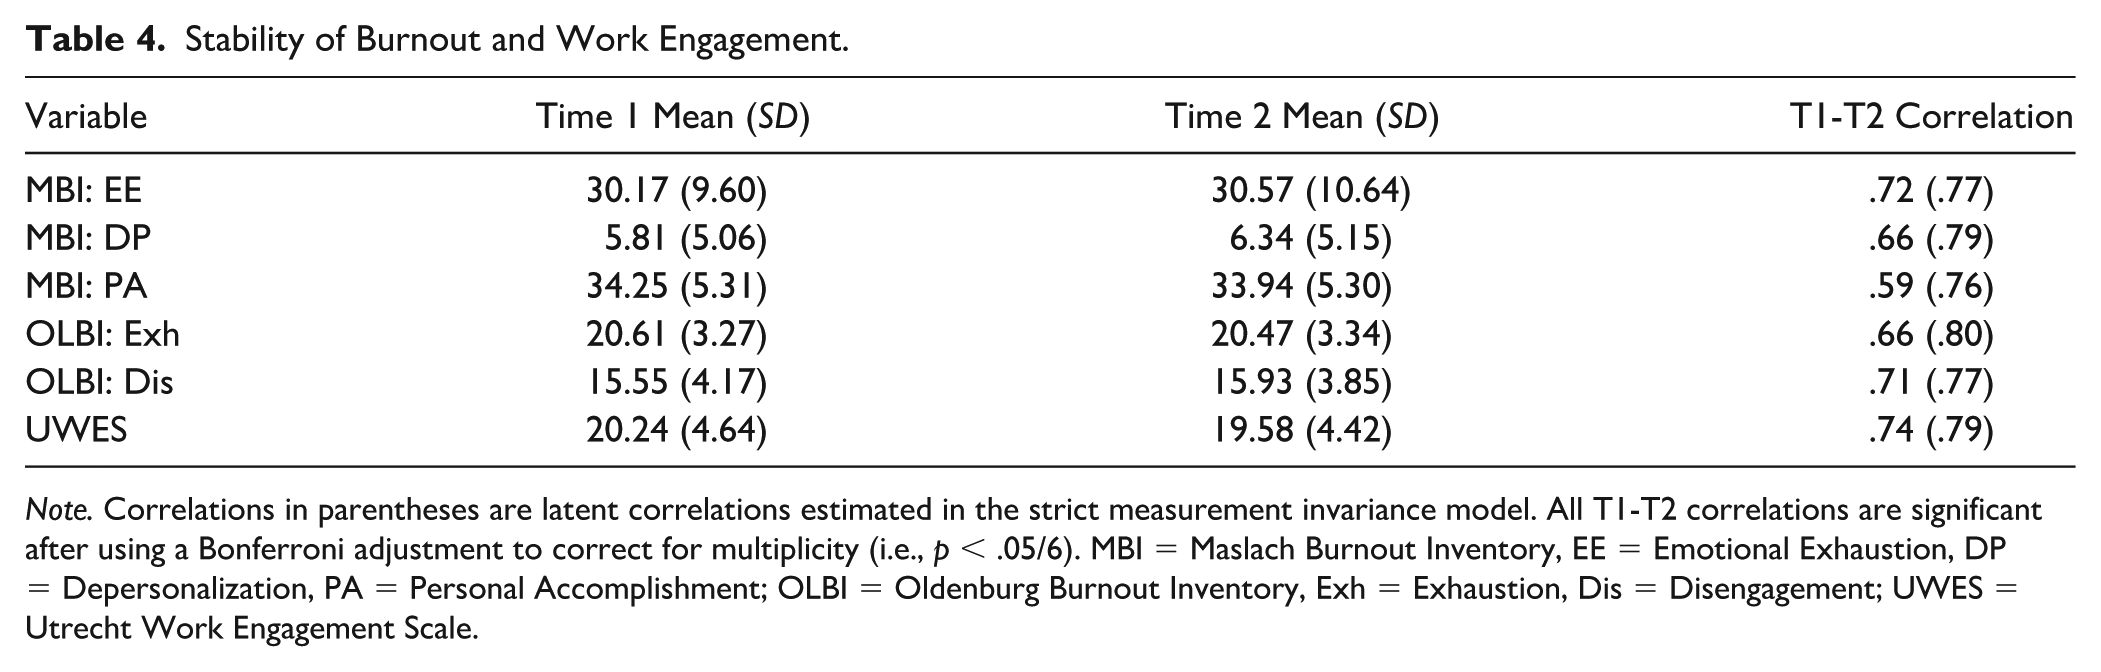
Note. Correlations in parentheses are latent correlations estimated in the strict measurement invariance model. All T1-T2 correlations are significant after using a Bonferroni adjustment to correct for multiplicity (i.e., p < .05/6). MBI = Maslach Burnout Inventory, EE = Emotional Exhaustion, DP = Depersonalization, PA = Personal Accomplishment; OLBI = Oldenburg Burnout Inventory, Exh = Exhaustion, Dis = Disengagement; UWES = Utrecht Work Engagement Scale.
t Tests of Mean Change Scores.
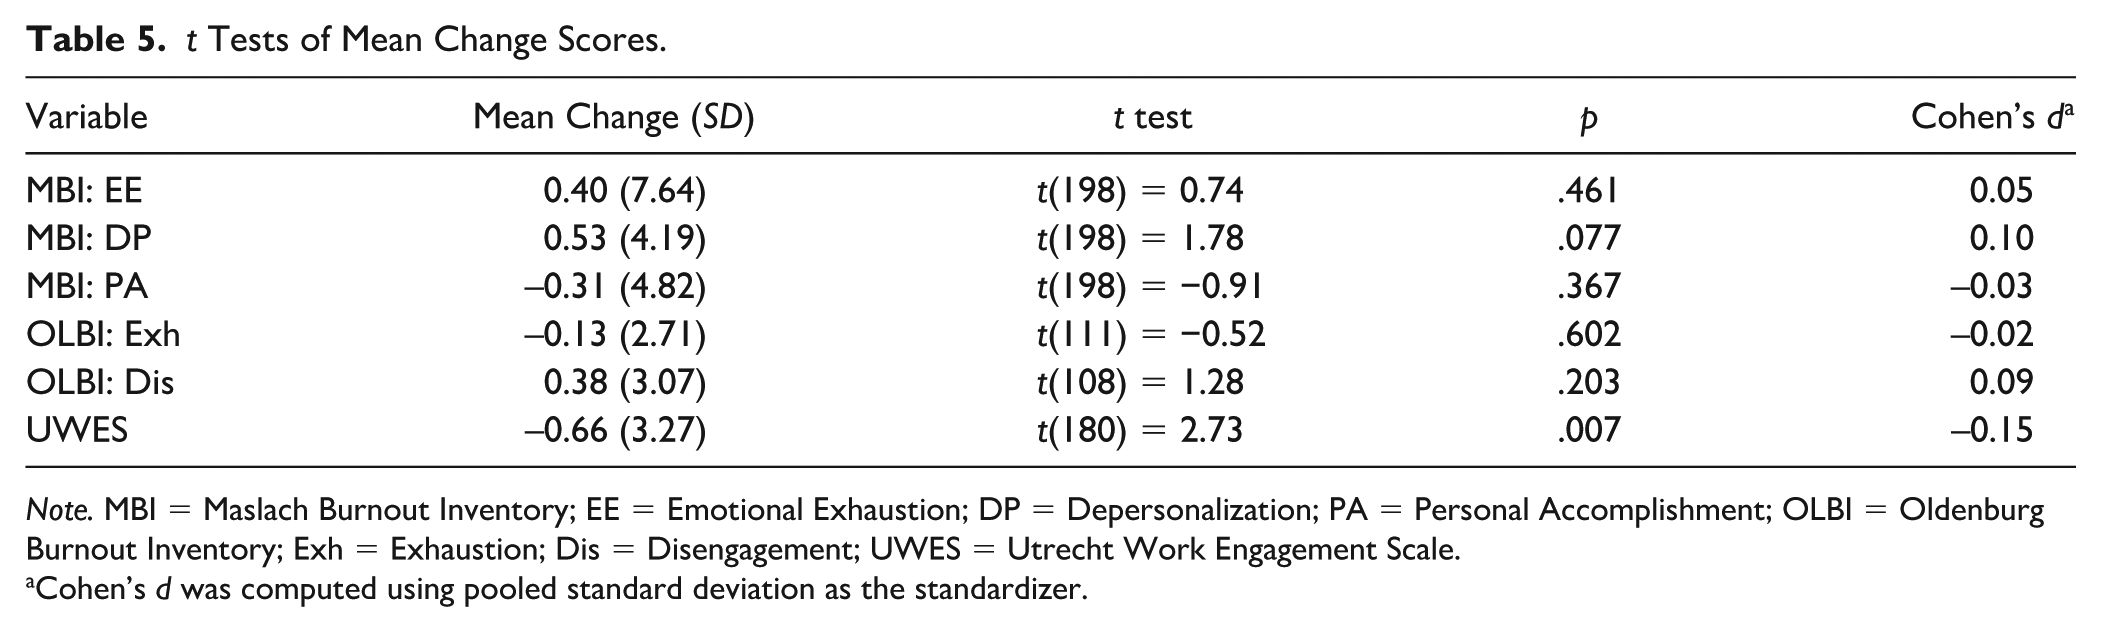
Note. MBI = Maslach Burnout Inventory; EE = Emotional Exhaustion; DP = Depersonalization; PA = Personal Accomplishment; OLBI = Oldenburg Burnout Inventory; Exh = Exhaustion; Dis = Disengagement; UWES = Utrecht Work Engagement Scale.
Cohen’s d was computed using pooled standard deviation as the standardizer.
Research Question 4: Impact of the COVID-19 Pandemic
To answer the fourth question about the impact of the COVID-19 pandemic on teacher emotional exhaustion and stress, 75.6% of teachers reported that the pandemic had a moderate to extreme impact on their emotional exhaustion while 87.2% of teachers reported a moderate to extreme impact on their stress. Only 4.4% of teachers reported that the COVID-19 pandemic did not impact their emotional exhaustion at all while 0.6% reported no impact on their stress. The only significant relationship between self-report of the effect of the COVID-19 pandemic and change in burnout and work engagement variables was between the effect of the COVID-19 pandemic on exhaustion and change in EE (τ = .14); these correlations are reported in Table 6. Teachers reporting higher levels of COVID-19 impact on their stress also reported significantly higher levels of EE (τ = .25) and EXH (τ = .22) and significantly lower levels of work engagement (τ = −.14), but no significant difference in DP (τ = .04), PA (τ = .02), or DIS (τ = .11) at Time 2. Teachers reporting higher levels of COVID-19 impact on their emotional exhaustion also reported significantly higher levels of EE (τ = .28) and EXH (τ = .27) and significantly lower levels of work engagement (τ = −.14), but no significant difference in DP (τ = .06), PA (τ = −.06), or DIS (τ = .11) at Time 2.
Correlations Between COVID-19 Factors, Teacher Demographics and School Factors with Change in Burnout and Work Engagement.
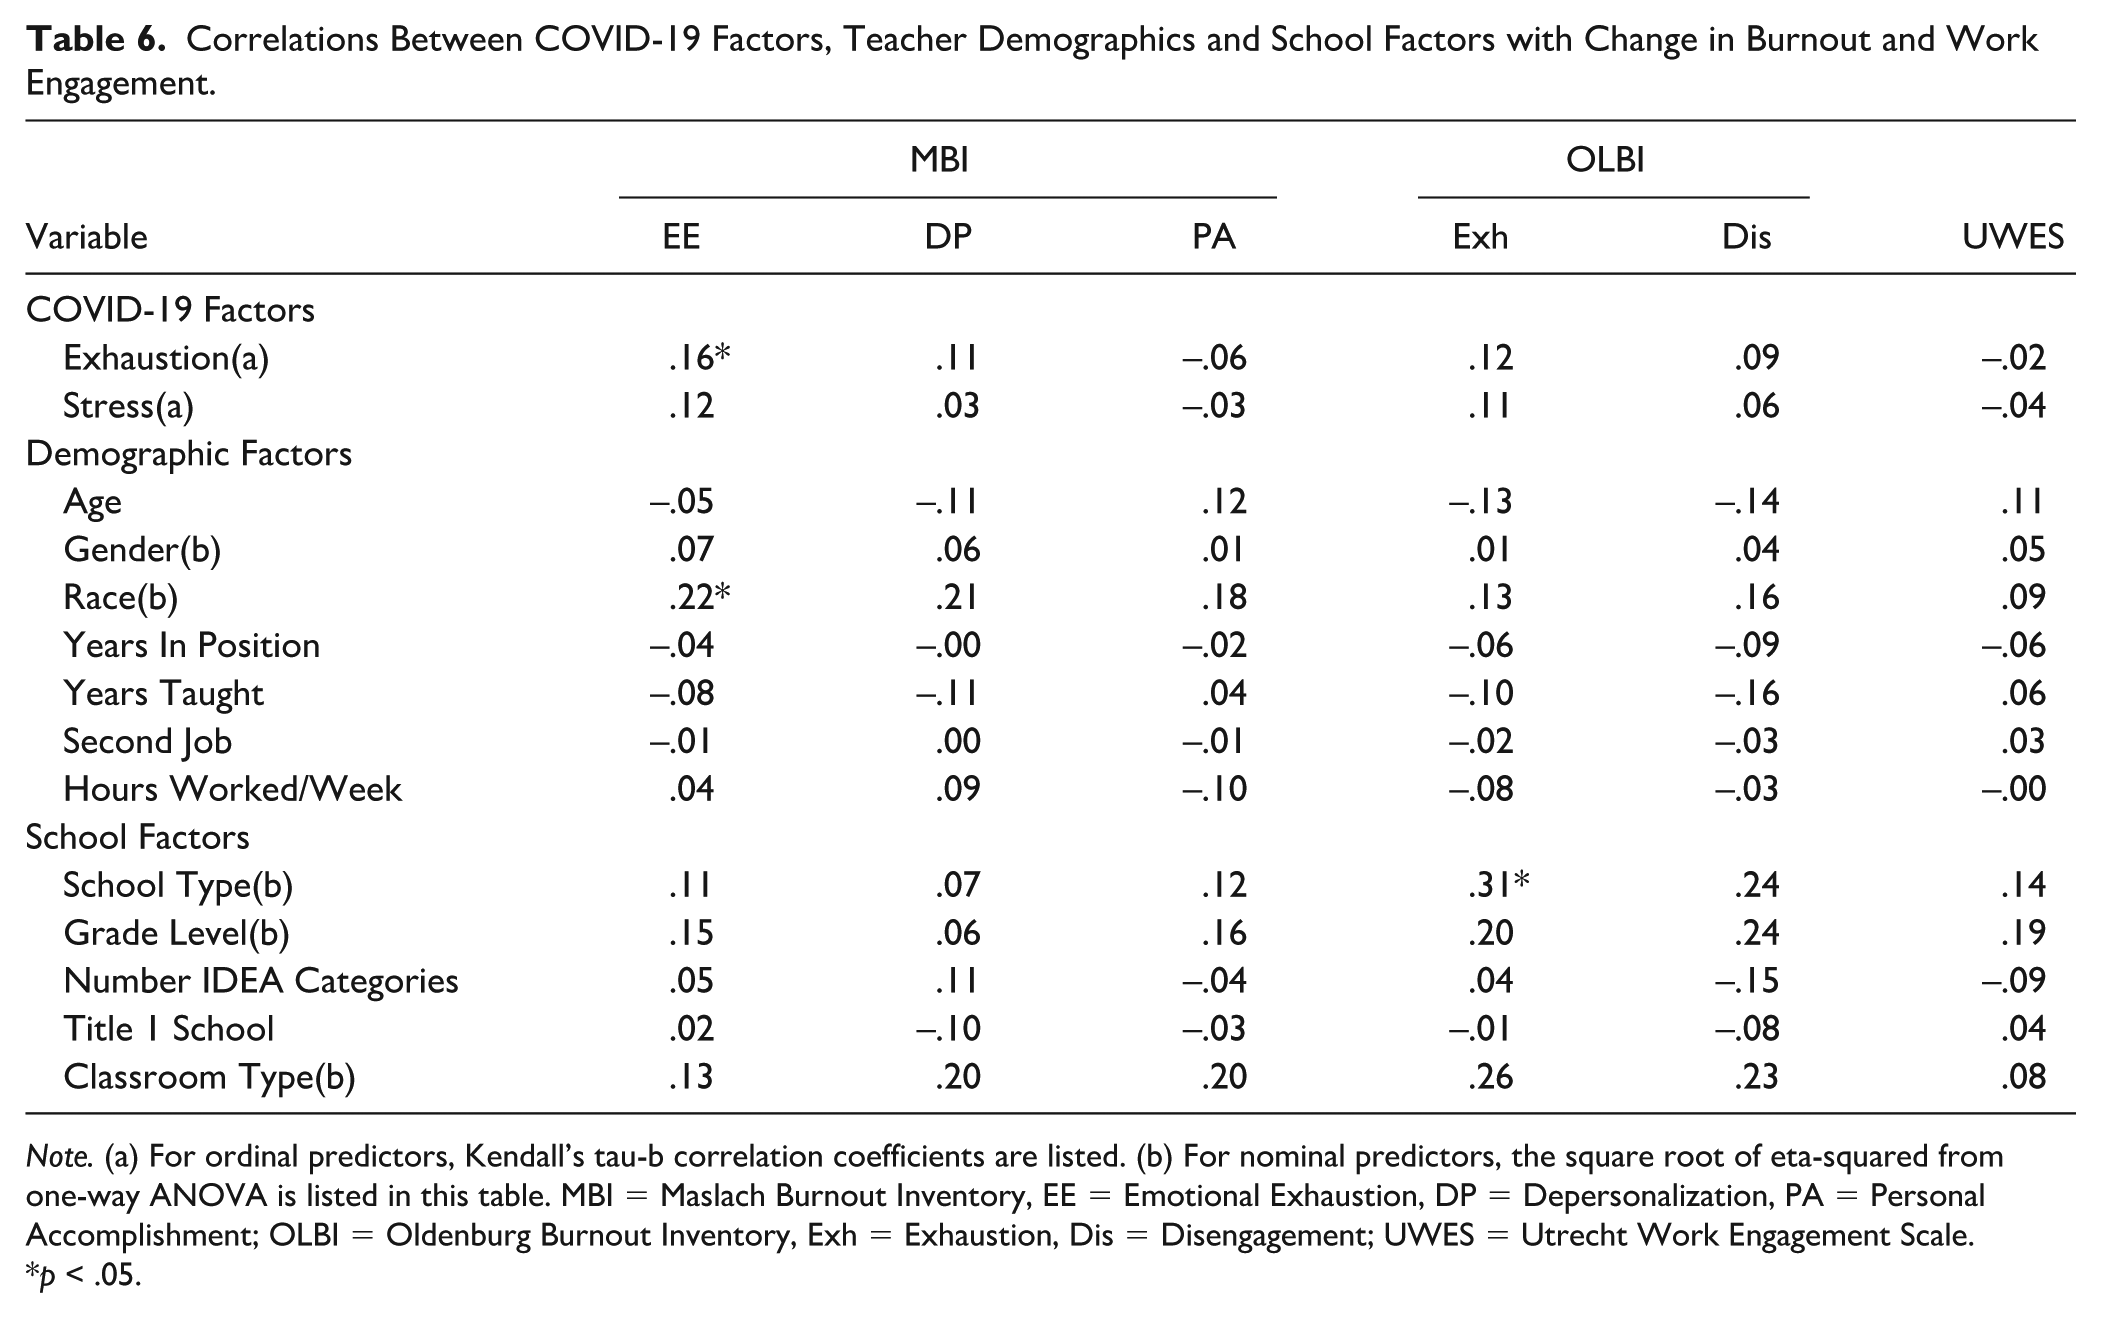
Note. (a) For ordinal predictors, Kendall’s tau-b correlation coefficients are listed. (b) For nominal predictors, the square root of eta-squared from one-way ANOVA is listed in this table. MBI = Maslach Burnout Inventory, EE = Emotional Exhaustion, DP = Depersonalization, PA = Personal Accomplishment; OLBI = Oldenburg Burnout Inventory, Exh = Exhaustion, Dis = Disengagement; UWES = Utrecht Work Engagement Scale.
p < .05.
Research Question 5: Covariates of Burnout
For the last question about teacher and school factors associated with burnout at Time 2, only two factors were significant; all correlation estimates can be found in Table 6. For teacher variables, race (η2 = .05, p = .036) was associated with a change in the MBI- Emotional Exhaustion scale. During the course of the school year, average emotional exhaustion for Black teachers decreased whereas average emotional exhaustion increased for teachers of other races. Although Time 1 scores were lower for Black teachers, there was no significant difference in MBI-Emotional Exhaustion at Time 1 between Black teachers (M=28.8) and teachers of other races (M=32.5). Further, only one additional school factor, school type, correlated with the OLBI exhaustion subscale (η2 = .07, p = .042); teachers at charter schools experienced a decrease in average exhaustion during the school year whereas teachers at other schools experienced no average change.
Discussion
Rather than understanding the impact of the COVID-19 pandemic on teacher burnout, our original intent of the study was to understand the stability of burnout over the school year when measured by different instruments and the impact of demographic variables on change in burnout assessed by the different tools. However, given that data collection coincided with the impact of the COVID-19 pandemic, we gained an opportunity to understand the impact of the pandemic as it wreaked havoc on systems of care, including public schools and the students they serve (Asbury et al., 2020; Pressley, 2021). These findings expose the significant burnout special educators experienced. Nearly 75% of teachers reported that the COVID-19 pandemic had a high impact on their emotional exhaustion and even more on their stress. Further and consistent with these findings, nearly all teachers reported emotional exhaustion with the MBI at the dangerous level/at-risk levels of burnout based on the categorization described by Squillaci (2021); and more than half reported MBI-Depersonalization scores and reduced MBI-Personalization scores at dangerous/at-risk levels.
Analysis of the internal structure of the different measures revealed that the MBI had significant measurement quality issues, including factor structure problems and low reliability in DP and moderate reliability in PA. Similarly, low-to-moderate reliabilities have been previously found in other studies of burnout in SETs (Brunsting et al., 2023; Langher et al., 2017; McGrew et al., 2023; Robinson et al., 2019; Squillaci, 2021). These findings of low to moderate reliability are concerning due to the tendency of low reliability to inflate Type 2 statistical errors (Sutcliffe, 1980). Findings of non-significance, such as those within this study or the studies detailed in the introduction may possibly be due to properties of the measure of burnout used rather than of the burnout construct itself. In addition, measures with low reliability can create bias in multivariate analyses such as multiple regression or structural equation modeling (Cole & Preacher, 2014). On the positive side, all three scales demonstrated adequate longitudinal measurement invariance, suggesting that the meaning of scores remains constant across time points.
Investigation of the convergent validity of MBI, OLBI, and UWES domains revealed that while MBI-EE, OLBI-EXH, OLBI-DIS, and UWES all relate strongly to each other, MBI-DP and MBI-PA exhibit substantial unique variability. If a researcher’s theoretical model of burnout is as a singular construct, a total, unidimensional, MBI score would not likely reflect that construct. The large number of researchers employing an MBI total score may be guilty of a misconception described by Lilienfeld and Strothers (2020). They present the erroneous belief of researchers that a measure taps into the construct based on its name rather than content and that the instruments are reliable. When such assumptions are made, the replicability of psychological and educational research is at risk. By contrast, if a multidimensional theory of burnout is to be used, the MBI may be more consistent with that theory than the OLBI or UWES.
Equally concerning is the finding of the constancy of high burnout over the school year reported by teachers. Prior research dating back as far as 30 years ago indicated that burnout as measured with the MBI is highly stable (Burke & Greenglass, 1995). Not only did the results in this study support these early and more recent findings with the MBI (Cece et al., 2021), burnout as measured with the OLBI in this study was also stable across the school year and also a finding consistent with the literature (Hultell et al., 2013). Examination of the very small correlations between change in burnout and teacher and school factors combined with the very large correlations between burnout scores at Time 1 and Time 2 suggests not only (a) burnout is quite stable but also begs the question (b) to the extent burnout
Examination of the correlations between school and teacher variables and change in burnout and work engagement generally did not match correlations reported in the literature at a single time point. For example, in a review of the literature, Brunsting et al. (2014) summarized findings of school factors such as financial support, classroom setting, and classroom composition as accounting for burnout—variables not significant in our study. The only finding for school factors was with school type (public, private, and charter). Teachers from charter schools reported less change in burnout with the OLBI exhaustion subscale compared to teachers from other types of schools. These findings suggest that, while school factors may relate to levels of burnout cross-sectionally, they have little relevance to the progression of burnout in individuals.
Perceptions of the effect of COVID-19 on stress and emotional exhaustion were mostly not predictive of change in burnout for any measure. Furthermore, demographic and school variables were mostly not predictive of change in burnout for any measure, with the exception of the MBI-EE with race. For teacher factors, again it was unexpected that only one variable correlated with burnout, and that was only with one burnout subscale. As with school factors, our findings suggest that the teacher factors investigated in our study have little influence on the progression of burnout. In contrast, Brunsting et al. (2014) reported teacher age, gender, and experience as correlating with burnout at a single time point. That is in general, older teachers, female teachers, and more experienced teachers reported lower scores of burnout. However, in contrast, the only finding in our sample was with race. MBI-Emotional exhaustion decreased for Black teachers and increased for teachers of other races. This finding was unexpected because research suggests that Black teachers experience more stress in their jobs (Scott et al., 2022; Trainor et al., 2019). However, a study by Baker et al. (2021) that took place during the first months of the pandemic showed that Black teachers reported less negative impact of stressors, better mental health, and more protective factors and impact of protective factors on coping and teaching compared to White teachers. These findings are also consistent with another study by Bottiani et al. (2019) that occurred prior to the pandemic. Bottiani and colleagues (2019) sampled 255 teachers from low-income and urban middle schools. They found that White teachers reported higher stress and burnout compared with Black teachers. Because of the low sample size of Black teachers in our study, these results should be interpreted with caution.
The research surrounding the unique racialized experiences of SETs who are from minoritized backgrounds is limited overall. Most recently several scholars explored these experiences in depth (see Boveda & Weinberg, 2022; Cormier, Scott, et al., 2022; Drame et al., 2022; Kulkarni et al., 2022; Siuty & Atwood, 2022). While the challenges of stress and burnout that SETs experience are often similar regardless of the race and ethnicity of the teachers, SETs of color experience stressful work lives in ways not experienced by White teachers (Cormier, Scott, et al., 2022, 2023) and may not be captured in our data using these measures of burnout and work engagement. Therefore, these findings suggest that future research should disaggregate results and examine the work lives of SETs by race and ethnicity to provide more robust scholarship in this area.
Limitations
There were important limitations to consider for this study that may impact the potential to generalize the information learned. First, the study was initiated during the fall of 2020 when many schools continued to experience the COVID-19 pandemic lockdown. Second, because of missing data, it may be likely that the Time 2 sample represents teachers who were more resilient with fewer stressors over the school year. Third, it is also possible that the volunteer participants who completed the survey online may be different from teachers who chose to not complete the survey or were not connected to our advertising outlets. Fourth, because the study was administered nationwide, we were unable to provide incentives. This is because one state on the West Coast of the United States required that any individual interested in the study be compensated with the same incentive structure whether they qualified for the study or not. Thus, because we were unsure of the response rate, we were unable to offer any incentives, potentially leading to higher attrition over time. Finally, since we used a convenience sample, it may be difficult to interpret the lack of significant correlations between teacher/school factors and our burnout measures. Therefore, it may be likely that teachers whose personal characteristics or school contexts had more significant association with burnout were less likely to participate in this study.
In conclusion, burnout and attrition are significant issues for public schools. It is time to move into more intervention research that addresses teacher burnout. However, these findings suggest that burnout may be difficult to change given its robustness over time and measurement issues. Thus, researchers may need to consider and explore other outcomes that are more amenable to change and sensitive to intervention.
Footnotes
Acknowledgements
The authors thank Lindsey Ogle for her help with survey development and data collection and teachers who gave their valuable time.
Declaration of Conflicting Interests
The author(s) declared no potential conflicts of interest with respect to the research, authorship, and/or publication of this article.
Funding
This research was supported by the Institute of Education Science Grant #R324A200232.