
Abstract
Children with autism spectrum disorder (ASD) experience differences in peer proximity and need educator support to develop strong peer relationships. Sensor technologies have emerged to inform interventions that can support interactional proximity. An exploratory study was conducted to test a sensor technology in an inclusive classroom with a child with ASD and nine peers. Data were collected and analyzed to understand the interactional proximity of the child with ASD with peers and teachers including initiations, and terminations with peers. Results show differences in peer proximity, initiations, terminations, and preferences for specific peers. Teacher proximity for the head and assistant teacher is also reported. Findings show initial support for sensor technology to measure the interactional proximity of children with ASD and their peers including initiations, and terminations, as well as provide insights about teacher proximity.
Introduction
Children with autism spectrum disorder (ASD) and those with related disorders, such as sensory processing disorder, attention deficit disorder, obsessive compulsive disorder, or anxiety disorder (Landry & Chouinard, 2019) – often referred to as the broad autism phenotype often display differences in their engagement with peers (American Psychiatric Association, 2013), such as increased solitary play, reduced social proximity, lower levels of social initiation, and higher rates of social terminations (Buggey et al., 2011; Watson et al., 2003). These differences often limit social engagement (McConnell, 2002). Without appropriate intervention by educators, these children can be at risk for social rejection and isolation (Chamberlain et al., 2007), which can lead to anxiety, depression, and/or aggression (Baker et al., 2002) – common co-occurring conditions for children with ASD and related disabilities (Dougherty et al., 2015; Hill et al., 2014; Stewart et al., 2006; van Steensel et al., 2011).
Inclusive educational environments, where children with disabilities are educated alongside their typically developing peers, provide increased opportunities for children to engage with peers (Division for Early Childhood/National Association for the Education of Young Children, 2009). In 2023, the U.S. Department of Health and Human Services reiterated the rights of young children with disabilities to inclusive educational opportunities, which were originally outlined nearly 50 years ago in the Education for All Handicapped Children Act of 1975. Since the passage of this act, inclusive practices have expanded (McLeskey et al., 2021). Yet access to inclusive educational settings is not enough to ensure peer relationships; support from educators is also essential (Camargo et al., 2014). Positive adult relationships in early education are also crucial to positive child adjustment and school success (Goetz et al., 2021; Pianta et al., 2012), yet children with ASD often lack close relationships with their teachers (Blacher et al., 2014; Eisenhower et al., 2015). Positive engagement with teachers predicts later academic adjustment (Losh et al., 2022), as well as lower internalizing and externalizing behaviors for children with ASD (Caplan et al., 2016).
Theoretical Background
Several theories provide foundational knowledge about how peer engagement can be supported for children. Bioecological theory (Bronfenbrenner, 1977), emphasizes the importance of the environment on a child’s peer engagement and indicates that individuals in home and school environments, where children spend most of their time, can have a large impact on their peer relationships. In school settings, peers and teachers influence the social engagement of children with ASD and related disabilities. Indeed, the model of social dynamics indicates that both teacher and peer behaviors influence classroom social dynamics, including child and teacher engagement (Farmer et al., 2018). Teachers can support engagement in several ways including modeling appropriate peer engagement, adjusting their own proximity and that of children, adjusting activities in the classroom to encourage peer engagement, and implementing targeted social interventions to address individual needs of children (Farmer et al., 2018).
Peer Engagement for Children With Disabilities
Peer engagement of children with and without disabilities has been measured in numerous ways. Researchers have used teacher and child reports to understand peer engagement and how that relates to the social dynamics of children in classroom settings (Chen et al., 2019). In addition, direct observation has been used to measure peer engagement (Locke et al., 2013). Studies using direct observation have provided important insights to help us understand the importance of child-directed activities on the peer engagement of children with disabilities (Coelho et al., 2019), as well as how teacher support can positively impact peer engagement for children with ASD (Despois & André, 2024). While direct observation can be a reliable method of measuring peer engagement, without extensive training teacher observations can be biased and lead to inaccurate conclusions about child needs (Gilliam et al., 2016). In addition, self-report can also be unreliable, especially when reporting about children with disabilities (Robertson et al., 2003) and may not accurately reflect the peer engagement of children (Shin et al., 2014). In addition, direct observation can be time-consuming to gather and may not be a feasible approach for educators to implement to support engagement, given their many instructional duties and attention required to support children in the classroom (Douglas et al., 2024). Yet initial studies related to the social dynamics of children with ASD show that they have fewer peer connections than their typically developing peers (Locke et al., 2013), indicating a need for improved monitoring and intervention.
Interactional Proximity
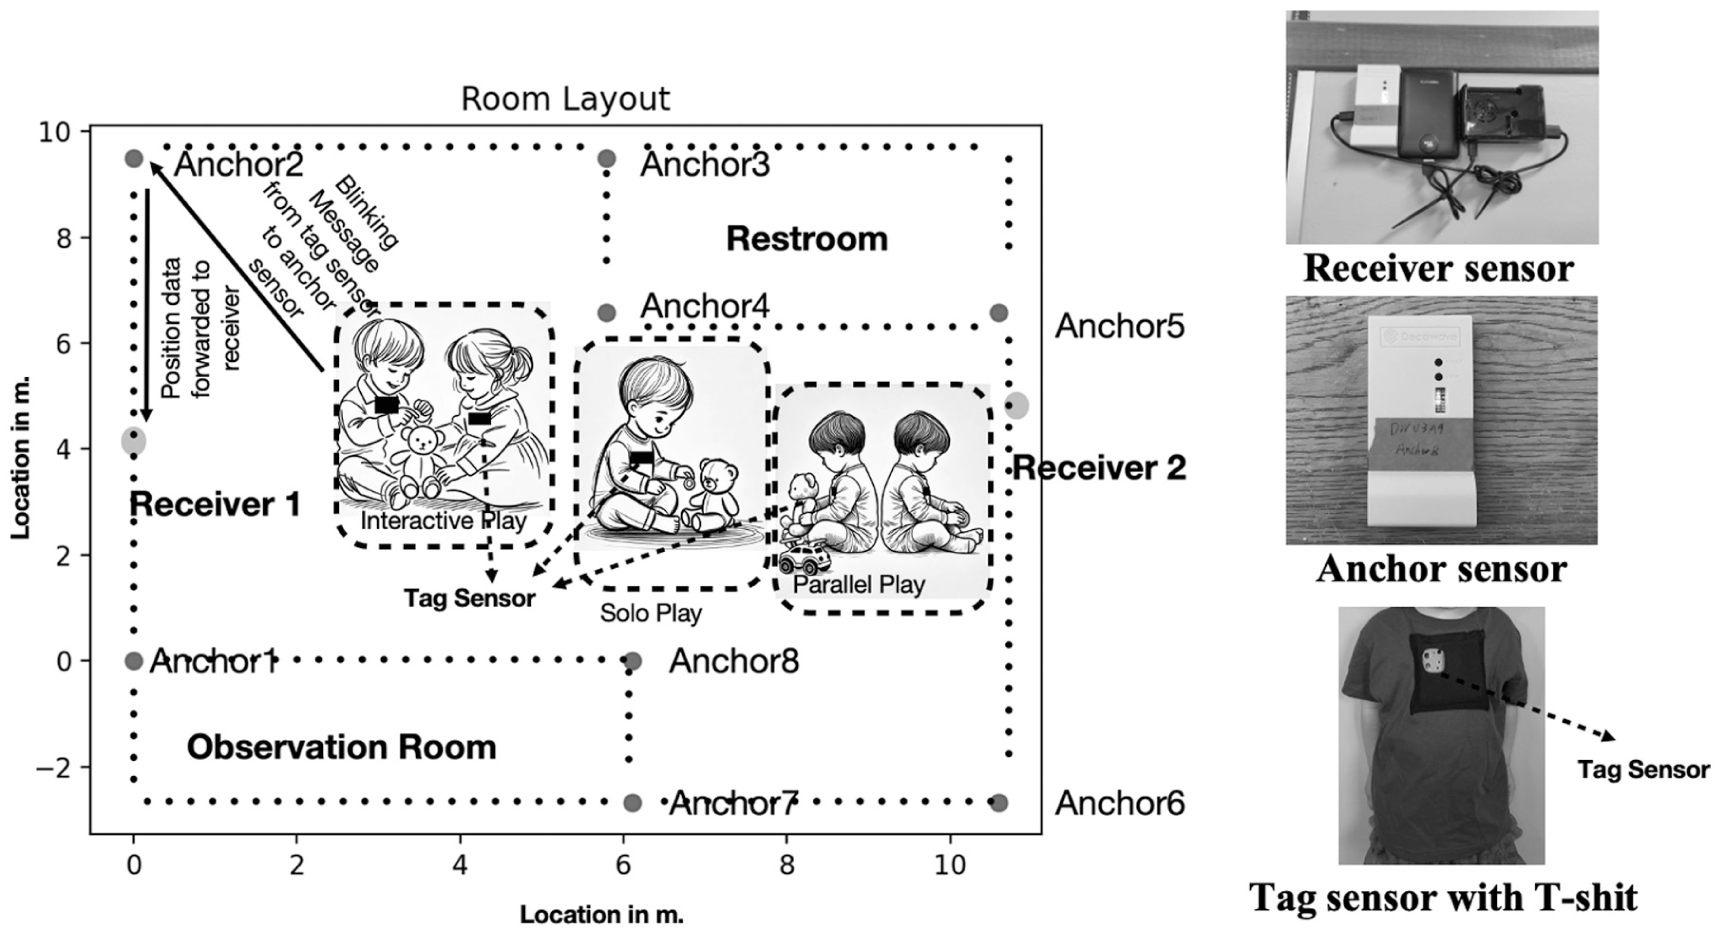
Proximity is an important metric related to the social engagement of young children (Rubin et al., 2006). When children are in the proximity of their peers, they are provided with more opportunities to interact socially (Rubin et al., 1978). From a measurement perspective, this could be referred to as interactional proximity – defined as a child within proximity of a peer or adult in such a way that interaction is likely to occur (Casanova et al., 2023). Peer proximity aligns with the distinct stages of play that children move through during social development, outlined by Parten (1932). Initially, social experiences are solitary, often isolated, and not within the proximity of other children. As they develop socially, children begin to engage in onlooker play – where they play alone but watch and learn from peers in nearby proximity. Then they move into parallel play – where they play alongside peers in close proximity, but not interactively. Children then move on to interactive play – where they play and interact with peers in shared activities in close proximity. These types of play are illustrated in Figure 1. Some children, including children with ASD and related disabilities, experience differences in social engagement (LaVesser & Berg, 2011). Monitoring proximity may be a useful tool to help educators understand a child’s social development, their needs, and their potential for peer interaction. In addition, data related to proximity can be paired with acceleration, which indicates an increased rate of movement, and allows inference of who begins and ends interactional proximity.
Sensor system with classroom layout.
Research has shown that physical proximity is an important factor in supporting peer engagement (Faur & Laursen, 2022; Rademaker et al., 2020). Studies have also reported that children with autism in educational settings often experience loneliness and social isolation, especially during free-play periods such as recess, when students make independent choices about where to be and with whom to spend time (Tsou et al., 2025). Proximity data may help teachers to identify social challenges such as loneliness and isolation and develop strategies to strengthen child social engagement.
Technology to Measure Proximity
Educators most frequently use observational methods to understand social engagement (Joseph et al., 2014), yet as previously mentioned this can be unreliable and time consuming (Douglas et al., 2024; Gilliam et al., 2016). Technologies have recently become available to support educators in their measurement of social development for children with disabilities (e.g., apps; Marcu et al., 2013). Yet many of these technologies require extensive observation or data analysis, which may not be feasible for educators amid their other classroom responsibilities (Marcu et al., 2013). Automated technologies (e.g., LENA system; Dykstra et al., 2013) to evaluate language environments and provide information about language development are also available, but these technologies do not provide data related to proximity. New research has begun to evaluate wearable sensor technologies to fill this gap and provide feasible alternatives (Clevenger et al., 2024; Douglas et al., 2022; 2024; Elbaum et al., 2024; Irvin et al., 2021; Shi et al., 2017). This research has provided insights into how child social engagement can be measured using voice, accelerometer, and proximity-based technologies. For example, Clevenger and colleagues (2024) used accelerometer data paired with video-coded data to understand the physical activity level of children in preschool settings based on location and classroom activity. Their findings indicate that free play was most conducive to physical activity. Similarly, other researchers have explored the use of sensor technology combined with voice data to understand which activities promote social engagement and how teacher engagement varies across children and classroom activities (Elbaum et al., 2024; Irvin et al., 2021). Sensor-based systems have also been tested and validated by our team with young children with (Douglas et al., 2022) and without disabilities (Douglas et al., 2024; Shi et al., 2017). Yet, limited research has explored how peer proximity varies among children with specific disabilities (Douglas et al., 2022) and how such information could inform individualized interventions. This study utilizes the Wearable Human Interaction Tracker (WHIT), a new technology that addresses some of the limitations of prior technologies, including the combined use of accelerometer data with location to understand interactional proximity, including peer initiations and terminations.
Current Study
With limited research related to sensor technology for children with disabilities (Douglas et al., 2022), there is a need for continued evaluation of technology to identify how interactional proximity varies for children with and without disabilities. Therefore, we sought to explore the use of WHIT to measure proximity for a child with ASD and his classmates. We first conducted tests in the classroom to ensure sensor data accuracy. We detail this process in the procedure section. We then tested the tool with the children in this inclusive preschool classroom to answer the following research questions:
Method
Participants
Twelve of the children in the classroom had parental consent to participate in the study, ten of whom assented to participate during data collection. Parents also completed a child demographic form during the consent process to provide information about the child’s gender, age, race/ethnicity, disability, communication, and social skills. Two teachers (i.e., the lead and associate teacher) also consented to participate in the study. Each teacher completed a demographic form that provided information about teacher age, gender, race/ethnicity, experience as an early childhood educator, position, and experiences supporting child social engagement. Eight of the child participants had no disability, one had ASD, and one had a sensory processing disorder. Children are described using pseudonyms.
Omar
Omar was a 5:0-year-old Asian male with ASD, based on his teacher and parent-reported Individualized Education Program (IEP) records. He had a language and speech delay with an IEP goal to address his needs. He had limited spoken language, with most of his speech consisting of repeated words and short phrases. Parents reported that he often avoided social interactions and preferred parallel play.
Juniper
Juniper was a 4:5-year-old White female with a sensory processing disorder based on her teacher and parent reported IEP records. She received occupational therapy to support her sensory needs. Her parents did not indicate other social challenges.
Peers
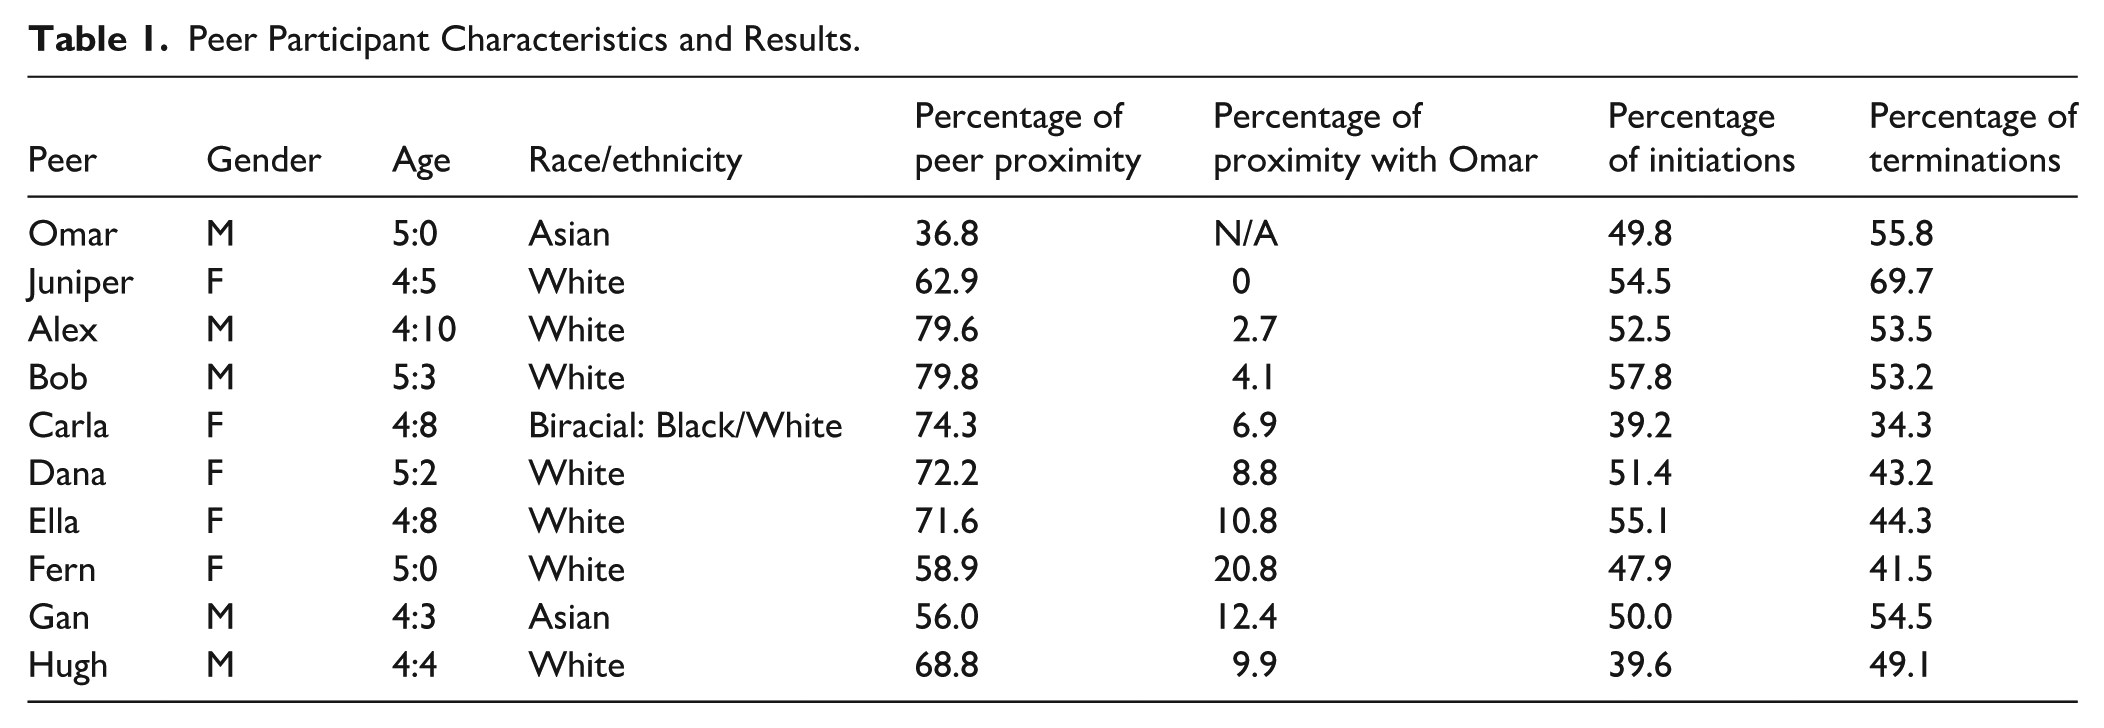
Participating peers in the classroom ranged in age from 4:3 to 5:3 years old, and none had an IEP or disability. Table 1 provides demographic and participation details about peers. Parental and teacher report indicated social difficulty for Carla including yelling and physical behaviors when she was tired, hungry, or overstimulated.
Peer Participant Characteristics and Results.
Head Teacher
The head teacher was a 40-year-old White female with 12 years of teaching experience with children ages 2 to 9. She reported a focus on building positive relationships to support social engagement.
Assistant Teacher
The assistant teacher was a 22-year-old White female with 3 years of experience supporting children ages 0 to 4. She reported scaffolding to support social development and engagement.
Setting
This study was conducted in an inclusive early childhood center affiliated with our university, located in the Midwestern United States, in Spring 2024. Institutional review board approval was obtained before the study began. The center has seven classrooms with full and half-day programming for children with and without disabilities, birth to age five. Child participants in this study were in the 4-year-old classroom, which provided services to 17 total children with 2 main educators (i.e., a lead teacher and associate teacher) and university practicum students who rotated in and out of the classroom throughout the week.
Sensor System
We used WHIT, a new sensor technology, to measure the interactional proximity of children. WHIT can track each child’s absolute location with a sampling rate of up to five measurements per second and a spatial resolution of approximately 6 inches. WHIT was developed by our team with an Ultra-Wide Band (UWB) radio-based location tracking sensor that integrates a localization hardware core from Eliko Systems (https://eliko.tech) within a custom-designed wearable sensor package. The localization core from Eliko Systems provides an Ultra-Wide Band-based localization system that triangulates a sensor’s absolute location by measuring radio signal propagation difference from multiple UWB beacons and the sensor attached to a participant. Such UWB localization requires the classroom to be equipped with wall-mounted matchbox-sized access points that receive UWB radio beacons from the wearable sensor and perform triangulation for computing sensor location. WHIT consists of three types of sensors: anchor sensors, tag sensors, and receiver sensors. During operation, tag sensors, carried by participants, transmit blink messages. Anchor sensors, which are mounted on the walls, receive these blink messages, and use the data to calculate the location of the tags. The computed positions are then forwarded to wall-mounted receiver sensors and sent to a computer for analysis. Figure 1 illustrates the sensor deployment used in this study. Note that in this setup, the anchor sensors were used to establish a reference coordinate system and to determine participant location. Therefore, placement of the anchor sensors was done systematically to ensure full room coverage, or the ability of the anchor sensors to receive blink messages from the tag sensors. However, the placement of the receiver sensors does not require precision, if they are within the vicinity (we provide more detail in the procedures section). The data collected from the sensors are processed using a Python-based analysis software and algorithms, developed by the authors, within the WHIT system to calculate the exact location. We chose this UWB-based indoor localization since its efficacy has already been well-explored and proven in both research and industry (Haggenmiller et al., 2019; Tiemann & Wietfeld, 2019; Zhao et al., 2020).
WHIT sensors are the size of a standard credit card and weigh approximately 12 g. They include a rechargeable battery that lasts approximately 7 hours per charge. The printed circuit board and rechargeable battery are well integrated within insulating plastic packaging to contain the sensors, avoid any health hazards, and make them safe for use with young children. Each wearable sensor is secured in a chest pocket of a custom-made t-shirt using small snaps to avoid removal by children (see Figure 1). The sensor provides data about location, proximity to others wearing sensors, and physical acceleration of the participants. This information is then used to measure interactional proximity – instances of peer proximity, initiation, and termination, as well as teacher proximity.
Procedures
Prior to the start of the study, sensors were tested in the classroom when children were not present to ensure accuracy. These tests were conducted to validate both the precision of location calculations and the reliability of data transmission. To guarantee stable data transmission between the anchor and tag sensors and achieve reliable data acquisition, we positioned the anchor sensors so that each area of the classroom was covered by at least four anchor sensors. In addition, to ensure effective data transmission between anchors and receivers, each receiver was placed in a location that could be covered by at least two anchor sensors. Figure 2 illustrates the coverage of anchor sensors for the classroom. This setup was designed to maximize the reliability of sensor data during the study. Data were collected for 2 hours each session over the course of 2 months. Sessions occurred during free play and center time within the classroom, where children were able to select where they wanted to go. Interactional proximity was measured across 8 days, with participation varying due to child and teacher absences. At least one teacher participated each day.
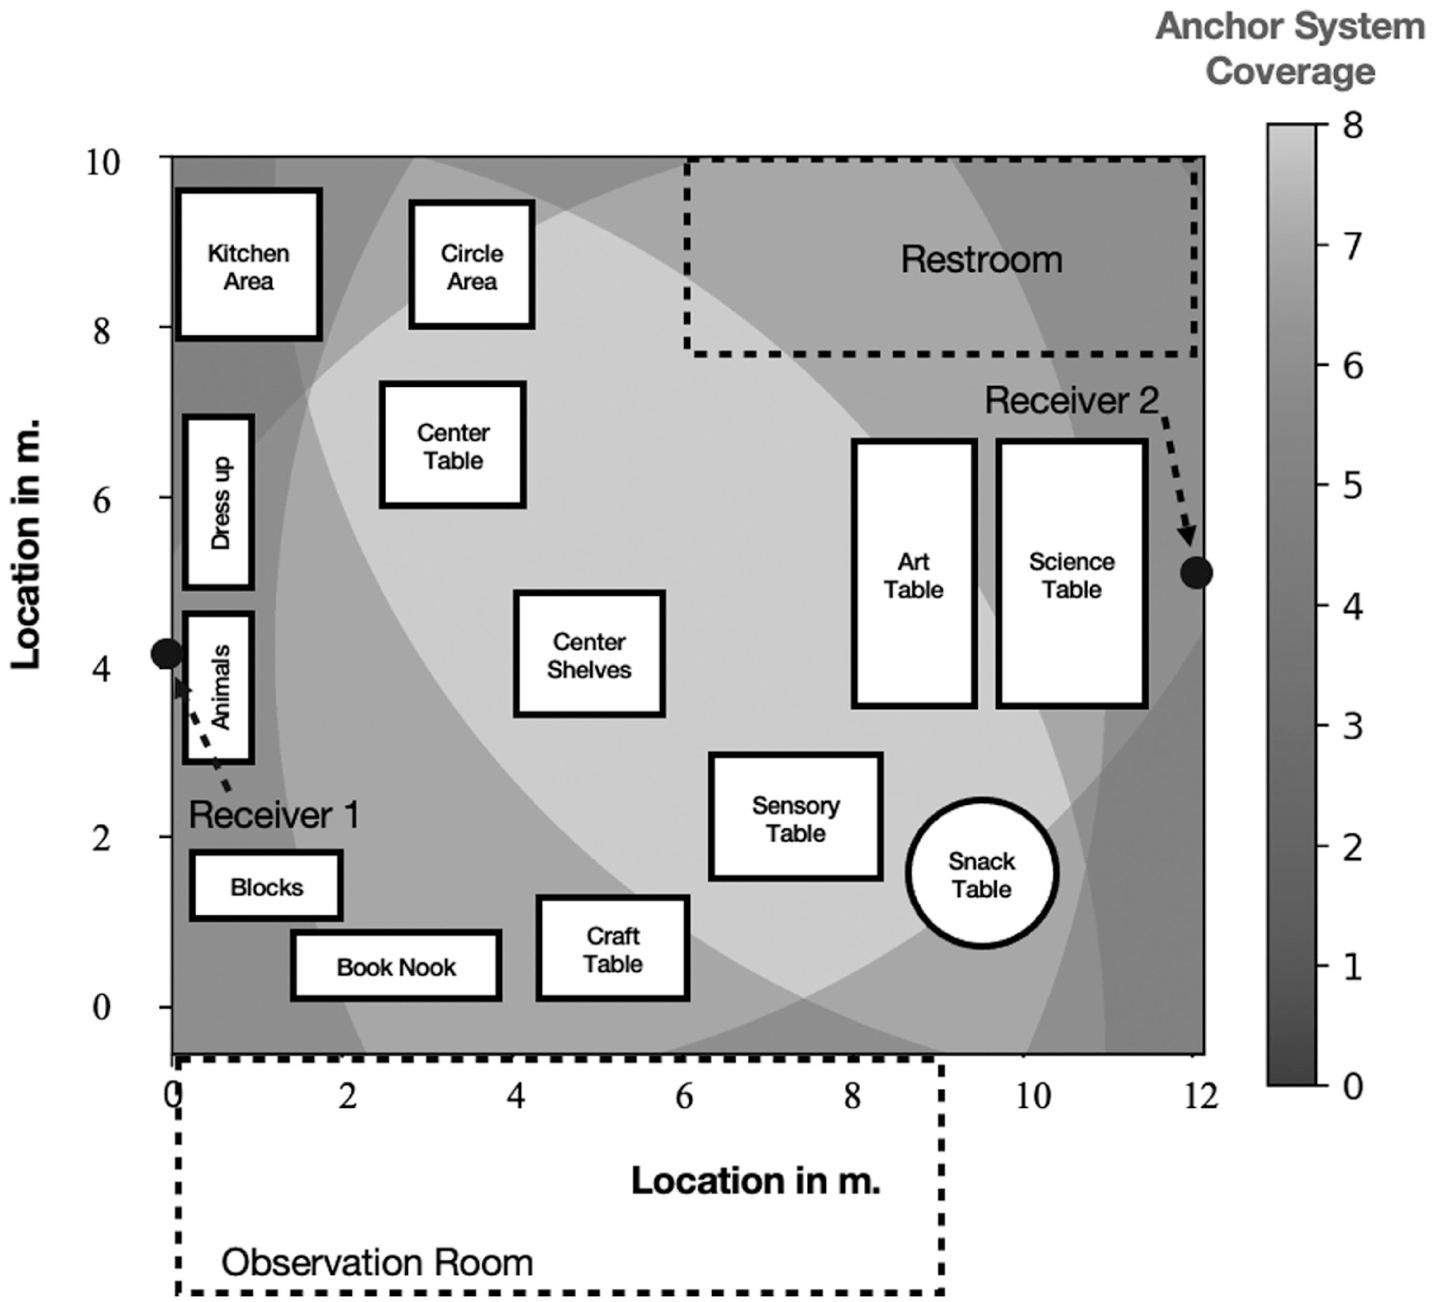
Anchor system coverage within the classroom.
During data collection, observational data were also gathered to record the location of participants in the classroom by at least two research assistants. Research assistants viewed classroom activities from an observation booth to avoid being distracted from classroom activities and ensure naturalistic interactions during data collection. Data from the various research assistants were compiled into a single report and compared with sensor data to ensure accuracy. The participants wore different colored shirts in which sensors were placed to aid with observational data collection. Reliability between observational data and sensor data was calculated by taking the total number of agreements for each second of the data collection period, divided by the total number of seconds of data collection. Reliability of observational data indicating each child’s location and location provided by the sensor data was 85% (range = 69–92%), most disagreements occurred when participants were actively moving about the classroom, and reflect the difficulty of live observational coding to capture each child’s location while many children are moving about the room simultaneously, not inaccurate data from the sensor. Furthermore, our agreement rates suggest that data from the sensor system was reliable and adjustments were not needed. Yet, the agreement rate confirmed the challenges noted in the introduction with observational data collection.
Data collection via the sensor system used a computer-aided console that runs a program to access the sensor locations from the wall-mounted receiver units. Data were collected for all child and teacher participants and then processed to measure interactional proximity. A threshold of 1 m was chosen empirically to determine proximity between any two children (peer proximity) and 3 m to determine proximity between a teacher and child (teacher proximity; see Bauminger, 2002; Shi et al., 2017). Interactional proximity was measured as the percentage of time each individual was within 1 m of another peer (peer proximity) or 3 m of a teacher (teacher proximity) and maintained that distance or more for at least 15 seconds. An instance of interactional proximity ended when the distance was more than 1 m for peer proximity (3 m for teacher proximity) for 10 seconds or more. This allowed for natural movement and minor fluctuation of interactional proximity during events. To identify each child’s peer initiation (moved into the proximity of a peer) and peer terminations (moved away from the proximity of a peer), we combined proximity data (within at least 1 m of a peer), and accelerometer data to infer who began (initiation), and who ended (termination) the instance of peer proximity. Combining proximity with accelerometer data allowed us to understand who moved into and who left instances of peer proximity.
Results
Peer Proximity
Peer proximity, instances in which a child was within at least 1 meter of one or more peers for 15 seconds or more, among the children in the classroom, was lowest for Omar. 36.8% of Omar’s time in the classroom was spent in the proximity of at least one peer. Peer proximity ranged from 56% to 79.8% with an average of 61.7% for all children except Omar (see Table 1). When exploring which peers Omar was in proximity to most frequently within the classroom, data indicate 20.8% of his instances of peer proximity included Fern, with other peers closer to 10% or less (see Table 1). Omar spent time in the proximity of all peers except Juniper, with whom he showed no instances of peer proximity.
Peer Initiations and Terminations
Peer initiations and terminations were similar for Omar and his peers (see Table 1). Omar initiated peer proximity (moved into the proximity of a peer) 46.5% of the time, while peer initiations were 49.8% on average, with a range of 39.2% to 57.8%. Omar terminated peer proximity (moved away from the proximity of a peer) 55.8% of the time, while peers terminated 49.3% on average, with a range of 34.3% to 69.7%. Terminations were highest for Juniper, indicating a need to support her in maintaining peer proximity to allow more opportunities for peer engagement.
Teacher Proximity
Teacher proximity, instances in which a teacher was within at least 3 m of a child for 15 seconds or more, has also been explored. The proximity between the head and assistant teachers and Omar, in comparison to other children in the classroom, was similar. For example, Omar was in the proximity with the head teacher 16% of the time, while the teacher’s proximity with other children was on average 10% (range = 0–18%). Omar’s proximity with the assistant teacher was lower at 4%, but the average proximity range with other children for the assistant teacher was also 10% (range = 0–19%). Although proximity with the assistant teacher was much lower, the overall proximity with teachers in the classroom was at a similar level to his peers, given the increased proximity with the head teacher.
Discussion
This study provided important insights into the use of sensor technologies to measure the interactional proximity of children with ASD and builds on existing research (Elbaum et al., 2024; Irvin et al., 2021) by adding analyses that help us understand instances of peer proximity initiations and terminations. In this study, we provided data related to the peer proximity of Omar in comparison to his classmates and comparisons of peer proximity initiations and terminations for Omar and his peers. These data provide promise that a sensor system of this nature may be helpful and serve as a complimentary tool for educators to gather data related to child peer proximity and inform interventions such as peer-mediated interventions. The sensor system may also be useful for researchers to use in large-scale projects exploring child social engagement.
The data gathered in this study show that Omar had lower levels of peer proximity than his classmates. However, it is unclear if this is a natural variation, a reflection of ASD, or if it may indicate a need for additional support to allow more opportunities for him to engage socially with peers. Additional studies are needed to further understand these dynamics. Omar was most frequently in proximity to Fern, indicating there may be familiarity or comfort with her over other children in the classroom. Information of this nature could be helpful for teachers when making decisions related to peer-mediated interventions for children with social engagement needs. Similarly, data of this nature could be used to help teachers support peer proximity between children for whom it occurs less frequently. In addition, information related to peer proximity initiations and terminations shows that although Omar was in peer proximity less frequently than his classmates, his levels of peer proximity initiations and terminations were within the normal range compared to peers. This tells us that an intervention focused on increasing the length and frequency of his interventions may be more relevant to his needs (McConnell, 2002) than peer initiations and terminations.
In addition, although not the primary focus of this study, the patterns of data for peers in the classroom provide insights into the variance of peer proximity for other children in the classroom and may indicate which children would benefit from support to improve their peer proximity, as well as peer proximity initiations and terminations. For example, although Juniper was in frequent proximity of peers and showed peer proximity initiations over 50% of the time, her peer proximity terminations were much higher than those of her peers at nearly 70%. This is not surprising given her sensory processing disorder, which can make social situations overwhelming at times (Ismael et al., 2015) and may result in her leaving the proximity of peers more frequently. Similarly, findings indicate that Carla and Hugh had the lowest levels of peer proximity, which may indicate natural variance, or may indicate a need for educator support to better initiate and maintain peer proximity and increase opportunities to engage with peers. Fern and Gan also showed low levels of peer proximity. Again, this may be part of natural variation among children or may indicate a need for educator support to improve peer proximity and opportunities to engage with peers.
Teacher proximity within the study provided insight into the level of support adults in the classroom were providing to Omar. Our data showed that both the teacher and the teacher assistant were in proximity to Omar (similar to the levels of peer proximity during free play time). This suggests that teachers were nearby, as well as physically available to support peer proximity. These data may also indicate that within this classroom, there was not an overreliance on the use of the teacher assistant to support Omar, as demonstrated by frequent proximity, which has been shown in previous studies to limit peer engagement (see Giangreco et al., 2011). The use of this tool may help to measure and ensure appropriate levels of teacher and paraeducator proximity to children with ASD in both research and educational applications.
Limitations and Future Research Directions
While this study provides important contributions to the sensor technology literature related to children with ASD, there are some limitations that should be noted. First, given the exploratory nature of this study and the new application of the technology, the study was conducted within a single classroom. Future research should be conducted to understand the feasibility and usability of the technology in other classrooms as well as understand if the patterns of interactional proximity we observed in this classroom are consistent with other classrooms or reflect natural variations and preferences among children. In addition, although we attempted to obtain consent for all children in the classroom as part of our research, we were only able to collect data from children for whom we had both parental and child consent. Instances of interactional proximity were not captured for children for whom we did not have consent. Although this is a limitation within research, in practice teachers may also face barriers to implementing technology as privacy or ethical related concerns with technology of this nature can be a barrier. We worked to minimize this within our study by avoiding the use of video and audio data, but we still recognize the concerns that some individuals may have regarding technology of this nature. However, it should be noted that vendor-supported technologies are being readily used within classroom settings and collect data that is considered more sensitive than that gathered in this study (Attai, 2020). In addition, these tools are often integrated into the educational system without the same level of consent required in research uses. Therefore, we emphasize that researchers should not shy away from innovative technology because of privacy concerns. Ultimately, a conservative approach when it comes to technology applications in research may put researchers at a disadvantage in finding innovative solutions and remaining on the cutting edge compared to industry or educational settings themselves and further complicate the research-to-practice divide.
Another limitation within this study is that the t-shirt placement of the sensors did not allow us to detect directionality for children. However, we were able to use acceleration data to infer peer initiations and terminations. Future research should explore two sensor placements (one on each shoulder), to enable more accurate collection of directionality data. In addition, although we suspect that teacher access to sensor data may be a useful instructional tool, we did not assess that within this study. Future research should explore the use of WHIT with teachers to inform instructional decision-making and identify practical applications for this tool within educational settings.
Given the various ways in which data can be captured using the WHIT sensor (i.e., location, proximity, and acceleration), there are numerous ways in which these data can be combined in future research to better understand interaction proximity. Future research could explore the combination of location and peer proximity to infer the spaces in which children are most and least in peer proximity. This can help teachers understand how they can best support children’s social engagement through the inclusion of preferred social activities or through targeted support in activities where peer proximity is low. Similarly, teacher proximity data can be combined with child social proximity data to infer when teachers may be supporting peer engagement. This can help teachers adjust their practices to better meet the social engagement needs of children in the classroom.
Conclusion
Sensor technology has the potential to transform educator practices in positive and efficient ways. The data gathered in this study provided important insights about Omar’s interactional proximity, including peer proximity, initiations, and terminations, as well as teacher proximity. This information could be used by his teachers to inform educational practices, such as intervention selection, strategies, and implementation of peer-mediated interventions. WHIT offers an alternative or could be used as a complementary tool by teachers to help make decisions to support social engagement. WHIT could be used to monitor peer and teacher proximity for children over time.
Footnotes
Associate Editor: Jennifer Ledford
Funding
This work was partially supported by the National Science Foundation’s Smart and Connected Health Program grant Award 2306499.
Declaration of Conflicting Interests
The authors declared no potential conflicts of interest with respect to the research, authorship, and/or publication of this article.