
Abstract
This study extends prior inquiry examining educators’ well-being in the context of Comprehensive, Integrated, Three-Tiered (Ci3T) models, one type of integrated tiered system. We investigated educators’ well-being (self-efficacy, burnout) and implementation (treatment integrity, social validity) during the post-pandemic era among educators in schools with ≥3 years of Ci3T implementation. Findings indicated consistently high levels of treatment integrity and social validity (>80%) across 2 years. In terms of well-being, educators in this post-pandemic sample were comparable to a pre-pandemic sample of educators implementing Ci3T. Relative to a pre-pandemic comparison sample, educators reported higher and increasing efficacy for instructional strategies and classroom management, as well as lower depersonalization and higher personal accomplishment. Yet educators also reported elevated levels of emotional exhaustion. Results identified individual- and school-level predictors of implementation and efficacy. As with studies of educator well-being in integrated tiered systems prior to the pandemic, fall treatment integrity consistently predicted educators’ spring self-efficacy across domains. Results also showed educators’ fall efficacy for student engagement predicted higher spring treatment integrity, suggesting a reciprocal relationship between constructs.
Introduction
Many school and district leaders have adopted integrated tiered systems to efficiently and effectively support K-12 students’ learning (Briesch et al., 2022). Tiered systems provide a range of supports of increasing intensity. Tier 1 is comprised of universal strategies and practices, and teacher-delivered strategies to maximize engagement (e.g., increased opportunities to respond). More focused interventions are offered at Tier 2 (e.g., self-monitoring plans for students to improve specific skills or behaviors), and intensive interventions at Tier 3 (e.g., functional assessment-based interventions; Umbreit et al., 2024). The most intensive interventions are reserved for students for whom Tier 1 and 2 alone are not meeting their needs (Lane et al., 2020; Sugai & Horner, 2006). Given that students’ needs span academic, behavioral, and social and emotional well-being learning domains (Lane et al., 2020) and their needs across these domains interact with one another (e.g., Quílez-Robres et al., 2021), it is important for education leaders to develop a comprehensive tiered system to address these domains in an integrated fashion.
The Comprehensive, Integrated, Three-Tiered (Ci3T) model of prevention is one type of integrated tiered system of support designed to address students’ needs across these three key learning domains: academic, behavioral, and social and emotional well-being (Lane et al., 2020). Some key components of Ci3T include (a) evidence-based curricula for each learning domain; (b) monitoring of implementation efforts, including treatment integrity and implementers’ views of goals, procedures, and outcomes (social validity) in fall and spring; (c) clear entry and exit criteria for students needing Tier 2 and 3 supports; (d) systematic screening and data collection to facilitate decision-making for appropriate instruction and intervention (fall, winter, spring); and (e) multiple sources of data to inform professional learning for educators to address areas of implementation which need additional attention (Buckman et al., 2025; Lane et al., 2011; Lane et al., 2020). With the ambitious scope of Ci3T—ensuring all students’ needs are comprehensively monitored and met—it is important to understand how educators fare in schools implementing Ci3T (Oakes et al., 2021). For instance, does experience in a Ci3T system with data-informed decision-making enhance educators’ self-efficacy for instructional strategies, classroom management, and student engagement? Is the implementation of Ci3T associated with educator burnout dimensions of emotional exhaustion (e.g., feeling “worn down”), depersonalization (e.g., withdrawing from engaging with students), and lack of personal accomplishment (e.g., feeling unable to make a difference in their work)? These are important questions, as teacher burnout and self-efficacy are associated with a range of key outcomes, including teacher health and well-being (Madigan et al., 2023; Zee & Koomen, 2016), teacher attrition (Billingsley & Bettini, 2019; Brunsting et al., 2024), teacher implementation of evidence-based practices (Cumming et al., 2021; Georgiou et al., 2020), and student outcomes (Lauermann & ten Hagen, 2021; Madigan & Kim, 2021).
Prior research documented initial Ci3T implementers—educators who deliver instruction to students in schools in their first 2 years implementing Ci3T—fare well. Namely, elementary, middle, and high school general and special education teachers, related service professionals, and staff during initial Ci3T implementation experienced lower depersonalization, higher personal accomplishment, and higher self-efficacy for instructional strategies and classroom management than national samples of educators (secondary settings, Lane et al., 2021; elementary settings, Oakes et al., 2021). Although promising, results from these prior studies are limited in that (a) they did not examine change over time and (b) they occurred before the COVID-19 pandemic, during which additional stressors shaped educators’ burnout and self-efficacy (Pressley, 2021; Pressley & Ha, 2021). Furthermore, researchers have yet to examine burnout and self-efficacy among experienced Ci3T implementers to understand how educators fare as Ci3T becomes established as a standard practice within their schools and professional learning and supports characteristic of initial implementation begin to wane (Buckman et al., 2025), a pattern implementation science suggests may lead to declines in treatment integrity and undercut intended outcomes (Fixsen, 2025; Fixsen et al., 2010). Thus, the purpose of this study was to examine longitudinally the self-efficacy and burnout of educators who are experienced implementers of Ci3T, exploring not only shifts in teacher well-being and implementation efforts over time, but also the relation between Ci3T implementation (treatment integrity), educators’ views regarding social validity, and key constructs related to treatment integrity (e.g., educators’ efficacy, burnout).
Educators’ Self-Efficacy
Educators’ self-efficacy refers to educators’ conceptions of their individual capabilities to effect positive outcomes for students through their teaching (Bandura, 1982; Hussain et al., 2022). Researchers have focused on self-efficacy in three dimensions of teaching: instructional strategies, classroom management, and student engagement (Tschannen-Moran & Woolfolk Hoy, 2001). Given the benefits of educator self-efficacy, researchers have investigated educator characteristics (e.g., personality, sex, age, experience) that may increase self-efficacy. Although results vary across samples, studies generally suggest years of teaching experience, positive affect, resilience-oriented personality traits, and potentially higher social validity are associated with greater self-efficacy (Klassen & Chiu, 2010; Klassen & Tze, 2014; Oakes et al., 2013).
Less is known about how malleable, external factors such as professional learning opportunities or working in integrated tiered systems, such as Ci3T, shape educators’ self-efficacy. Interventions using coaching in evidence-based practice use and opportunities to practice achieving mastery have demonstrated the highest efficacy in increasing teacher self-efficacy (Tschannen-Moran & McMaster, 2009). For example, the BEST in CLASS intervention used practice-based coaching, evidence-based practices to support students with emotional and behavioral disorders, and ongoing training during teaching to enhance PK-3 teachers’ self-efficacy for classroom management (Conroy et al., 2019). In Ci3T, district and school leaders engage in data-informed professional learning to create training and coaching supports that are customized in both topic and intensity based on multiple data sources (e.g., treatment integrity, social validity, student outcomes). This systematic and individualized approach may extend beyond general classroom management training by aligning supports to educators’ specific implementation needs, with increases in teacher efficacy representing one important potential outcome.
Initial Implementers’ Self-Efficacy in Ci3T Systems
Implementing Ci3T broadens educators’ professional learning and evidence-based supports, including (a) increasing access to resources on instructional strategies, curricula, and classroom routines, (b) receiving coaching from Ci3T research team members and/or district Ci3T coaches, and (c) using treatment integrity and social validity data to target professional learning (Lane et al., 2020). Three studies have been conducted in which researchers examined linkages between Ci3T implementation and self-efficacy for initial implementers (i.e., those in their first 2 years of implementing Ci3T). With a sample of 86 middle school teachers in two schools completing their first year of implementing Ci3T, Oakes et al. (2013) found no statistically significant differences between teachers’ self-efficacy and that of a national sample. Lane et al. (2021) extended this study with a sample of 82 educators in four middle schools and two high schools completing their second year of Ci3T implementation, finding Ci3T educators reported significantly higher self-efficacy for instructional strategies and classroom management, with a low-to-medium effect size for instructional strategies (g = 0.27) and a medium-to-large effect size for classroom management (g = 0.57). Yet, they also reported lower self-efficacy than the national sample for student engagement, with a medium effect size (g = 0.47). Observed treatment integrity of Ci3T significantly predicted higher self-efficacy for each of the three self-efficacy dimensions. Oakes et al. (2021) conducted a similar analysis of 119 educators across 14 elementary schools in their second year of Ci3T implementation, recording the same findings as Lane et al. (2021) for educator self-efficacy compared to the national sample. Furthermore, treatment integrity was a positive, statistically significant predictor of all three dimensions of educator self-efficacy. Collectively, results from these studies revealed mixed but mostly positive educator self-efficacy for initial implementers of Ci3T, which appeared to be linked in part with the degree to which they implemented Ci3T as intended (i.e., treatment integrity). In addition to the importance of exploring educators’ self-efficacy, it is equally important to explore educator burnout.
Educators’ Burnout
Burnout occurs when one’s capacity and resources to cope with stress are overwhelmed, resulting in emotional exhaustion (i.e., feeling worn down, experiencing brain fog), depersonalization (i.e., becoming cynical or withdrawing from engaging students), and/or lack of personal accomplishment (i.e., feeling one is not able to make a meaningful difference; Maslach, 2003). Similar to self-efficacy, burnout is contextual, and researchers focusing on teacher burnout examine teachers’ experience of being overwhelmed by work stress (Brunsting et al., 2025). Given that teachers experiencing high burnout have a range of negative outcomes, including poor health and well-being, attrition, and lower student outcomes (Billingsley & Bettini, 2019; Madigan & Kim, 2021; Madigan et al., 2023), researchers have explored a range of personal characteristics and external factors that may buffer burnout. Similar to predictors of self-efficacy, personality characteristics such as positive affect, hardiness, and coping self-efficacy appear to be consistently associated with lower burnout (Chang, 2009). With respect to personal demographics, more research is needed to understand the relation between ethno-racial backgrounds and burnout (Brunsting et al., 2025). Findings regarding sex are mixed. Although Oakes et al. (2013) found female teachers were more likely than their male counterparts to indicate lower levels of personal accomplishment (r = .16), the most typical pattern of differences is for female teachers to report higher emotional exhaustion while male teachers report higher depersonalization and lower personal accomplishment (Chang, 2009).
As personal characteristics are either less or unmalleable, researchers have focused on identifying school responsibilities and resources contributing to or buffering against teachers’ burnout. Consistently, studies have identified administrative support as a buffer for teacher burnout (Brunsting et al., 2023; Perrone et al., 2019). In addition, given that higher teacher self-efficacy for classroom management is significantly associated with lower burnout (Aloe et al., 2014; Garwood et al., 2018; Pas et al., 2010), interventions and systems supporting classroom management practices, as well as strong instructional practices, may reduce burnout as well.
Initial Implementers’ Burnout in Ci3T
Ci3T models of prevention provide system-level support for classroom management and for challenging behavior (Lane et al., 2020; Lane et al., 2026), while also promoting the use of strong, evidence-based instruction, which in itself is an effective behavior management strategy grounded in applied behavior analytic principles (Cooper et al., 2020; Lane et al., 2018). Three studies have examined initial implementers’ experiences of burnout in Ci3T. Oakes et al. (2013) explored predictors of burnout dimensions in 86 teachers in two middle schools, finding that higher treatment integrity of Ci3T Tier 1 practices predicted significantly lower depersonalization for teachers. Yet, this finding was not replicated in two similar studies; although the relationship between treatment integrity and burnout dimensions was in the expected directions (i.e., buffering), none reached significance (Lane et al., 2021; Oakes et al., 2021). Both Lane et al. (2021; middle & high schools) and Oakes et al. (2021; elementary school) found that Ci3T initial implementers reported lower depersonalization and higher personal accomplishment levels compared to a national sample of teachers, with large to very large effect sizes for both outcomes in both studies. No significant differences were found for emotional exhaustion. Results showed a potential link between Ci3T's initial implementation and reduced educator burnout. Yet, all studies conducted have focused on a single timepoint, not yet exploring how elementary Ci3T implementers fare over time in Ci3T systems. Furthermore, additional research is needed to examine whether these positive educator outcomes observed during initial implementation are also evident in schools working to sustain Ci3T implementation over time.
Purpose
Building on preliminary findings of elementary educators’ burnout and self-efficacy during initial implementation of Ci3T, we conducted this longitudinal, descriptive study of elementary educators’ well-being in Ci3T models of prevention as part of Project ENHANCE, an integrated tiered system of supports network grant funded by the Institute for Education Sciences (IES, 2018–24; Lane, 2019-2026). The pre-registered aim of this study was to determine the impact of Enhanced Ci3T implementation on outcomes for teachers at elementary schools that have sustained Ci3T implementation over multiple years (i.e., ≥3). Previous research on initial Ci3T implementation suggests potential for positive educator outcomes. Yet, direct examination is needed to determine whether these outcomes are also evident as schools work to sustain implementation over time. This inquiry comes at a particularly important moment as educators continue to cope with increased stressors following the COVID-19 pandemic, which may contribute to teacher burnout (Pressley, 2021; Pressley & Ha, 2021). Research questions included:
Method
Participants and Setting
Participants included 298 elementary educators teaching K-5 students in Ci3T systems from 26 schools across four districts in two states (see Table 1 for participant characteristics and Open Science Framework [OSF] Supplemental Materials (Lane et al., 2022) for school characteristics) in Year 1 (2022–2023), and 195 elementary educators in Year 2 (2023–2024). In Year 1, most participants were female (n = 245; 82.21%), White (n = 262; 87.92%) general educators (n = 190; 63.76%) with high levels of experience (M = 14.97 years; SD = 9.29). Most participants earned a master’s degree or higher and completed a course or professional development in classroom management (n = 251; 84.23%), academic screening (n = 235; 78.86%), and behavior screening (n = 204; 68.46 %).
Participant Characteristics of Ci3T Implementers Providing Input on Teacher Well-Being.
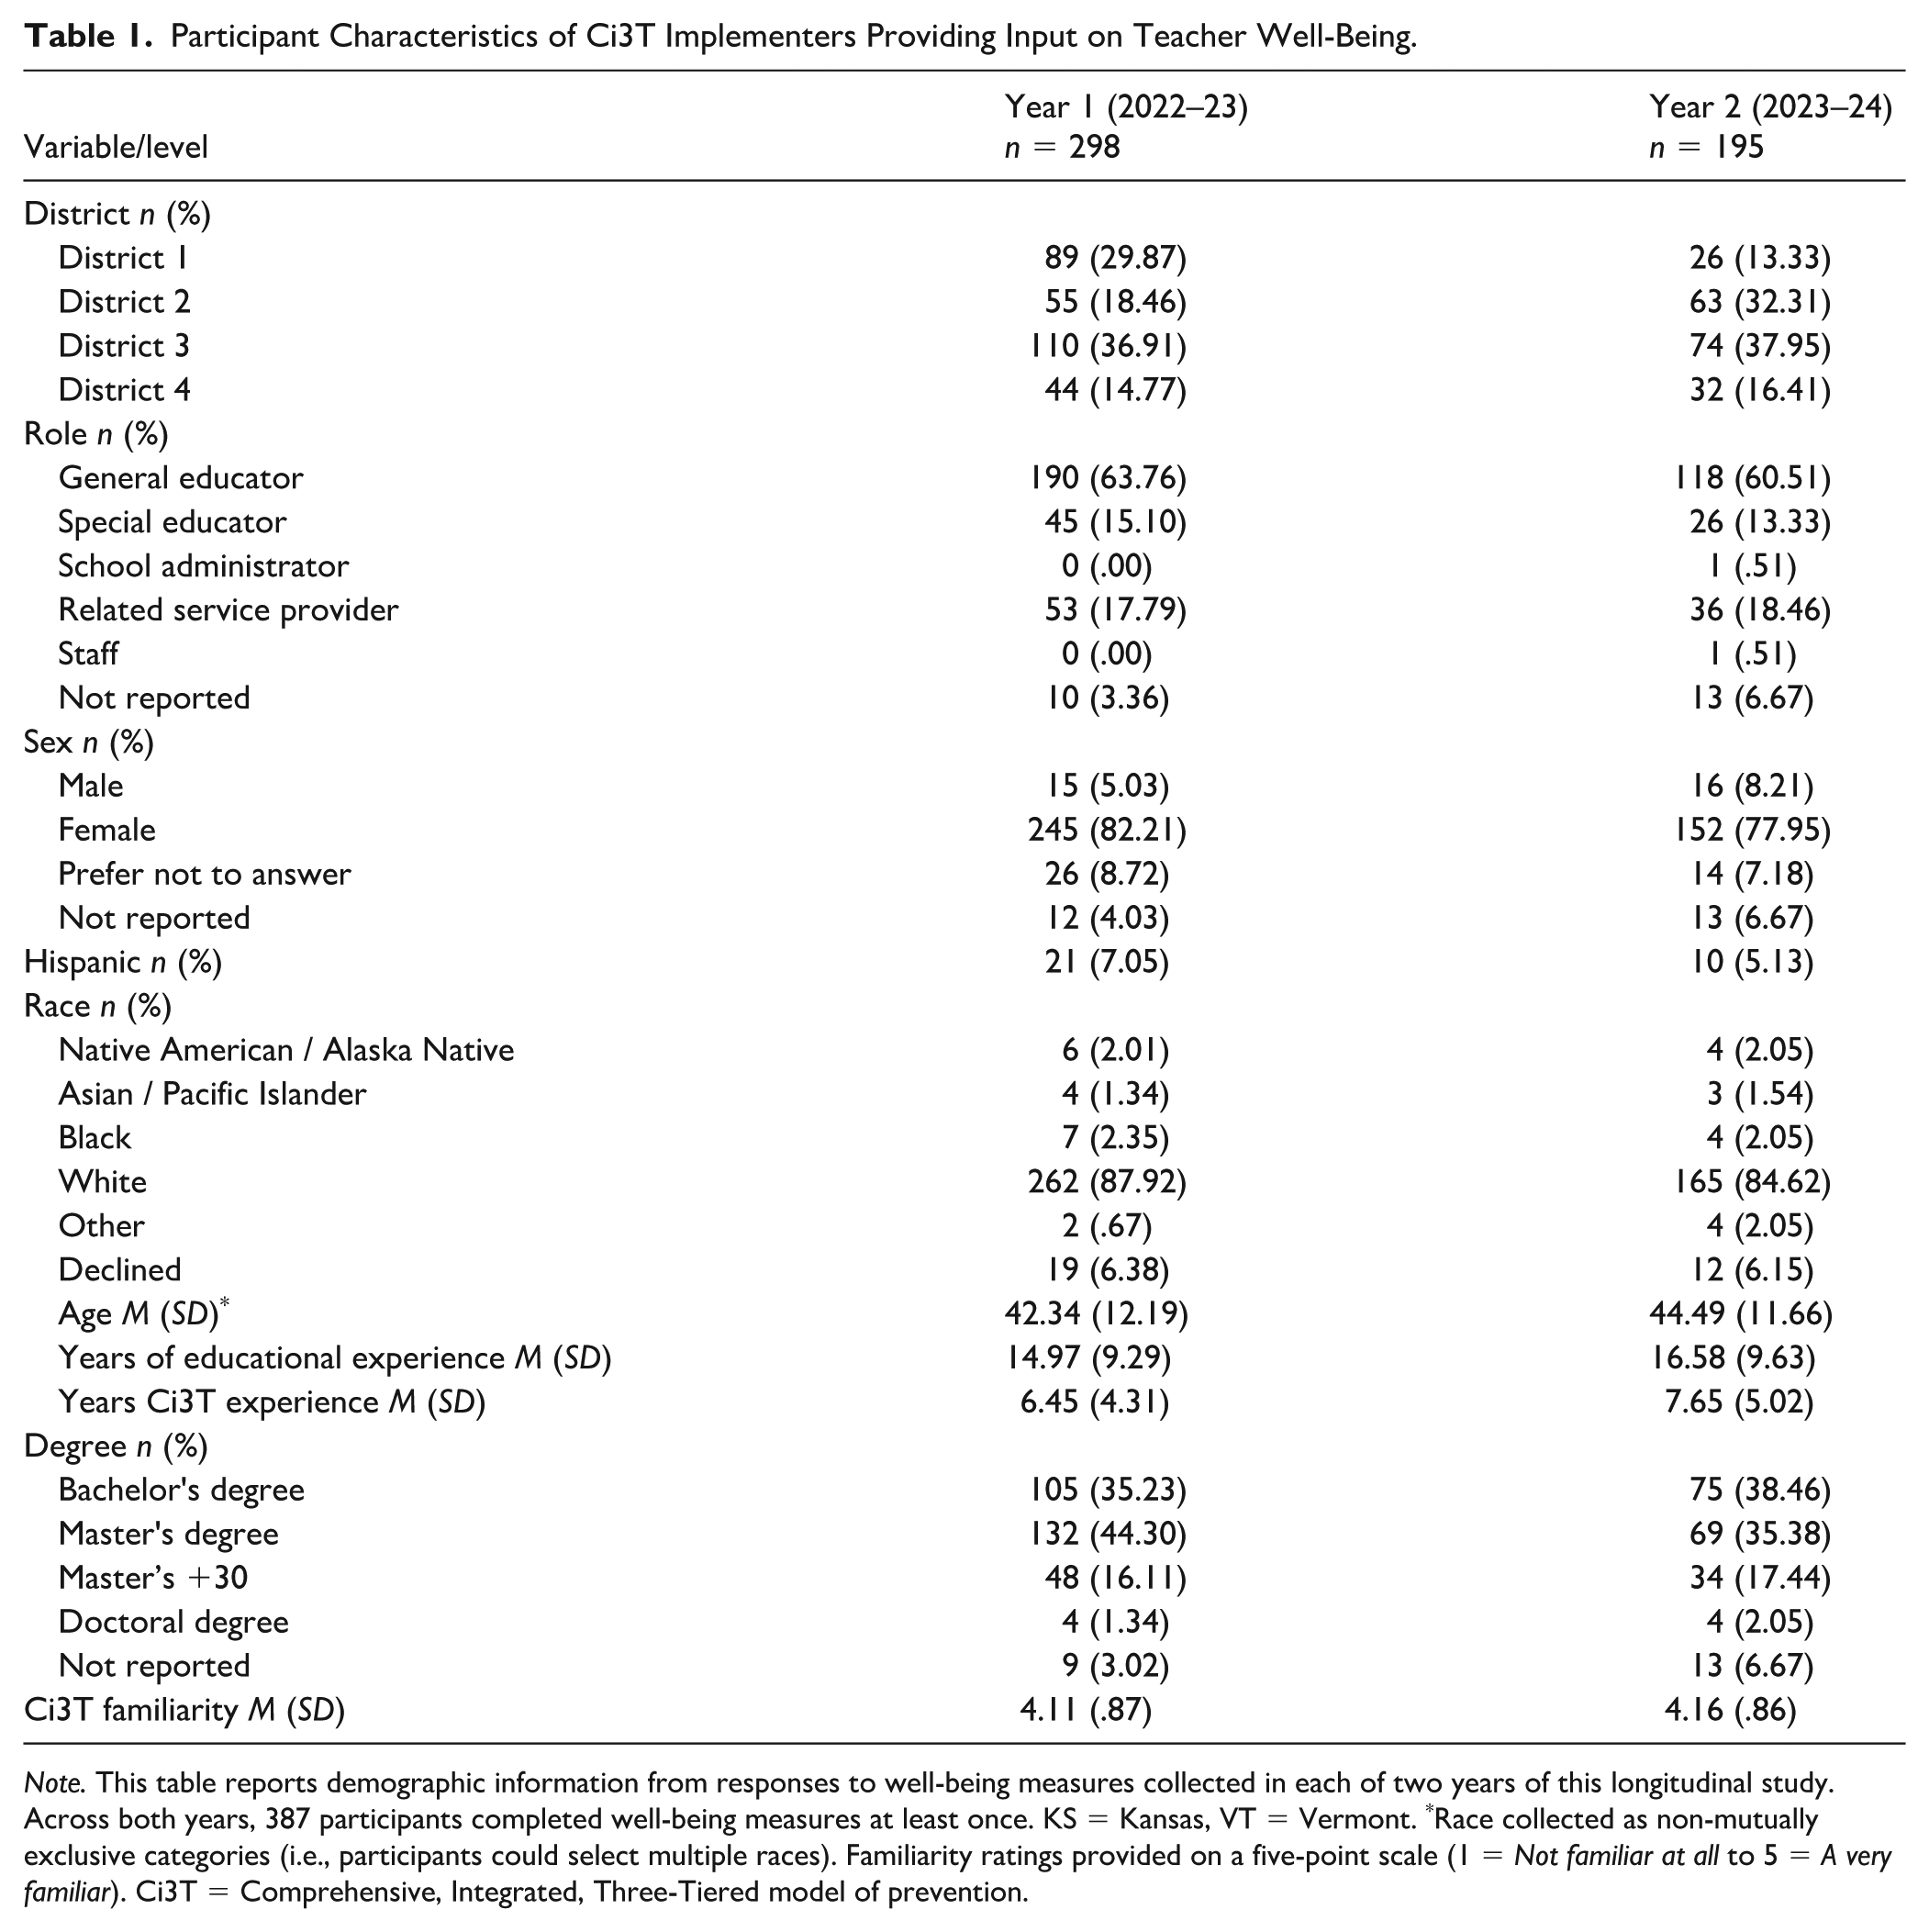
Note. This table reports demographic information from responses to well-being measures collected in each of two years of this longitudinal study. Across both years, 387 participants completed well-being measures at least once. KS = Kansas, VT = Vermont. *Race collected as non-mutually exclusive categories (i.e., participants could select multiple races). Familiarity ratings provided on a five-point scale (1 = Not familiar at all to 5 = A very familiar). Ci3T = Comprehensive, Integrated, Three-Tiered model of prevention.
The 26 participating schools were implementing Ci3T separately from this study as part of district-wide (PreK-12) regular school practices. Each school-site had a Ci3T Leadership Team and a District Ci3T Team, supporting Ci3T implementation (see OSF Supplemental Materials (Lane et al., 2022) for implementation activities, Lane et al., 2022; see Buckman et al., 2026 for Ci3T Leadership Team learning outcomes). Not all schools began implementing Ci3T at the same time; Ci3T years of implementation ranged from 3 to 9 years (M = 6.45, SD = 4.31).
Procedures
University researchers from six universities partnered with four districts (N = 3 Kansas, N = 1 Vermont) as part of university and district-approved procedures to examine educators’ well-being, one of the research objectives detailed in this IES-funded Network Grant. We invited all faculty, staff, and administrators (collectively referred to as educators in this manuscript) from participating districts to participate in Project ENHANCE, including each school’s adult Ci3T Leadership Team members (detailed in Buckman et al., 2025). All faculty and staff received an informational letter detailing project procedures. We sent surveys (efficacy and burnout, see measures below) to educators who delivered instruction to students as part of research procedures. Between 4 and 50 educators per school contributed information on their well-being during at least one of four timepoints (Fall 2022 to Spring 2024, all following the onset of the COVID-19 pandemic), with all available data analyzed and reported in this study.
Each school implemented Ci3T as part of regular school practices separate from this study. For example, each school had a Ci3T Implementation Manual, detailing roles and responsibilities for students, faculty, staff, families, and administrators. Specific Ci3T components included: (a) Primary (Tier 1) Plan listing academic, behavioral, and social and emotional well-being elements for each group, (b) Reactive Plan featuring a six-step instructional approach for responding to challenging behavior as well as guidance for managing major and minor infractions, (c) Expectation Matrix detailing expected behaviors for all key settings, (d) Assessment Schedule detailing all information collected on all students as well as programmatic measures (e.g., treatment integrity, social validity), (e) Secondary (Tier 2) Intervention Grid and (f) Tertiary (Tier 3) Intervention Grid featuring the name and description of each intervention, school-wide data used for entry criteria, data to monitor progress, and exit criteria.
Faculty and staff used this Ci3T Implementation Manual to guide their implementation, and they completed district Ci3T implementation measures as part of their typical duties in fall and spring each year. These measures included the Ci3T Treatment Integrity: Teacher Self-Report (Ci3T TI: TSR version 1.1) and the Primary Intervention Rating Scale (PIRS; see measures for description). In addition, faculty and staff had access to a range of professional learning opportunities through their district and the Ci3T research team (e.g., Ci3T EMPOWER sessions, Ci3T Trainer and Coaches calls) as well as access to Enhancing Ci3T Modules (www.ci3t.org/enhance) developed throughout the course of this 2-year project (see Buckman et al., 2024, 2025 for the design process). School-site Ci3T Leadership Teams reviewed implementation and student-level data to inform the professional learning efforts they conducted and organized for their faculty and staff. Some Ci3T Leadership Teams shared resources from these modules (e.g., infographics, videos) or assisted their colleagues in reviewing modules in full (for a complete listing of the modules and descriptions of the design process of Enhancing Ci3T Modules, see OSF Supplemental Materials; Lane et al., 2022).
In addition to district-completed measures (i.e., Ci3T TI: TSR, PIRS), educators who provided instruction to students were invited to complete two research measures, brief surveys about their own professional well-being, in each Fall and Spring during the 2-year project period. These measures included: the Teachers’ Sense of Efficacy Scale (TSES) and the Teacher–Maslach Burnout Inventory–Educators’ Survey (MBI; see measures for description). Districts also conducted direct observations of Ci3T implementation for ~25% of their teachers. Yet, only a small number of participants in this study who completed the teacher well-being measures also had direct observation data, making it not possible to analyze direct observation data.
Ci3T research personnel distributed research measures using Qualtrics, counterbalancing the order in which educators completed the TSES and MBI, with a Ci3T demographic form completed at the end of each distribution. Ci3T research personnel entered item-level data into project-developed databases. We engaged in rigorous data cleaning processes, checking 100% of data entry and conducting data validation activities before analyzing data.
Measures
District Ci3T Implementation Measures
Ci3T Treatment Integrity: Teacher Self-Report (Ci3T TI: TSR Version 1.1)
The Ci3T TI: TSR (Lane, 2009; Lane et al., 2020) measures treatment integrity of Tier 1 prevention efforts. The measure includes 49 items across three subscales measuring: Procedures for Teaching (20 items; e.g., Did I differentiate instruction [academic tasks] as needed?), Reinforcing (13 items; e.g., Did I give tickets to students demonstrating school-wide expectations?), and Monitoring (16 items; e.g., Did I complete behavior screeners at each time requested by my principal or Ci3T Team?). Educators rate items using a 4-point Likert-type scale as follows: 0 = not at all, 1 = some of the time, 2 = most of the time, 3 = all of the time. Each subscale score is created by summing items, dividing by the total number of points possible after correcting for missing items, and multiplying by 100 to convert to a percentage. Items not rated are deducted from the total possible points. The Ci3T TI: TSR also features a total score computed by summing all completed items, dividing by the total possible score based on the number of items completed, then multiplying by 100. Levels of treatment integrity at the school level are computed by calculating the mean of all respondents for each subscale score and the total score. A member of the Ci3T District team distributed the Ci3T TI: TSR using their secure survey system (e.g., KITE or Qualtrics) in Fall and Spring to faculty and staff to assess treatment integrity from all stakeholders’ perspectives. Initial evaluation of the Ci3T TI: TSR 1.0 indicated each subscale demonstrates adequate-to-good internal consistency (α = .83, .76, .85, Procedures for Teaching, Reinforcing, and Monitoring, respectively; Bruhn, 2011). Alpha coefficients for the current sample with Ci3T TI: TSR (v1.1) ranged from α = .88–.90 for Procedures for Teaching, α = .84–.87 for Procedures for Reinforcing, α = .90–.91 for Procedures for Monitoring, and α = .94–.95 for the total score across administration timepoints. For purposes of this study, we used the Ci3T TI: TSR total score (percentage) for individual participants and school averages for data analysis (range: 0–100%).
Primary Intervention Rating Scale (PIRS)
Lane et al. (2002) adapted the Intervention Rating Profile (Witt & Elliott, 1985) to create the PIRS, designed to assess educators’ views of Tier 1 regarding social significance of intervention goals, social acceptability of intervention procedures, and social importance of associated outcomes. The PIRS includes 17 items rated on a 6-point Likert-type scale ranging from 1 (strongly disagree) to 6 (strongly agree; range 17–102), with higher scores indicating higher acceptability. A member of the Ci3T District team distributed the PIRS using their secure survey system (e.g., KITE or Qualtrics) in Fall and Spring of each year to faculty and staff to assess social validity from adult perspectives. Internal consistency estimates reported in the literature for this tool range from .88 to .98. Alpha coefficients for the current sample were α = .98 at each of the four timepoints. For purposes of this study, we used PIRS total scores (percentage) for individual participants and school averages for data analysis (range: 0–100%).
Research Measures
We estimated educators would spend 30–45 minutes to complete three research measures at each of four time points. The informational letter included this information, allowing teachers to make an informed decision at the onset of the project.
Teachers’ Sense of Efficacy Scale (TSES)
The TSES is a 24-item scale of teachers’ confidence in their ability to teach effectively (Tschannen-Moran & Woolfolk Hoy, 2001). Educators completed each item on a 9-point, Likert-type scale ranging from 1 (nothing/not at all) to 9 (a great deal), yielding three moderately correlated subscales (8 items each): efficacy for student engagement, efficacy for instructional strategies, and efficacy for classroom management. Total scores for each subscale ranged from 8 to 72, with higher scores indicating higher levels of efficacy. Tschannen-Moran and Woolfolk Hoy (2001) reported adequate internal consistency estimates (.94 for total score, subscale scores range from .87 to .90). In this study, we analyzed subscale scores for: (a) student engagement, (b) instructional strategies, and (c) classroom management. Alpha coefficients across timepoints in the present study ranged from .86 to .91 for student engagement, .88 to .89 for instructional strategies, and .87 to .90 for classroom management.
Maslach Burnout Inventory–Educators’ Survey
The MBI (Maslach et al., 1996) is a teacher-completed 22-item scale measuring: emotional exhaustion (9 items), depersonalization (5 items), and personal accomplishment (8 items; Maslach et al., 1996). Educators completed each item on a 7-point, Likert-type scale ranging from 0 (never) to 6 (everyday). Educator sample reliabilities reported in the literature ranged from .76 for depersonalization to .87 for emotional exhaustion, with evidence to indicate scores are sensitive to changes over time (Chang, 2009). The MBI technical manual provides guidance for computing means as well as categorical scores (low, moderate, and high). In this study, we analyzed total subscale scores: (a) emotional exhaustion, (b) depersonalization, and (c) personal accomplishment. Alpha coefficients for each subscale across timepoints in the present study ranged from .92 to .93 for emotional exhaustion, .66 to .69 for depersonalization, and .76 to .82 for personal accomplishment. The lower alpha coefficient for depersonalization is consistent with other research studies (see Brunsting et al., 2025).
Educator Demographics
Educators completed a Ci3T demographic form after completing both well-being measures. Demographic variables included: sex, race, ethnicity, length of professional experience, current assignment, types of professional development accessed, and frequency of access to currently available resources for professional learning.
Design and Analysis
In the OSF pre-registration, we referred to this study as a descriptive study (no control group, no randomization to conditions), more specifically, a single-group longitudinal study with a sample of schools with various years of Ci3T implementation experience. At the time of pre-registration, consenting was beginning, but none of the participants’ responses, including demographic data, had been reviewed.
We began by computing descriptive statistics to examine participant characteristics (see Table 1), treatment integrity (total scores, percentage; Table 2), social validity (total scores, percentage; Table 2), efficacy subscales (efficacy in student engagement, instructional strategies, and classroom management mean scores), and burnout subscales (emotional exhaustion, depersonalization, and personal accomplishment mean scores; Table 3). We computed a correlation matrix of these variables at each of four timepoints: Fall 2022, Spring 2023, Fall 2023, and Spring 2024 (see Tables S1–S4).
Teacher Treatment Integrity and Social Validity Over Time.
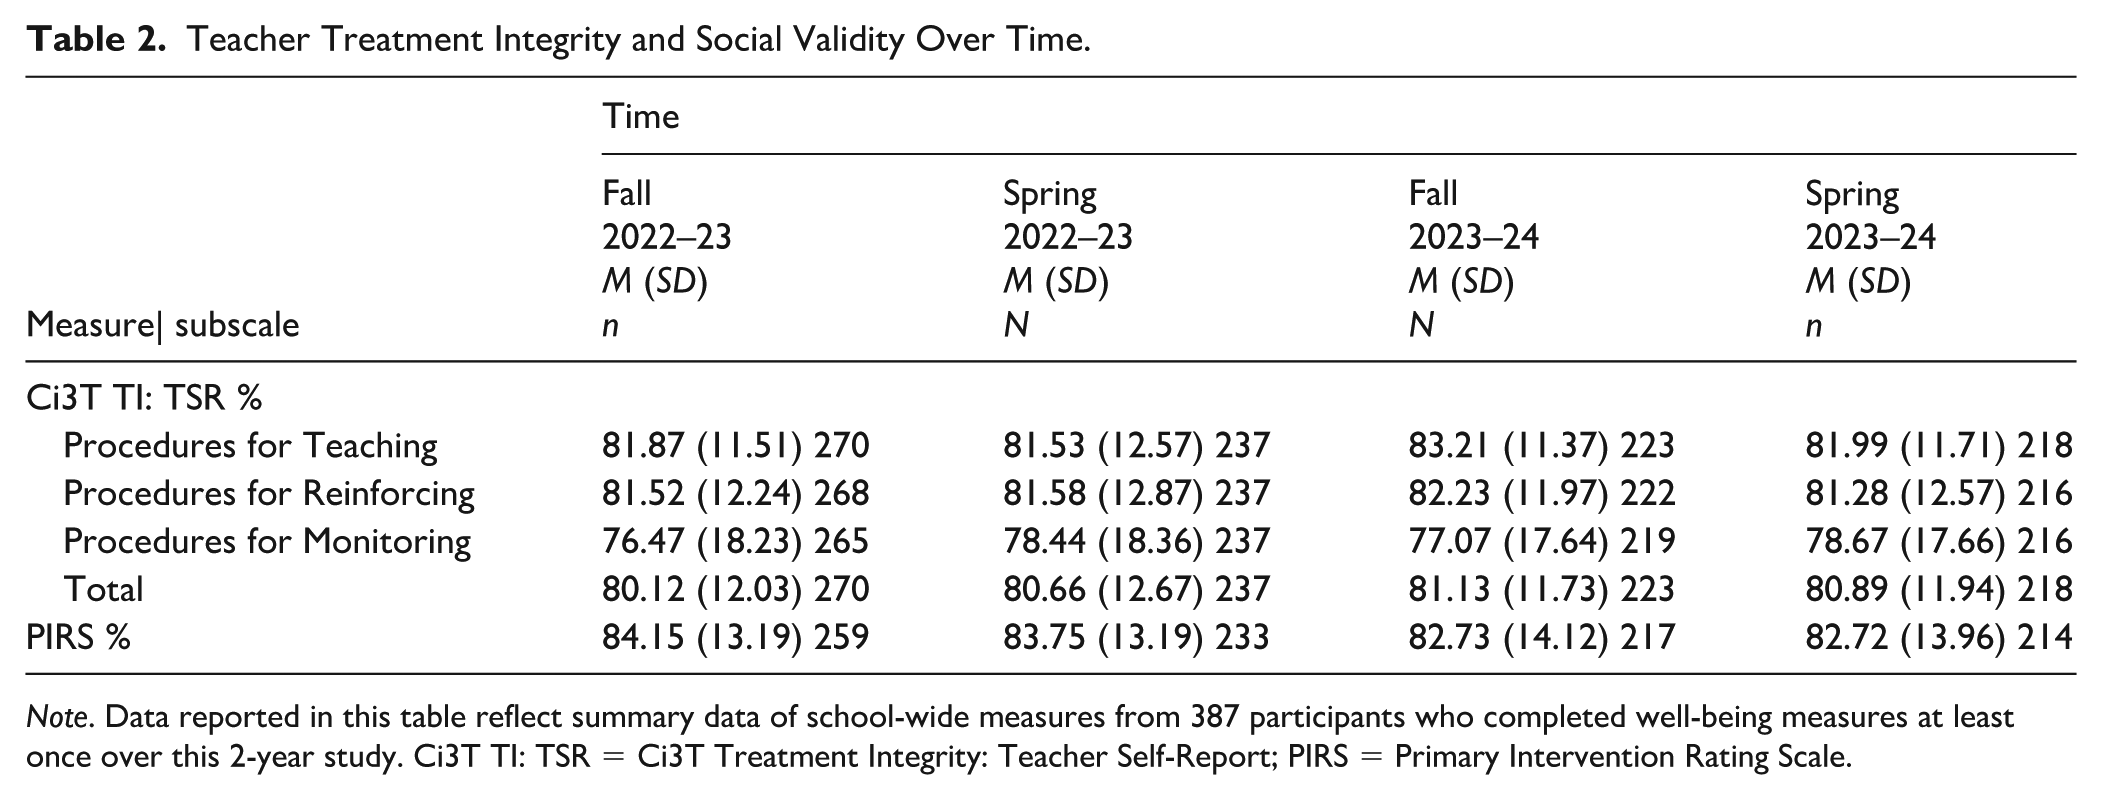
Note. Data reported in this table reflect summary data of school-wide measures from 387 participants who completed well-being measures at least once over this 2-year study. Ci3T TI: TSR = Ci3T Treatment Integrity: Teacher Self-Report; PIRS = Primary Intervention Rating Scale.
Teacher Efficacy and Burnout Over Time.
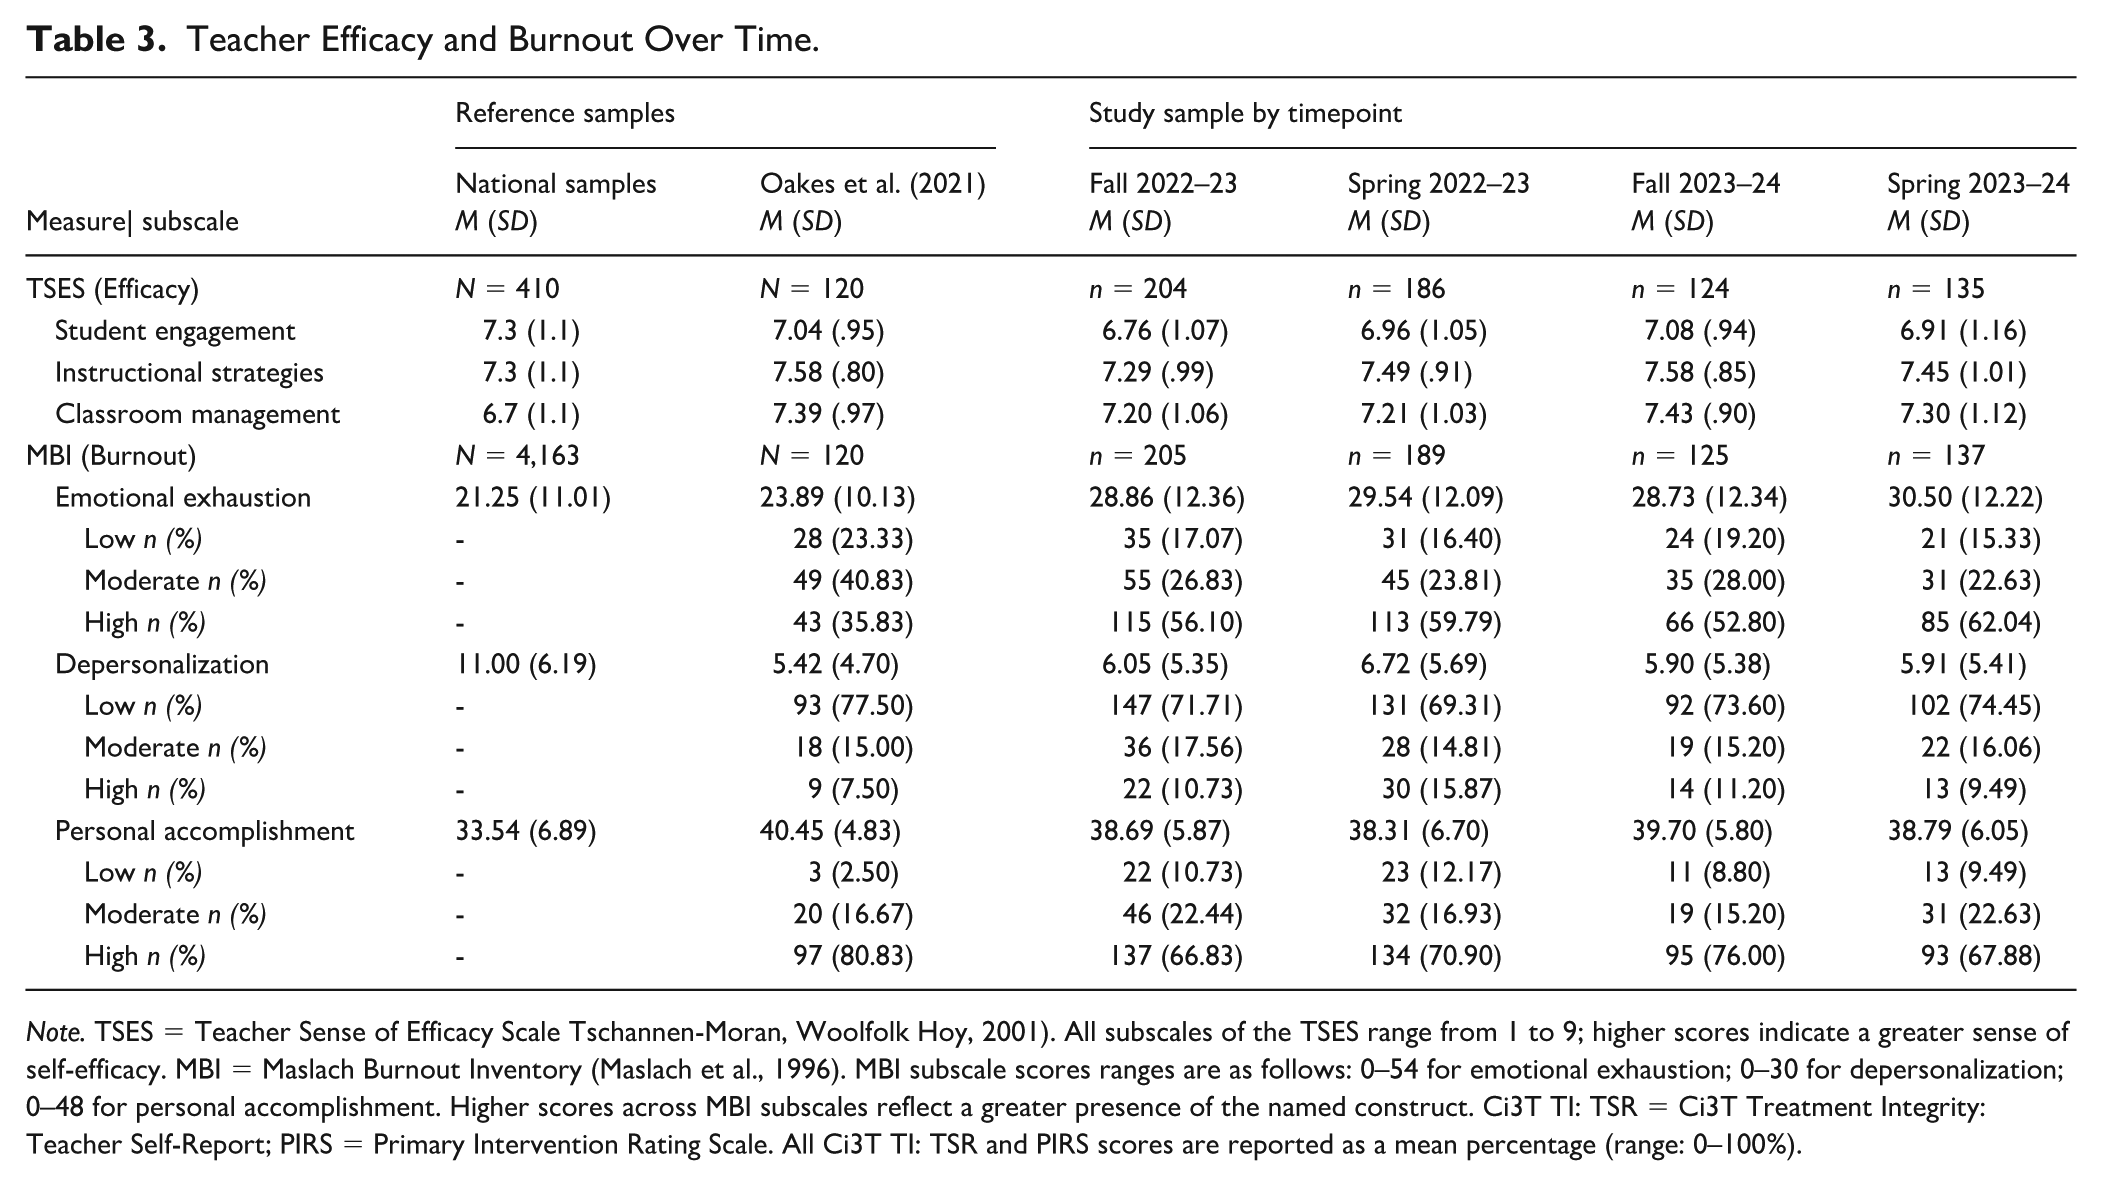
Note. TSES = Teacher Sense of Efficacy Scale Tschannen-Moran, Woolfolk Hoy, 2001). All subscales of the TSES range from 1 to 9; higher scores indicate a greater sense of self-efficacy. MBI = Maslach Burnout Inventory (Maslach et al., 1996). MBI subscale scores ranges are as follows: 0–54 for emotional exhaustion; 0–30 for depersonalization; 0–48 for personal accomplishment. Higher scores across MBI subscales reflect a greater presence of the named construct. Ci3T TI: TSR = Ci3T Treatment Integrity: Teacher Self-Report; PIRS = Primary Intervention Rating Scale. All Ci3T TI: TSR and PIRS scores are reported as a mean percentage (range: 0–100%).
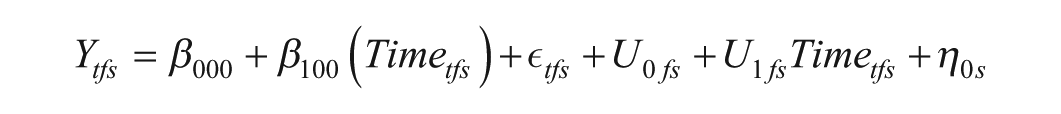
To answer RQ1, we used eight series of models – one for each outcome – to examine the level at study entry and slope over time for each of the eight outcome variables of interest individually, with educators nested in schools (Table 4). Outcomes included: treatment integrity, social validity, efficacy: student engagement, efficacy: instructional strategies, efficacy: classroom management, burnout: emotional exhaustion, burnout: depersonalization, burnout: personal accomplishment. We analyzed each outcome within a multilevel modeling framework using SAS PROC MIXED (version 9.4) for univariate analyses. In this design, for each educator outcome, we nested observations (level 1 units) within educators (level 2 units) who were nested within schools (level 3 units). While schools were nested within districts, given that we partnered with only four districts, we included a fixed effect for districts in the models to obtain appropriate standard errors within the clustered sample to address the district dependency. As in the previous paper on Ci3T Leadership Team member outcomes (Buckman et al., 2025), we selected District 2 (Midwest; see OSF Supplemental Materials in Lane et al., 2022 for additional details) to serve as the reference group for the district fixed effect. The basic model equation for faculty outcomes in RQ1 with all possible random effects was:
RQ1 Models Results: Changes in Implementation, Burnout, and Efficacy Over Time.
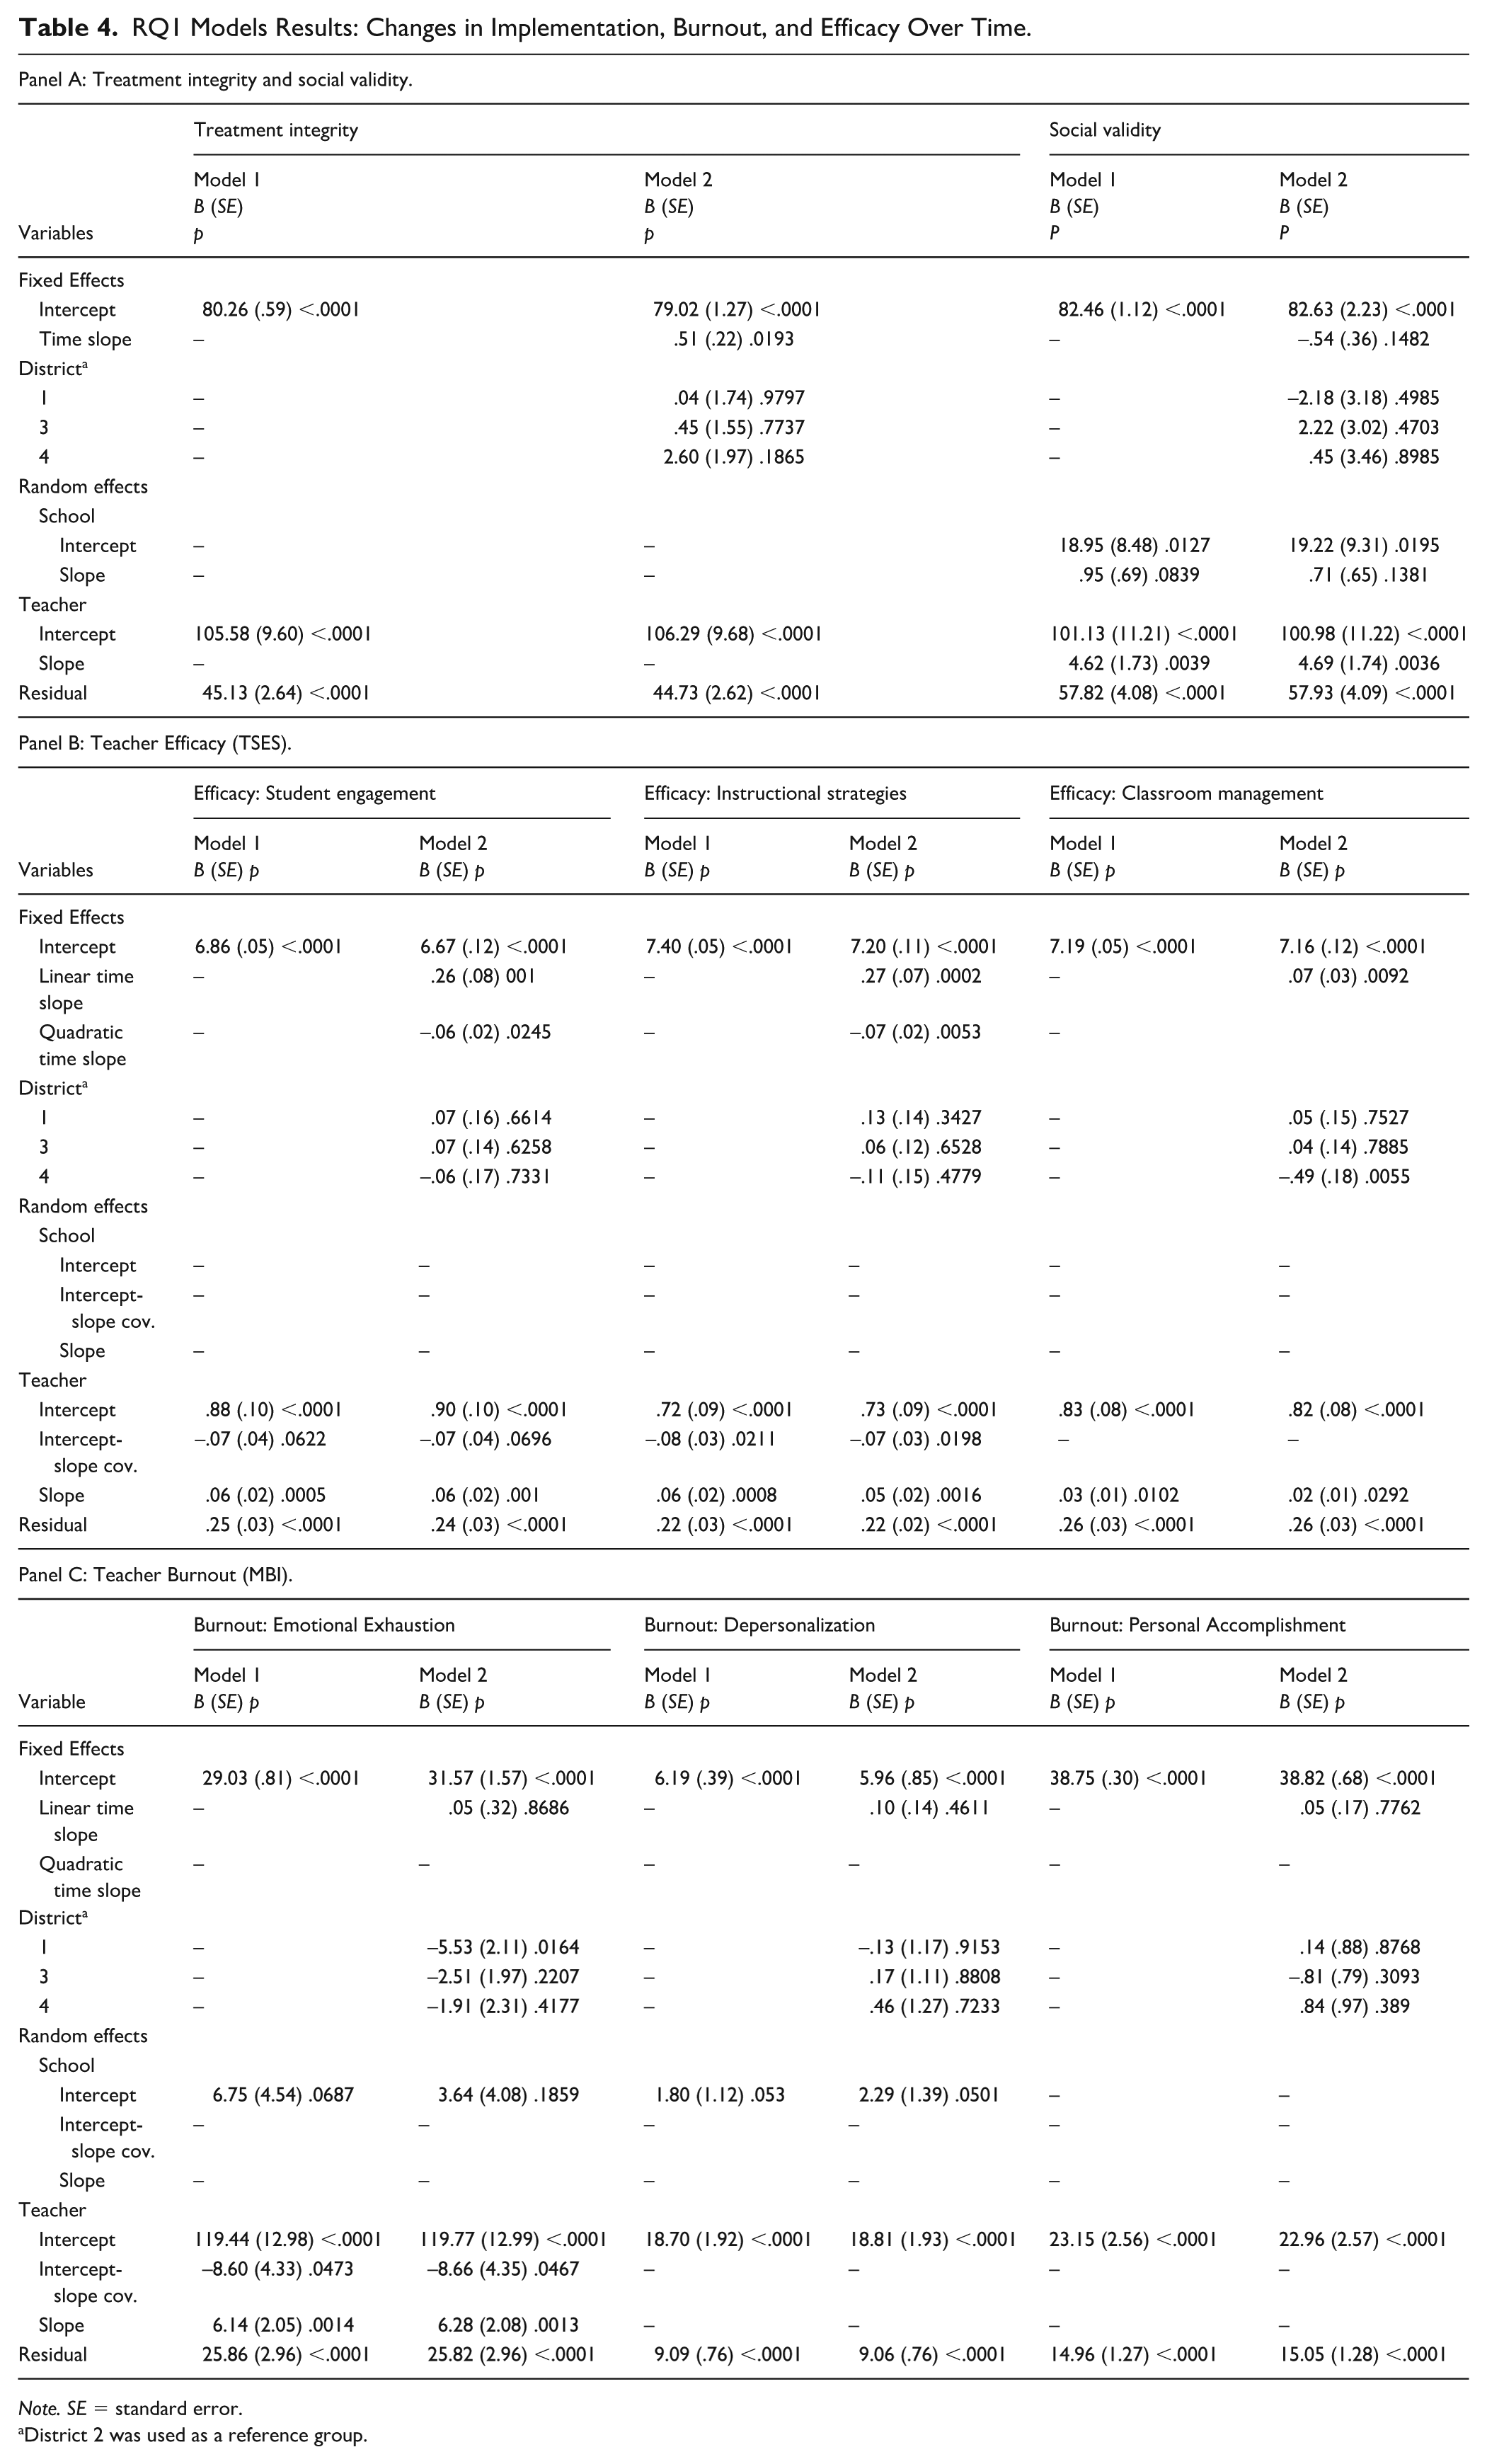
Note. SE = standard error.
District 2 was used as a reference group.
When interpreting the model,
We initially analyzed unconditional models with no fixed effects to determine which random effects were needed. We compared models with random teacher intercepts only to models with random school intercepts and/or random teacher slopes using log likelihood tests to determine which random effects resulted in the best-fitting model. After examining fixed effects for district and a linear time slope, we re-examined random effects to ensure additional random effects would not improve model fit when including the fixed effects. We modeled time as 0 (Fall 2022), 1 (Spring 2023), 2 (Fall 2023), and 3 (Spring 2024). We initially preregistered the model to have Time modeled in months from baseline assessment and centered on 18 months (~ 2 school years) such that intercepts would reflect outcomes at the study end. Yet, to facilitate comparability with prior data analytic plans from this research project (see Buckman et al., 2025 regarding Ci3T Leadership Team learning outcomes), we shifted to Time 0 1 2 3 given relatively equal intervals between assessments, similarity in outcomes using either approach, and ease for readers when interpreting results. We were most interested in understanding shifts in these variables over time. We also conducted additional descriptive analyses to examine the magnitude of differences in levels between (a) mean levels provided by the norming sample and (b) those provided by Oakes et al. (2021) relative to the four time points analyzed in the current study. Specifically, we computed Hedges’ g, providing a 95% confidence interval. We interpreted effect sizes as follows: small ≥ .20, medium ≥ .50, and large ≥ .80 (Cohen, 1988).
To answer RQ2, we developed models to predict educator well-being constructs (e.g., six noted above) at the end of Year 1 and Year 2 from educator (Level 1) and school (Level 2) variables (Tables 5 and 6). We added the following educator (Level 1) variables as predictors: years of teaching experience, the educator's individual Ci3T treatment integrity score from Fall 2022, and the educator's individual PIRS social validity scores from Fall 2022. For example, a person’s individual Ci3T treatment integrity score would be the difference between an individual person’s score and their school’s score. Then, we added school (Level 2) means for Fall 2022 treatment integrity and social validity scores as Level 3 variables (grand mean centered) to predict teacher well-being in Spring 2023 (end Year 1) and Spring 2024 (end Year 2). We interpreted standardized β as follows: small ≥ .05, medium ≥ .10, and large ≥ .25 (Keith et al., 2025); yet, primary emphasis was placed on variance explained at each level, given the multilevel context.
RQ2 Fall 2022 Teacher-Level and School-Level Variables Predicting Teacher Efficacy (TSES) Variables.
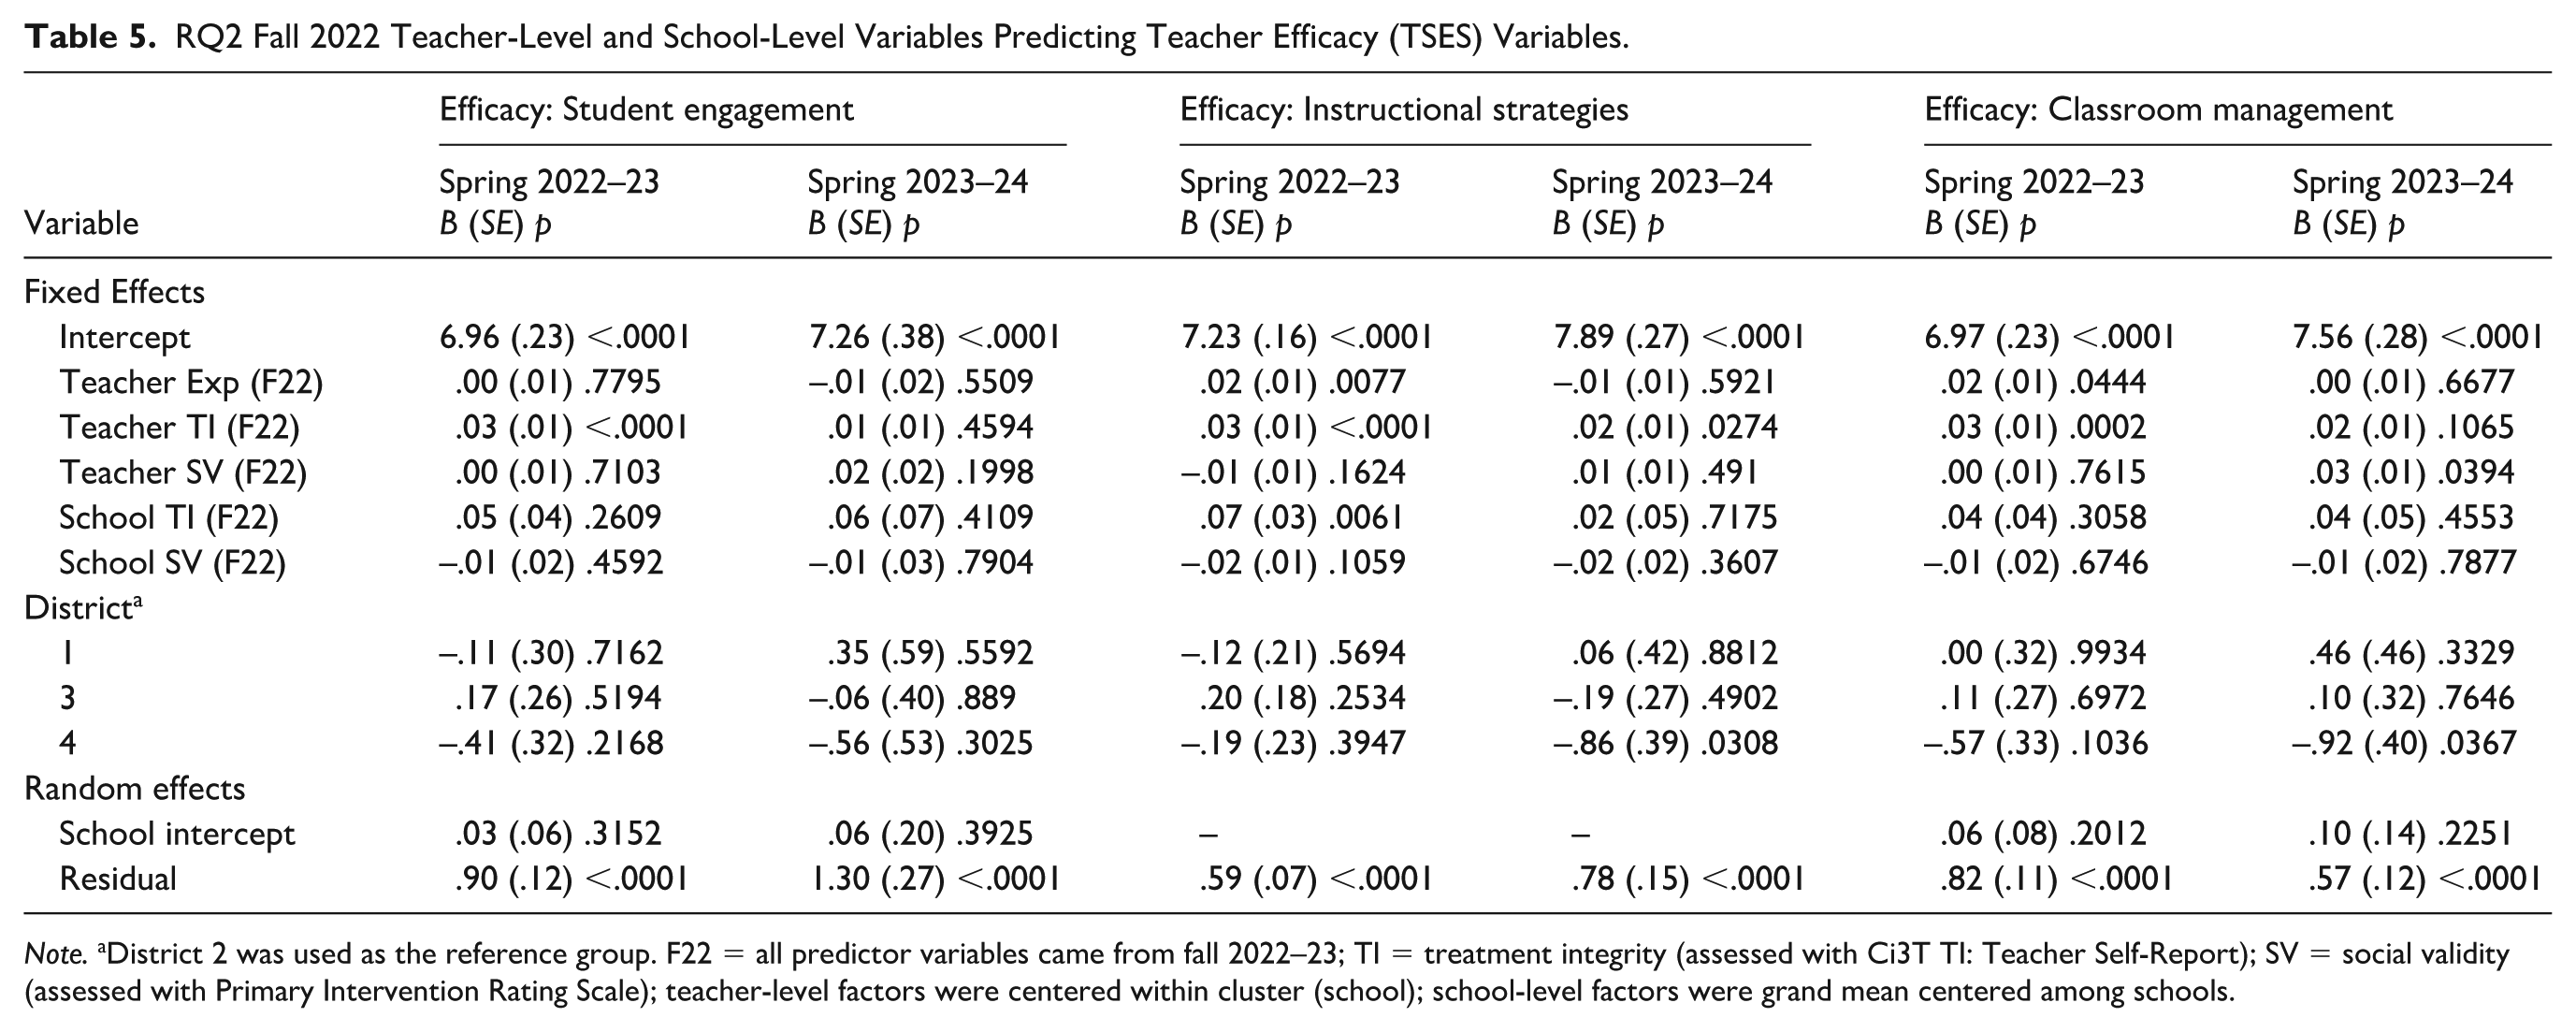
Note. aDistrict 2 was used as the reference group. F22 = all predictor variables came from fall 2022–23; TI = treatment integrity (assessed with Ci3T TI: Teacher Self-Report); SV = social validity (assessed with Primary Intervention Rating Scale); teacher-level factors were centered within cluster (school); school-level factors were grand mean centered among schools.
RQ2 Fall 2022 Teacher-Level and School-Level Variables Predicting Burnout (MBI) Variables.
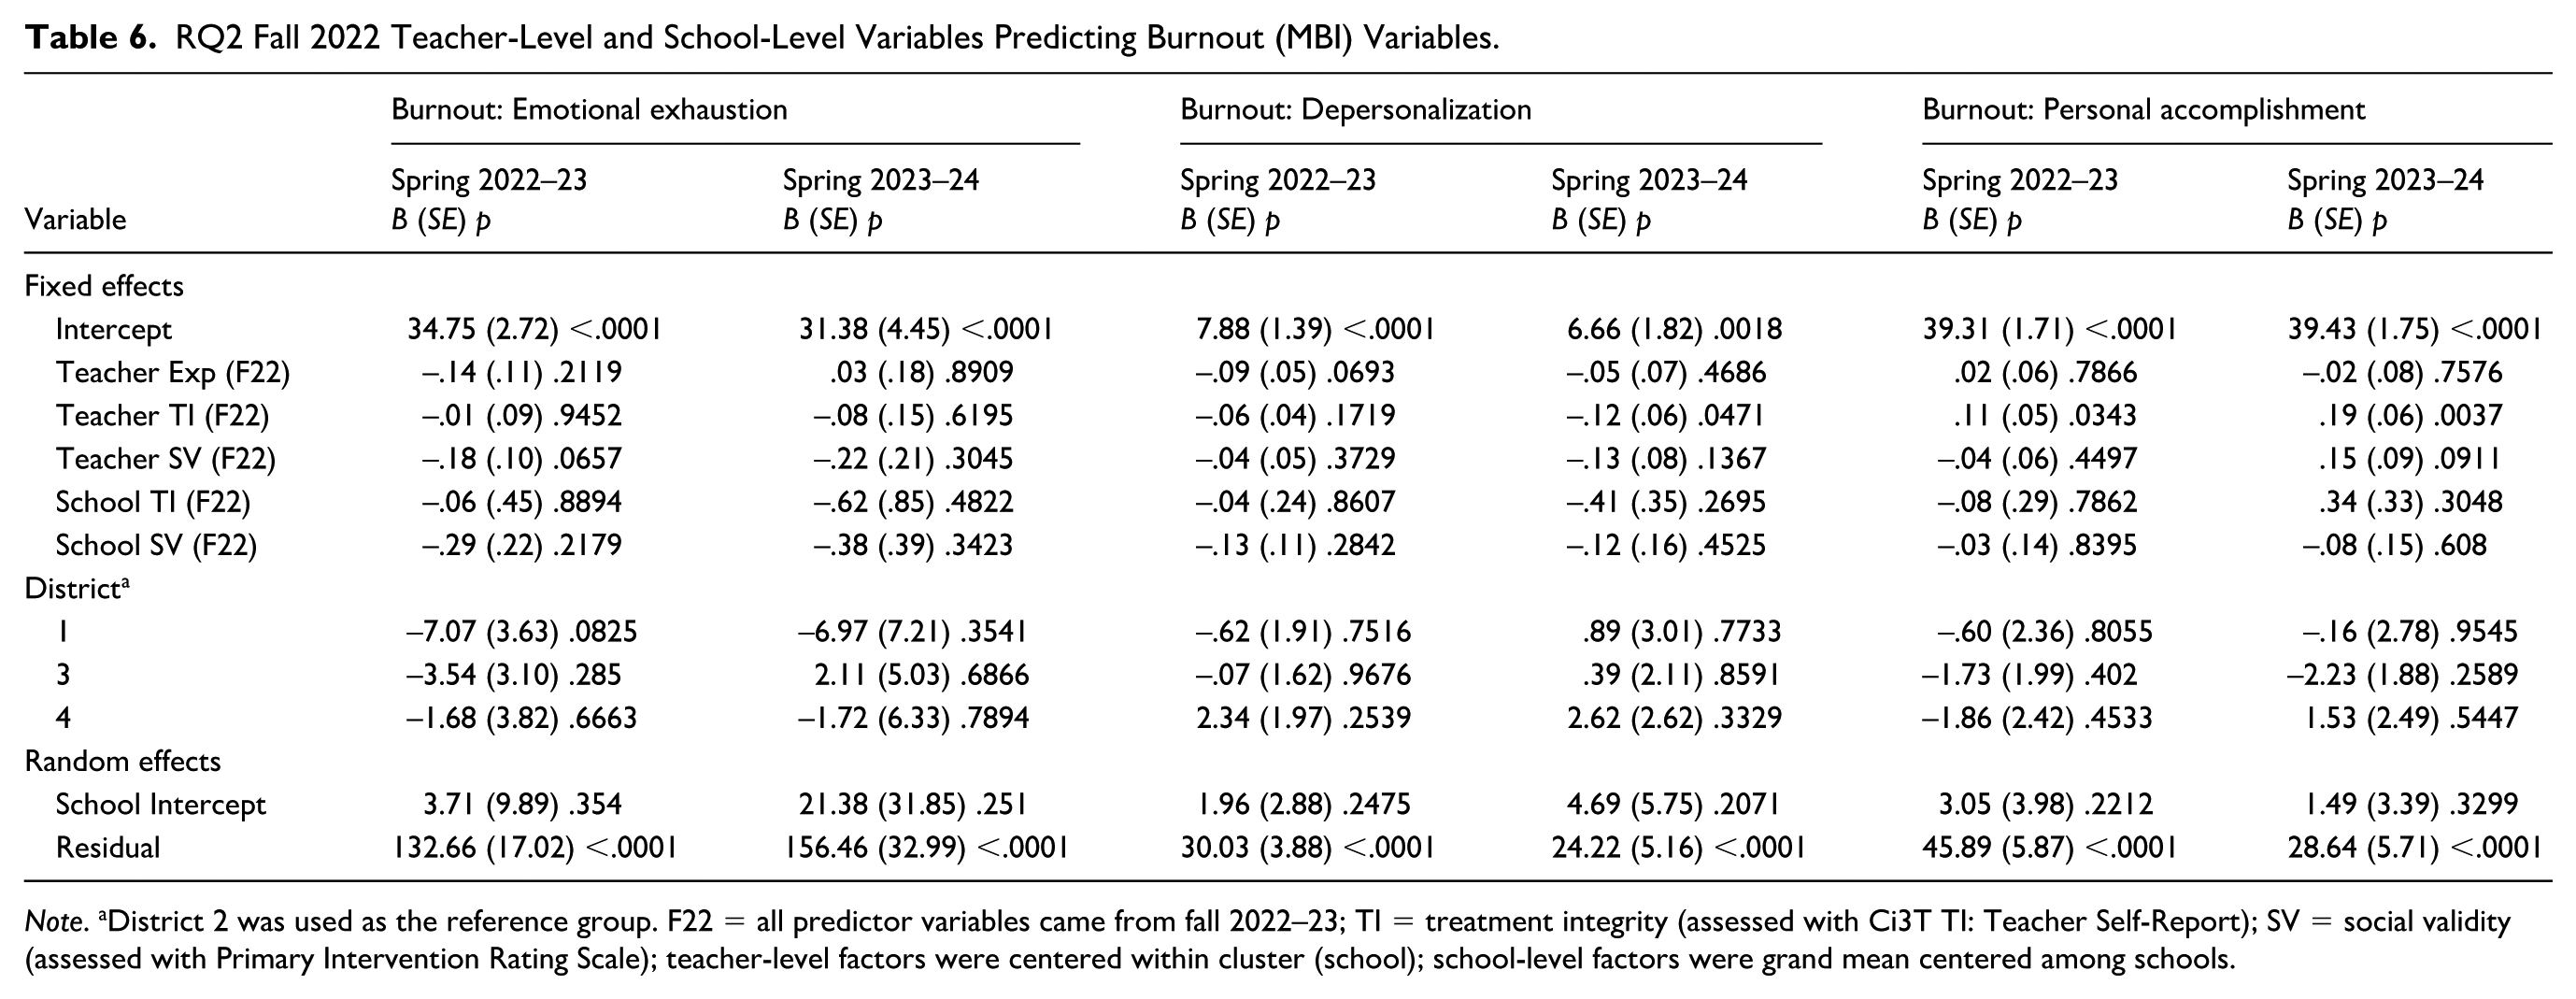
Note. aDistrict 2 was used as the reference group. F22 = all predictor variables came from fall 2022–23; TI = treatment integrity (assessed with Ci3T TI: Teacher Self-Report); SV = social validity (assessed with Primary Intervention Rating Scale); teacher-level factors were centered within cluster (school); school-level factors were grand mean centered among schools.
To answer RQ3, Spring 2023 and Spring 2024 served as outcome variables, with teacher well-being subscales (six), educators’ years of experience, educator (Level 1) social validity, and school (Level 2) social validity scores in Fall 2022 as predictor variables (Table 7).
RQ3 Fall 2022 Teacher-Level, School-Level, and Teacher Well-Being Variables Predicting Ci3T Treatment Integrity.
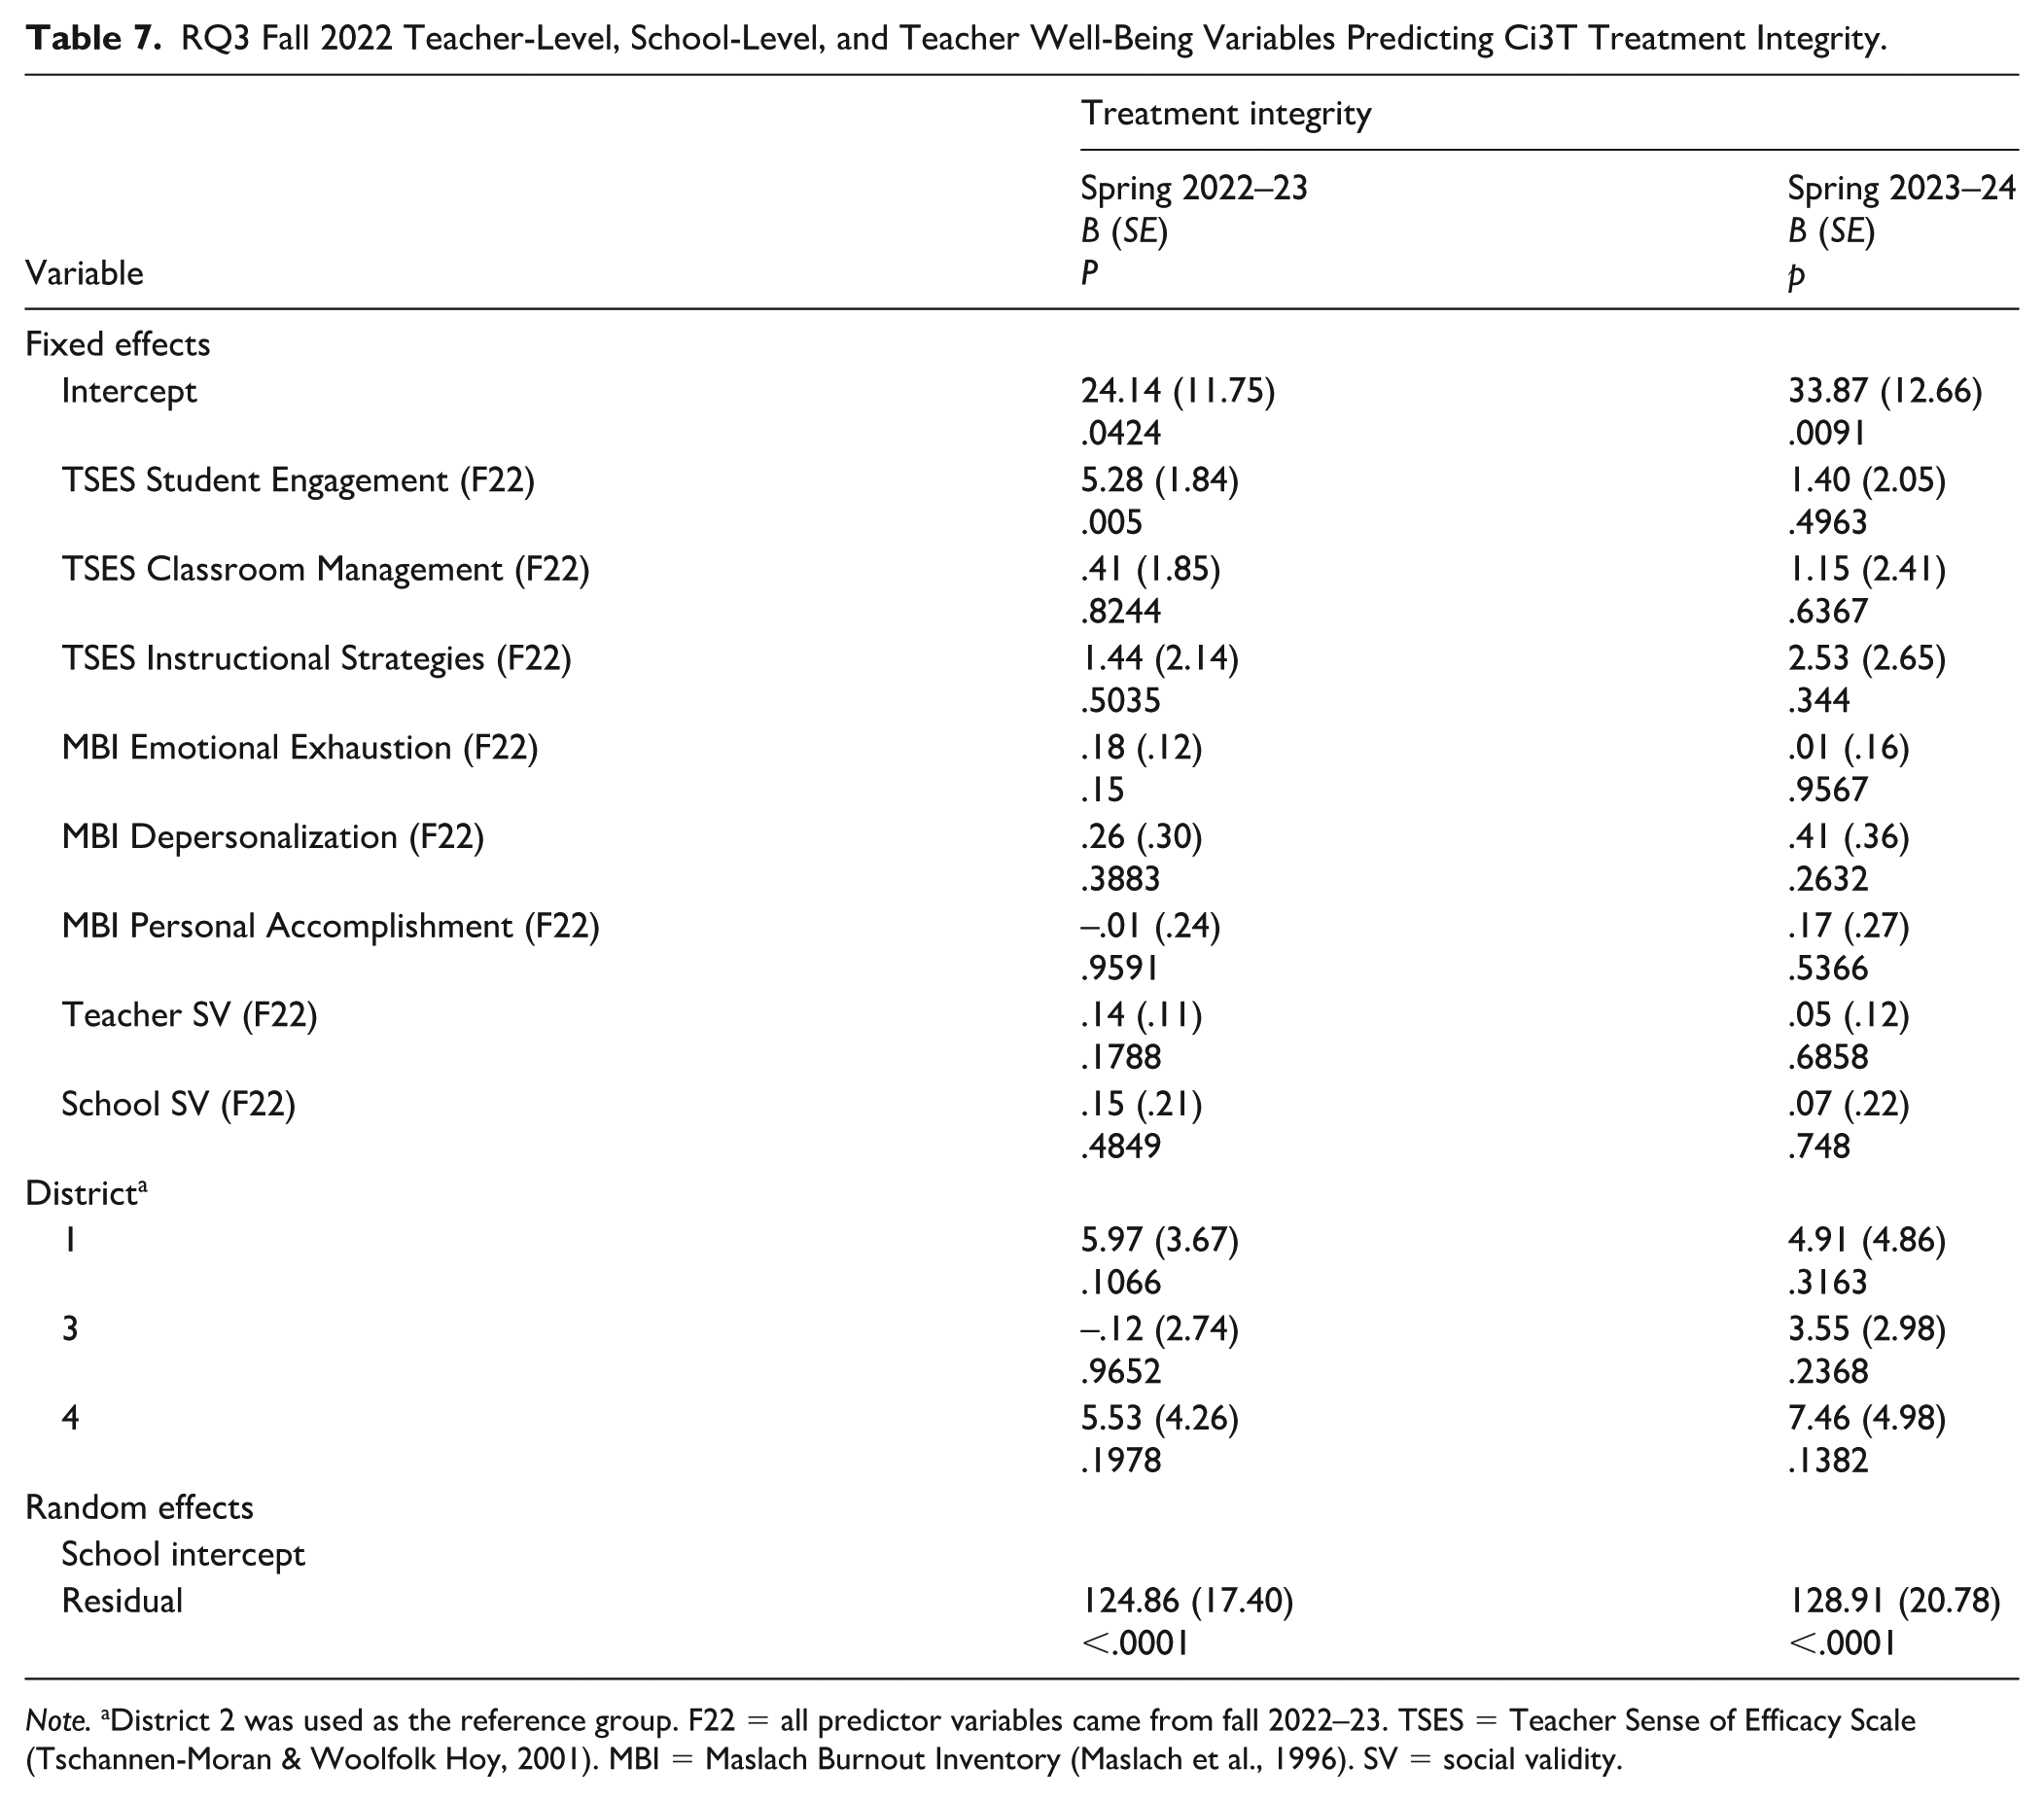
Note. aDistrict 2 was used as the reference group. F22 = all predictor variables came from fall 2022–23. TSES = Teacher Sense of Efficacy Scale (Tschannen-Moran & Woolfolk Hoy, 2001). MBI = Maslach Burnout Inventory (Maslach et al., 1996). SV = social validity.
Results
RQ1: Shifts Over Time
Treatment Integrity
For treatment integrity, neither the addition of a random intercept for school, −2ΔLL(1) = 2.5, p = .11, nor the addition of a random slope for educators, −2ΔLL(1) = .0, p = 1.00 resulted in a statistically significant improvement in model fit. Thus, we modeled only a random intercept for educators. The full fixed effect model with quadratic time, linear time, and district indicated quadratic growth was not statistically significant, F(1,621) = .58, p =.45. Therefore, we reported the simpler model with only linear time. The effect for district was not statistically significant, F(3,355) = 0.72, p =.54, but the effect for time was significant, F(1,644) = 5.50, p = .019 (Table 4 Panel A). The positive parameter estimate for time (b =.51, SE = .22) indicated treatment integrity increased by approximately half a point at each subsequent observation, with mean scores >80% at each of the four timepoints indicating overall high levels of treatment integrity as reported by implementers who provided instruction (see Table 3).
Social Validity
For social validity (PIRS), the addition of random intercepts for schools and random slopes for educators and schools statistically significantly improved model fit in stepwise comparisons: −2ΔLL(1) = 21.5, p < .001; −2ΔLL(1) = 12.5, p < .001; and −2ΔLL(1) = 5.4, p =.020, respectively. Thus, we modeled random intercepts and slopes for both schools and educators nested within schools. The full fixed effect model with quadratic time, linear time, and district indicated quadratic growth was not statistically significant, F(1,476) = 2.78, p =.096, so we report the simpler model with only linear time. The effect for district was not significant, F(3,22.5) = 0.69, p =.57; likewise, the effect for time was not significant, F(1,24.2) = 2.23, p = .148 (Table 4 Panel A). Mean social validity scores >80% at each of four timepoints indicated overall high and stable levels of social validity reported by educator implementers (see Table 3).
Educators’ Well-Being
Efficacy: Student Engagement
For educator efficacy for student engagement, the addition of a random intercept for school was not different from random intercepts for educators only, −2ΔLL(1) = 0, p = 1.00. The addition of a random slope for educators yielded a statistically significant improvement, −2ΔLL(1) = 13.1, p < .001. The model with an unstructured matrix adding the covariance between intercept and slope also resulted in a statistically significant improvement in model fit, −2ΔLL(1) = 4.1, p =.043. Thus, we modeled random intercept and slope for educators as well as a random covariance between slope and intercept. The full fixed effect model with quadratic time, linear time, and district indicated quadratic growth, F(1,274) = 5.12, p =.025, and linear growth, F(1,314) = 10.95, p = .001, was statistically significant. The effect for the district was not statistically significant, F(3,372) = 0.28, p =.838 (Table 4 Panel B). The positive parameter estimate for time (b =.26, SE = .08) indicated efficacy for student engagement increased by approximately a fourth of a point between Time 0 and Time 1 while the negative quadratic estimate (b = –.05, SE = .02) indicated the increase in reported efficacy for student engagement between timepoints decreased somewhat from that quarter of a point change across subsequent observations, resulting in a plateauing of efficacy scores by the end of observations. This suggested growth in educator efficacy for student engagement was attenuated from Time 1 to 3, following initial higher growth from Time 0 to Time 1.
Relative to the validation sample for the Teachers' Sense of Efficacy Survey (TSES), educators in the present sample reported lower efficacy for student engagement across timepoints (range of g = –0.21 to –0.49), with all four timepoints statistically significantly lower than the comparison sample. Findings from the present study were consistent with a pre-pandemic sample of elementary educators in schools implementing Ci3T (Oakes et al., 2021), with minimal differences compared to the Oakes sample observed across timepoints (range of g = –0.27 to 0.04; only Time 0 was statistically significantly different). See Supplemental Table S5 for all comparisons.
Efficacy: Instructional Strategies
For educator efficacy for student engagement, the addition of a random intercept for school was not different from random intercepts for educators only, −2ΔLL(1) = 0, p = 1.00. The addition of a random slope for educators yielded a statistically significant improvement over random intercept only for educators, −2ΔLL(1) = 8.8, p =.003. The model with an unstructured matrix adding the covariance between intercept and slope also resulted in a statistically significant improvement in model fit, −2ΔLL(1) = 6.7, p =.010. Thus, we modeled random intercept and slope for educators as well as a random covariance between slope and intercept. The full fixed effect model with quadratic time, linear time, and district indicated quadratic growth, F(1,281) = 7.91, p =.005, and linear growth, F(1,321) = 13.78, p <.001, were statistically significant. The effect for the district was not statistically significant, F(3,366) = 0.90, p =.442. The positive parameter estimate for time (b =.27, SE = .07) indicated efficacy for instructional strategies initially increased by about a fourth of a point from Time 0 to Time 1 while the negative quadratic estimate (b = –.065, SE = .02) indicated the increase in efficacy for instructional strategies between timepoints decreased somewhat across subsequent observations, resulting in a plateauing of efficacy for instructional strategy scores (Table 4 Panel B). This suggested growth in teacher efficacy for instructional strategies was attenuated between Time 1 and Time 3, following initial growth from Time 0 to Time 1.
Relative to the validation sample for the TSES, educators in the present sample reported generally greater efficacy for instructional strategies across timepoints (range of g = –0.01 to 0.27), with two timepoints statistically significantly higher than the comparison sample (Time 1, Time 2). Findings from the present study were consistent with a pre-pandemic sample of elementary educators in schools implementing Ci3T (Oakes et al., 2021), with minimal differences compared to the Oakes sample observed across timepoints (range of g = –0.31 to 0.00; only Time 0 was statistically significantly different). See Supplemental Table S5 for all comparisons.
Efficacy: Classroom Management
For teacher efficacy for classroom management, the addition of a random intercept for school, −2ΔLL(1) = 3.2, p = .07, did not significantly improve the model. The addition of a random slope for educators resulted in a significant improvement in model fit, −2ΔLL(1) = 7.1, p = .008. Thus, we modeled a random intercept and a random slope for educators. The full fixed effect model with quadratic time, linear time, and district indicated that quadratic growth was not significant, F(1,266) = 0.42, p =.52, so we report the more parsimonious model with only linear time. The effect for district F(3,358) = 4.30, p =.005, and the effect for time, F(1,192) = 6.92, p = .009, were significant. The positive parameter estimate for time (b = .07, SE = .03) indicated efficacy for classroom management increased at each subsequent observation (Table 4 Panel B). The Wald test for the parameter estimate for District 4 indicated District 4 reported statistically significantly lower classroom management efficacy (b = –.49, SE =.18, p =.006) than the comparison district (District 2), with approximately a 0.5 difference in their mean intercepts.
Relative to the validation sample for the TSES, educators in the present sample consistently reported greater efficacy for classroom management across timepoints (range of g = .46 to .69), with all timepoints statistically significantly higher than the comparison sample. Findings from the present study were consistent with a pre-pandemic sample of elementary educators in schools implementing Ci3T (Oakes et al., 2021), with minimal differences compared to the Oakes sample observed across timepoints (range of g = –.18 to .04; no timepoints were statistically significantly different from the comparison sample). See Supplemental Table S5 for comparisons.
Burnout: Emotional Exhaustion
For educator burnout related to emotional exhaustion, pairwise examination of random effects revealed that the addition of a random intercept for school statistically significantly improved a model including random intercepts, slopes, and their covariance for educators, −2ΔLL(1) = 4.8, p = .03. Thus, we modeled four random effect covariance parameters. The full fixed effect model with quadratic time, linear time, and district indicated quadratic growth was not significant, F(1,260) = 0.11, p = .74, so we report the more parsimonious model with only linear time. Neither the effect for district, F(3,17.3) = 2.35, p = .11, nor the effect for time, F(1,173) = 0.03, p = .87 (Table 4 Panel C), was statistically significant. Thus, emotional exhaustion scores were stable across time and districts, with relatively high rates of emotional exhaustion reported (e.g., >50% of educators in the high category across timepoints; Table 2).
Relative to the compilation of samples for primary and secondary educators reported in the MBI test manual (Maslach et al., 1996), educators in the present sample consistently reported greater levels of emotional exhaustion across timepoints (range of g = 0.68 to 0.84), with all timepoints statistically significantly higher than the comparison sample. Similarly, the present study also reported higher emotional exhaustion than the pre-pandemic sample of elementary Ci3T educators (Oakes et al., 2021; range of g = 0.43 to 0.58), with all timepoints statistically significantly higher than the comparison sample. See Table S5 for the full set of comparisons.
Burnout: Depersonalization
For burnout related to depersonalization, the addition of a random intercept for school statistically significantly improved model fit, −2ΔLL(1) = 6.6, p = .01. None of the other possible random effects resulted in a significant improvement in model fit. Thus, we modeled only random intercepts for educators and random intercepts for schools. The full fixed effect model with quadratic time, linear time, and district indicated quadratic growth was not statistically significant, F(1,356) = 2.82, p =.09, with a linear time effect approaching statistical significance, F(1,361) = 3.34, p = .068, so we report the simpler model with only linear time. The effect for district was not statistically significant, F(3,18) = 0.08, p =.97, and the effect for time was not statistically significant, F(1,397) = 0.54, p = .461 (Table 4 Panel C). Thus, burnout scores for depersonalization were relatively stable over time and across districts, with 69.31–74.45% of educators in the low depersonalization category across timepoints (Table 2).
Relative to the compilation of samples for primary and secondary educators reported in the MBI test manual (Maslach et al., 1996), educators in the present sample consistently reported lower levels of depersonalization across timepoints (range of g = –0.83 to –0.69), with all timepoints statistically significantly lower than the comparison sample. In comparison to the pre-pandemic sample of elementary Ci3T educators (Oakes et al., 2021), participants in the current study reported similar levels of depersonalization (range of g = 0.09 to 0.24), with only one timepoint (Time 1) statistically significantly higher than the comparison sample. See Table S5 for the full set of comparisons.
Burnout: Personal Accomplishment
For burnout personal accomplishment, neither the addition of a random intercept for school, −2ΔLL(1) = .4, p = .53, nor the addition of a random slope for teachers, −2ΔLL(1) = .4, p = .53, resulted in a statistically significant improvement in model fit. Thus, we modeled only a random intercept for teachers. The full fixed effect model with quadratic time, linear time, and district indicated quadratic growth was not statistically significant, F(1,379) = 0.29, p =.59, so we report the simpler model with only linear time. The effect for district F(3,374) = 1.30, p =.28 and the effect for time F(1,438) = 0.08, p = .78, were not statistically significant (Table 4 Panel C). Thus, burnout scores related to personal accomplishment were relatively stable over time and across districts, with 66.83–76.600% of educators in the high personal accomplishment category across timepoints (Table 2).
Relative to the compilation of samples for primary and secondary teachers reported in the MBI test manual (Maslach et al., 1996), educators in the present sample consistently reported greater levels of personal accomplishment across timepoints (range of g = 0.69 to 0.90), with all timepoints statistically significantly higher than the comparison sample. In comparison to the pre-pandemic sample of elementary Ci3T educators (Oakes et al., 2021), participants in the current study reported somewhat lower levels of personal accomplishment (range g = –0.35 to –0.14, small-to-medium magnitude differences), with three of four timepoints (Time 1, 2, 4) statistically significantly lower than the comparison sample. See Supplemental Table S5 for comparisons.
RQ2: Predicting Teacher Well-Being Constructs
Efficacy: Student Engagement
After examining (Level 1) educator predictors (i.e., years teaching experience, educators’ individual Ci3T treatment integrity scores from Fall 2022, educators individual PIRS social validity scores from Fall 2022) as well as school (Level 2) means for Fall 2022 treatment integrity and social validity scores as Level 3 predictors (grand mean centered), only Fall educator self-reported treatment integrity was a statistically significant predictor of spring (Year 1; 2022–2023) educator efficacy for promoting student engagement (b = .03, SE = .01, p < .0001). Adding Fall educator-level treatment integrity to the model reduced within-school (residual) variance by 11.84% and between-school (random intercept) variance by 18.39%, indicating treatment integrity explained a substantial proportion of variability at the educator and school levels. Based on observed model estimates, an educator with a treatment integrity score 1 SD (11.83) above their school’s mean would be predicted to have a student engagement efficacy score .37 higher than an educator with a treatment integrity score equal to the school mean after controlling for other variables. This corresponds to a 0.35 SD increase in student engagement efficacy, indicating a large effect. No predictors were statistically significant for student engagement efficacy in the spring of Year 2 (2023–2024).
Efficacy: Instructional Strategies
Across educator- and school-level predictors noted above, three emerged as statistically significant predictors of Spring (Year 1; 2022–2023) educator efficacy related to instructional strategies: fall educator-level treatment integrity (b = .03, SE = .01, p < .0001), educator experience (b = .02, SE = .01, p = .0077), and school average treatment integrity (b = .07, SE = .03, p = .0061). The model, including a random intercept for school, produced a covariance matrix that was not positive definite. Therefore, the random intercept was removed, and all variance explained reflects reductions in residual variance. Adding educator-level treatment integrity to the model reduced residual variance by 17.43%, whereas adding school average treatment integrity scores reduced residual variance by 4.86%, and adding educator experience reduced residual variance by 3.33%. Based on observed model estimates, an educator with a treatment integrity score 1 SD (11.83) above their school’s mean was predicted to have an instructional strategies teacher efficacy score .37 higher than an educator at the school mean, corresponding to a 0.40 SD increase in efficacy and indicating a large effect size. In contrast, a 1 SD difference in school average treatment integrity (SD = 2.77) was associated with an estimated .20-point increase in efficacy (0.22 SD), indicating a moderate between-school effect, and a 1 SD difference in educator experience (SD = 9.29 years) was associated with an estimated .17-point increase in efficacy (0.20 SD), also indicating a moderate effect size.
Educator-level treatment integrity from Fall of Year 1 (2022–2023) remained a statistically significant predictor of Spring Year 2 (2023–2024) educator efficacy for instructional strategies (b = .02, SE = .01, p < .0274). District 4 showed statistically significantly lower scores on average (b = -.86, SE = .39, p < .0308).
Efficacy: Classroom Management
Across educator- and school-level predictors, two emerged as statistically significant predictors of Spring (Year 1; 2022–2023) educator efficacy related to classroom management: Fall educator-level treatment integrity (b = .03, SE = .01, p = .0002) and educator experience (b = .02, SE = .01, p = .0444). Adding Fall educator-level treatment integrity to the model reduced within-school (residual) variance by 8.61% and between-school (random intercept) variance by 30.39%, indicating treatment integrity explained a substantial proportion of variability at the school level and a modest proportion of variability at the individual level. In contrast, adding educator experience to the model reduced within-school (residual) variance by 1.92% and increased between-school (random intercept) variance by 7.53%, suggesting experience did not explain a substantial proportion of variability at the individual or school level. Based on observed model estimates, an educator with a treatment integrity score 1 SD (11.83) above their school’s mean was predicted to have a classroom management efficacy score 0.32 higher than an educator at the school mean, corresponding to a 0.31 SD increase in efficacy and indicating a large effect size. In contrast, a 1 SD difference in educator experience (SD = 9.29 years) was associated with an estimated 0.16-point increase in efficacy (0.16 SD), indicating a moderate between-school effect, and a 1 SD difference in educator experience (SD = 9.29 years), indicating a moderate effect size.
Educator-level social validity from Fall of Year 1 (2022–2023) was a statistically significant predictor of Spring Year 2 (2023–2024) teacher efficacy for classroom management (b = .03, SE = .01, p < .0394). Based on observed model estimates, an educator with a social validity score 1 SD (12.00) above their school’s mean was predicted to have a classroom management efficacy score 0.33 higher than an educator at the school mean, corresponding to a 0.29 SD increase in efficacy and indicating a large effect size. District 4 showed statistically significantly lower scores on average (b = –.92, SE = .40, p < .0367).
Burnout: Emotional Exhaustion
Across educator- and school-level predictors, none were statistically significant predictors (all p > .05) of emotional exhaustion in Spring of Year 1 (2022–2023) or Year 2 (2023–2024).
Burnout: Depersonalization
Across educator- and school-level predictors, none were statistically significant predictors (all p > .05) of depersonalization in Spring of Year 1 (2022–2023). Educator-level treatment integrity from Fall of Year 1 (2022–2023) was a statistically significant predictor of Spring Year 2 (2023–2024) depersonalization (b = –.12, SE = .06, p < .0471). Based on observed model estimates, an educator with a treatment integrity score 1 SD (11.83) above their school’s mean was predicted to have a depersonalization score –1.43 lower than an educator at the school mean, corresponding to a 0.27 SD decrease in depersonalization and indicating a large effect size.
Burnout: Personal Accomplishment
Across educator- and school-level predictors, only Fall educator self-reported treatment integrity was a statistically significant predictor of Spring (Year 1; 2022–2023) personal accomplishment (b = .11, SE = .05, p < .0343). Adding Fall educator-level treatment integrity to the model reduced within-school (residual) variance by 2.36% and between-school (random intercept) variance by 11.37%, indicating treatment integrity explained a small proportion of variance at the individual level and a modest proportion of variability at the school level. Based on observed model estimates, an educator with a treatment integrity score 1 SD (11.83) above their school’s mean would be predicted to have a personal accomplishment score 1.30 higher than an educator with a treatment integrity score equal to the school mean after controlling for other variables. This corresponds to a 0.19 SD increase in student engagement teacher efficacy, indicating a moderate effect size.
Educator-level treatment integrity from Fall of Year 1 (2022–2023) remained a statistically significant predictor of Spring Year 2 (2023–2024) personal accomplishment (b = .19, SE = .06, p < .0037).
RQ3: Predicting Ci3T Implementation
Across educator- and school-level predictors, only Fall educator efficacy for student engagement was a statistically significant predictor of Spring (Year 1; 2022–2023) treatment integrity (b = 5.28, SE = 1.84, p < .005). The model, including a random intercept for school, produced a covariance matrix that was not positive definite. Therefore, the random intercept was removed, and all variance explained reflects reductions in residual variance. Adding teacher efficacy for student engagement to the model explained a modest 6.51% of residual variance. Based on observed model estimates, an educator with an efficacy for student engagement score 1 SD (1.07) above the sample mean was predicted to have a treatment integrity score 5.65% higher than an educator at the mean for teacher efficacy for student engagement, corresponding to a 0.45 SD increase in treatment integrity and indicating a large effect size. No predictors were statistically significant for predicting treatment integrity in the Spring of Year 2 (2023–2024).
Discussion
In this study, we built on the inquiry by Oakes et al. (2021), incorporating educator-level and school-level variables, in examining how experienced K-12 Ci3T implementers fared over time across 2 academic years. We examine the degree to which they differed in their level and change over 2 school years in terms of Ci3T implementation (treatment integrity), social validity, self-efficacy, and burnout (RQ1). We also examined the degree to which educator-level and school-level variables in Fall Year 1 predicted year-end outcomes for adults in terms of well-being constructs (RQ2) and Ci3T implementation (RQ3) in Spring Year 1 and Year 2.
Treatment Integrity
In terms of Ci3T implementation, educators reported a mean level of treatment integrity of 80.12% (SD = 12.03) in Fall and 80.66% (SD = 12.67) in Spring of Year 1 (2022–2023 school year) and 81.13% (SD = 11.73) in Fall and 80.89% (SD = 11.94) in Spring of Year 2 (2023–2024 school year). These levels were similar to those reported by Oakes et al. (2021): 81.20% (SD = 13.18) in Fall and 80.27% (SD = 11.68) in Spring (2015–2016), suggesting that even after the pandemic, educators working at schools with established Ci3T systems reported implementing this integrated tiered system as planned.
Longitudinal analyses (RQ1) indicated educators began the study implementing Ci3T at a high level across all districts, though there were significant differences between educators. As time progressed, on average, educators made further growth in treatment integrity over the course of the study, gaining approximately half a point at each subsequent time point. Predictive analyses indicated one educator well-being construct in Fall 2022—efficacy for student engagement—predicted year-end educator-reported treatment integrity in Spring 2023. Educators with greater self-efficacy in student engagement reported higher levels of treatment integrity in Spring 2023, with moderate-magnitude effects (5.65% increase in treatment integrity scores for every one standard deviation above the sample mean) in Year 1, but no impact by the end of the second year (Spring 2024, Year 2). The current study does not explore causal relations between educators’ well-being and Ci3T implementation. Yet, this finding provides direction for future treatment-outcome studies exploring possible impacts of teacher-focused interventions on enhancing educators’ well-being – specifically developing skill sets to maximize student engagement (e.g., use of instructional choice, precorrections, active supervision; Lane et al., 2023), which may enhance educators’ efficacy in student engagement, which may in turn lead to higher levels of implementation of integrated tiered systems such as Ci3T. Yet, it is important to note that we only examined the mean outcomes of total treatment integrity. We did not examine specific aspects of treatment integrity (i.e., procedures for teaching, reinforcing, or monitoring), a point we mention in the limitations and future directions. It may be that educators’ efficacy for these various domains differentially predicts these aspects of Ci3T implementation (e.g., might impact procedures for teaching and reinforcing more so than procedures for monitoring). We encourage future inquiry to better understand these potential differential impacts.
Social Validity
As evident in mean social validity scores at each time point, ranging from 84.15% (SD = 13.19) in Fall 2022 to 82.72% (SD = 13.96) in Spring 2024, educators rated Ci3T goals, procedures, and intended outcomes as highly socially valid. Social validity ratings reported by educators in the current study, conducted in the post-pandemic era, reported slightly higher mean social validity ratings and comparable measures of dispersion (variability) to those reported by Oakes et al. (2021; Fall M = 81.62, SD = 13.57; Spring M = 80.27, SD = 12.48). This suggests experienced Ci3T implementers continued to see the value of a comprehensive, integrated system of support for achieving goals, with acceptable procedures.
Social validity in the fall of the first year varied significantly across schools, with changes in social validity varying significantly over time across educators and schools. Yet, in contrast to increasing shifts in treatment integrity for educators across the four time points, the average change in social validity scores was not significant over time. This may be due, in part, to the highly favorable rating in Fall 2022, leaving nominal room for growth given the typical 80% goal.
Teacher Well-being
Teachers’ Sense of Efficacy
Findings from this study can be contextualized relative to prior research to better understand how teachers’ self-efficacy may have shifted over time, particularly in the post-pandemic era. Educators in this post-pandemic sample reported lower efficacy for student engagement than the TSES validation sample (Tschannen-Moran & Woolfolk Hoy, 2001), with consistent small-to-moderate differences across timepoints. Yet, scores from the present study closely mirrored those of pre-pandemic elementary educators in Ci3T schools (Oakes et al., 2021), with only small and mostly nonsignificant differences observed. In contrast, efficacy for instructional strategies and classroom management was consistently higher than the TSES validation sample, with small- to moderate-magnitude differences, and largely indistinguishable from the pre-pandemic Ci3T sample. Taken together, results suggest educators in the post-pandemic era are faring similarly to their pre-pandemic counterparts in terms of self-efficacy, with potential benefits in instructional strategies and classroom management maintained within long-standing Ci3T systems.
We also examined efficacy longitudinally to explore whether domains shifted over time among experienced Ci3T implementers. Variability in longitudinal models occurred primarily at the educator level as inclusion of school-level random effects did not improve model fit, suggesting changes in efficacy were driven more by individual educator experiences than by between-school differences. Notably, growth was observed across all three efficacy domains over the 2-year study period. Efficacy for student engagement and instructional strategies showed immediate growth from Time 0 (Fall 2022–23) to Time 1 (Spring 2022–23), followed by a plateau, whereas growth in classroom management efficacy was characterized by a gradual, linear trajectory. These findings extend prior cross-sectional work by demonstrating that, within a long-standing Ci3T system, educator efficacy not only remains stable but may increase over time—even in the post-pandemic context.
Finally, we examined individual- and school-level predictors of educators’ self-efficacy. At the individual level, higher treatment integrity at Time 0 (Fall 2022–23) predicted higher efficacy across all three domains—student engagement, instructional strategies, and classroom management—at Time 1 (Spring 2022–23), with effects in the moderate-to-large range. Treatment integrity at Time 0 also predicted higher efficacy for instructional strategies at Time 3 (Spring 2023–24). Educators’ years of experience at Time 0 similarly predicted higher Time 1 efficacy for instructional strategies and classroom management, with effects of moderate magnitude, and educators’ social validity ratings at Time 0 predicted higher classroom management efficacy at Time 3, with a large effect. At the school level, school mean treatment integrity emerged as a statistically significant predictor of higher instructional strategy efficacy. Collectively, findings indicate individual-level factors were the primary drivers of efficacy outcomes, consistent with longitudinal results showing that most variability occurred at the educator rather than school level. Moreover, these results closely aligned with prior Ci3T research in which educator-reported treatment integrity emerged as a consistent predictor of self-efficacy across domains (Lane et al., 2021; Oakes et al., 2021).
Notably, efficacy for student engagement warrants particular attention when these findings are considered alongside the novel result (described in the previous section) that student engagement efficacy at Time 0 also predicted later treatment integrity. Taken together, these patterns suggest a potentially reciprocal relation between educators’ beliefs about their ability to engage students and their implementation of Ci3T practices. Future research using experimental or intervention designs is needed to clarify the directionality of these effects and to identify strategies that simultaneously strengthen student engagement efficacy and implementation fidelity.
Teacher Burnout
Teacher burnout remains a substantial concern as school environments continue to adjust in the post-pandemic context. The present study affords a unique opportunity to compare findings from well before the pandemic (e.g., the MBI norming sample; Maslach et al., 1996) as well as from elementary educators implementing Ci3T under pre-pandemic conditions (Oakes et al., 2021). In the domain of emotional exhaustion, educators in this post-pandemic sample showed consistent moderate-to-large increases relative to the MBI norming sample and moderate increases relative to the pre-pandemic Ci3T sample. In contrast, for depersonalization and personal accomplishment, educators in the post-pandemic sample fared significantly better than those in the MBI norming sample, with consistently lower depersonalization and higher personal accomplishment. Similarly, the post-pandemic sample was largely comparable to pre-pandemic Ci3T educators with respect to low levels of depersonalization and showed only slightly lower levels of personal accomplishment. Yet, results regarding depersonalization must be interpreted with caution, given the low alpha coefficients for the current sample (although consistent with other samples; Brunsting, Morin et al., 2025), limiting confidence in the accurate measurement of this construct.
Regarding longitudinal patterns of burnout, we observed no significant linear or quadratic time slopes, suggesting all three burnout domains remained stable over the 2-year study period. In contrast to efficacy models, inclusion of school-level random intercepts improved model fit for emotional exhaustion and depersonalization, indicating meaningful variability in these burnout domains was present at the school level at study onset. Yet, school-level random slopes did not improve model fit, suggesting changes over time were primarily accounted for at the individual educator level. Together, these findings indicate no evidence of escalation in burnout across time, an encouraging pattern given the elevated levels of emotional exhaustion observed relative to pre-pandemic samples. At the same time, the absence of declining trends indicates emotional exhaustion is not waning, highlighting a need to identify protective factors and supports to reduce emotional exhaustion over time.
With respect to individual- and school-level predictors of burnout, only educator-reported treatment integrity emerged as a statistically significant predictor. Treatment integrity at Time 0 (Fall 2022–23) predicted moderately higher levels of personal accomplishment at Time 1 (Spring 2022–23) and Time 3 (Spring 2023–24), and it also predicted lower levels of depersonalization at Time 3. This represents a somewhat novel finding, as more recent Ci3T studies have not identified consistent relations between treatment integrity and burnout (Lane et al., 2021; Oakes et al., 2021). Yet, earlier work by Oakes et al. (2013) did identify treatment integrity as predictive of lower depersonalization. Given the inconsistency across studies, it is possible these effects are subtle, context-dependent, or reflect chance results (e.g., Type I error), particularly in contrast to more robust and consistent relations observed between treatment integrity and self-efficacy.
Taken together, the pattern of generally low depersonalization and relatively high personal accomplishment suggests that long-standing implementation of Ci3T may provide an environment supportive of these dimensions of educator well-being, particularly in the context of high treatment integrity. Yet, emotional exhaustion remains notably elevated in this post-pandemic sample (e.g., over 50% of educators fell within the high emotional exhaustion category across the 2-year study). Given the well-documented links between emotional exhaustion and deleterious outcomes such as poor health and attrition (Billingsley & Bettini, 2019; Madigan & Kim, 2021; Madigan et al., 2023), these findings underscore the need for focused efforts to better understand and address contributors to emotional exhaustion specifically. To some extent, elevated emotional exhaustion may reflect the inherently taxing nature of teaching. For example, Olivier et al. (2023) found that higher teacher efficacy may be associated with increased emotional exhaustion, potentially due to greater emotional investment in students. Nevertheless, it is critical for the field to identify and implement strategies to help educators manage and process this emotional load to protect teacher well-being and sustain the workforce.
Limitations and Future Directions
As noted by Oakes et al. (2021), educator efficacy and burnout within tiered systems are complex and multifaceted. These constructs are influenced by several factors, some of which are malleable (e.g., treatment integrity, social validity) and others that are not (e.g., years of educator experience). When interpreting results from this first longitudinal study of experienced educators’ well-being within Ci3T systems, we encourage readers to consider the following limitations. First, as noted throughout the study, this sample comprised experienced educators (M = 14.97 years of teaching experience at Year 1) with substantial Ci3T implementation experience (M = 6.45 years), working in school systems with long-standing Ci3T implementation (M = 6.73 years). Therefore, it is important to avoid over-generalizing results beyond experienced Ci3T implementers. We encourage additional inquiry into educators’ well-being during initial Ci3T implementation for elementary educators. In addition, it will be important to examine how middle and high school educators fare over time in Ci3T systems.
Second, when interpreting findings related to depersonalization, we encourage readers to interpret results with caution, given the low alpha coefficients characteristic of this construct (Brunsting, Morin et al., 2025), limiting confidence in the accurate measurement of this construct. Relatedly, while response rates were acceptable (see Supplemental Table S1), it is possible educators experiencing burnout or low levels of efficacy in their teaching may have elected not to participate, potentially introducing response bias.
Although not a limitation necessarily, given the relatively small sample size, we analyzed the treatment integrity total scores rather than subscale scores (i.e., procedures for teaching, procedures for reinforcing, and procedures for monitoring) when examining relations between educator well-being, social validity, and treatment integrity constructs. Furthermore, although the tool had excellent psychometric properties, it is a teacher-completed, self-report measure of Ci3T implementation. As mentioned previously, districts also conducted direct observations of Ci3T implementation for ~25% of their teachers. Yet, only a small number of participants who completed the teacher well-being measures also had direct observation data, making it impossible to analyze direct observation data. We encourage future inquiry to explain relations between treatment integrity components—including teacher self-report and direct observation measures—and educator well-being, as possible with larger samples. There may be differences in the explained variables across these various procedures. For example, educators reporting higher implementation of procedures for reinforcement may be predictive of a higher level of self-efficacy and a lower level of burnout. Furthermore, we are hopeful that other research teams may have the opportunity to explore other variables (e.g., those related to resource allocations in their school systems, such as socioeconomic status; specific years of experiences with implementation of their integrated tiered system) that may impact teacher well-being.
Summary
In this study, we built on Oakes et al. (2021) findings, incorporating educator-level and school-level variables, in examining how experienced K-12 Ci3T implementers fare over time, examining the degree to which they differed in their level and change over 2 school years in terms of Ci3T implementation (treatment integrity), social validity, self-efficacy, and burnout. We learned educators implemented their Ci3T model of prevention with high levels of treatment integrity (> 80%) and reported high and sustained social validity scores following the pandemic, with levels of implementation increasing over the 2 years of the study.
Findings were largely comparable to pre-pandemic findings for teacher efficacy reported in previous studies, with educators reporting higher levels of instructional strategy and classroom management efficacy than a national sample. Yet, teachers in the present sample reported higher levels of emotional exhaustion, a factor related to burnout. Educators showed increased efficacy for student engagement, instructional strategies, and classroom management over time, with the latter differing across school districts. Burnout, emotional exhaustion, and personal accomplishment varied significantly across educators but did not change significantly over time. For the burnout construct of depersonalization, mean scores were below the low score reported in the MBI manual at each time point. In addition, we examined the degree to which educator-level variables (e.g., years of experience, individual Ci3T implementation, social validity ratings) and school-level variables (e.g., school average treatment integrity and social validity) in Fall 2022 predicted year-end implementation. We learned educators with greater self-efficacy in student engagement reported higher levels of treatment integrity in Spring 2023, with moderate-magnitude effects (5.65% increase in treatment integrity scores for every one standard deviation above the sample mean – a potentially practically important finding) in Year 1, but no impact by the end of the second year (Spring 2024, Year 2). Finally, we examined the extent to which educator burnout, self-efficacy, and social validity ratings predicted educators’ implementation (treatment integrity). Collective results indicated individual-level factors (e.g., individual treatment-level treatment integrity scores, and in some cases teacher experience) were the primary drivers of efficacy outcomes, consistent with longitudinal results showing most variability occurred at the educator rather than school level. Findings closely aligned with prior Ci3T research conducted prior to the pandemic, in which educator-reported treatment integrity emerged as a consistent predictor of self-efficacy across domains (Lane et al., 2021; Oakes et al., 2021). In short, in the pre- and post-pandemic era, elementary Ci3T educators generally fare well with regard to their own well-being, with treatment integrity being a malleable factor worthy of future inquiry.
Supplemental Material
sj-docx-1-rse-10.1177_07419325261458754 – Supplemental material for Elementary Educators’ Well-Being in Ci3T: Longitudinal Analyses of Experienced Implementers
Supplemental material, sj-docx-1-rse-10.1177_07419325261458754 for Elementary Educators’ Well-Being in Ci3T: Longitudinal Analyses of Experienced Implementers by Kathleen Lynne Lane, Mark Matthew Buckman, Nelson Brunsting, Wendy Peia Oakes, Rebecca Lee Sherod Adams, Kandace Fleming, Nathan Allen Lane, Grant Edmund Allen, David J. Royer, Sandra Chafouleas, Amy Briesch, Matthew B. Aschliman, Allison Bernard and Stacie Williams in Remedial and Special Education
Footnotes
ORCID iDs
Funding
The authors disclosed receipt of the following financial support for the research, authorship, and/or publication of this article: The research reported here was supported by the Institute of Education Sciences, U.S. Department of Education, through Grant R324N190002 to University of Kansas. The opinions expressed are those of the authors and do not represent the views of the Institute or the U.S. Department of Education.
Declaration of Conflicting Interests
The authors declared no potential conflicts of interest with respect to the research, authorship, and/or publication of this article.
Data Availability Statement
Research materials are available from the first and second authors; most materials found on ci3t.org and related documents for the project are available on OSF.
References
Supplementary Material
Please find the following supplemental material available below.
For Open Access articles published under a Creative Commons License, all supplemental material carries the same license as the article it is associated with.
For non-Open Access articles published, all supplemental material carries a non-exclusive license, and permission requests for re-use of supplemental material or any part of supplemental material shall be sent directly to the copyright owner as specified in the copyright notice associated with the article.