
Abstract
This study assessed scores from the Counselor Burnout Inventory for factorial validity, convergent and discriminant validity, internal consistency reliability, and measurement invariance across U.S. and Korean counselors. Although evidence existed for factorial validity across both groups, mixed results emerged for the other forms of validity and reliability. Measurement invariance analyses revealed that three of the five factors possessed measurement invariance across cultures, thus allowing for statistically appropriate group comparisons. Of those invariant factors, mean differences indicated that Korean counselors reported higher scores on the Devaluing Clients and Deterioration in Personal Life factors than U.S. counselors. Both cultures experienced similar mean scores on Exhaustion.
Keywords
The importance of researching the burnout phenomenon is reflected in studies that have reported both the comprehensive nature of burnout and the individual effects and consequences to those who experience it. The research of Maslach and Jackson (1981) has made major contributions to this area and was one of the first to establish a multidimensional definition of burnout that included emotional exhaustion, depersonalization, and personal accomplishment. This has helped prompt contemporary research that uses this definition with diverse groups of participants (Hawkins, 2001; Hayter, 2000). Subsequent research on the effects of burnout by Melamed, Shirom, Toker, Berliner, and Shapira (2006) and Shirom (2009) have reported the importance of this phenomenon by linking burnout to cardiovascular disease and other health problems. Other studies have also indicated a positive relationship between chronic stress and both physical illness and depression (Bloch, Neeleman, & Aleamoni, 2004).
The majority of past counselor burnout studies have investigated the relationship between individual, physical well-being, and level of burnout (Vredenburgh, Carlozzi, & Stein, 1999; Watkins, 1983). That is, existing scales assessing burnout such as the Maslach Burnout Inventory (MBI) measure individual symptoms (Maslach & Jackson, 1981). However, studies related to counselor burnout have revealed that organizational variables (e.g., role conflict or role diffusion and job intensity) showed strong relationships with burnout (Brown & Wallace, 2004; Osborn, 2004; Vredenburgh et al., 1999). Therefore, more recent research recommended that the theoretical framework include organizational sources of counselor burnout and create a broader definition of counselor burnout that includes organizational contributions to burnout (Brown & Wallace, 2004; S. M. Lee, Oh, & Suh, 2007).
In light of supporting a more comprehensive and occupation specific definition, counselor burnout has now been characterized by the Counselor Burnout Inventory (CBI) through subscales that include feelings of Exhaustion, Negative Work Environment, Incompetence, Devaluing Clients, and Deterioration in Personal Life. This counselor-specific definition of burnout includes these subscales to create a broader feeling described as “the failure to perform clinical tasks appropriately because of personal discouragement, apathy toward system stress, and emotional/physical drain” (S. M. Lee, Baker, et al., 2007, p. 143).
Taking into account the contextual variables that contribute to counselor burnout, it is important to assess professional counselors’ burnout experience within the context of the counseling profession due to its impact on both the counselor who experiences the burnout and their clients who may also be affected by the phenomenon (Harris, 1984; Yu, 2007). Predictably, the unique challenges that current counselors encounter are often related to their role as a counselor. The specific context of different counselor roles was cited by J. Lee et al. (2010) and Kraus (2005) as an important factor to identify when studying counselor burnout. In addition, when considering the multicultural nature of counseling and the demand for counselor competency regarding multicultural issues (Sue, Arredondo, & McDavis, 1992), supervisors and administrators should also consider multiculturalism when working with counselors themselves concerning burnout and other issues.
The CBI developed by S. M. Lee, Baker, et al. (2007) provides broader dimensions of burnout than the MBI, and unlike previous burnout measures, the CBI assesses burnout specifically related to counselors. The CBI includes components of burnout such as items that relate to work environment, personal life, and feelings of competency that previous burnout measures did not include. Specifically, the CBI measures five factors: Exhaustion, Incompetence, Negative Work Environment, Devaluing Clients, and Deterioration in Personal Life. Currently, this is the only instrument specifically designed to assess counselor burnout in the United States (S. M. Lee, Baker, et al., 2007), although it is unclear whether these constructs generalize to other cultures. More specifically, research requires the investigation of whether different cultures experience and respond to counselor burnout differently, although research must first evaluate whether the assumption of measurement invariance (MI) is met to permit such comparisons.
Research using data collected on the CBI has provided evidence of adequate psychometric properties related to the counselor scores in several studies. Through exploratory factor analysis (EFA) and confirmatory factor analysis (CFA), a five-factor structure was developed (see S. M. Lee, Baker, et al., 2007) that provided adequate internal consistency and test–retest reliability coefficients based on their data. Convergent validity was also demonstrated by examining relationships between the CBI factors and several subscales on the Maslach Burnout Inventory–Human Services Survey (MBI-HSS; Maslach & Jackson, 1981). In addition to testing the psychometric properties of the test scores with U.S. samples, validity studies using the CBI were conducted with Korean counselors (Yu, 2007; Yu, Lee, & Nesbit, 2008). Regardless, it is still inappropriate to study cross-cultural differences without first testing for MI across samples, which is the purpose of the present study.
Measurement Invariance
MI, which is a submodel of factorial invariance, ensures that items and latent factors have equal meaning across different groups or populations (French & Finch, 2006). Developing and using instruments that possess MI across populations is critical when comparing potential differences (e.g., means, correlations, etc.) on or between attributes. Arguably, tests of MI are even more important with cross-cultural research, as differences could emerge not only because of cultural reasons but also because of the item translation. Testing for MI ensures, or at least provides evidence that any differences found between groups can be attributed to the variables of interest and not to variation in measurement characteristics (Chen, 2008). Although the CBI has been used with different groups of counselors (J. Lee et al., 2010; Yu, 2007; Yu et al., 2008), such analyses have yet to be conducted to ascertain the validity of cross-cultural comparisons. In other words, published reports of strong factorial validity with Korean (see Yu, 2007; Yu et al., 2008) and U.S. (S. M. Lee, Oh, et al., 2007) counselors does not imply valid comparisons across Korean and U.S. cultures. Moreover, recent research with the CBI also supported the implication that counselors may experience burnout in patterns that can be interpreted as typologies of burnout (J. Lee et al., 2010); however, these findings cannot be used for group comparisons unless MI exists.
The CBI was initially developed and tested on samples composed largely of European Americans and not until subsequent research (Yu, 2007; Yu et al., 2008) was this measure used to evaluate counselor burnout in other cultural groups (e.g., Korean counselors). Despite this research, whether the CBI is invariant across other cultural groups and if research findings generalize across cultures is still unknown. Thus, cross-cultural research is important to understand the universal as well as cultural-specific aspects of human process (Ng, 1999). Although MI is critical to statistically compare cultures, the detection of noninvariant items or scales can be equally educational. The lack of MI can occur for a number of reasons (Chen, 2008; Crockett, Randall, Shen, Russell, & Driscoll, 2005), thus providing a unique perspective into how different cultures respond to or perceive constructs. Some reasons for data or models possessing a lack of invariance include the following: Unique cultures may conceptualize the construct differently, groups may interpret the items or response options differently across groups, measurement translation, and/or certain groups have distinctive responding patterns (e.g., more prone to endorse extreme response options). Thus, MI analyses should accompany any cross-cultural research to prevent erroneous conclusions and uncover these differences for future exploration.
Understanding Culture in Relation to Measurement Invariance
To understand burnout constructs across different cultures, assessments and measures that produce invariant results are needed for valid interpretations and comparisons. Along a similar vein, it is critical to understand how culture may influence both the invariance and mean results. For this reason, a brief comparison of U.S. and Korean cultures is provided, with particular focus on the individualism versus collectivism paradigm. Historically, Koreans have valued the collective work of the group and the closeness of social structure, whereas those in the United States tend to value the strength of individuals (Peng & Nisbett, 1999; Triandis, 2001). Consequently, Klassen (2004) found that people from collectivist backgrounds have a lower level of self-efficacy when compared with their individualist counterparts. Considering these cultural differences, Korean counselors who tend to have collectivistic views of their profession as counselors might have different interpretations and perceptions related to counselor burnout when compared with U.S. counselors who embrace more individualistic views. Like many non-Western cultures, Koreans have a sense of interdependence and view themselves more in a social context (Markus & Kitayama, 1991).
Focusing solely on the Korean counselor population, this group may conceptualize burnout differently and use unique symptoms to identify it. Even if the CBI produced equivalent model fit across cultures, the metric (i.e., factor loadings) and scale (intercepts or thresholds) parameters could differ across cultural groups, thus limiting latent factor score comparability (Cheung & Rensvold, 2002). This is more troubling when the measure is translated from one language to another, as it is hard to determine whether differences between groups are because of attitudinal factors or the actual item translation. Similarly, if the factor loadings differ across ethnic groups this will directly affect the reliability coefficients, and thus the measurement error, which ultimately effects estimation accuracy and statistical power.
Purpose of Study
The primary purpose of this study was to test the CBI for MI across U.S. and Korean cultures, as well as to compare latent variable means across these groups. To accomplish this goal, the psychometric properties of the scores were assessed using data for each culture separately first. These analyses allow answers to the following research questions: (a) Do the two samples (U.S. and Korean counselors) produce comparable factorial validity, convergent validity, discriminant validity, and internal consistency estimates on the CBI? (b) Does the CBI possess MI across U.S. and Korean counselors and if not where do differences emerge? and (c) Do U.S. and Korean counselors experience the same degree (i.e., possess equal means) of burnout across the five CBI factors? These questions are extremely important to establish the comparability of counselors across these populations and identify any cultural differences that emerge between U.S. and Korean counselors.
Method
Sample
Two independent samples were collected to evaluate the psychometric properties of the CBI across cultures, with a particular interest in conducting invariance analyses and comparing latent factor mean scores across U.S. (n = 363) and Korean (n = 379) counselors. The U.S. sample completed the English version of the CBI (S. M. Lee, Oh, et al., 2007), whereas the Korean sample used the Korean CBI version (Yu, 2007). For this study, only one ethnic group (White non-Hispanics) was used to represent the U.S. sample (n = 339) to reduce the possibility of confounding variables related to ethnicity. To date, it is unknown whether the CBI possesses MI across ethnic groups within the United States and the sample size for the other ethnic groups was too small (n = 24) for such analyses.
The White non-Hispanic U.S. counselors (n = 339) were 75.5% female (n = 257) and sampled across the United States using both a mail distribution and online survey method. Counselors ranged in age from 23 to 76 years (M = 44.74, SD = 11.87) and represented a diversity of disciplines: mental health (18.0%), school counseling (15.7%), social work (18.5%), counselor education (3.5%), rehabilitation counseling (2.5%), and others (34.4%). Their years of counseling experience ranged from 0.50 to 43.00 years, with an average of 12.79 (SD = 9.00).
For the Korean sample, all counselors were of Korean descent and ranged in age from 23 to 60 years (M = 36.75, SD = 8.24). These counselors were 83.0% female (n = 313) and represented the following disciplines: school counseling (44.3%), mental health counseling (32.8%), college counseling (14.8%), and others (7.7%). Korean counselors’ years of experience ranged from 1 to 50 years, with an average of 13.91 (SD = 13.59).
Comparatively, the U.S. sample was older than the Korean sample. This difference was statistically significant when using both the parametric independent samples t test, t(706) = −10.49, p < .0001, d = −0.79, and the Wilcoxon–Mann–Whitney nonparametric test, Z = 8.92, p < .0001. Both parametric and nonparametric analyses were reported here given that the assumption of normality was violated based on the Shapiro–Wilk test, W(701) = .942, p < .0001. Conversely, there was not a statistically significant difference between U.S. and Korean counselors on years of counseling experience using the parametric independent samples t test, t(706) = 1.27, p = .205, d = 0.10, or the Wilcoxon–Mann–Whitney nonparametric test, Z = 1.41, p = .1590. This data also violated the assumption of normality based on the Shapiro–Wilk test, W(701) = 0.863, p < .0001. There was also a small, but statistically significant, difference in the breakdown by gender between the U.S. (75.7% female) and Korean (83.0% female) counselors, χ2(1, 715) = 5.82, p = .016, Φ = −0.09.
Measure
The CBI (Yu, 2007; S. M. Lee, Baker, et al., 2007) is a 20-item self-report counselor burnout measure. The CBI consists of five subscales: (a) Exhaustion (“I feel exhausted due to my job as a counselor”), (b) Incompetence (“I do not feel like I am making a change in my clients”), (c) Negative Work Environment (“I feel frustrated with the system in my workplace”), (d) Devaluing Clients (“I am not interested in my clients and their problems”), and (e) Deterioration in Personal Life (“My relationships with family members have been negatively impacted by my work as a counselor”). Each item uses a 5-point response scale (1 = never true and 5 = always true), with larger scores representing greater burnout symptomatology. The CBI contains items reflecting characteristics of feelings and behaviors that would indicate various levels of burnout within the counseling profession.
S. M. Lee, Baker, et al. (2007) reported the following internal consistency reliability estimates (α) across the five latent factors: Exhaustion (α = .80), Negative Work Environment (α = .83), Devaluing Clients (α = .83), Incompetence (α = .81), and Deterioration in Personal Life (α = .84). Support for construct and factorial validity was obtained through EFA and CFA (see S. M. Lee, Baker, et al., 2007).
Convergent validity was investigated with CBI data by examining interfactor correlations between the CBI and the MBI (Maslach & Jackson, 1981). The correlations between the two measures reported the following results: the Emotional Exhaustion subscale of the MBI was correlated with CBI Exhaustion subscale (r = .73), CBI Negative Work Environment subscale (r = .62), and CBI Deterioration in Personal Life subscale (r = .62); the MBI Depersonalization subscale was correlated (r = .56) with the CBI Devaluing Clients subscale, whereas the MBI Personal Accomplishment subscale was correlated (r = −.38) with the CBI Incompetence subscale.
Procedures
The U.S. data were collected through two methods. First, 290 research packets were distributed by mail to counseling facilities or individual counselors, as well as a state counseling conference in the southeastern region of the United States. Of the 290 packets distributed, 176 packets were returned to produce a response rate of 60.7%. For the second method, an e-mail containing a link to the survey was sent to an electronic mailing list disseminated by the Substance Abuse and Mental Health Services Administration (SAMHSA) facility. Through this method, 187 participants completed the survey. However, the number of counselors who received this e-mail is unknown. Combining the two methods, 363 U.S. counselors were included in the study.
The Korean data were collected by distributing 570 research packets nationally to professional counselors. To include professional counselors in various settings, the researchers used two main organizations for data collection. For school counselors, 247 research packets were mailed to province-level school counselor workshops. In addition, 323 packets were distributed to local counseling centers, including college counseling centers and youth counseling centers. From those distributed, 485 packets were collected to produce a response rate of 85.1%. However from those 485, only 379 (66.5%) surveys were usable because of incomplete surveys (i.e., did not actually respond to the questions/items) or providing invalid responses (e.g., marked all 3s).
Translation Process
To ensure an appropriate translation, the researchers followed validation procedures recommended in literature (Hui & Triandis, 1985; Marsella & Leong, 1995; Ng, 1999). One of the researchers translated the CBI into Korean, and a bilingual professional in English literature participated in back-translation. To provide content validity data, three bilingual professionals reviewed the translated CBI. Researchers made changes based on the feedback from reviewers. A total of 56 counselors participated in a pilot study to examine the level of language difficulty. They suggested alternate words and phrases of the CBI on the language feedback sheet attached with the CBI; changes were made for better accuracy of the Korean CBI based on the feedback. After editing for clarity, three bilingual professionals reviewed the CBI again and the final version of the CBI was used for the study (see Yu, 2007 for more details).
Statistical Analyses
The statistical analyses were conducted using the weighted least squares mean and variance (WLSMV) estimation procedure on a polychoric correlation matrix with Mplus 6.11 (Muthén & Muthén, 1998–2010) given that the data were ordered categorical. The latent factor variances were fixed at one for each latent factor to identify the model and set the metric, whereas the residual variance (or scale) was fixed at one using the delta parameterization (see Muthén & Muthén, 1998–2010). Although other methods are available to set the scale (Little, Slegers, & Card, 2006), this procedure assumes that the latent factor variances are equal across comparison groups and allows for equality tests of all unstandardized factor loadings and thresholds. This assumption is justifiable given the relatively small difference in subscale score between United States (U.S.) and Korean (K) estimated SDs across the five subscales: Exhaustion (SDU.S. = 0.70 and SDK = 0.72), Incompetence (SDU.S. = 0.59 and SDK = 0.64), Negative Work Environment (SDU.S. = 0.80 and SDK = 0.71), Devaluing Clients (SDU.S. = 0.51 and SDK = 0.58), and Deterioration in Personal Life (SDU.S. = 0.66 and SDK = 0.71). Missing data (0.18%) were treated using the default procedure in Mplus (see Asparouhov & Muthén 2010).
Because of low cell counts in response category 5 (always true), these values were recoded to a response option of 4 (often true) to improve threshold estimation and eliminate convergence problems. Univariate and multivariate analyses were also conducted to assess for normality and outliers at the item and latent factor level. Although some item response distributions were nonnormal (or asymmetrically), the latent factor scores were normally distributed. Given that WLSMV appears robust to nonnormal item responses (Flora & Curran, 2004), this concern should have minimal effects on the conclusions. An evaluation of outliers revealed no concerns at the item or factor level.
The first two CFA models tested the factorial validity with the U.S. and Korean samples individually. Essentially, these analyses determined the authenticity of the five-factor solution and the appropriateness of testing for configural invariance (CI, estimates the same model for each group simultaneously, with the estimated parameters differing groups across groups). A CI model was then tested to provide baseline statistics for the more restrictive MI model (e.g., equality of factor loadings and thresholds). An MI was tested next by constraining the unstandardized factor loadings and thresholds to be equal across groups. With ordered categorical data, item thresholds should be compared, whereas item intercepts are more appropriate with continuous data (see, Lubke & Muthén, 2004; Millsap & Yun-Tein, 2004). These item parameters were constrained in tandem given that both influence the item characteristic curve (Muthén & Muthén, 1998–2010). Other invariance procedures exist (e.g., forward and backward approaches); however, the end goal is to identify those items with different factor loadings and thresholds. Here, once an item was found to lack invariance, the source of noninvariance was ascertained (i.e., factor loadings, thresholds, or both parameters) using the modification indices and an evaluation of differences in parameter estimates for both groups.
Partial measurement invariance (PMI) models were also tested when appropriate. Compared with the MI model that requires all the factor loadings and thresholds to be equal across the groups, the PMI models relax these constraints when differences emerged between the groups (see Byrne, Shavelson, & Muthén, (1989) for more details). The final models constrained the U.S. latent mean to zero to test latent factor mean equality; thus the latent mean for the Korean sample indicates the number of units above or below the U.S. sample.
Model Fit
Model fit was investigated for the individual samples and CI model using both statistical and approximate model-fit indices. These statistics include the robust χ2, comparative fit index (CFI), Tucker–Lewis index (TLI), and root mean square error of approximation (RMSEA). Hu and Bentler (1999) tentatively identified CFI and TLI statistics greater than .90 and .95 adequate and good model fit, respectively. RMSEA values less than .08 and .06 have been identified as acceptable and good model fit, respectively.
Changes (Δ) in the aforementioned invariance model-fit indices were used to assess the degree of invariance by comparing a less restrictive model to more restrictive models. The Δχ2 provides a basis for statistical comparison between nested models. However, because the WLSMV estimation was used, the Δχ2 statistics were appropriately computed using the DIFFTEST procedure within Mplus. One problem with the Δχ2 (and χ2) statistic is its sensitivity to large sample sizes and complex models (Chen, 2007; Marsh & Hocevar, 1985). Therefore, the changes in model fit were interpreted using both statistical (Δχ2) and approximate fit indices (ΔCFI, ΔRMSEA, and ΔTLI). Chen (2007) recommended the following cutoff criteria for acceptable invariance model fit: ΔCFI ≤ .01 and Δ RMSEA ≤ .015. ΔTFI ≤ .01 are also preferable based on Cheung and Rensvold’s (2002) research. These cutoff values should be interpreted with the understanding that they were based on continuous data that used maximum likelihood estimation, intended to evaluate intercepts and not thresholds, and tested factor loadings and intercepts sequentially rather than in tandem. However, current research (Sass, Schmitt, & Marsh, 2012) indicated that all three estimators (WLSMV, maximum likelihood with robust standard errors and chi-square [MLR], and maximum likelihood [ML]) produce comparable results when the models are correctly specified.
Results
Assessing the appropriateness of a measure across different samples consists of two important components. The first ensures that data from the measure possess good psychometric properties within each culture and the second confirms that latent factor scores are calculated in similar fashion (i.e., data possess MI) across groups. To assess within-group evidence, CFAs were conducted to test the CBI’s evidences of factorial validity, convergent validity, and discriminant validity for each group. Reliability analyses were also conducted at both the test (i.e., internal consistency) and item (i.e., corrected item–total correlations) levels per group.
Factorial Validity
Model estimation procedures and model-fit statistics for the factorial validity analyses were identical to the invariance models below (see the “Invariance Results” subsection). The only exception was that standardized, rather than unstandardized, parameter estimates were investigated. As discussed later, good model-fit statistics were obtained for both cultural groups individually (see the “Invariance Results” subsection and the penultimate table in the text). Related to convergent validity evidence at the item level, an evaluation of the standardized factor loadings revealed that no items possessed loadings less than 0.50.
Collectively, these findings provide evidence for strong factorial validity for each group individually. Moreover, the modification indices indicated relatively little concern for items possessing cross loadings or correlated residuals. Although the standardized factor loadings were large and relatively equal across both groups, a few notable differences (i.e., Δλ = |0.20|) emerged for four factor loadings (see Table 1). The largest factor loading differences between the two groups were on Items 2, 12, 19, and 20. These differences are evaluated for statistical significance in the “Invariance Results” section. The item content is also provided in that section below. Note that the large standardized factor loading differences will not necessarily result in statistically significant unstandardized differences, as the latter takes into account item and latent factor variances and the former standardizes the item and latent factor variances.
Comparison of the Standardized and Unstandardized Factor Loadings Between the United States (U.S.) and Korean (K) Sample, Along With the Item Thresholds
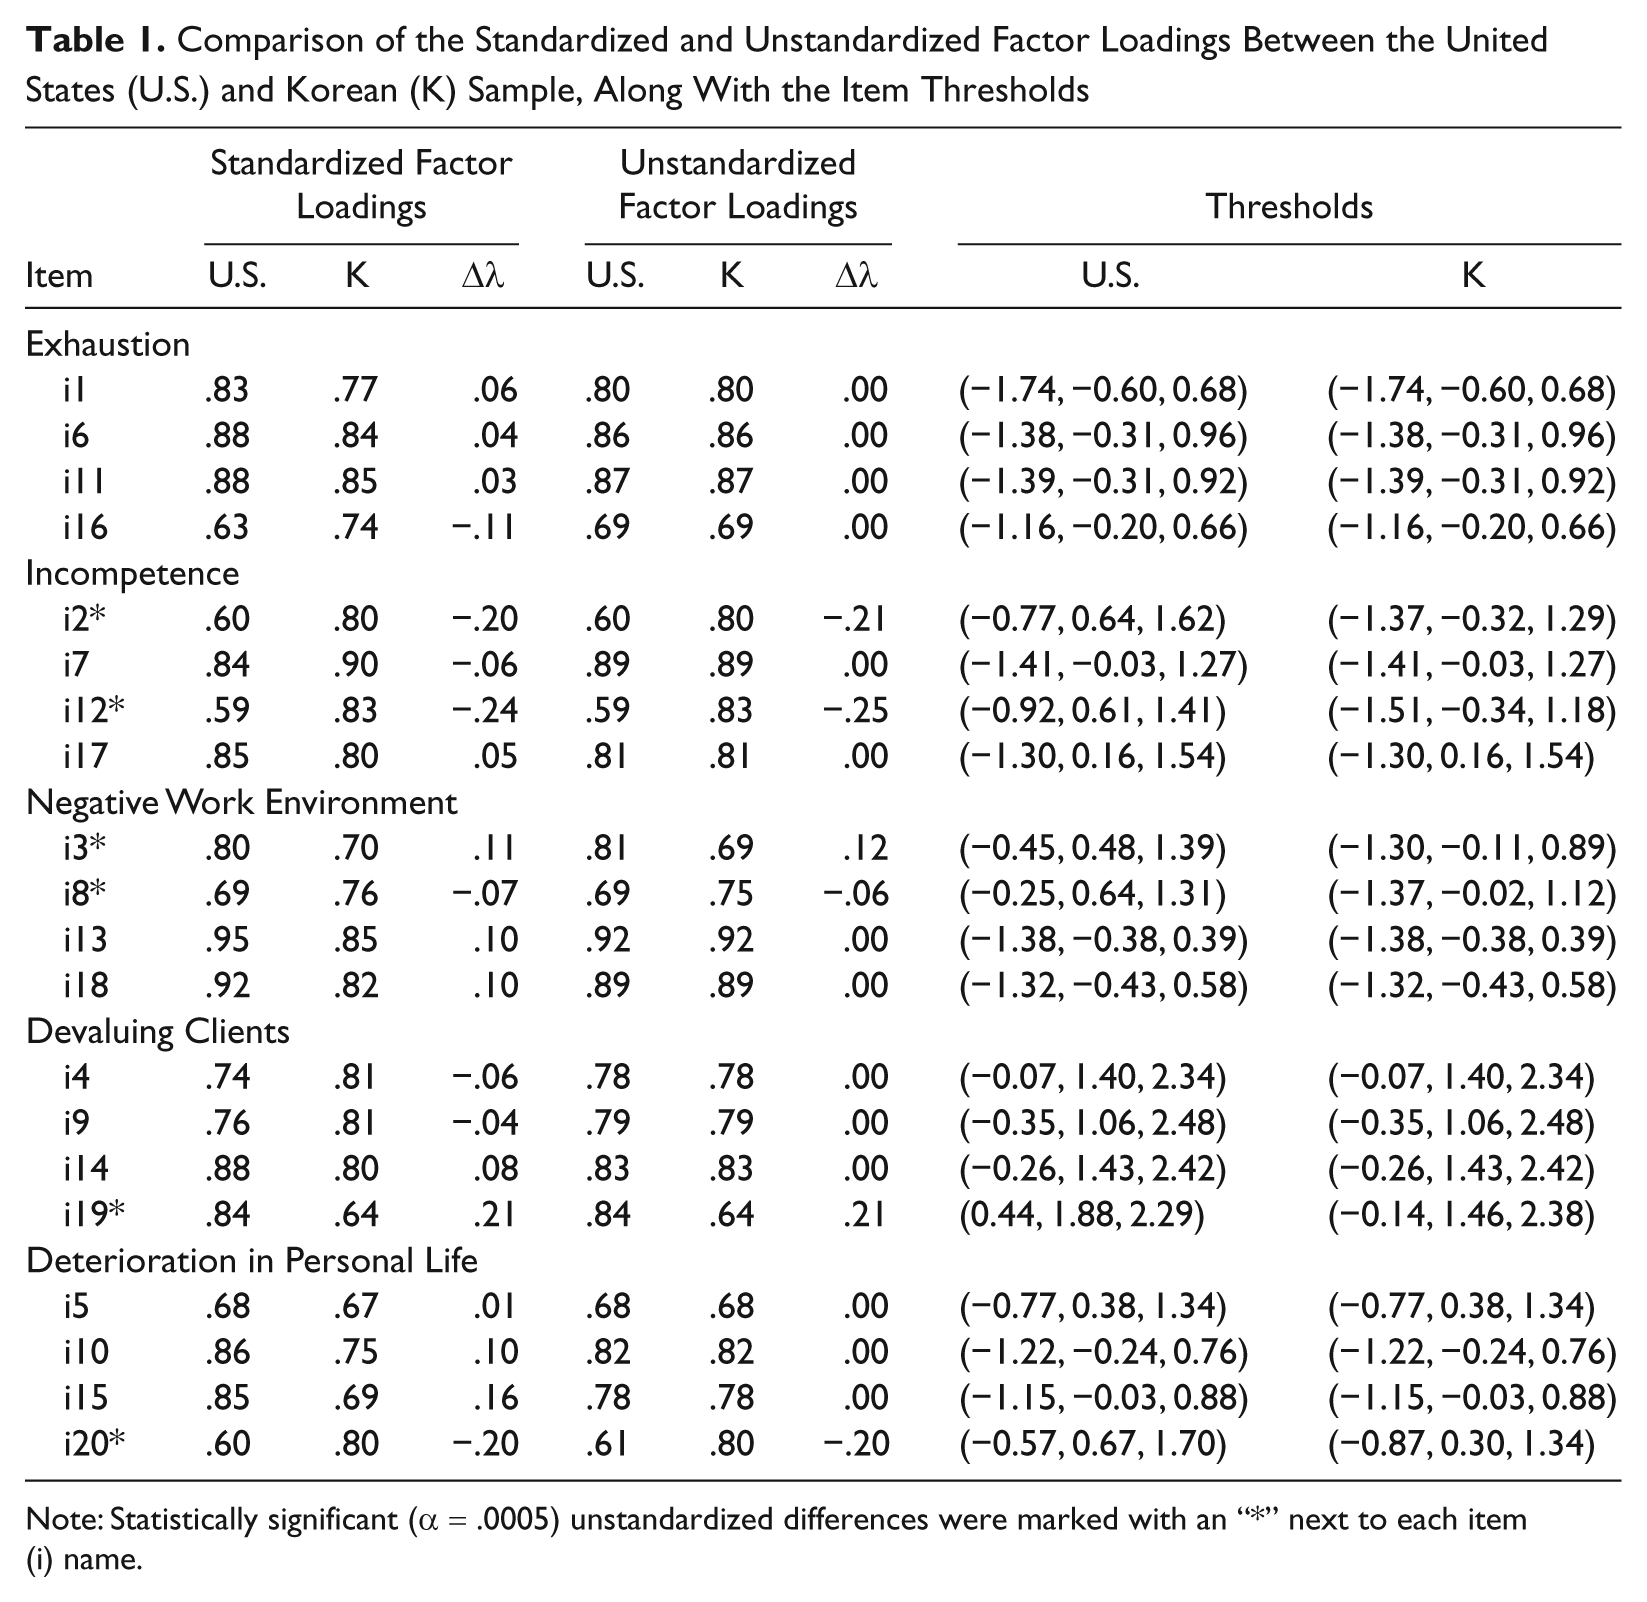
Note: Statistically significant (α = .0005) unstandardized differences were marked with an “*” next to each item (i) name.
Convergent and Discriminant Validity
Although factorial validity at the item level was strong, some of the interfactor correlations varied between the cultural groups. As reported in Table 2, significant between-group correlation differences surfaced using the Fisher r-to-z transformation. The Devaluing Clients latent factor consistently had larger interfactor correlations for the Korean sample than the U.S. sample, thus suggesting that changes in the other four latent factors produced greater devaluing of clients for Korean compared with U.S. counselors. Recall that the validity of these cross-cultural comparisons are contingent on MI, which as indicated below, does not hold for the Incompetence and Negative Work Environment latent factors.
Interfactor Correlations Between the Five Latent Factors for Both Samples
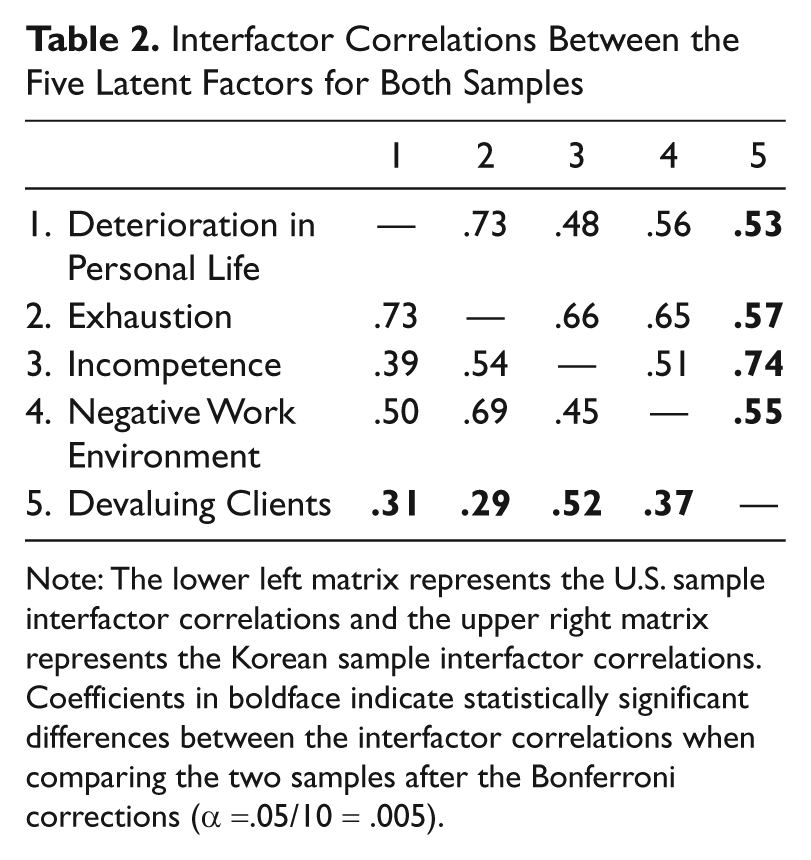
Note: The lower left matrix represents the U.S. sample interfactor correlations and the upper right matrix represents the Korean sample interfactor correlations. Coefficients in boldface indicate statistically significant differences between the interfactor correlations when comparing the two samples after the Bonferroni corrections (α =.05/10 = .005).
After adding covariance constraints to the final PMI model below, the covariance between Devaluing Clients and both Exhaustion and Incompetence latent factors were noninvariant, Δχ2(10) = 33.34, p = .0002. This substantiates the standardized results (i.e., correlations), with the exception of the invariant covariance between Devaluing Clients and Negative Work Environment latent factors. Nevertheless, group comparisons using these latent factors that provide data against MI should either not be conducted or be interpreted with caution. In terms of convergent and discriminant validity for within-group comparisons, the interfactor correlations were all large providing evidence of convergent validity, but not too large that it displayed poor discriminant validity.
Reliability Analyses
Internal consistency reliability (α) coefficients (see Table 3) indicated adequate internal consistency using the entire sample, as well as for each cultural group separately. A comparison between the U.S. and Korean samples revealed relatively few internal consistency reliability differences. The largest, and only statistically significant difference at α = .01 (.05/5 = .01) using the statistical procedure by Hakstian and Whalen (1976), occurred on the Incompetence subscale, with the larger internal consistency reliability coefficient for the Korean sample, M-statistic = 15.09, p < .001. These differences are expected given the lack of invariance on this latent factor (see the “Invariance Results” section). Regardless of group membership, every item possessed a large item–total correlation, thus each item consistently correlated with the subscale total score.
Internal Consistency Reliability Coefficients for Each Sample and Factor Separately
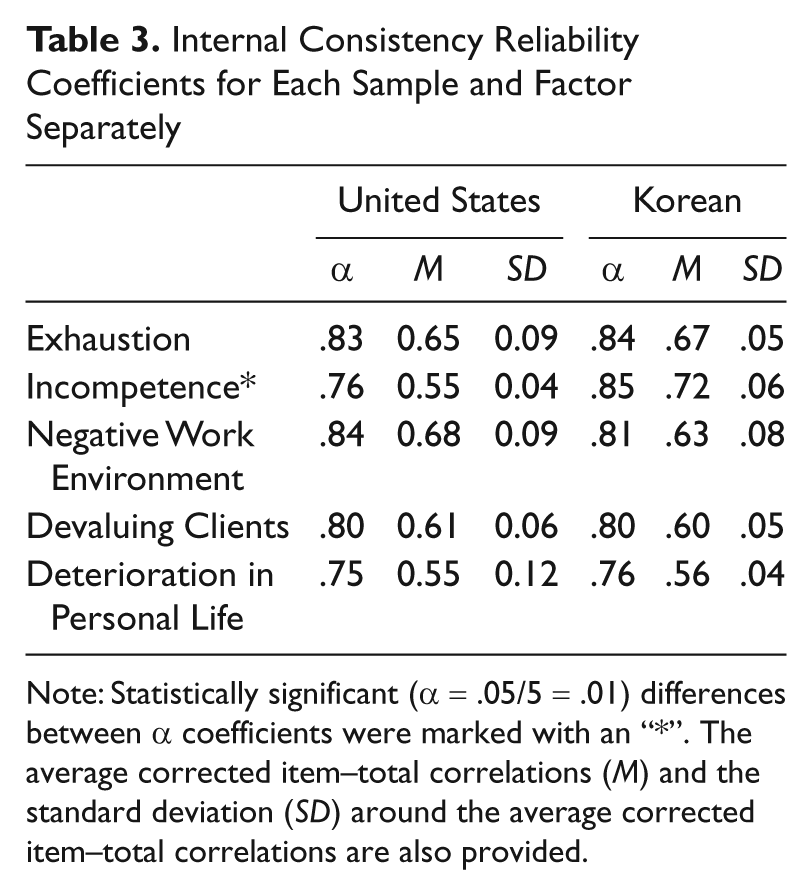
Note: Statistically significant (α = .05/5 = .01) differences between α coefficients were marked with an “*”. The average corrected item–total correlations (M) and the standard deviation (SD) around the average corrected item–total correlations are also provided.
Invariance Results
Model fit for both the Korean and U.S. samples provided statistically significant χ2 statistics; although, the other model-fit indices (RMSEA, TLI, and CFI) were within the adequate and good range (see Table 4). As noted earlier, χ2 statistics tend to be large and significant when using large samples and complex models (Chen, 2007; Marsh & Hocevar, 1985). Given the acceptable model fit from a practical perspective (i.e., RMSEA, TLI, and CFI), it is appropriate to combine the samples and test the CI model. The CI model also indicated a good model fit and provided confirmation that more restrictive invariance models could be tested.
Model-Fit Statistics for Each CFA Model Tested
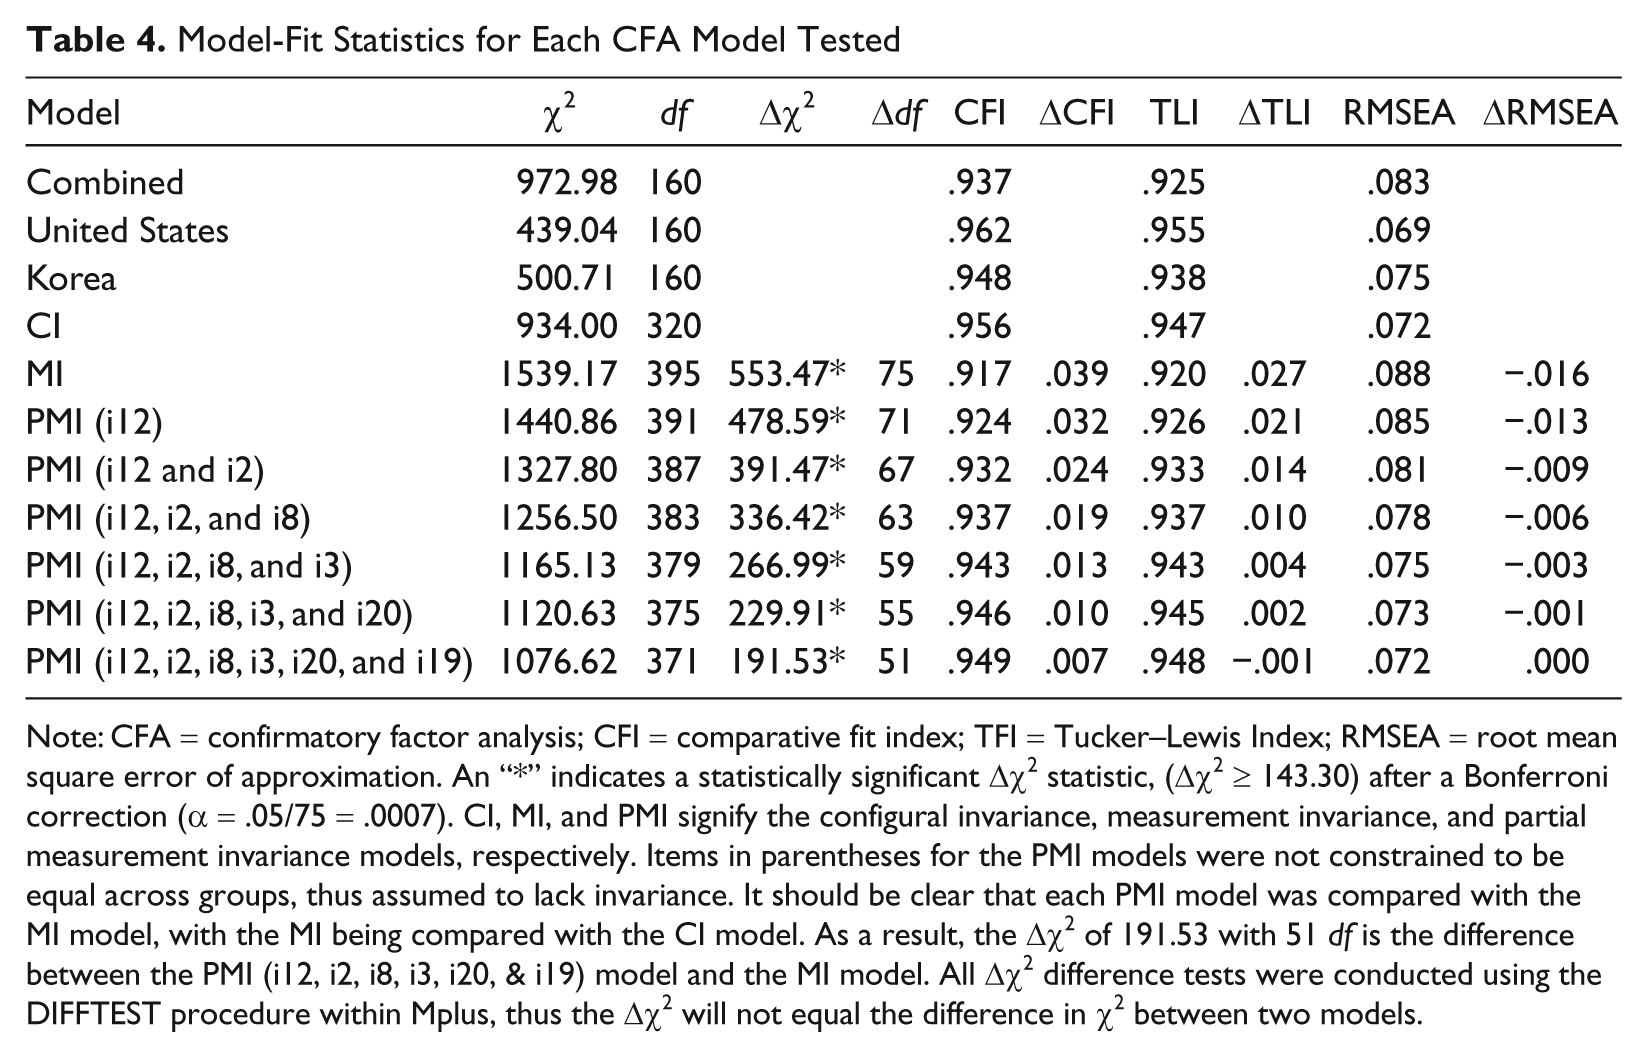
Note: CFA = confirmatory factor analysis; CFI = comparative fit index; TFI = Tucker–Lewis Index; RMSEA = root mean square error of approximation. An “*” indicates a statistically significant Δχ2 statistic, (Δχ2 ≥ 143.30) after a Bonferroni correction (α = .05/75 = .0007). CI, MI, and PMI signify the configural invariance, measurement invariance, and partial measurement invariance models, respectively. Items in parentheses for the PMI models were not constrained to be equal across groups, thus assumed to lack invariance. It should be clear that each PMI model was compared with the MI model, with the MI being compared with the CI model. As a result, the Δχ2 of 191.53 with 51 df is the difference between the PMI (i12, i2, i8, i3, i20, & i19) model and the MI model. All Δχ2 difference tests were conducted using the DIFFTEST procedure within Mplus, thus the Δχ2 will not equal the difference in χ2 between two models.
To assess the MI model, all unstandardized factor loadings and thresholds were constrained to be equal in tandem, as both parameters influence the item characteristic curve. The model’s statistically significant Δχ2 indicated that the overall CBI model failed to possess MI across the Korean and U.S. samples. Changes in approximate fit indices (ΔRMSEA, ΔTLI, and ΔCFI) also fell outside the acceptable range recommended by Chen (2007), thus evidence for MI did not emerge using this criteria either. To assess and understand these measurement differences, several PMI models were tested (see Table 4). For every item constrained to be equal across groups (or relaxed in the case of the PMI models), the change (Δ) in df was equal to 4 (Δdf = 4). The reason being that the number of thresholds equals the number of response options (rc) minus 1 for each item (thus the Δdf for the thresholds is equal to rc minus 1, so Δdf =4 − 1) and each item has one unstandardized factor loading per group (thus the Δdf = 1). Thus, by constraining an item to be equal (or not equal) across groups within this CFA model will result in the df changing by 4.
Identifying items that lacked invariance occurred by means of the modification indices and an evaluation of differences between parameter estimates. Parameter constraints were relaxed sequentially, starting with the largest modification index, and continued until the PMI model produced acceptable approximate model-fit statistics (i.e., ΔCFI, ΔRMSEA, etc.) and the Δχ2 was reasonable small and statistically nonsignificant.
Item 12 (I am not confident in my counseling skills) was first identified as contributing most to the lack of invariance. This item was then unrestrained (i.e., not constrained to be equal across the two groups) in the first PMI model (see PMI (i12) Table 4). For this item the unstandardized factor loading was greater for the Korean sample, with the thresholds also being noticeably lower (see Table 1). Essentially these unstandardized factor loading results imply that the relationship between item responses and the latent factor scores were greater for Korean than U.S. counselors. In terms of the threshold differences, Korean counselors with the same latent factor score as U.S. counselors had higher item responses.
This PMI (i12) model still produced inadequate model fit, thus implying that the remainder of the model still failed to be invariant (see Table 4). To explore these remaining differences, PMI models were tested sequentially and relaxed in the following order: i2 (I feel I am an incompetent counselor), i8 (I feel negative energy from my supervisor), i3 (I am treated unfairly in my work environment), i20 (I feel I have poor boundaries between work and my personal life), and i19 (I am no longer concerned about the welfare of my clients).
Overall, PMI results suggested that several items (i12, i2, i8, i3, i20, and i19) contributed differently (unequal factor loadings and/or thresholds) to their respective CBI latent factors between U.S. and Korean counselors. This is evident by the statistically significant Δχ2 and change in approximate fit indices (see Table 4). Therefore, in the population, a difference likely exists between these model parameters when comparing these two cultures. Most items that lacked MI resided on the Incompetence (i2 and i12) and Negative Work Environment (i3 and i8) latent factors.
Item characteristic differences between cultures were described below for Item 12 to aid the interpretation of the lack of item invariance. Readers can use Table 1, and this explanation, to interpret the other items. The unstandardized factor loading was greater for Korean than for U.S. counselors (λK = .83 vs. λU.S. = .59), which suggests that as latent factor scores increased, the item responses increased at a greater rate for Korean than U.S. counselors. Stated differently, this item was more highly correlated (i.e., more discriminating) with the overall latent factor for Korean than U.S. counselors, thus contributing more weight to the latent factor score. In terms of thresholds, these values were larger for U.S. (−0.92, 0.61, 1.41) than Korean (−1.55, −0.34, 1.18) counselors. More specifically, U.S. counselors, on average, provided item response of 1 with latent factor scores up to scores of −.92, whereas Korean counselors gave a response of 1 with latent factor scores up to −1.55. The explanation generalizes to the second and third thresholds. This indicates that counselors with the exact same latent factor score may differ in their item responses depending on the latent factor score location, with U.S. counselors having a lower average item response. This was substantiated by the item response distributions, as U.S. counselors had more extreme item response patterns than Korean counselors. Table 1 provides the direction of these item differences across the two cultures. As seen in Table 1 by evaluating the thresholds, U.S. counselors always had more extreme item responses than Korean counselors did. However, the unstandardized factor loadings were not always larger for Korean counselors.
Latent Factor Mean Differences
Latent factor mean differences were interpreted from both a statistical and practical significance perspective, with the tentative effect size standards (small |d| = .20, medium |d| = .50, and large |d| = .80) of Cohen’s (1988) followed. To assist with interpretation, recall that a mean difference (M Diff) always favors the reference group (i.e., United States), thus the mean difference of .49 on the Devaluing Clients latent factor indicated that Koreans scored .49 units higher than the U.S. counselors. The effect size of .45 denotes that Korean counselors were .45 estimated SDs above U.S. counselors.
Starting with the three invariant latent factors from an approximate model-fit perspective, the Devaluing Clients latent factor showed the largest mean difference and effect size with the Korean counselors scoring significantly higher than the U.S. counselors (see Table 5). The Korean counselors also scored higher than the U.S. counselors on the Deterioration in Personal Life latent factor; although only a medium effect size was obtained. The Exhaustion latent factor did not show a significant difference between the two groups from either a statistical or a practical perspective. Notice that the statistics (MDiff, Cohen’s d, etc.) were very comparable between the MI and PMI models, thus providing additional confirmation that the statistically significant noninvariant items on Devaluing Clients and Deterioration of Personal Life had relatively little impact on the conclusions.
Comparison of Latent Factor Mean Differences Between the Samples
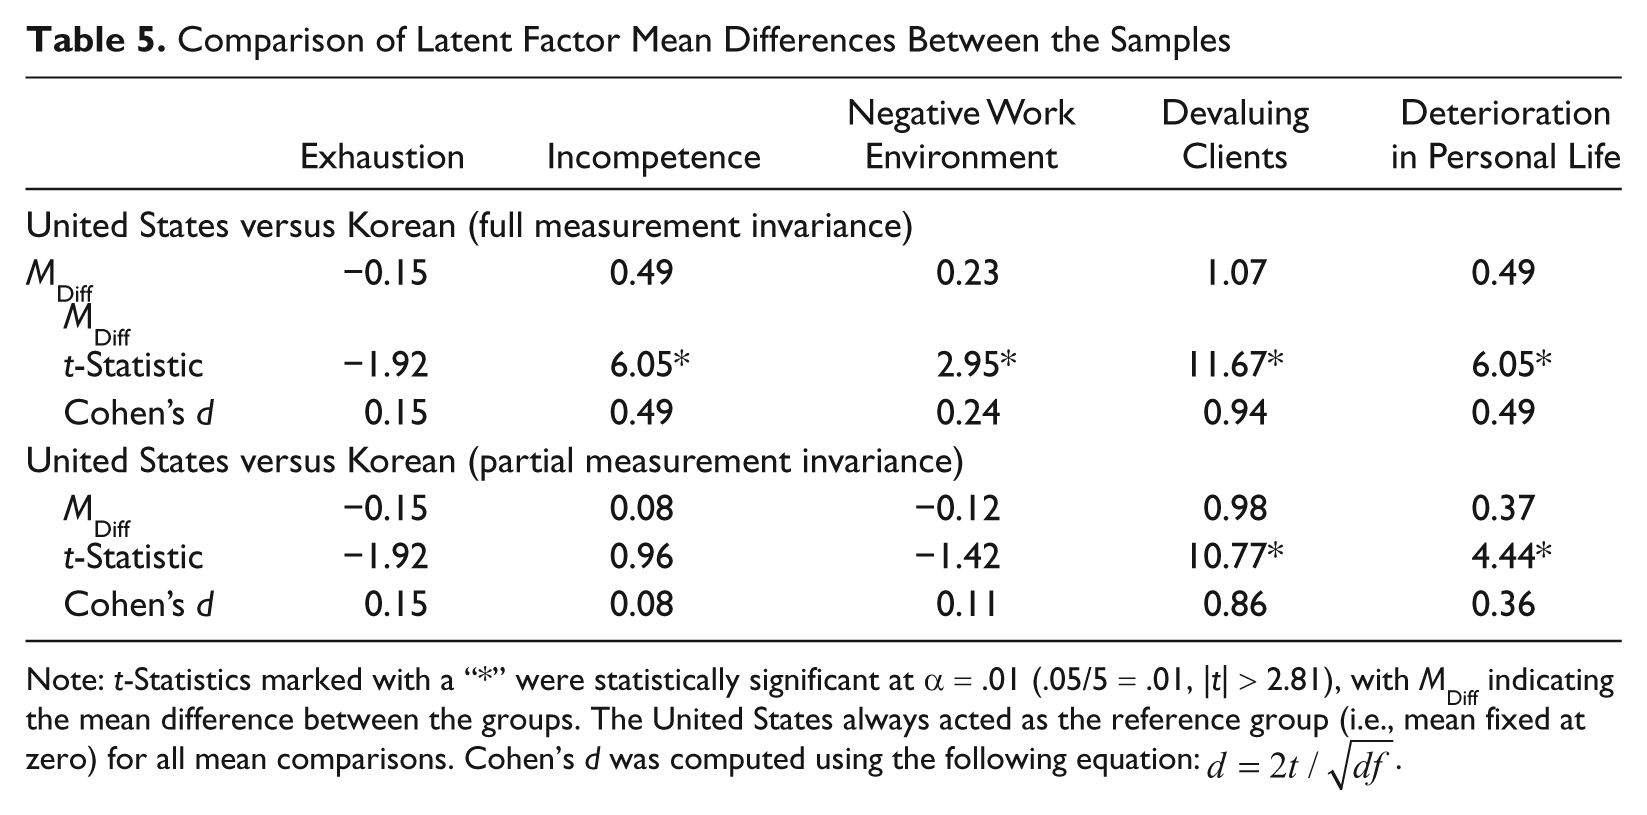
Note: t-Statistics marked with a “*” were statistically significant at α = .01 (.05/5 = .01, |t| > 2.81), with MDiff indicating the mean difference between the groups. The United States always acted as the reference group (i.e., mean fixed at zero) for all mean comparisons. Cohen’s d was computed using the following equation:
Table 5 also provides the latent factor mean comparisons on the Incompetence and Negative Work Environment latent factors, although these differences should not be interpreted (or interpreted very tentatively) due to the lack of MI. Instead, these results demonstrate the consequences of falsely assuming MI, as the conclusions differed based on whether the MI or PMI model was estimated. This difference was extremely pronounced on the Incompetence latent factor for which the effect sizes were .49 (p < .01) and .08 (p > .01) for the MI and PMI models, respectively. Therefore, if one erroneously assumed MI they would conclude, arguably falsely, that Korean counselors perceived themselves as having more Incompetence than U.S. counselors, with the means being .49 estimated SDs apart.
Discussion
The primary purpose of this study was to investigate the cross-cultural equivalence of the CBI across samples of U.S. and Korean counselors, while also providing supplementary evidence of validity and reliability. In terms of factorial validity, the original five-factor structure for the CBI was supported with U.S. and Korean samples. The interfactor correlations were all statistically and practically significant providing convergent validity evidence, but not too large to present discriminant validity concerns. However, the magnitude of the coefficients at times differed across groups, especially when considering the Devaluing Clients latent factor. In terms of reliability, internal consistency reliability coefficients were acceptable and relatively stable across the two cultural groups, with the only between-group difference emerging on the Incompetence latent factor.
The MI results varied, with neither Incompetence nor Negative Work Environment providing evidence of MI (half the items lacked invariance). Concerns also surfaced for the Devaluing Clients and Deterioration in Personal Life factors, with one item per factor failing to be invariant. The positive result is that latent factor mean differences did not appear to be adversely affected by the latent factors with only one item that lacked invariance. Consequently, results generally supported the notion of MI relating to the following latent factors: Exhaustion, Devaluing Clients, and Deterioration in Personal Life. Latent factor mean differences emerged between the cultural groups on the Devaluing Clients and Deterioration in Personal Life latent factors, whereas mean equivalence was obtained for the Exhaustion latent factor.
Although not given adequate attention in validity studies, as demonstrated here, MI is critical to the measure’s utility and provides another form of validity evidence. Anytime a researcher compares means, correlations, and other statistics between groups, they assume that the latent factor (or subscale) scores are invariant across the groups. If the unstandardized factor loadings and thresholds (or intercepts with continuous data) differ, this implies that either the items measure slightly different constructs and/or the respondents interpreted the items differently for a host of reasons.
As previously stated, two latent factors within this measure (Incompetence and Negative Work Environment) were deemed not to produce variant results across the cultural groups, which did not allow for appropriate latent mean or interfactor correlation comparisons. The items that contributed the most to this lack of variance were Items 2 and 12 (Incompetence) and Items 3 and 8 (Negative Work Environment). This finding is critical for researchers who desire to compare mean or correlation differences across these cultures, as clearly unequal metrics (factor loadings) and scalars (thresholds) make interpreting these differences inappropriate. Although within culture comparisons may be appropriate, such analyses (e.g., gender or racial differences) have not been conducted to date.
Any failure to obtain invariance is concerning given that the scales were written in different languages (i.e., English and Korean); thus, counselors might interpret the items differently because of cultural differences and/or the translation from English to Korean may not have been exact. Regardless, future researchers should attempt to discern the cause of noninvariance and make the needed corrections if possible or accept that the constructs are too different for statistical comparisons. These differences may be because of the translation process even if an appropriate translation methodology was implemented. These groups also may have simply interpreted or perceived the item content differently because of cultural differences, even with an accurate translation. For example, Klassen (2004) and Markus and Kitayama (1991) suggested that people from non-Western cultures tend to have lower levels of self-efficacy than their Western culture counterparts do. Consequently, non-Western cultures have relatively high levels of need for socially oriented achievement, but lower levels of need for individually oriented achievement. Assuming this is the case, determination of whether these differences are more general (i.e., occurs across all items, thus resulting in latent factor mean differences) or specific to certain item content (i.e., resulting in a lack of MI on certain items) is critical. If these differences are general, and not adversely influencing the metric and scalar parameter estimates, the latent factor mean differences are not of concern, as they cannot be attributed to a lack of MI.
Non-Western populations may also focus more on their ability to seek connectedness and interpersonal harmony, which can restrain their own needs. Thus, perceptions of incompetence for Korean counselors who tend to have collectivistic views may be perceived in different ways compared with Western counselors who have more individualistic views. This may explain the different perceptions on incompetence across cultures; however, it does not explain why certain items differ across cultures (i.e., lack invariance) and why others do not. When comparing the item response distributions across cultures, the U.S. counselors tended to endorse more extreme item responses than Korean counselors for some items. This may partially explain the lack of MI found in this study, which complements previous research by Yang, Harkness, Chin, and Villar (2010) suggesting that certain groups (U.S. subjects) tend to endorse extreme responses at a greater rate than other groups (Korean, Japanese, and other Asian cultures). In fact, based on Yang et al. (2010), this is likely a strong contributing factor to these differences. However, not all items displayed these patterns, which suggest that counselor differences across cultures are more item specific than universal.
One area that requires further investigation is whether differences (e.g., means, correlations, item functioning, or other model parameters) exist because of employment location or area of specialty in counseling. Compared with U.S. counselors (school counseling 18% and mental health counseling 15.7%), most of Korean counselors worked in school and mental health counseling fields (44.3% and 38%, respectively). S. M. Lee, Oh, et al. (2007) argued that the Korean school counseling work environment is quite different from the U.S. school counseling field, and it is possible that these differences may carry over to other counseling fields and influence the results. For example, from previous research, Korean school counselors have limited opportunities in work settings and reported poor social support especially from supervisors and staff in schools. They also reported difficulties in creating their own school counseling programs and role conflict (Keum, 2007; Kim & Yu, 2010; S. M. Lee, Oh, et al., 2007). Considering the lack of item invariance on the Negative Work Environment latent factor (i3 and i8), different proportions of work disciplines across the two groups may affect the results of this study. Moreover, issues unrelated to counseling (e.g., work environment, education opportunities, and relationship with clients) also tend to affect novice counselors’ burnout in Korea (Choi, Yang, & Lee, 2002). Regardless of the reason or cause of the lack of evidence for MI for specific items, researchers, practitioners, and clinical supervisors need to be aware of these findings.
As mentioned previously, appropriate mean comparisons were only made for three of the latent factors because of the lack of evidence for MI found in the Incompetence and Negative Work Environment latent factors and differing mean results based on the model estimated (MI vs. PMI). The Korean counselors reported significantly higher scores on the Devaluing Clients and Deterioration in Personal Life latent factors, although both groups appear to experience Exhaustion to a similar degree. Considering mean difference on both the Devaluing Clients and Deterioration in Personal Life latent factors, this may imply that Korean counselors view the counselor relationship differently and may be more personally affected by their work. As mentioned above, culture (i.e., collectivistic vs. individualistic) may also contribute to these mean differences.
Regarding group differences in interfactor correlations, both the Devaluing Clients with Exhaustion (Korean sample, Φ = 0.56 and U.S. sample, Φ = 0.29) and the Devaluing Clients with Incompetence (Korean sample, Φ = 0.74 and U.S. sample, Φ = 0.52) correlations differed based on group membership. Again, the interfactor correlation between Devaluing Clients and Incompetence should be interpreted with caution, as the perceived Incompetence latent factor was found to lack MI. This lack of MI on the perceived Incompetence latent factor may explain the unequal interfactor correlations. Klassen’s (2004) study reported that people from collectivist cultural backgrounds have a lower level of self-efficacy than their individualist counterparts. The possible link between Korean counselors’ relatively low level of competence and their negative perception of relationships with clients might have an effect on their counselor burnout. Thus, considering cultural and measurement aspects when assessing counselor burnout is extremely pertinent.
These differences in latent factor correlations also imply that Korean counselors may perceive poor relationships with clients as more exhausting and possibly invoke more feelings of incompetence than U.S. counselors. In a previous study on counselor burnout using U.S. and Korean counselors, Yu et al. (2008) reported that high levels of detached attitudes toward clients were strongly correlated with job dissatisfaction in Korean counselors, whereas negative perceptions of the work environment were most closely related with job dissatisfaction in U.S. counselors (S. M. Lee, Oh, et al., 2007). The study by Yu et al. (2008) also points to different correlations between CBI subscales and job satisfaction. Interestingly, the higher interfactor correlations among the other latent factors and Devaluing Clients support the implication that Korean counselors may be more affected by poor client relationships than U.S. counselors. However, considering the current sample’s vast work experience and cultural issues, these interpretations should be interpreted with some caution.
Limitations
Although the results of this study suggest the CBI produces evidence of reliable and valid scores within Korean and U.S. counselors individually, the results do not support MI across all latent factors of the CBI between the two groups. Despite the evidence for these results, it is important to discuss the limitations of this study as they are an important consideration when establishing the study implications. Foremost, differences in age and discipline of counseling could present limitations to this study, not to mention that U.S. and Korean counselors were not randomly sampled from their respective populations. Future studies should also examine intracultural differences to expand understanding of counselor burnout within the United States and Korea and its impact on various invariance analyses (measurement characteristics, structural coefficients, mean difference, etc.). For example, determining whether certain variables (e.g., age or years of experience) are invariant across group membership (e.g., does work experience moderate the relationship between Exhaustion and Incompetence?) may be of value. Finally, the measure used is self-report and may not represent their true behaviors (e.g., perceived competence may not correspond to their true competence level). Nevertheless, this study is extremely important given that it provides evidence of MI for specific latent factors, which determines when cross-cultural comparisons are appropriate. This is of significant interest given the rise in cross-cultural research and the need to learn from other cultures. For example, studies such as these are important to understand counselors’ experience across different cultures, so that we can not only make valid comparisons across cultures but also learn from other cultures how to improve work experiences.
Conclusions
Supervisors need to be aware of how counselors view burnout differently based on their culture, especially their relationship with clients. Counseling programs have at minimum 41% international students, with 53% at the doctoral level (Ng, 2006). Consequently, educators with counseling programs, and other mental health professions, need to be aware of cross-cultural differences and address these differences appropriately. In addition to counselor group differences because of culture, considering variation in how counselors experience burnout due to other variables, such as the type of clients they work with (J. Lee et al., 2010) is important for future research. Further utilization of the CBI with differing counselor groups may be beneficial for exploring these differences through invariance testing.
Footnotes
Declaration of Conflicting Interests
The author(s) declared no potential conflicts of interest with respect to the research, authorship, and/or publication of this article.
Funding
The author(s) received no financial support for the research, authorship, and/or publication of this article.