
Abstract
The psychometric properties of the General Functioning subscale of the McMaster Family Assessment Device were examined using the Rasch Model (N = 237 couples). Mothers’ and fathers’ ratings of the General Functioning subscale of the McMaster Family Assessment Device are recommended, provided these are analyzed separately. More than a quarter of couples differed significantly in their ratings.
Keywords
Self-report measures of family functioning are commonly used in population studies and as part of clinical assessments as a means of gaining understanding of an individual within the wider family system (Cox & Paley, 1997). The McMaster Model of Family Functioning is a well-established approach to conceptualizing the problems and health of families and is the basis of a number of assessment instruments (Miller, Ryan, Keitner, Bishop, & Epstein, 2000b). This study focuses on the validity of scores from the General Functioning subscale (GFAD) of the McMaster Family Assessment Device (FAD), with particular attention to its use with mothers and fathers.
The GFAD consists of 12 items (see Table 1) with four response categories labeled strongly agree, agree, disagree, and strongly disagree. Item scores are summed into an overall general score of family functioning. The items of the GFAD represent the subscales of the FAD, which were developed to assess the six dimensions of the McMaster Model of Family Functioning (Epstein, Baldwin, & Bishop, 1983; Kabacoff, Miller, Bishop, Epstein, & Keitner, 1990; Miller et al., 2000b). The GFAD is well suited to large-scale population studies such as the Ontario Child Health Study (Byles, Byrne, Boyle, & Offord, 1988), in which the scale was required to be short, and for general screening of family problems rather than detailed assessment of specific areas of functioning (Georgiades, Boyle, Jenkins, Sanford, & Lipman, 2008; Kabacoff et al., 1990; Ridenour, Daley, & Reich, 1999).
General Functioning Subscale of the McMaster Family Assessment Device.
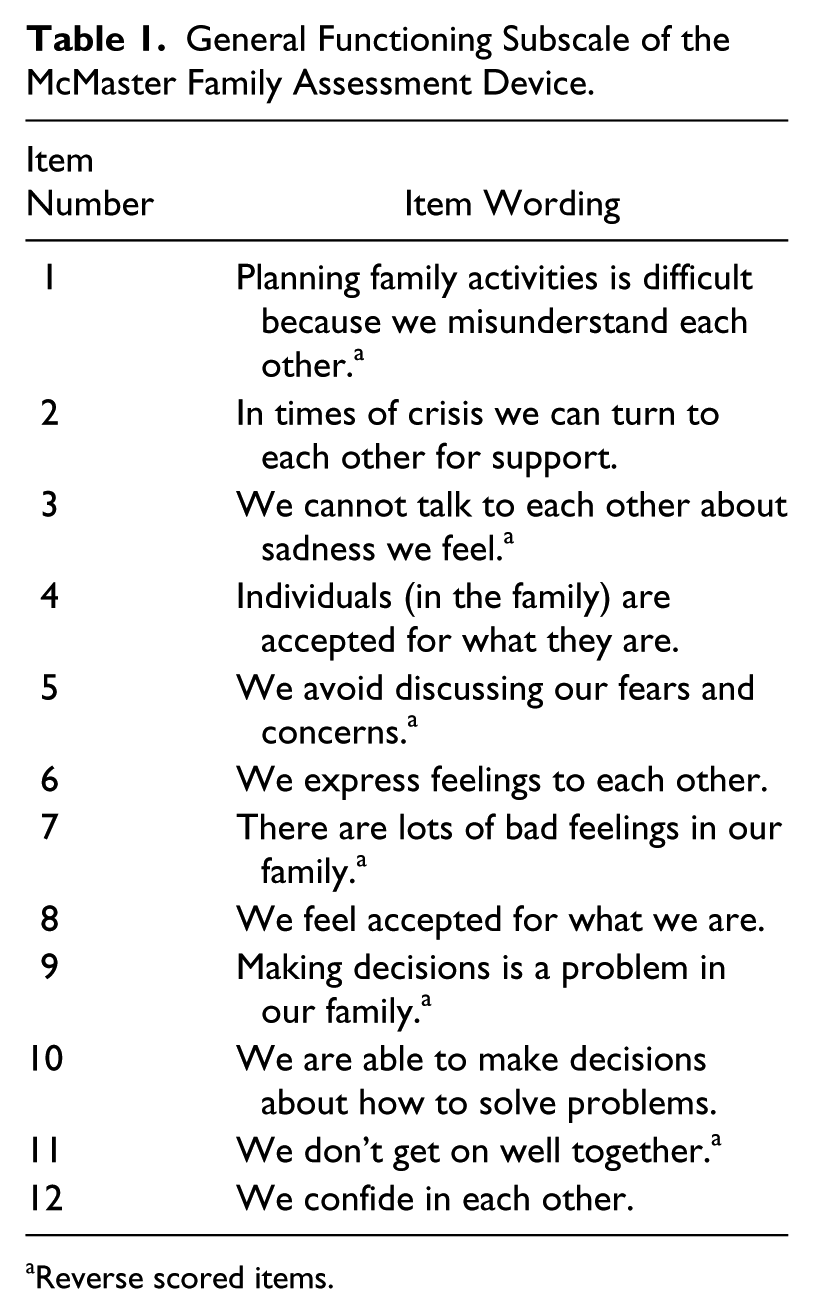
Reverse scored items.
Limitations of Family Assessment With the GFAD
A number of studies have used the GFAD with mothers and fathers from nonclinical samples (e.g., Kabacoff et al., 1990; Stevenson-Hinde, Curley, Chicot, & Jóhannsson, 2007). A benefit of the GFAD is that the item statements are targeted at family-level functioning rather than characteristics of individual or dyad functioning. Therefore, multiple family members can evaluate the family’s functioning, and differences between ratings of the same family can be examined. However, findings are inconsistent regarding the level of agreement between mother and father ratings. One study of parents with children aged 7 years (n = 55) found GFAD to have the lowest level of agreement of all the seven FAD subscales (r = .24), although there was no difference between means of mother and father GFAD scores (Akister & Stevenson-Hinde, 1991). Similarly, Sawyer, Sarris, Baghurst, Cross, and Kalucy (1988) and Stevenson-Hinde et al. (2007) found no significant difference between the mean scores of mothers and fathers of adolescents (n = 146 and n = 113, respectively). However, the GFAD scores of parents with preschool age children (n = 100) were found to have the highest level of parental agreement (r = .52) of all the subscales, and mothers tended to rate family functioning healthier than fathers (Stevenson-Hinde & Akister, 1995).
The differences between GFAD scores of mothers and fathers are of particular interest because of the practice of summing couple scores to produce a combined rating of family functioning (Hayden et al., 1998; Miller et al., 1994). Summing parent scores is known to mask the differences in ratings that are commonly found between mothers and fathers and provide a score that is not indicative of either parent’s assessment of the family (Green & Vosler, 1992). Also, analysis of differing scores has revealed that significant differences can be an indication of unhealthy family functioning (Akister & Stevenson-Hinde, 1991).
Georgiades et al. (2008) argued from a family systems perspective for multiple family-member reports of whole-family functioning and emphasized the need to identify the shared and nonshared variability of family members’ assessments. Epstein et al. (1983) also acknowledged in the development of the FAD that different family members and observers of a family are likely to have different points of view regarding family functioning and suggest that these differences are not primarily errors of measurement. To the contrary, they emphasized the identification of such differences provides useful and important information worthy of further investigation. Likewise, Cook and Kenny (2006) proposed the testing of “level validity” of family-functioning scores. They contend a measure of high-order-level family functioning should account for variance that is explained by lower order levels of dyad functioning or individual functioning. The differences commonly found in mother and father GFAD scores suggest the influence of unique dyad- or individual-functioning problems. These differences would be unidentifiable if the assessment relies on only one respondent or if it is a combined score from two respondents.
Controversy regarding the dimensions of the FAD has raised issues of the appropriateness of factor analysis as a test of validity since the FAD was developed with a “rational–theoretical” approach (Miller, Ryan, Keitner, Bishop, & Epstein, 2000a, 2000c; Ridenour et al., 1999; Ridenour, Daley, & Reich, 2000). This study contributes to the examination of the GFAD by applying a Rasch measurement theory approach to scale evaluation, which examines data at an item response level with a unidimensional model (Rasch, 1966).
Validation of Rating Scale Data
The goal of psychometric methods is to determine the validity and reliability of scores from instruments of measurement such as tests and rating scales. Another goal of psychometric methods is to determine if an instrument accurately reflects differences in subgroups of a population. While this is relevant for all instruments used in epidemiological studies, it has particular relevance for the GFAD, where it is important to identify if views about family functioning differ between parents and other family members. The Rasch model (Andrich, 1978; Rasch, 1960) is increasingly used to validate scores from instruments that purport to measure psychological constructs (e.g., Allison, Baron-Cohen, Wheelwright, Stone, & Muncer, 2011; da Rocha, Chachamovich, de Almeida Fleck, & Tennant, 2013). This use has increased because application of the Rasch model involves the formal testing of a scale against a mathematical model of measurement—a model consistent with the following fundamental requirements for measurement:
Unidimensionality: When there is evidence of multidimensionality, the total score is not reflective of a unified construct and the measure should be reevaluated.
Independence of responses: If a response to an item depends on the response to another item, the items are said to be dependent, and one of them can be considered redundant. Response dependent items inflate the reliability of scores giving a false impression of the amount of measurement error (Marais & Andrich, 2008; Smith, 2002).
Response categories operate as intended: The scoring order of response categories should reflect increasing levels of the latent trait being measured (Andrich, 2011).
Invariant item functioning for subgroups: Items should retain their meaning for different subgroups of the population, for example, across different ages or between females and males. If this is so, the degree to which items are endorsed will be the same for each subgroup.
Since previous studies have produced conflicting results regarding the differences between mothers’ and fathers’ scores on the GFAD, it is of particular importance to test that items function the same way for mothers and fathers.
The Current Study
In this study, the 12-item GFAD scale was evaluated by two procedures. First, mothers’ and fathers’ responses were analyzed separately, and then, composite data from both mothers and fathers were conjointly analyzed. Application of two procedures to the same data enabled the performance of the GFAD scale to be assessed in two different ways. The research questions investigated in this study are the following:
Method
Participants and Procedure
This evaluation of the GFAD used data from the Peel Child Health Study (PCHS; http://www.peelchildhealthstudy.com.au). The PCHS is a longitudinal population study designed to help identify the conditions that provide children with the maximum opportunity for achieving their developmental potential. The project included collection of psychosocial, environmental, biological, and genetic data, with a focus on the complexity of individual behaviors in context. Participants of the PCHS were English-speaking mothers and fathers living in the Peel region of Western Australia (Peel Development Commission, 2012). Over a 3-year period, medical practitioners invited all families in their care with a pregnancy at about the 18th week of gestation to participate in the study. Complete GFAD data were obtained for 237 of 433 couples who completed questionnaires administered at the time of recruitment. Only selected sociodemographic data and responses to the 12-item GFAD were used for this analysis. Ethical approval was obtained from the Curtin University Human Research Ethics Committee.
Statistical Analysis
Four negatively worded GFAD items were scored as strongly agree (0), agree (1), disagree (2), and strongly disagree (3) to satisfy the requirement that scoring starts at 0 in a Rasch analysis. Positively worded items were reverse scored so that higher scores represented healthier family functioning, as per recent studies using the FAD (Aarons, McDonald, Connelly, & Newton, 2007; Georgiades et al., 2008).
Responses were analyzed according to the polytomous Rasch model using the RUMM2030 software (Andrich, Sheridan, & Luo, 2012). The data best fit the partial credit parameterization of the polytomous model for all the analyses, as indicated by the likelihood ratio test in RUMM2030. Three analyses were performed:
Fathers’ responses only to the 12-item GFAD.
Mothers’ responses only to the 12-item GFAD.
Fathers’ and mothers’ GFAD responses combined to form a set of 24 items (mother Items 1 to 12 and father Items 13 to 24).
The following aspects of these scales were investigated:
Working of Response Categories
A threshold is the point on the measurement continuum, where the probability of a response in two adjacent response categories is equal. If the order of response categories on the instrument reflects increasing levels of the latent trait, as they should, then the order of the thresholds will be the same as that of the response categories. If not, it indicates that the response categories are not working as intended (Andrich, 2011).
Person/Item Alignment and Reliability
Because Rasch person and item estimates are on the same scale, the alignment of persons to items can be assessed. An index of reliability, the Person Separation Index (PSI) is reported, which in general is similar in value to Cronbach’s alpha (Andrich, 1982).
Fit to the Model
A number of statistics indicate data fit to the Rasch model. The item chi-square fit statistic compares the residuals of groups of persons, formed on the basis of their overall estimate. This study reports a summary chi-square statistic: A significant value means that the hierarchical ordering of the items varies across the trait. Item fit is also investigated statistically with the item-fit residual statistic, and person fit with the person-fit residual statistic. The item- and person-fit residuals are summary values of individual person by item residuals. If the data fit the model, the residual mean will be close to 0 and the standard deviation close to 1 (Andrich, Sheridan, et al., 2012).
Response Dependence and Multidimensionality
Marais and Andrich (2008) considered two ways that the assumption of local independence between items can be violated. The first is a violation of statistical dependence, which they called response dependence and the second is multidimensionality. Items with high residual correlations are considered to be response dependent. Multidimensionality can be assessed in three ways. First, if a principal component analysis of the residuals (PCA) indicates no meaningful pattern in the residuals, the unidimensionality of the scale is supported (Smith, 2002). Second, if a PCA indicates a meaningful pattern, two subsets of items can be formed, consisting of items loading positively or negatively on the first component. Person scores on the two subtests are compared with a t test analysis (e.g., Hagquist, Bruce, & Gustavsson, 2009; Smith, 2002). Third, the relationship between the subtests (or dimensions) is examined with a theoretical correlation between the underlying traits (Andrich, Sheridan, et al., 2012).
Results
Descriptive Statistics
Selected sociodemographic characteristics of the parents are summarized in Table 2. The parents ranged in age from 16 to 50 years with a mean age of 30 years for mothers and 32 years for fathers. All couples spoke English as their primary language at home and were living in a cohabiting relationship. Sixty percent of the mothers were expecting their first child.
Descriptive Statistics.
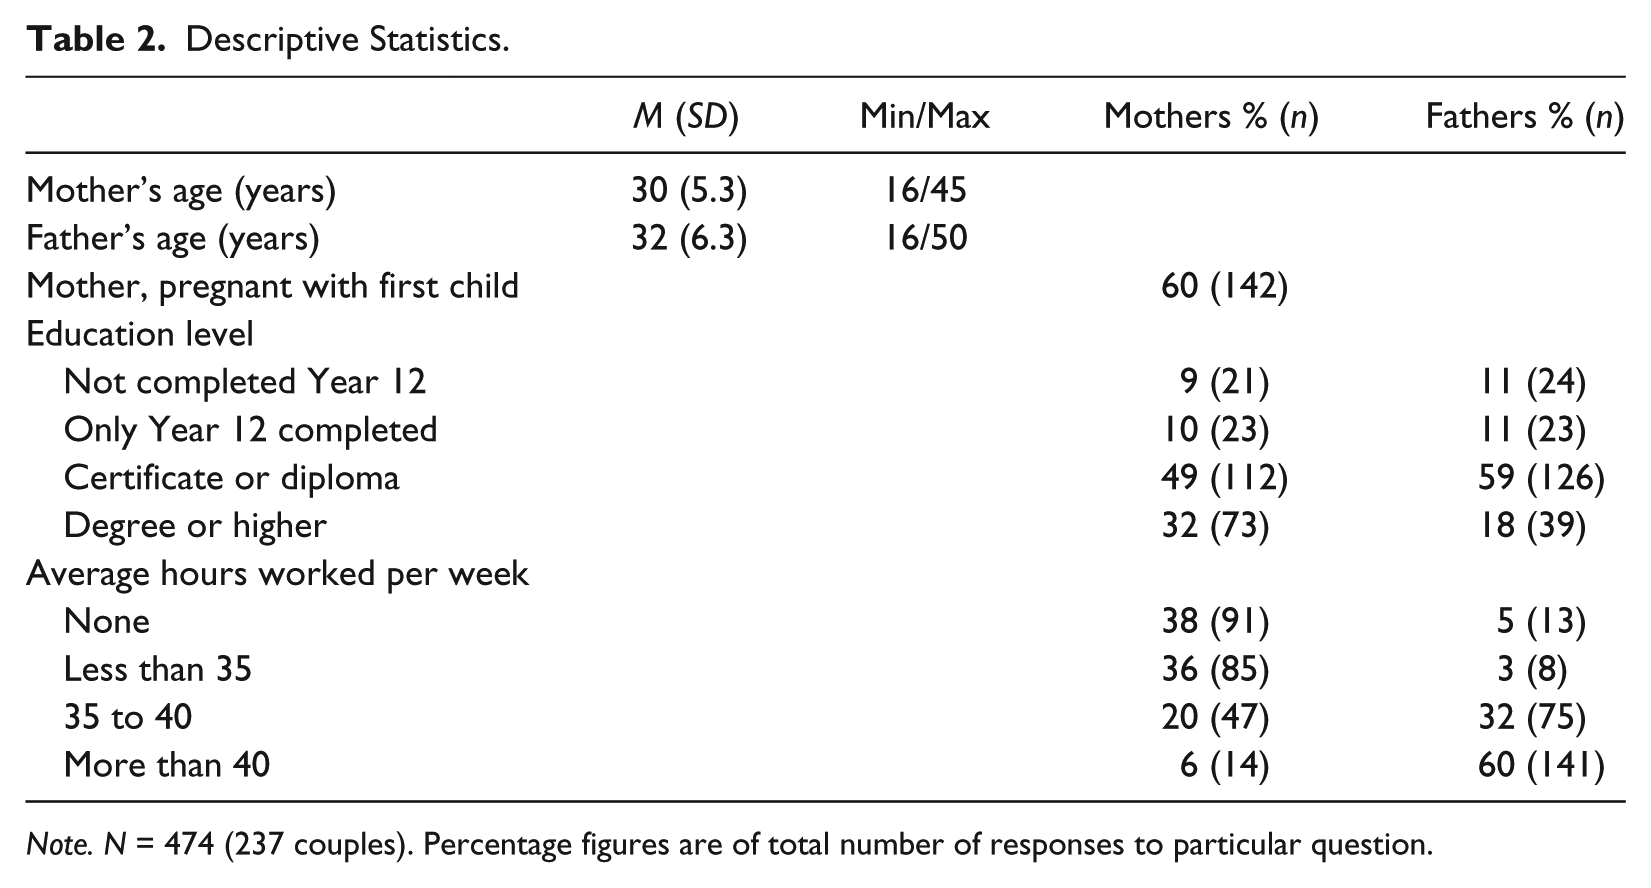
Note. N = 474 (237 couples). Percentage figures are of total number of responses to particular question.
Results of Separate Analyses of Mothers’ and Fathers’ GFAD
Response Categories
In both analyses, all items were found to have Thresholds 1 and 2 reversed, indicating that the response categories did not function as intended. Therefore, as a post hoc solution to this problem (Andrich & Wright, 1994), all items were rescored such that categories scored 0 and 1 were both scored 0, and the next two categories, scored 1 and 2, resulting in three possible scores and two thresholds. Rescoring, as described, resulted in all items showing ordered thresholds.
Fit to the Rasch Model
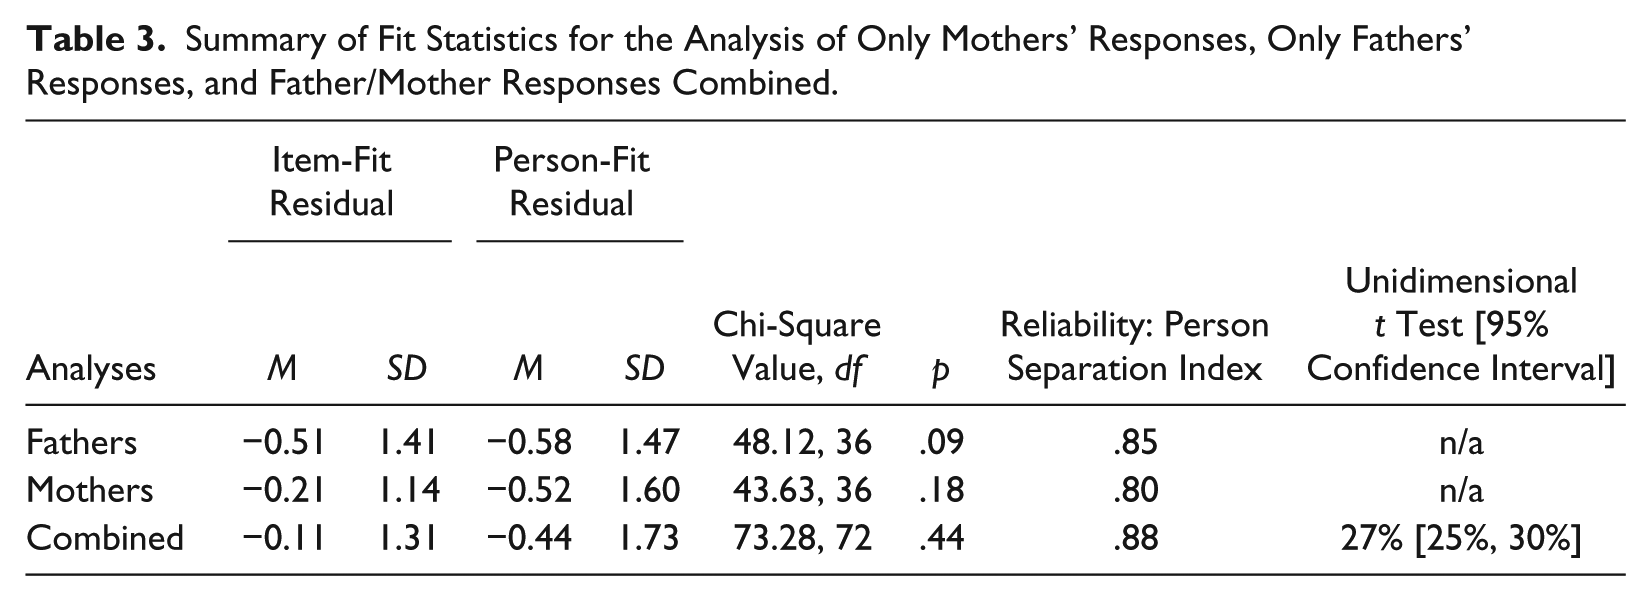
Table 3 shows a summary of the fit statistics for both analyses after responses were rescored. When analyzed separately, fathers’ responses to the 12-item GFAD fit the model, with a summary chi-square statistic of 48.12 (df = 36, p = .09). The item-fit residual mean was −0.51 (SD = 1.41), and the person-fit residual mean was −0.58 (SD = 1.47). Table 3 shows also that mothers’ responses similarly fit the model when analyzed separately.
Summary of Fit Statistics for the Analysis of Only Mothers’ Responses, Only Fathers’ Responses, and Father/Mother Responses Combined.
Person/Item Alignment and Reliability
Figure 1 shows the person–item threshold distributions for mothers’ responses (top) and fathers’ responses (middle). The mean of the mothers’ estimates were 2.16 compared with the mean of the item thresholds, which is constrained to be 0. There was a clear ceiling effect for the mothers’ estimates. The mean of the fathers’ estimates was also positive, but not as high at 1.82, and the ceiling effect was not as pronounced. Table 3 also shows values of the index of reliability, which ranged between .8 and .85.
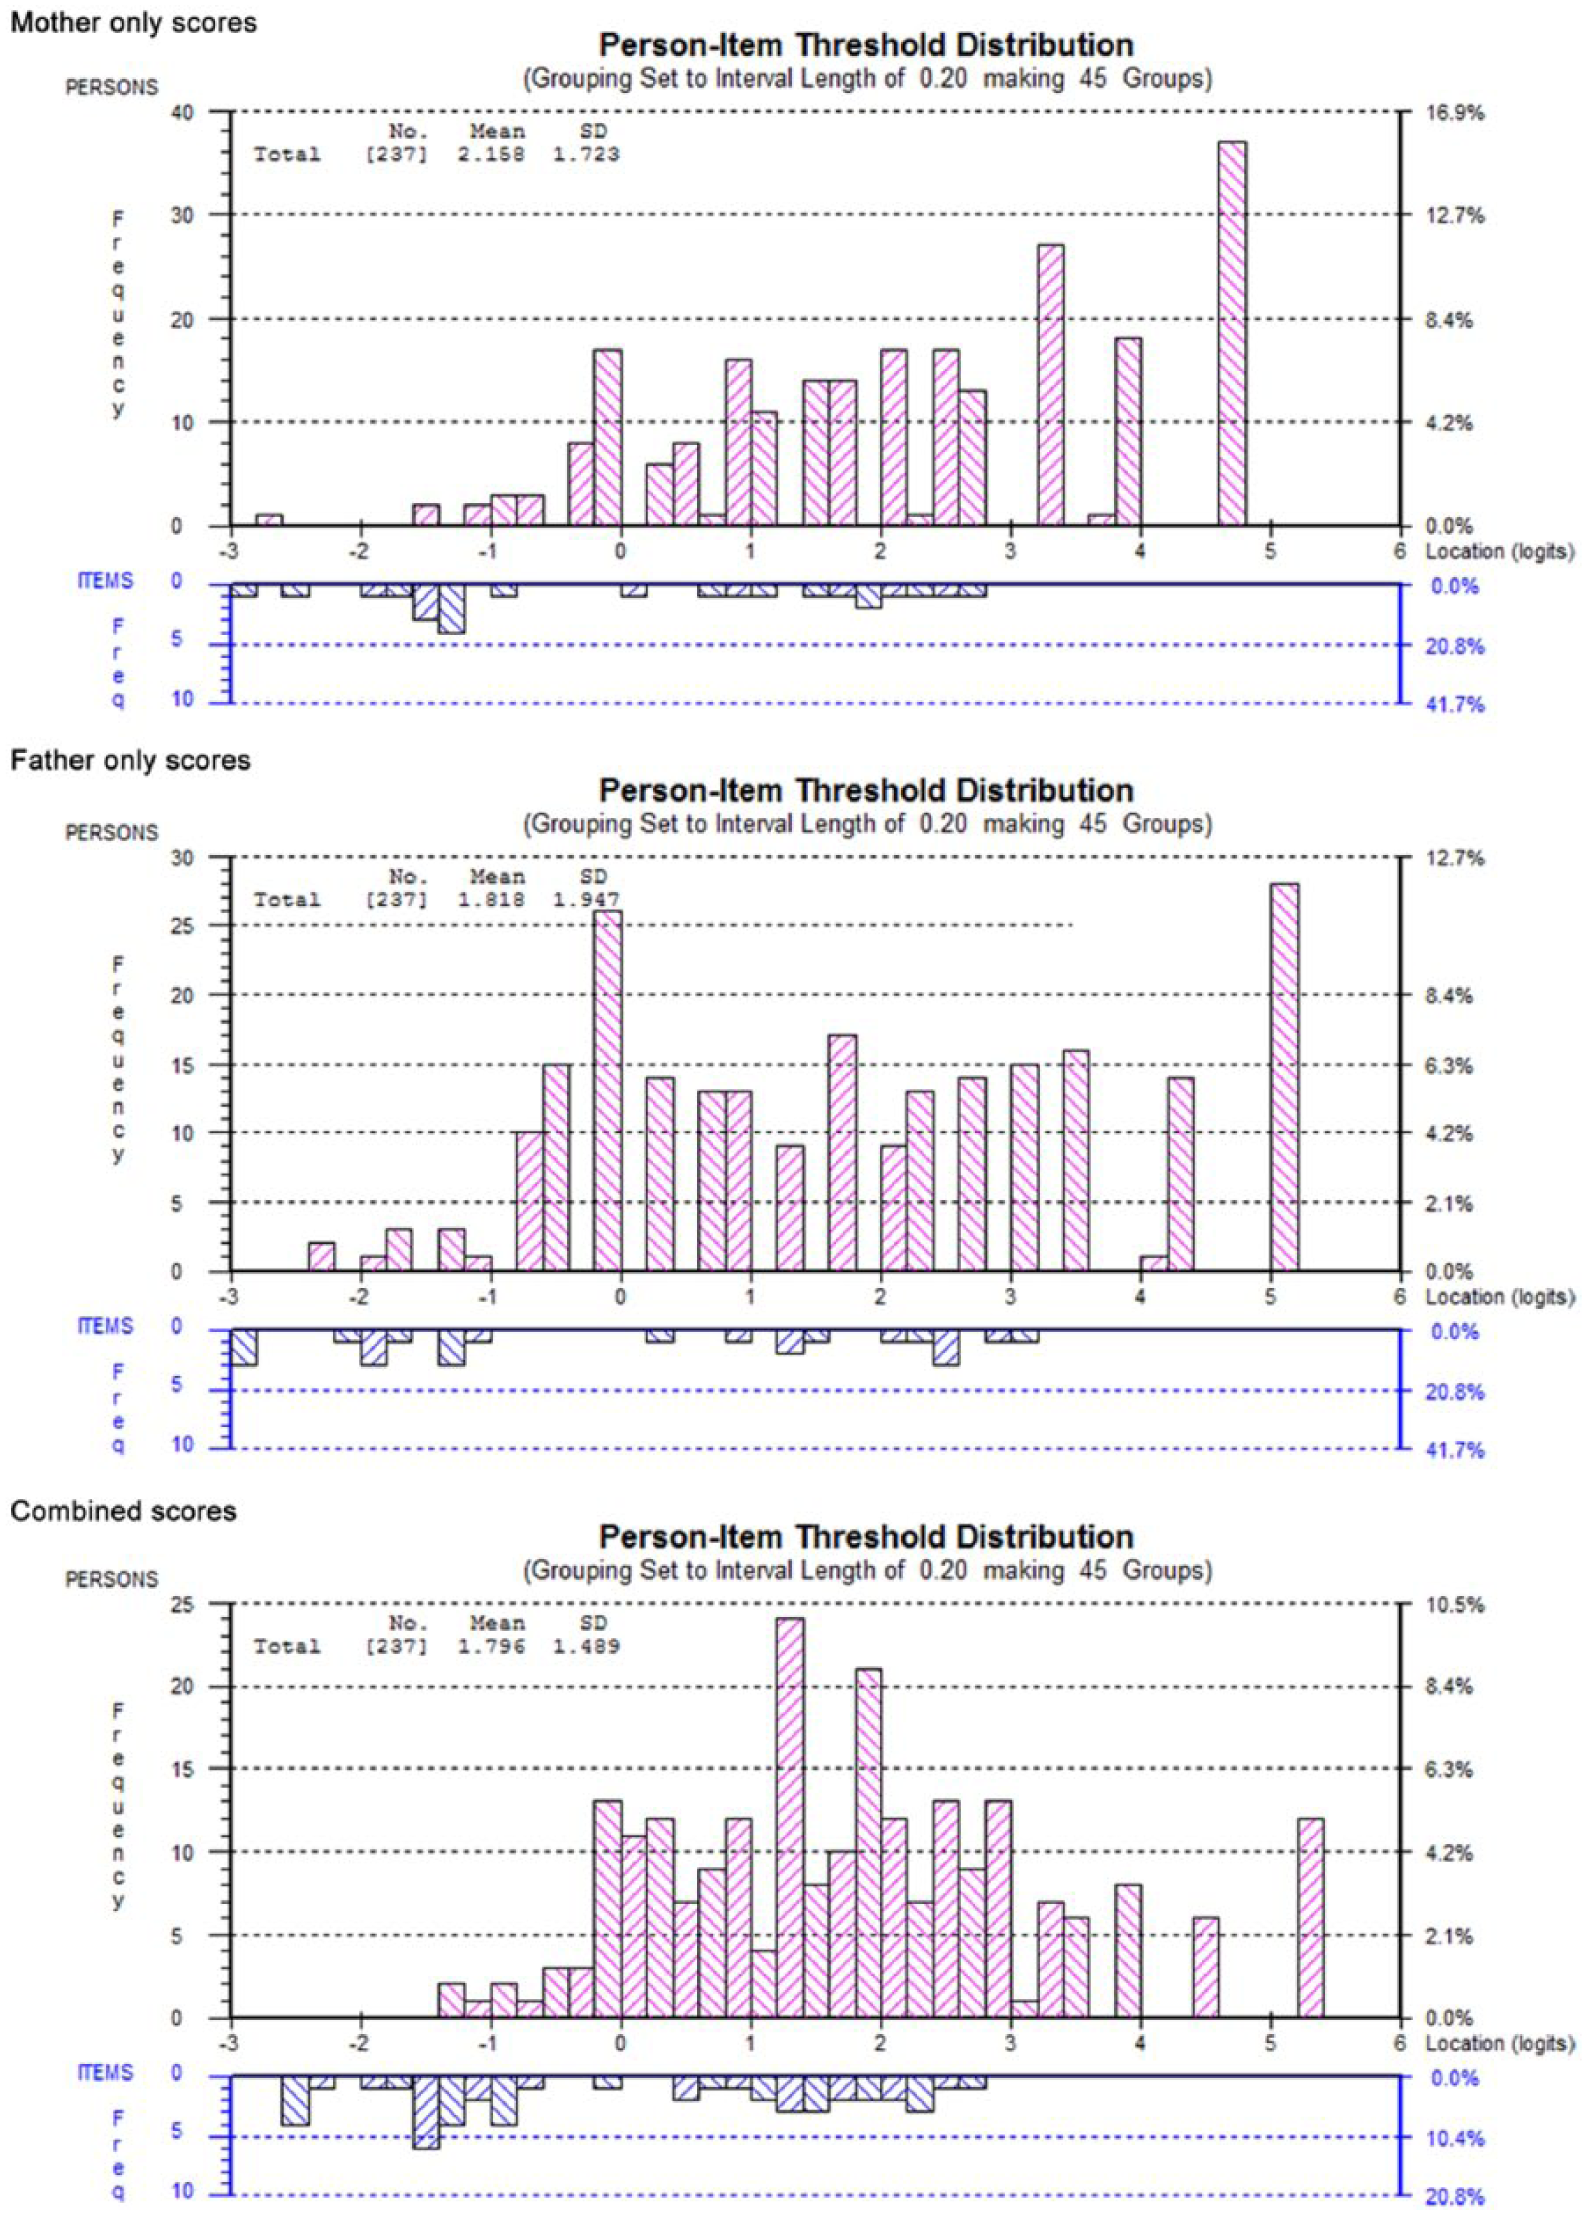
General Functioning subscale of the McMaster Family Assessment Device person–item threshold distributions for mother-only scores, father-only scores, and combined scores.
Response Dependence and Dimensionality
Examination of the item residual correlations showed no evidence of item response dependence for either mother or father GFAD items. A PCA of the residuals showed no evidence of multidimensionality for either mother or father GFAD scales.
Differences Between Mothers’ and Fathers’ Ratings
Gender effects were explored in these analyses by investigating the item order for mothers and fathers. Figure 2 shows the mothers’ item locations plotted against the fathers’ item locations and makes apparent the ease or difficulty of endorsing particular items. Three items that were easy to endorse (most likely to be scored highly even at unhealthy levels of family functioning) for both mothers and fathers were Items 4 (We avoid discussing our fears and concerns), 8 (We feel accepted for what we are), and 11 (We don’t get on well together). Items that were difficult to endorse (most likely to receive a low score even at healthy levels of family functioning) for both mothers and fathers were Items 1 (Planning family activities is difficult because we misunderstand each other), 9 (Making decisions is a problem in our family), and 10 (We are able to make decisions about how to solve problems). The correlation between item order for mothers and fathers was high (.84).
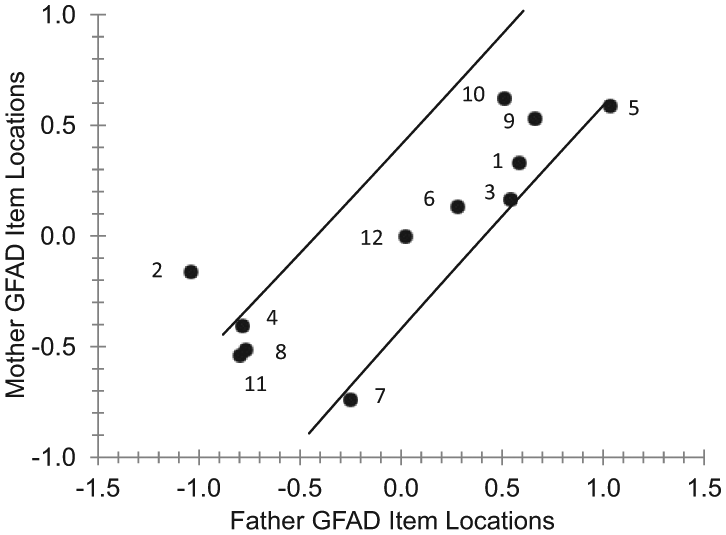
Plot of mother and father GFAD item locations with 95% confidence lines.
Figure 2 also shows the 95% confidence lines created with the item standard errors. Items plotted inside the standard error confidence lines are understood to be invariant (Bond & Fox, 2007). Items 7 and 5 were only just outside these confidence lines. Most notably aberrant was Item 2 (in times of crisis we can turn to each other for support), which was the easiest item to endorse for fathers (location −1.04), and relatively more difficult for mothers (location −0.16).
Results of the Combined Analysis of the 24-Item GFAD
Response Categories
As with the separate analyses, all items were found to have Thresholds 1 and 2 reversed, so items were rescored as in the separate analyses, which resulted in all items showing ordered thresholds.
Fit to the Rasch Model
Table 3 shows that ratings analyzed as a combined 24-item scale fit the model, as indicated by a summary chi-square statistic of 73.28 (df = 72, p = .44). The item-fit residual mean was −0.11 (SD = 1.31), and the person-fit residual mean was −0.44 (SD = 1.73). Smith (2002) has shown that Rasch fit statistics are insensitive to multidimensionality if the dimensions contain the same number of items. That is the case here, since 12 items are mothers’ ratings items and 12 items are fathers’ ratings items. Further investigation through specific tests of unidimensionality is therefore very important before one can conclude that responses to the 24-item couple GFAD fit the Rasch model.
Person/Item Alignment and Reliability
Figure 1 shows the person–item threshold distributions for the combined analysis (bottom). The mean of the person estimates was positive, 1.80, relative to the arbitrary origin of 0 for the item threshold locations. Even though there was no pronounced ceiling effect, the graph shows very high estimates at the positive end of the scale where there are no thresholds. The PSI, .88, indicates good reliability.
Response Dependence
Examination of the item residual correlations for item response dependence showed a number of item pairs with relatively high correlations. Further analysis should be undertaken to assess the level of dependency (Andrich, Humphry, & Marais, 2012), and redundant items could be considered for removal from the scale or procedures undertaken to account for dependence. Detailed analysis of response dependence is beyond the scope of this study.
Differences Between Mothers’ and Fathers’ Ratings—Dimensionality
Gender effects were explored in this analysis by comparing the means of the item locations of mothers and fathers. The mean of the 12 mother items was −0.18 and mean of the 12 father items was 0.18. On the whole, fathers rated family functioning lower than mothers; that is, the items were more difficult to endorse for fathers than for mothers. This resulted in a higher mean location of items for fathers than for mothers.
Gender differences were further explored in this analysis by looking for evidence of multidimensionality, which was clearly found using a PCA of residuals. Mother items loaded negatively and fathers positively on the first principal component. This first component explained 20.8% of the total variance among residuals with an eigenvalue of 4.99. The next two components were comparatively smaller; only 7.1% (eigenvalue = 1.71) and 6.6% (eigenvalue = 1.58) for second and third components, respectively. A paired t test of person estimates from subsets of mother and father scores differed significantly (p < .5) for 27% of couples (95% CI [25%, 30%]).
In a third test of unidimensionality, mothers’ responses (Items 1 to 12) were summed into a subtest and fathers’ responses (Items 13 to 24) were summed into a subtest. This resulted in two “items” for each family unit, one summarizing mothers’ ratings of the family and the other summarizing fathers’ ratings of the family. When two subtests were formed in this way, the PSI decreased from .88 to .41, indicating considerable multidimensionality. The estimated correlation between dimensions was low at .47. This is the theoretical correlation between the underlying traits in different subtests, corrected for attenuation because of error.
Discussion
When analyzed separately, it was found that mothers’ and fathers’ GFAD scores were generally valid and reliable and that the underlying constructs being measured were similar. However, the four response categories did not function as expected and serious problems were encountered when mother and father GFAD ratings were combined to produce a combined score for family functioning.
According to the Rasch model, each of the four rating response categories of the GFAD items should correspond with a consecutively higher level of the underlying trait. It was found, however, that successive categories of the GFAD items were not responded to as would be expected, and this was the case for both mothers and fathers, when analyzed separately or together. A possible reason that this pattern was not observed for the two low-scored categories of the GFAD is that there were relatively low frequencies of responses in these categories. It is also possible that parents reporting low family functioning may have difficulty or confusion when distinguishing between low and very low ratings of items.
The finding that mothers’ and fathers’ GFAD scores showed good reliability and fit to the Rasch model when considered separately, with no evidence of item response dependence or multidimensionality, confirms previous factor analysis results (Ridenour et al., 1999). These results support the use of the GFAD as a summary measure of family functioning. However, differences were found between the item location order for mothers and fathers. Mothers and fathers endorsed three of the items to a different degree in relation to the other items. The most notable difference was found with Item 2 (in times of crisis we can turn to each other for support), which was the easiest item to endorse for fathers and comparatively less so for mothers. The differences found in item location with these three items indicate some slight differences in priority or meaning of some aspects of family functioning for mothers and fathers. Further study with qualitative methods is required to better understand how availability of support in crisis is perceived differently by mothers and fathers in the context of family functioning.
As expected, the combined measure of family functioning was found to have clear evidence of multidimensionality, with the father and mother items accounting for two dimensions that were not strongly correlated (r = .47), confirming similar correlations from a previous study of families with young children (Stevenson-Hinde & Akister, 1995). When this multidimensionality was accounted for, the estimated reliability was very low indicating the initial estimate of reliability was inflated. This finding suggests that the use of a combined mother and father rating is a poor use of the GFAD. Although a combined score may be highly correlated with other measures of family functioning (Stevenson-Hinde & Akister, 1995), such a use of the GFAD masks significant variability in couples’ scores that is most likely explained by dyadic or individual characteristics (Cook & Kenny, 2006).
The variability between mother and father scores was examined with a comparison of mean scores and a paired comparison of couple’s scores. For this sample, fathers found the GFAD items generally more difficult to endorse than mothers, which supports the previous findings that fathers tend to report poorer family functioning than mothers (Stevenson-Hinde & Akister, 1995). This difference is also clearly represented in the high proportion (27%) of couples with significantly different scores. These results indicate both mother and father ratings should be separately considered and compared when evaluating family functioning. The identification of differences in scores is likely to be an indication of unhealthy functioning in addition to exceeding a simple raw score threshold (Akister & Stevenson-Hinde, 1991).
Implications for Practice and Research
The internal consistency reliability (PSI) of .80 to .88 for the GFAD scores is considered adequate for basic research purposes (Nunnally, Bernstein, & Berge, 1967). Fisher (2010) reported that a PSI of between .80 and .90 indicates the possibility of distinguishing between three groups enabling low, medium, and high levels of the trait to be separated with 95% confidence. Therefore, this study confirms the use of the GFAD for comparing groups or screening to identify families that may be experiencing problems. However, the GFAD is not an instrument that is suitable for quantitatively distinguishing between individual families or assessing change for an individual family in a clinical setting. Given the established theoretical basis of the GFAD (Miller et al., 2000b), practitioners may consider qualitative use of the GFAD responses as clinically useful.
Despite the fact that family functioning as a whole is greater than the sum of the individual family members’ functioning (Cox & Paley, 1997; Miller et al., 2000b), this study highlights the potential masking of important variation when the GFAD is used as a single informant or combined informant score. This finding confirms previous cautions by Green and Vosler (1992) and Georgiades et al. (2008) with clear evidence from Rasch analysis.
Reasons for different reports of family functioning from informants of the same family have been explored qualitatively by Stevenson-Hinde and Akister (1995). Unhealthy functioning was falsely identified for reasons such as situational stress expressed differently, limited personal development, and poor communication or expression. Conversely, healthy functioning was found to be falsely reported in cases of family dysfunction, such as when a child is used as a scapegoat and other problems are masked. Identifying differences in GFAD scores between multiple informants of a family is a useful screening for these potential issues.
Directions for Future Research
The sample in this research was limited to nonclinical English-speaking couples. Ideally, this Rasch analysis should be replicated with a sample including families that have been identified as having family functioning difficulties and also with versions of the GFAD in other languages and with other cultures. Although this study investigated the general performance of the GFAD, it did not make comparisons with scores from other measures of individual and dyad functioning or alternative measures of family functioning, which is an important aspect of convergent construct validity. Another useful variation of this current analysis of the GFAD would be to utilize other combinations of family members, such as a parent and an adolescent child rating combined. These suggested directions of research are also applicable for the more comprehensive FAD.
The threshold disorder identified with the lower rating categories requires further investigation. Data from a clinical sample would provide higher frequencies in these low categories and provide clearer evidence of response category use. If threshold disorder is confirmed, further study should then be undertaken with a single category for low functioning responses.
Conclusions
Data from the GFAD were found to conform to the requirements of the Rasch measurement model. These findings confirm cautions from previous authors regarding use of a single informant of family functioning or summing mother and father scores. Analysis revealed that over a quarter of couples differed in their rating of their family’s functioning. Also, fathers were, on average, more severe in their rating of family functioning than mothers. Identifying these differences is a source of valuable information regarding assessment of family functioning and an opportunity for better understanding overall family health or pathology.
Footnotes
Declaration of Conflicting Interests
The author(s) declared no potential conflicts of interest with respect to the research, authorship, and/or publication of this article.
Funding
The author(s) received no financial support for the research, authorship, and/or publication of this article.