
Abstract
Objective:
This study is aimed to investigate the efficacy of erdosteine usage in acetaminophen-induced liver damage and to compare it with N-acetyl cysteine (NAC) in the treatment and prevention of liver toxicity due to overdose of acetaminophen.
Methods:
The rats were separated into the following six groups of seven rats each: control group; acetaminophen (1 g/kg, orally); acetaminophen (1 g/kg, orally) + erdosteine (150 mg/kg/day, orally); acetaminophen (1 g/kg, orally) + NAC (140 mg/kg loading dose, followed by 70 mg/kg, orally); NAC (140 mg/kg loading dose, followed by 70 mg/kg, orally); erdosteine (150 mg/kg/kg, orally), subsequently. In all the groups, potential liver injuries were evaluated using biochemical and hematological analyses, oxidant–antioxidant parameters and histopathological parameters.
Results:
In acetaminophen-treated group, levels of alanine aminotransferase (ALT), aspartate aminotransferase (AST), total oxidant status (TOS) in the blood, prothrombin time (PT) and international normalized ratio (INR) were significantly increased when compared with controls. However, total antioxidant capacity (TAC) and glutathione (GSH) levels were decreased in group treated with acetaminophen, when compared with control group. Levels of AST, ALT and TOS, PT and INR were decreased in groups treated with NAC and erdosteine after acetaminophen administration, but the levels of TAC and GSH were increased. Histopathological improvements were observed in the groups treated with NAC and erdosteine after acetaminophen administration.
Conclusion:
The present study demonstrated that, in the prevention of liver damage induced by acetaminophen intoxication, an early treatment with a single dose of erdosteine was beneficial instead of NAC administration.
Introduction
Acetaminophen is a commonly used analgesic and antipyretic agent. However, when taken in overdose, it can cause hepatic necrosis and even death in humans and experimental animals (Bessems and Vermeulen, 2001; Maddrey, 2005). The intake of acetaminophen in therapeutic doses is safe, but more than 140 mg/kg in a single use or more than 7.5 g/day for long-term use in adults can lead to intoxication. Adults who take acetaminophen in overdose mostly do so when attempting suicide, whereas acetaminophen overdose in children is primarily accidental (Bartlett, 2004; Hung and Nelson, 2004; Mladenović et al., 2009).
Acetaminophen is easily absorbed and it peaks in circulation within 2 h of therapeutic doses. Its amounts of 20–46% and 40–67% are metabolized in the liver by sulfation and glucorunidation, respectively. At least 5% is absorbed through the kidneys. A small amount of acetaminophen is oxidized to a toxic reactive metabolite N-acetyl-p-benzoquinone imine (NAPQI) by cytochrome P450 enzymes. This metabolite is detoxified by glutathione (GSH) in the liver, and then it is removed from the body through conversion to nontoxic mercapturate (Hung and Nelson, 2004; James et al., 2003). However, the mechanisms of sulfation and glucorunidation become insufficient in cases of overdose. A large amount of acetaminophen is metabolized by cytochrome P450 enzymes, and eventually the source of GSH is exhausted. Also, a large amount of reactive and toxic metabolite NAPQI is produced from the overdose of acetaminophen oxidized by cytochrome P450 enzymes, but it is not detoxified because the source of GSH is exhausted (Hung and Nelson, 2004; James et al., 2003; Kuvandik et al., 2008).
N-Acetyl cysteine (NAC) is used as a standard therapy to prevent and decrease acetaminophen-induced hepatotoxicity (Hung and Nelson, 2004; Prescott et al., 1977; Rumack, 2002; Yagmurca et al., 2007). There are only a few clinical and experimental studies in the literature in which the use of erdosteine for hepatotoxicity caused due to drugs or toxic agents was noted (Selcoki et al., 2007; Yagmurca et al., 2007; Yesildağ et al., 2009).
In this study, we aimed to investigate the efficacy of erdosteine usage in acetaminophen-induced liver damage and to compare it with NAC usage in the treatment and prevention of liver toxicity due to overdose of acetaminophen.
Materials and methods
Animals and experimental procedures
Experiments were performed on 42 adult female Wistar albino rats (210–240 g). The rats were cared for in accordance with the Guide for the Care and Use of Laboratory Animals. They were housed in silent rooms with a 12-hour light–dark cycle (7:00 a.m.–7:00 p.m.). The Ethics Committee of the Izzet Baysal University approved the study protocols (2011–2014).
In the present study, we used the methodology of the previously published study of Kandis et al. (2011). The rats were separated into the following six groups of seven rats each:
Group 1: control group;
Group 2: acetaminophen group; acetaminophen (1 g/kg, orally);
Group 3: erdosteine treatment group; erdosteine at a loading dose (150 mg/kg, orally) is given 2 h after acetaminophen (1 g/kg, orally), followed by a single daily dose of erdosteine (150 mg/kg, orally) for 3 days;
Group 4: NAC treatment group; NAC at a loading dose (140 mg/kg, orally) is given 2 h after acetaminophen (1 g/kg, orally), followed by a maintenance dose of NAC (70 mg/kg, orally) given 17 times, 4 h apart;
Group 5: NAC control group; NAC given at a loading dose (140 mg/kg, orally), followed by a maintenance dose of NAC (70 mg/kg, orally) given 17 times, 4 h apart;
Group 6: erdosteine control group; erdosteine given at a single dose (150 mg/kg, orally) daily for 3 days
Solutions of acetaminophen, NAC and erdosteine were distilled with water. Then, these solutions were given orally via nasogastric tube. Three days after treatment, all the rats were anesthetized by administering ketamine hydrochloride (50 mg/kg, intramuscularly) (Ketalar; Parke Davis, Eczacibasi, Istanbul, Turkey) and xylazine hydrochloride (3 mg/kg, intramuscularly) (Rompun; Bayer AG, Leverkusen, Germany). For the operation procedure, rats were put into a supine position. Laparotomy was performed through a midline incision for each rat. Then, liver tissue samples and blood samples were taken from all rats. At the end of the process, all the rats were killed via exsanguination method.
Oxidant and antioxidant parameters
Blood samples were drawn into the tubes containing gel without anticoagulants and were centrifuged at 2000g for 15 min. Serum was divided into portions and kept in clean tubes.
Serum kept separately to carry out the GSH test was deproteinated. For this step, 5 g of metaphosphoric acid was dissolved in 50 mL of water and vortexed, after which 200 µL of serum was mixed with 200 µL of metaphosphoric acid solution. This preparation was kept at room temperature for 5 min and then centrifuged at 2000g for 4 min. The deproteinated and other serum portions were separated. Deproteinated portions were assayed with GSH, whereas other serum portions were used for oxidants and antioxidants assay. All the other serum portions were kept at −80°C until the test time.
The GSH test was performed with the commercial enzymatic assay method (Cayman Inc., Ann Arbor, Michigan, USA) using GSH reductase for the quantification of GSH. In this method, the sulfhydryl group of GSH reacted with 5,5′-dithio-bis-2-nitrobenzoic acid (DTNB) and produced a yellow 5-thio-2-nitrobenzoic acid (TNB). The rate of TNB production was directly proportional to the GSH concentration in the sample. Triethanolamine solution (4 M) of 10 µL was prepared on the day of assay was added to the 200-µL samples and then was vortexed. After the samples were diluted with MES (0.4 M 2-(N-morpholino) ethanesulphonic acid, 0.1 M phosphate, 2 mM EDTA, pH 6.0) buffer in a 1:3 proportion, the standards were prepared according to the directions of standard prospectus. To the wells, 50-µL standards or 50-µL samples were added, and the plate was covered with a cover that accompanies the kit. In this step, an assay mixture containing MES buffer (11.25 mL), GSH cofactor mixture (0.45 mL), GSH enzyme mixture (2.1 mL), water (2.3 mL) and GSH DTNB (0.45 mL) was prepared according to the directions of prospectus. Fresh assay mixture of 150 µL was placed in each well, and the plate was covered and incubated on an orbital shaker in the dark for 25 min. At the 25th minute, an assay was performed at 414 nm with a Bio-Rad 680 Microplate Reader (Bio-Rad Laboratories, Inc., USA).
A total oxidant status (TOS) assay was performed with the Rell Assay kits (Rell-Assay kits, Gaziantep, Turkey) developed by Erel (2005). In this assay method, oxidants present in the sample oxidized the ferrous ion to ferric ion. The ferric ion made a colored complex with chromogen in an acidic medium. The color intensity, which can be measured spectrophotometrically, was related to the total amount of oxidant molecules present in the sample. After the stabilized stock solution was diluted, it was deionized with water 40 times and 1000 µL of reagent-1 was mixed with 150 µL of standard or sample. First, the absorbance was read at 530 nm. Prochromogen solution of 50 µL was added and incubated at room temperature for 10 min. After this process, a second absorbance was read at 530 nm.
The following formulae were used for calculation


Standard value: 20 μmol hydrogen peroxide Equiv./L
Total antioxidant capacity (TAC) was based on the inhibition of 2,2′-azino-di-(3-ethylbenzthiazolin sulphonate) (ABTS) oxidation to ABTS by metmyoglobin, using the Cayman kit (Cayman Inc.). On assay day, samples were dissolved and diluted in 1:20 ratio with assay buffer. Resulted standards were prepared according to the prospectus. Trolox standard of 10 µL or samples of 10-µL were put into wells, and 10 µL metmyoglobin and 150 µL chromogen solutions were added. Without delay, 40-µL of 441-µM antioxidant assay hydrogen peroxide was added for the reaction to run. The plate was covered and incubated for 5 min on mixture. It was measured at 405 nm by using a Bio-Rad 680 Microplate Reader.
Biochemical and hematological analyses
Alanine aminotransferase (ALT) and aspartate aminotransferase (AST) were measured with an Abbott Architect C8000 (Abbott Diagnostics, Japan) clinical chemistry auto analyzer using a kinetic method.
Prothrombin time (PT) and international normalized ratio (INR) were assayed in a compact automatic coagulation analyzer, and complete blood count was performed with a CELL-DYN 3700 SL analyzer (Abbott Diagnostics, Chicago, Illinois, USA).
Histopathological evaluation
For histopathological evaluation, the liver tissues were dissected and fixed in Zenker solution for 24 h, dehydrated in ethanol series, cleared and embedded in paraffin. The paraffin sections were cut into 5-μm-thick slices and stained with hematoxylin and eosin for light microscopic evaluation. The sections were viewed and photographed using an Olympus light microscope (Olympus BX51, Olympus Optical Co. Ltd, Tokyo, Japan) with an attached photograph machine (Olympus E-330, Olympus Optical Co. Ltd, Tokyo, Japan). A total of 10 slides were prepared from each liver. All the sections were evaluated for the degree of portal inflammation, necrosis, vacuolar degeneration, sinusoidal dilatation and vascular congestion. Each liver slide was examined, and the severity of the changes observed was scored using a damage-rating scale of ‘none’ (−), ‘mild’ (+), ‘moderate’ (++) and ‘severe’ (+++). An experienced pathologist made the histopathological evaluation.
Statistical analysis
Whole measured information was uploaded and assessed with SPSS 15.0 software (SPSS Inc., Chicago, Illinois, USA). All the groups showed normal distribution, so parametric statistical methods were used to analyze the data. A one-way analysis of variance test was performed, and post hoc multiple comparisons were done with the Bonferroni method. The chi-square (Fisher’s exact) test was used to categorize the data analysis. The Spearman’s rho test was used for the correlation analysis. Results were presented as means ± SEM. A p < 0.05 was considered to be statistically significant.
Results
Oxidant and antioxidant parameters
The level of serum TOS was found to be significantly higher in group 2 (acetaminophen group) when compared with the other groups (p < 0.0001). The TOS level was markedly decreased in group 3 (erdosteine treatment group) and group 4 (NAC treatment group), but no significant differences were noted between these groups. The levels of GSH and TAC were significantly lower in group 2 when compared with other groups (Table 1). There were no significant differences in TAC levels in groups 3 or 4, and these levels were similar in both the groups. However, although significant differences in the GSH levels were not detected between groups 3 and 4, the GSH level in group 4 was found to be increased (p < 0.77) when compared with group 3.
Results of biochemical and hematological analyses.
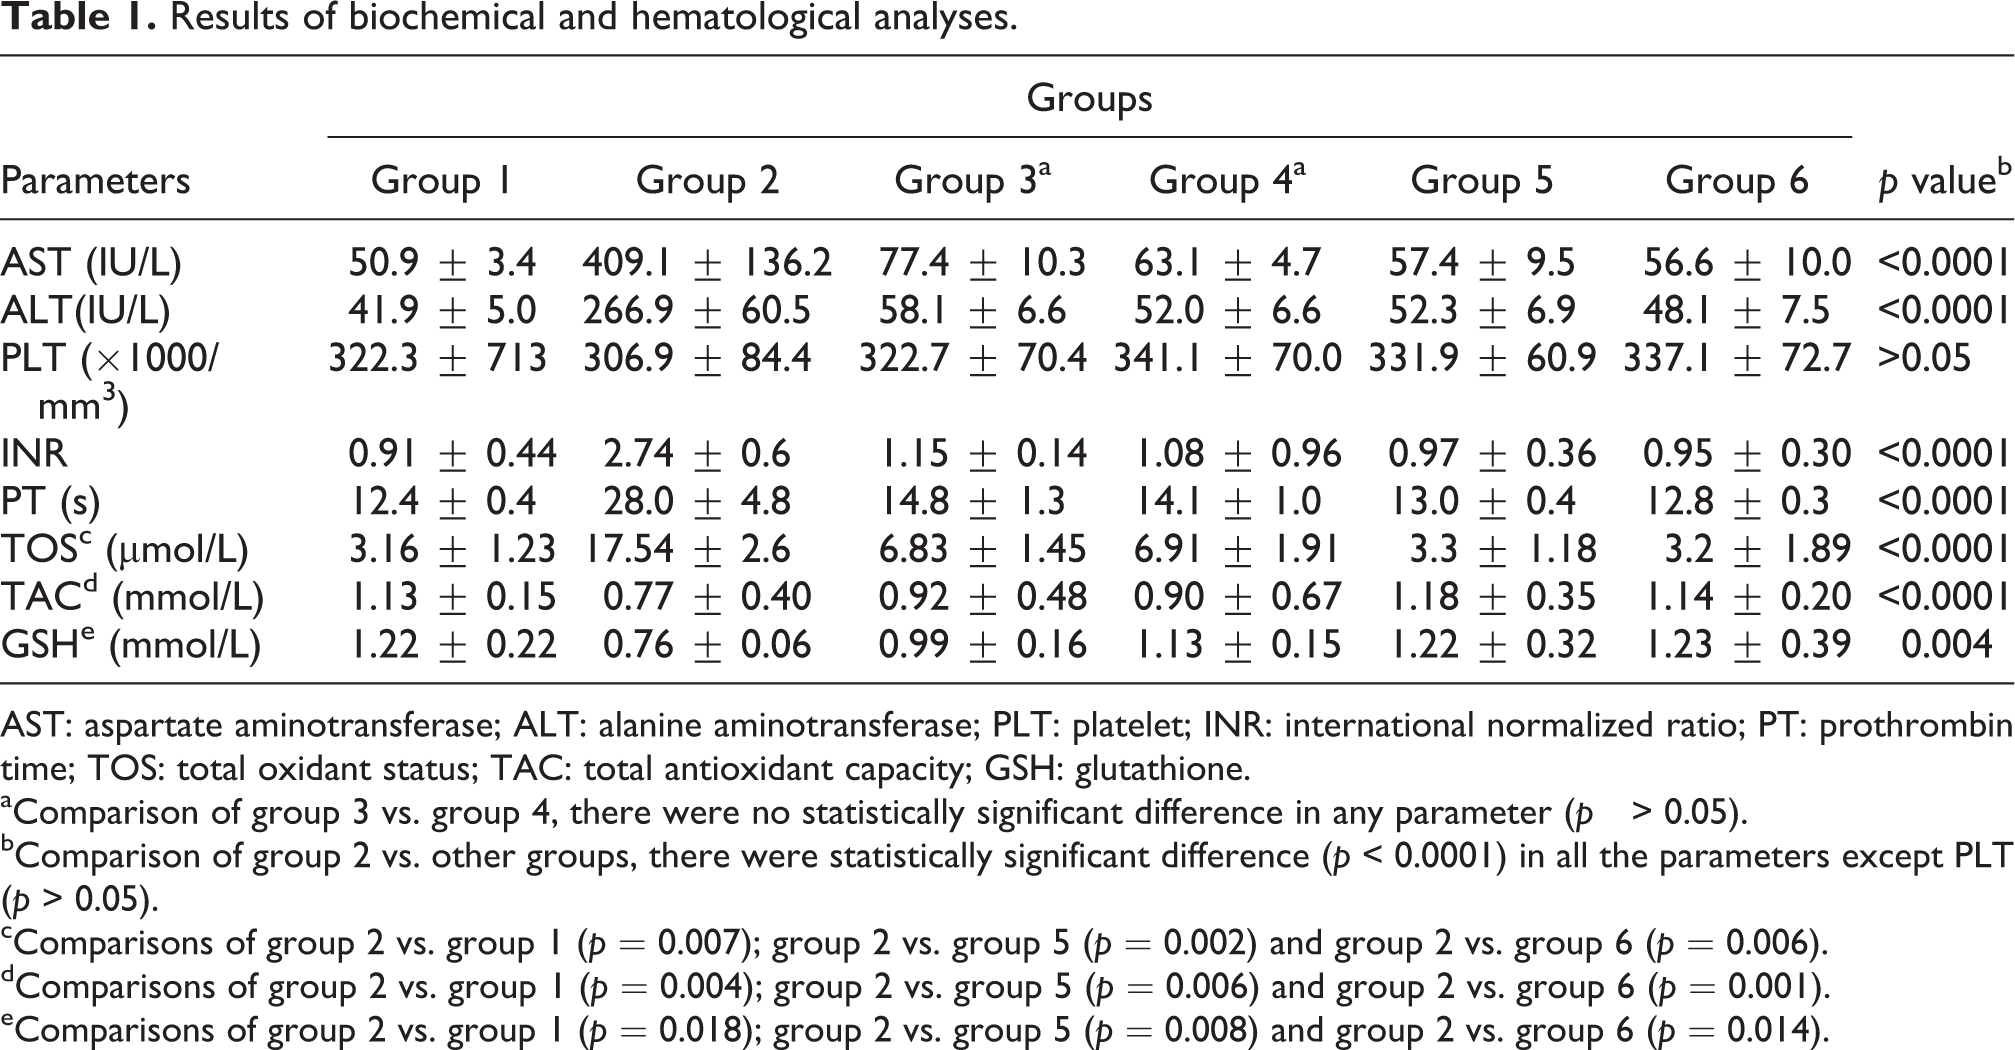
AST: aspartate aminotransferase; ALT: alanine aminotransferase; PLT: platelet; INR: international normalized ratio; PT: prothrombin time; TOS: total oxidant status; TAC: total antioxidant capacity; GSH: glutathione.
aComparison of group 3 vs. group 4, there were no statistically significant difference in any parameter (p > 0.05).
bComparison of group 2 vs. other groups, there were statistically significant difference (p < 0.0001) in all the parameters except PLT (p > 0.05).
cComparisons of group 2 vs. group 1 (p = 0.007); group 2 vs. group 5 (p = 0.002) and group 2 vs. group 6 (p = 0.006).
dComparisons of group 2 vs. group 1 (p = 0.004); group 2 vs. group 5 (p = 0.006) and group 2 vs. group 6 (p = 0.001).
eComparisons of group 2 vs. group 1 (p = 0.018); group 2 vs. group 5 (p = 0.008) and group 2 vs. group 6 (p = 0.014).
Serum AST, ALT and platelet levels
Levels of serum AST and ALT along with INR and PT values were found to be significantly higher and longer, respectively, in group 2 compared with other groups (p < 0.0001; Table 1), but they were significantly decreased in groups 3 and 4 (p < 0.0001). However, significant differences between groups 3 and 4 were not detected (p > 0.05). Besides being statistically nonsignificant, the levels of ALT and AST from group 4 were closer to those from group 1 when compared with such levels from group 3. No significant differences were observed for platelet levels among the groups.
Histopathological findings
On histopathological evaluation of the liver with a light microscope, morphological changes such as portal inflammation, necrosis, vacuolar degeneration, sinusoidal dilatation and vascular congestion were observed in group 2 compared with group 1 (Figure 1(a) and (b) and Table 2). Although portal inflammation, necrosis, vacuolar degeneration, sinusoidal dilatation and vascular congestion were observed in group 3, those morphological changes were significantly declined when compared with group 2 (p < 0.0001; Figure 1(c)). In group 4, mild vacuolar degeneration and vascular congestion were observed, and cellular injury was scant and almost similar with group 1 (Figure 1(d)). Hepatocytes in group 4 displayed better morphological changes when compared with group 2 (p < 0.0001). Group 5 (NAC control group) and group 6 (erdosteine control group) displayed well-defined hepatocytes and parenchymal morphology (Figure 1(e) and (f)).
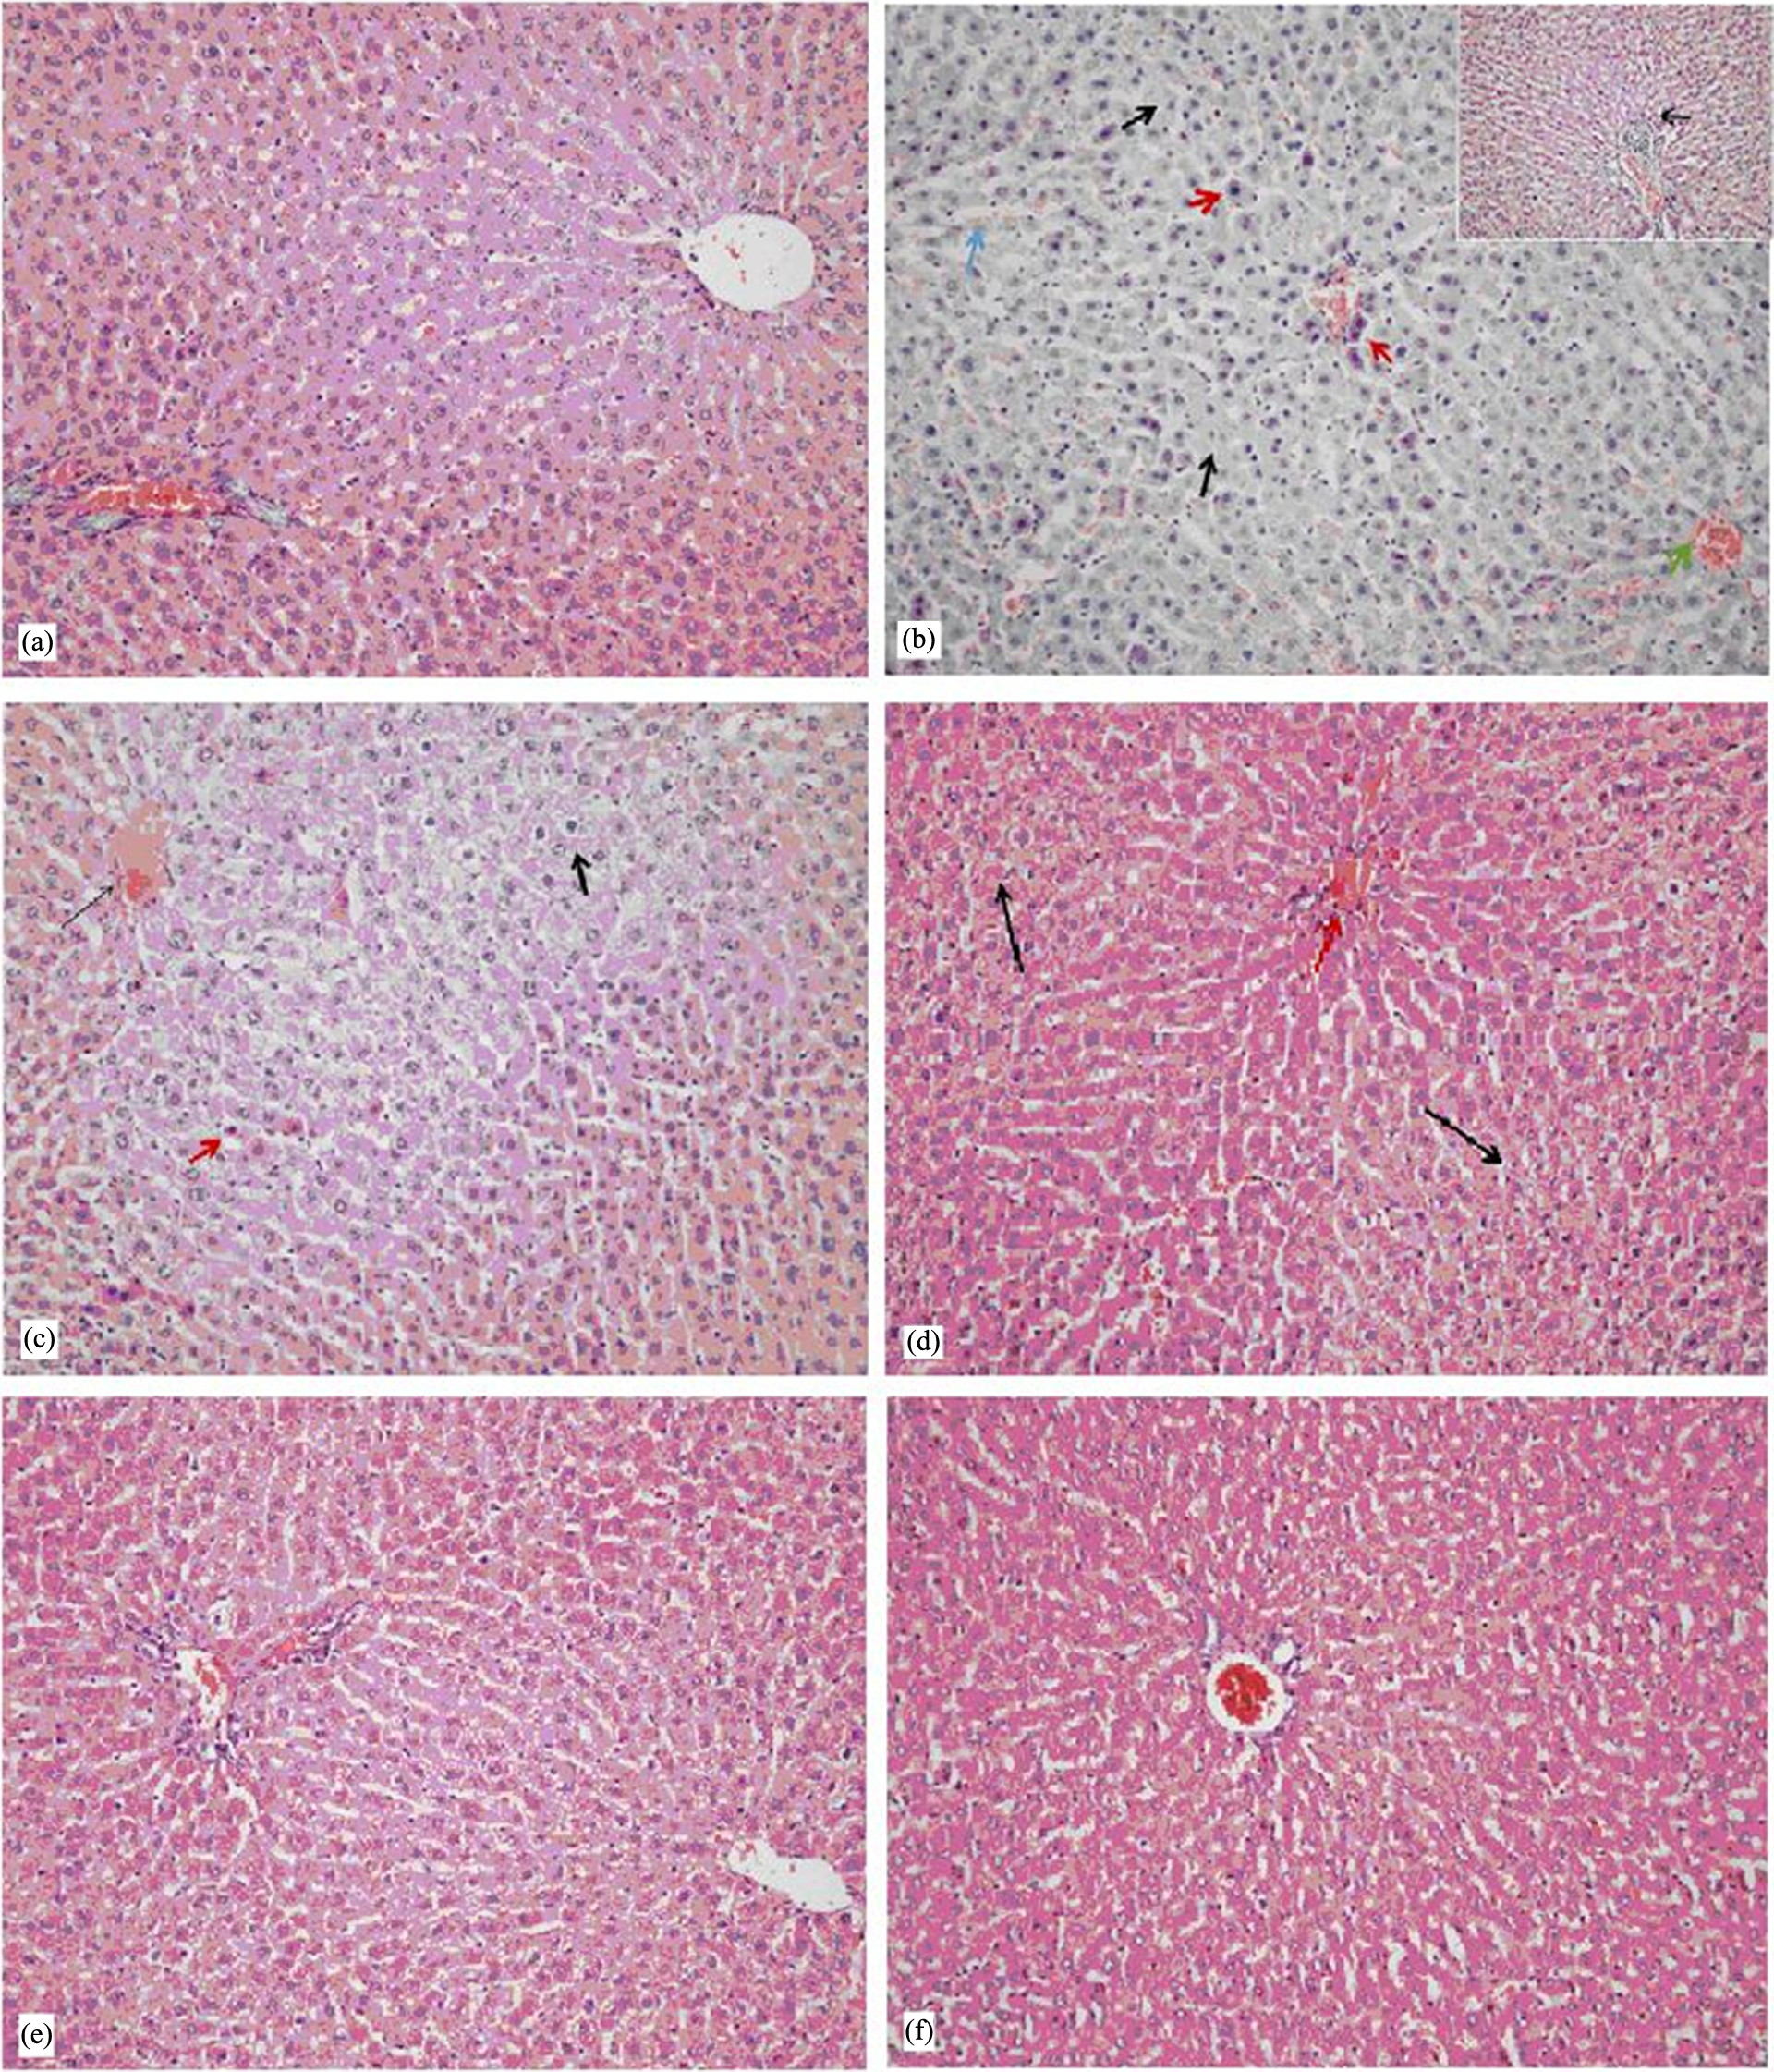
Histopathological appearance in hepatocytes. (a) Group 1: Normal histopathological appearance in hepatocytes and zone 3 area (HE: ×200). (b) Group 2: Vacuolar degeneration in hepatocytes (bold black arrow), zone 3 area and focal necrosis in liver parenchyma (red arrow). Mild inflammation in portal area (thin black arrow), sinusoidal dilatation (blue arrow) and vascular congestion (green arrow) (HE: ×400–×200). (c) Group 3: Vacuolar degeneration in hepatocytes (bold black arrow), focal necrosis in hepatocytes (red arrow) and vascular congestion (thin black arrow) (HE: ×200). (d) Group 4: Mild vacuolar degeneration (black arrow) and vascular congestion (red arrow) (HE: ×400). (e) and (f) Groups 5 and 6: Normal histopathological appearance in hepatocytes in zone 3 and portal area (HE: ×200). HE: hematoxylin and eosin.
Results of histopathological examination.
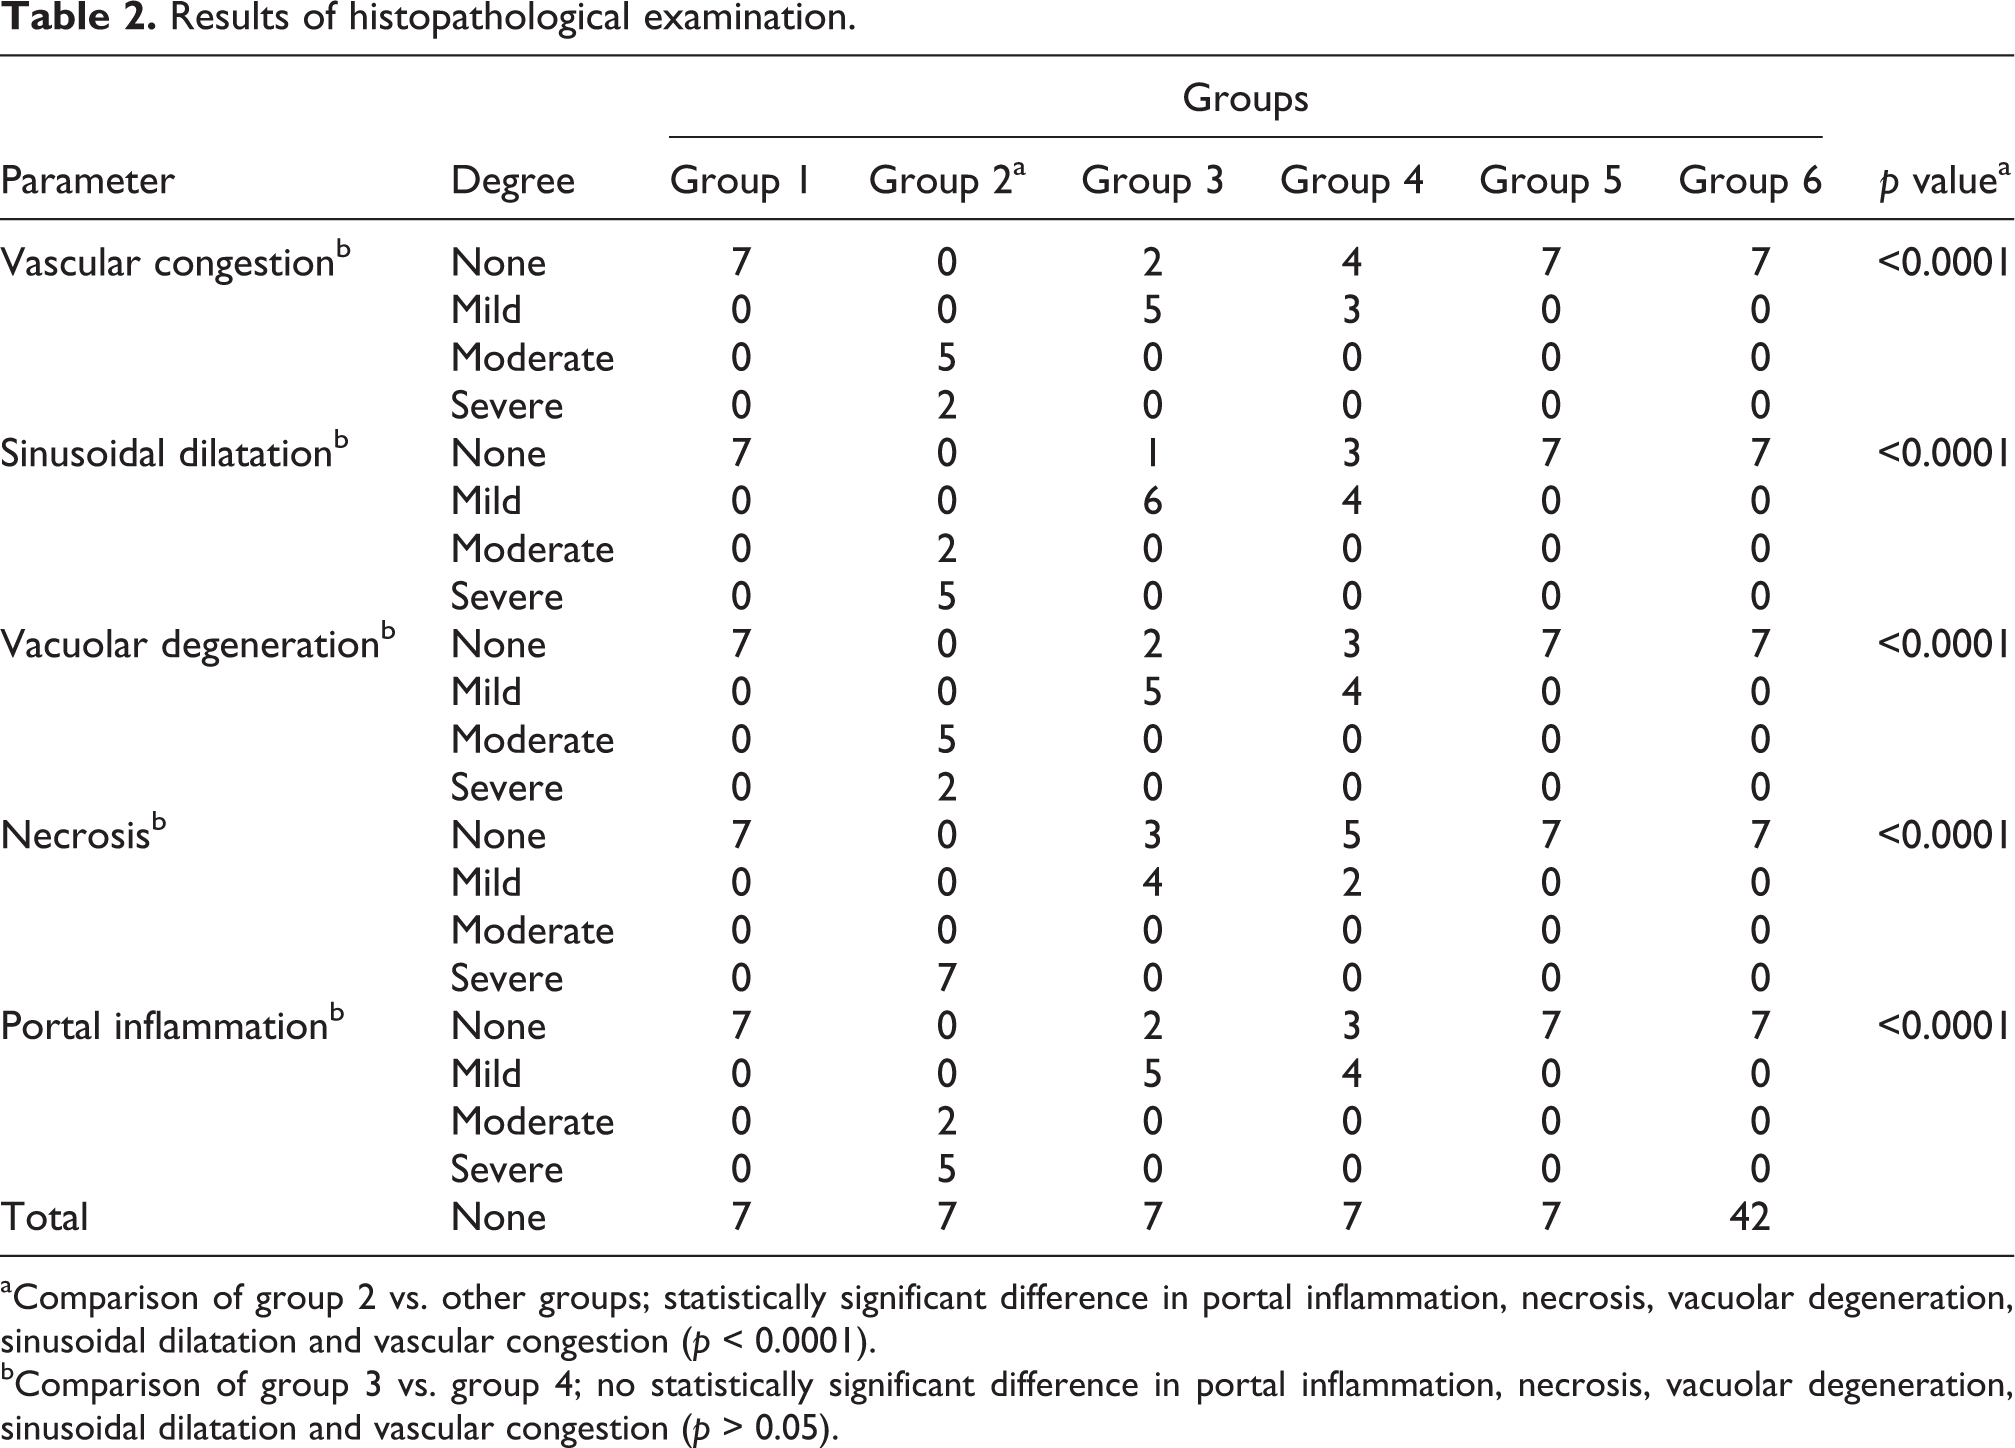
aComparison of group 2 vs. other groups; statistically significant difference in portal inflammation, necrosis, vacuolar degeneration, sinusoidal dilatation and vascular congestion (p < 0.0001).
bComparison of group 3 vs. group 4; no statistically significant difference in portal inflammation, necrosis, vacuolar degeneration, sinusoidal dilatation and vascular congestion (p > 0.05).
Discussion
NAC is a precursor for cysteine and is the most common agent used in the prevention of liver damage in patients who have ingested a potentially toxic dose of acetaminophen (Isik et al., 2006; Rumack, 2002; Yagmurca et al., 2007). NAC prevents NAPQI from early binding to hepatic macromolecules, but it is suggested that NAC decreases neutrophil infiltration and increases microcirculation and oxygen transportation to tissues, thus removing acetaminophen from tissues (Hung and Nelson, 2004). NAC has been tried in the treatment of various liver injuries because of its known antioxidant properties (Baniasadi et al., 2010; Cetinkaya et al., 2006; Ji et al., 2009; Zwingmann and Bilodeau, 2006). Initially, it is given either orally or intravenously at a dose of 70 mg/kg per 4 h for 17 times, following its loading dose of 10 mg/kg (Dienstag, 2008; Hung and Nelson, 2004).
Erdosteine, like NAC, is a mucolytic and antioxidant drug. It contains two blocked thiol groups (Isik et al., 2006; Koc et al., 2005; Kuvandik et al., 2008; Moretti and Marchioni, 2007). Erdosteine probably protects from acetaminophen-induced hepatotoxicity by preventing free-radical–damaging cascades and oxidant-radical release and through its prevention of proinflammatory processes (Dechant and Noble, 1996; Fadillioglu et al., 2003; Gazzani et al., 1989). Several studies have addressed the antioxidant effects of erdosteine (Fadillioglu et al., 2003; Gazzani et al., 1989; Sogut et al., 2004; Terzi et al., 2004). In different animal experiments, erdosteine was studied in different doses (Isik et al., 2006; Kuvandik et al., 2008; Selcoki et al., 2007).
In the literature, the only study that has addressed the usage of erdosteine in the prevention of acetaminophen-induced liver damage is an animal experimental study conducted by Kuvandik et al. (2008). A literature search did not reveal any study that has compared the efficacy between NAC and erdosteine in the decrease of acetaminophen-induced liver damage. Several animal studies and case reports have addressed liver toxicity due to a high dose of acetaminophen (Kuvandik et al., 2008; Newsome et al., 2010).
Reactive oxygen and nitrogen species play an important role in the development of acetaminophen-induced hepatotoxicity (James et al., 2003; Michael et al., 1999; Nakae et al., 1990). The initial step of this toxicity is the cytochrome P450 enzymes’ metabolism of acetaminophen to the reactive intermediate NAPQI (Dahlin et al., 1984). When the source of hepatic GSH falls under 30%, NAPQI begins to bind to hepatic macromolecules. Liver damage then develops and eventually leads to hepatic necrosis. Injured hepatocytes secrete liver enzymes such as AST and ALT into circulation. The measurement of liver enzymes is a reliable indicator for clinical status of the patient (Blakely and McDonald, 1995; Hung and Nelson, 2004). In our study, the increase in the levels of AST and ALT and the INR and the development of centrilobular necrosis upon histopathological evaluation after toxic acetaminophen administration were the indicators of liver damage.
Several studies have demonstrated that acetaminophen may induce oxidative injury, including tissue lipid peroxidation, enzyme inactivation, changes in the nonenzymatic and enzymatic antioxidant defense system of cells as well as changes in GSH status (Hung and Nelson, 2004; Isik et al., 2006; Kuvandik et al., 2008; Mladenović et al., 2009). GSH is an important protective molecule and its sulfhydryl part conjugates with electrophilic and highly reactive NAPQI to be detoxified. In the event of overdose of a toxic substance, GSH is depleted and detoxification is limited (Geiger and Howard, 2007; Josephy, 2005).
Because of its antioxidant properties, NAC has been suggested to decrease liver damage by reducing reactive metabolites that have been raised due to the overdose of acetaminophen, although these metabolites’ actions are not clearly known in acetaminophen intoxication. Moreover, it is known that NAC restores the GSH source (Hung and Nelson, 2004; Kandis et al., 2011; Mladenović et al., 2009).
In the present study, the GSH level declined significantly in group 2 but was increased in group 4. This indicated that NAC had a positive effect on the GSH level. When compared with group 2, the restoration of the GSH level in group 3 demonstrated that the source of GSH was less used because of the antioxidant effect of erdosteine.
Several studies have demonstrated that antioxidant parameters were reduced and oxidant parameters were increased after oxidative injury from acetaminophen intoxication (Isik et al., 2006; Kuvandik et al., 2008; Mladenović et al., 2009). In our study, the TOS level was significantly increased, but the TAC level was decreased in group 2 when compared with group 1, which indicated oxidative injury. The increase in the TAC level and the decrease in the TOS level in groups 3 and 4 indicated that erdosteine and NAC increase antioxidants but decrease oxidant capacity.
Acetaminophen-induced liver damage increases the levels of liver enzymes such as AST and ALT. Also, an elevation in bilirubin and INR levels can be seen in addition to metabolic acidosis, coagulopathy, jaundice, renal insufficiency, hepatic encephalopathy, myocardial pathology and coma. In our study, a marked increase in AST, ALT and INR levels in group 2 compared with group 1 demonstrated a significant correlation to liver damage. The decline in AST, ALT and INR levels in groups 3 and 4 in contrast to group 2 was an important indicator that erdosteine and NAC were effective in treating acetaminophen-induced hepatotoxicity. Besides no significant difference has been noted between groups 3 and 4, it was noteworthy that the levels of ALT, AST and INR were similar to those in group 1. However, no changes in the number of platelets among groups were considered because platelet numbers were not influenced in the early period.
In the study by Kuvandik et al. (2008) in rats with acetaminophen-induced liver damage, they used 150 and 300 mg/kg of erdosteine in the treatment and demonstrated that the liver status improved to a similar degree at both the doses. In our study, a dosage of 150 mg/kg of erdosteine led to a decrease in liver damage.
Studies have also reported that acetaminophen causes liver damage characterized by hemorrhagic centrilobular necrosis in both people and animals (Isik et al., 2006; Kuvandik et al., 2008; Valentovic et al., 2004). In the event of an acetaminophen overdose, hepatic GSH falls under 30%. Then, NAPQI starts binding to other hepatocytes, and the hepatic necrosis eventually develops. In the hepatic lobule, cytochrome P450 enzymes are usually found in hepatocytes around the hepatic vein and also in small amounts in hepatocytes around the portal vein (Kuvandik et al., 2008; Valentovic et al., 2004). Therefore, acetaminophen-induced liver damage displays characteristic centrilobular necrosis. Our results were consistent with those from studies that have reported the development of characteristic centrilobular necrosis in liver damage after administering 1 mg/kg of acetaminophen (Bauer et al., 2000; Kuvandik et al., 2008).
In our study, portal inflammation, necrosis, vacuolar degeneration, sinusoidal dilatation and vascular congestion were more marked in group 2. Also, centrilobular necrosis caused cytoplasmic changes and sinusoidal narrowing around the central vein. Marked inflammation in group 2 could be a result of chemotactic factors secreted from hepatocytes (Kuvandik et al., 2008). In addition, fewer microscopic changes were observed in groups 3 and 4 when compared with group 2. Erdosteine and NAC significantly suppressed the inflammatory response due to acetaminophen. Notwithstanding, portal inflammation, necrosis, vacuolar degeneration, sinusoidal dilatation and vascular congestion in group 4 were more similar to group 1. No significant differences were observed between groups 3 and 4 in the prevention of liver damage. However, treatment with NAC is still first-line therapy because there are several similarities with group 1 regarding biochemical parameters and histopathological findings.
The limitations of our study include (1) it reflects results of short-term duration, such as 3 days of investigation, and (2) it lacks results of long-term follow-up.
In conclusion, the present study demonstrated that, in the prevention of liver damage induced by acetaminophen intoxication, early treatment with a single dose of erdosteine was beneficial instead of NAC administration. Because of the usefulness of erdosteine and its consistency among patients, we consider it an alternative treatment in liver damage. However, as previously mentioned, our study did not cover data for long-term treatment. Therefore, further investigations regarding those subjects are needed.
Footnotes
Funding
The authors thank the Emergency Physicians Association of Turkey for the financial support and its valued contribution.