
Abstract
The manufacturing processes in chip industries are complex, and many kinds of raw materials and solvents of different nature are used, most of which are highly toxic and dangerous. During the machine preventive maintenance period, these toxic and harmful substances will escape from the sealed reaction chamber to the clean workshop environment and endanger the health of the workers on-site, resulting in occupational diseases. From the perspective of prevention, the spread and prediction of hydrochloric acid (HCl) that escaped from the metal-etching chamber during maintenance were studied in this article. The computational fluid dynamics technology was used for a three-dimensional numerical simulation of the indoor air velocity field and the HCl concentration field, and the simulation results were then compared with the on-site monitoring data to verify the correctness and feasibility. The occupational hazards and control measures were analyzed based on the numerical simulation, and the optimal control measure was obtained. In this article, using the method of ambient air to analyze the occupational exposure can provide a new idea to the field of occupational health research in the integrated circuit industry and had theoretical and practical significance.
Keywords
Introduction
The semiconductor manufacturing industries are considered to be basic industries in China and have a major impact on the long-term development of the national defense building and the whole national economy. According to the statistics, during the period of 2001–2007, the integrated circuit (IC) industry in China had increased nearly sixfold reaching 125.13 billion yuan in 2007, and the average annual compound growth rate was 33.2%. In addition, a number of IC chip production lines were under construction or up to the production process. At the same time, it is essential to note that the production processes in the IC industries are complex, and many kinds of chemical substances are used, involving more than 300 different types of raw materials and solvents, most of which are highly toxic and high-risk substances, particularly the major component of the IC industry chip manufactures. These chemicals will escape because of an accident or during the regular maintenance into the atmosphere or the clean room , thus causing a number of health, safety and environmental problems (Jiang, 2007; Polakoff, 1989; Standley, 2006).
The frequency of inevitable escape is very high, and these harmful substances are not only one of the major killers of good products but can also pose potential threats to the workers’ health and cause occupational diseases easily (Mikulsky, 1996). In order to take preventive measures, it is particularly important to fundamentally grasp the dissipation process of the occupational toxic and harmful substances, quantitatively describe the concentration distribution characteristics and the diffusion rules of the contaminations in the clean room, discuss the effectiveness of the occupational hazard prevention and control measures, thus to ultimately eliminate and reduce the occupational health risks.
Although the semiconductor industry has been coming up for more than 50 years, the study of occupational health problems in the clean room is in infancy. The main methods to resolve the occupational health problems occurring in the semiconductor industry can be categorized as following.
Epidemiological investigation
For example, in 1997, the U.S. Labor Bureau of Statistics Department investigated the occupational disease in individuals from different professions. The University of Johns Hopkins and Schenker researched and investigated the high rate of spontaneous abortion reported among female employees in the IC industry and found a dose–response relationship with the doses of photo resist and contrast medium. In the semiconductor industry, a variety of respiratory toxic chemicals such as AsH3, PH3, B2H6, strong acid, strong alkali and so on were used widely (Beaumont et al., 1995). Through a questionnaire survey, McCurdy et al. (1995) found that the respiratory symptoms and persistent asthma among the workers in the manufacturing plants were significantly higher than that in the nonmanufacturing plants.
Investigation and monitoring of occupational hazard factors
Frist (1996) conducted certain relevant studies on the exposure characteristics of the semiconductor manufacturing machines. Williams and Baldwin (1994) wrote the semiconductor industry health handbook including monitoring, ventilation, equipment and human factors engineering. Baldwin researched aluminum tetrachloride plasma etching and found that the hydrochloric acid (HCl; maximum 0.47 ppm), hydrogen cyanide (maximum 0.91 ppm), cyanogen chloride (maximum 0.5 ppm) and other toxic gases generated during the maintenance and cleaning of the reaction chamber will escape into the clean areas, resulting in high-risk exposure among the on-site operating staff (Baldwin et al., 1993; Gu, 2003).
Numerical simulation
The computational fluid dynamics (CFD) model is more applicable for mechanical ventilation in the clean room (Zhao et al., 2001). In addition, the CFD method is of low cost with high speed and high degree of reproduction of the actual scene. It has been adopted by a growing number of scholars. P.V. Niels, a Danish scholar, first applied the CFD techniques to calculate the indoor airflow in 1974. In mid- and late-1990s, the researchers extend study objects from indoor single airflow to indoor pollutants and began using CFD technology to forecast the impact of indoor airflows on pollutants’ diffusion. Fan (1995) used the
In the Taiwan region of China, there was a rise in the chip-making industries in the late 1990s, and there were many research reports on the on-site person exposed to the hazardous chemicals during the maintenance and prevention processes of machines in chips manufacturing. For example, Zhang (1998) studied the local exhaust systems for the semiconductor industry. Zhang and You(1999) investigated the chemical hazards during the prevention and maintenance of the chemical vapor deposition process in chips plants. Gu (2003) discussed the dissipation control of the pollutants generated during the metal-etching machine prevention and maintenance processes in chips factory.
In the Mainland China, the research of occupational health in semiconductor industry started relatively later. On the one hand, some used survey or on-site method or a combination of both methods to test the concentration of harmful substances. For example, Gao et al. (2003) discussed the occupational hazardous factors and the incident types in production processes and proposed control measures. Jia and Gao (2004) analyzed and detected the types and intensity of exposure to occupational hazards in microelectronics manufacturing industries. Most studies were only put forward qualitative description of the occupational hazards impact. However, more effects should be taken in the determination of the concentration distribution, concentration changes of different ventilation modes as well as the impact of the concentration changes to operating persons at different locations. On the other hand, some studied the indoor airflow patterns. For example, Tsinghua University, Tongji University, Harbin University of Architecture and so on used CFD software to research optimization of airflow in the clean room. Tongji University and Tianjin University carried out many experimental studies on clean room airflow. These studies focused on the guidance of engineering design rather than solving the actual situation of occupational health problems. Besides, some studied the diffusion impact of indoor air pollutants. For example, Huang (2008) analyzed the concentration of volatile organic compounds in a laboratory field. Wang (2007) simulated the diffusion process of the gas leakage inside the house and analyzed the influencing factors.
Through the analysis of the international and domestic studies, it can be drawn out that the numerical simulation method has incomparable advantages for the occupational health research. At present, it is mainly used in simulating the air distribution patterns in order to improve the design of the clean room or to study the influence of the flow field on pollutants’ distribution, rather than the point source distribution problems of the toxic and hazardous substances in the existing clean room for occupational health.
Therefore, from the perspective of prevention, the spread and prediction of HCl escaped from the metal-etching chamber during maintenance was studied in this article. First, according to CFD basic theory, FLUENT 6.2 software was used for a three-dimensional (3D) numerical simulation of the indoor air velocity field and the HCl concentration field. Second, on-site monitoring was conducted, and the measured data were then compared with the numerical results in order to verify the correctness and feasibility of the CFD technology. Third, according to the numerical data, the occupational hazards caused by the HCl leakage were analyzed, the potential pollution hot spot was divided into three parts. Finally, in the foundation of discussing the advantages and disadvantages of typical controlling measures, the optimal measure was determined, the effect and efficiency of the measure were evaluated qualitatively and quantitatively to get the basic prevention and controlling measures.
Clean room description in the semiconductor manufacturing plant
Construction and air supply mode of the clean room
The clean room used in this study had a vertical unidirectional flow blowing the whole roof, full-floor grille return air system, obtaining a uniform unidirectional flow, so that the harmful substances can have the shortest path to discharge along the flow line (trace). Thus, it had strong self-purification ability and can achieve the highest level of cleanliness. Not only the process equipment can be laid out arbitrarily but also the physical purification facilities can be simplified (Bailar et al., 2002; Jiang and Liu, 2007; Mikulsky, 1996; Shen, 2001).
As (Figure 1) about 90% of the fresh air entered the air-conditioned upper layer, the air was sent to the clean room through the fan filter unit by static pressure, the clean air flowed vertically to remove the pollutants generated indoor. Then the air reached the second clean layer (sub-FAB (fabrication plant)) through the grid floor, after getting filtered by the ultra-low penetration air (ULPA) filters, and it came back to the recirculation air unit through the return air zone and mixed with 10% new clean outdoor air (make-up air) and then the air came into the air-conditioned layer again. The ULPA filters can only filter solid particulates but cannot filter hundreds of different gaseous pollutants or chemicals leaked into the clean room for any reason, so the clean room operating staff will have a long-term exposure to low-concentration pollutants.
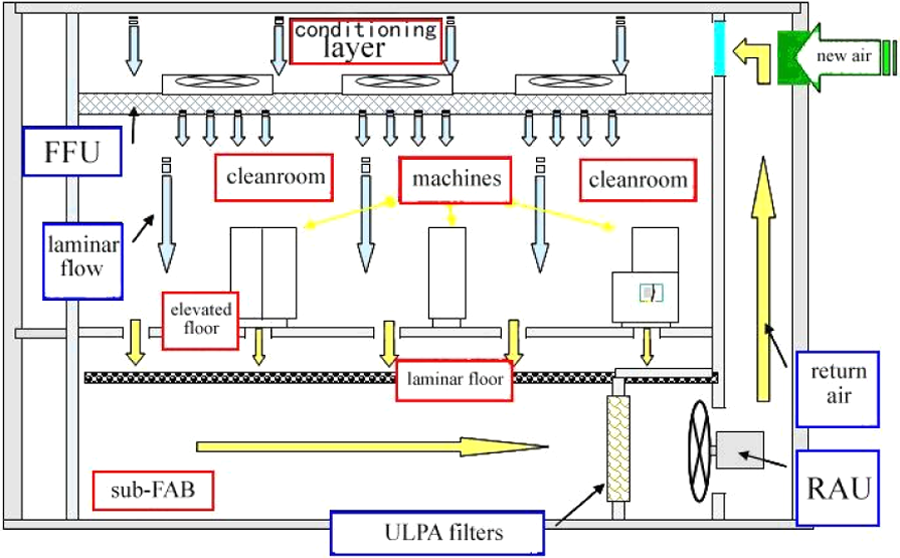
Ventilation profile of the clean room.
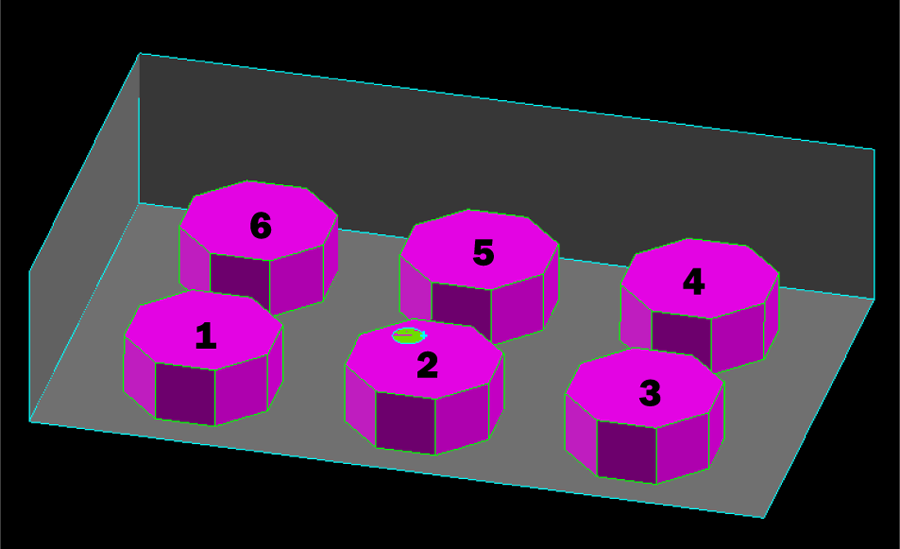
Clean room layout
The clean rooms were extremely crowded although clean and tidy; the planar structure and production machine layout of the clean room can be seen in Figure 2. When harmful substances escaped from one machine during the maintenance time, it may result in the maintenance staff and the surrounding personnel exposed to hazards higher than the occupational exposure limit and generated a certain degree of occupational heath risks.
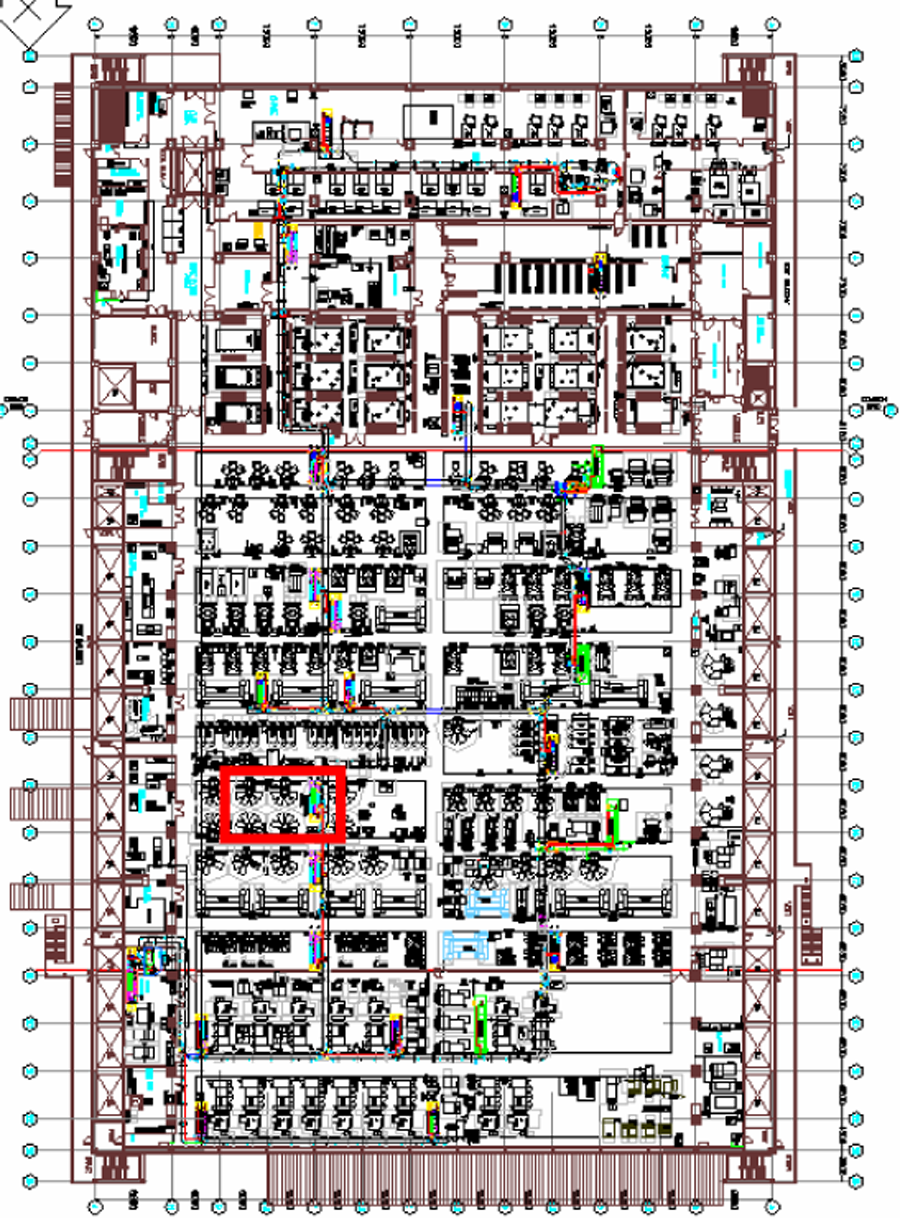
Cleanroom layout.
Simulation object selection
When the reaction chamber was opened regularly during the regular maintenance, especially after the working time of radio frequency reached 200 ± 10 h, then the harmful substances would escape into the environment regularly. So the research of the surrounding workers’ health impact in this process is particularly important (Schenker, 1992).
The maintenance operating procedures involved one or two maintenance staff standing before the reaction chamber and opening the chamber lid, then removing the chamber body parts step by step and use isopropyl alcohol, de-ionized water or H2O2 to clean the internal chamber. The maintenance process for each chamber takes about 1.5–2.0 h. When the cleaning process is complete, the cleaned parts are sequentially loaded back. The location of the maintenance staff can be seen in Figure 3.
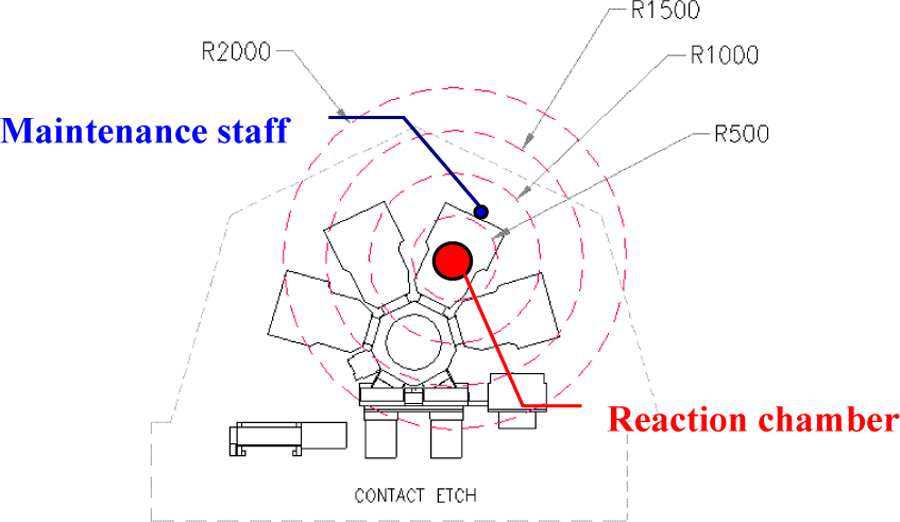
Relative position top view of personnel and machine during maintenance.
When the chamber is open, the hazardous substances restricted in the reaction chamber will be dissipated out. These substances are mainly aluminum chloride, HCl and hydrolysis reaction products, some gases or gas resultants, such as boron trifluoride, boron trichloride, silicon tetrafluoride, can easily react with the water vapor and generate hydrogen fluoride or HCl. According to the statistical analysis of the actual monitoring in the chip factory, the HCl concentration in the dissipated gases was relatively high, thus the HCl was selected as the simulation object to discuss its diffusion process in the clean room.
Numerical simulation of HCl dissipation in clean room
Mathematical model description
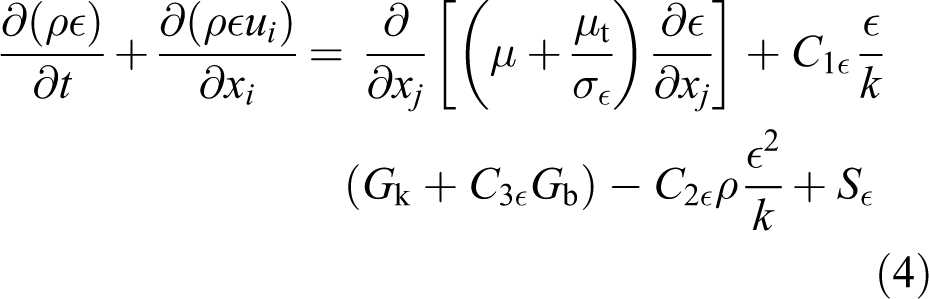
As the standard
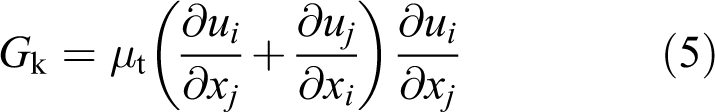
Based on the equation of the turbulent kinetic energy
The turbulent viscosity
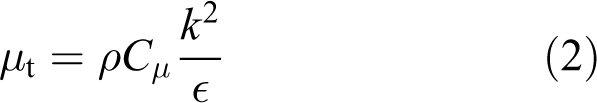
where
In the standard
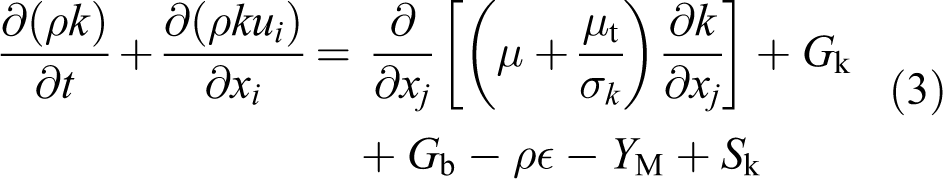
where
The calculating formula of
The calculating formula of
where

where
In the standard

For the
The standard
Physical model construction and simplifying assumptions
Physical model construction
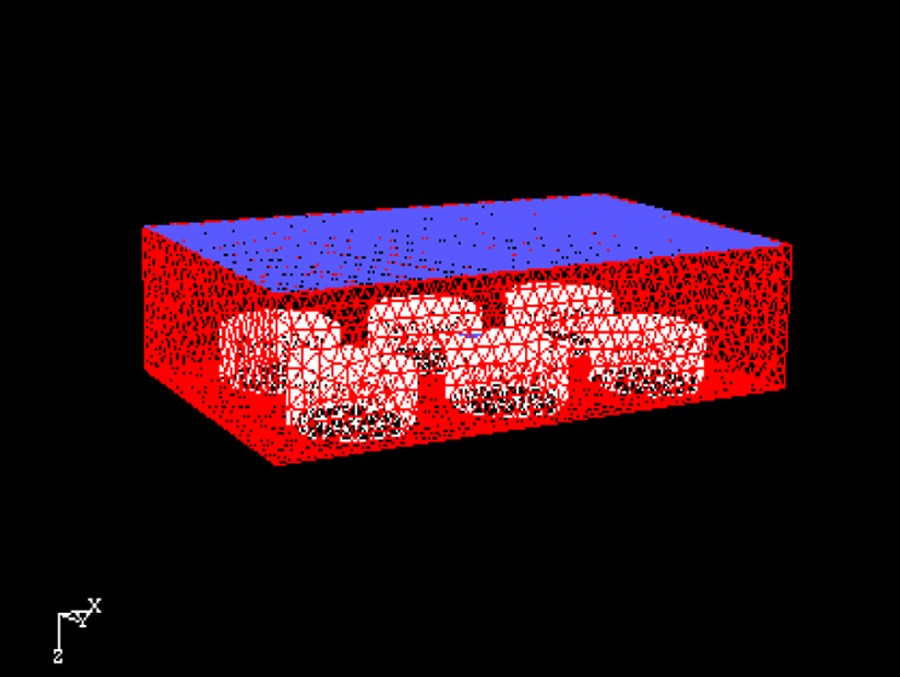
A chip manufacturing clean room was selected as an example. The metal-etching area where the harmful substances escaped (the area with a red border in Figure 2) was selected as original geometric objects to simplify and set boundary conditions, the physical model established can be seen in Figure 4.
The physical model established.
In a region size of 17 m × 10 m × 4 m, six metal-etching machines were symmetrically arranged at north and south sides, and their serial number was 1, 2, …, 6. The machines were simplified as cylinders with circumcircle diameter of 3.6 m, height of 1.5 m. The size of the air outlet was equal to that of the roof and underside of the computational domain, that is, 17 m × 10 m. The HCl released from the opening in the upper right corner of the chamber which was part of the middle machine at the south side was regarded as a leakage source (parameters of HCl as shown in Table 1). The diameter of the source was 0.7 m, and the direction was perpendicular to the ground upward.
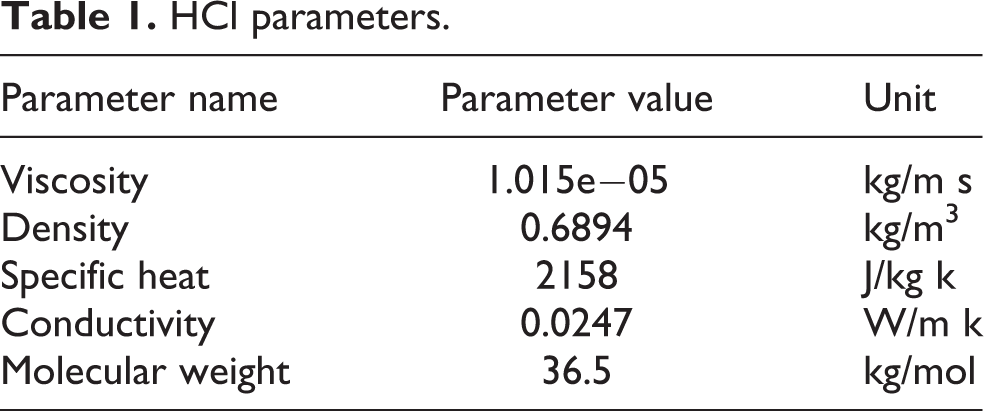
HCl parameters.
Simplified assumptions of physical model
In this article, the following simplifications and assumptions were made prior to the simulation: (1) the object studied was low-speed (v ≤ 300 ft/s) fluid, the airflow inside the clean room can be considered incompressible, the role of quality strength was considered, the flow field and pressure field were regarded as 3D steady state; (2) the temperature field was considered with a constant temperature of 20°C; (3) since high-power electrical equipments were not involved in the simulation process, the calculation domain can be assumed with no inner heat source and the walls of the machine were adiabatic; (4) the operating staff were cleaning the body cavity wall during the preventive maintenance, which took about 1.5–2 h, so the dissipation of pollutants can be regarded as a continuous leakage at a constant rate of 0.04 m/s; (5) the background value of HCl in the calculation region was 0.
Boundary conditions
Inlet boundary conditions. Two inlets were set up in the calculation domain in this study, one was the mass flow inlet of HCl leak and the inlet velocity was 0.04 m/s, and the other was the velocity inlet and the inlet wind speed was always 0.5 m/s, the temperature was 293 K for both inlets.
Outlet boundary conditions. The surface outflow was considered extrapolating from the inside region and had no effect on the upstream flow. The ground and the surrounding walls were set as outlets with free outflow. Others were set as walls.
Grid generation and convergence judgments
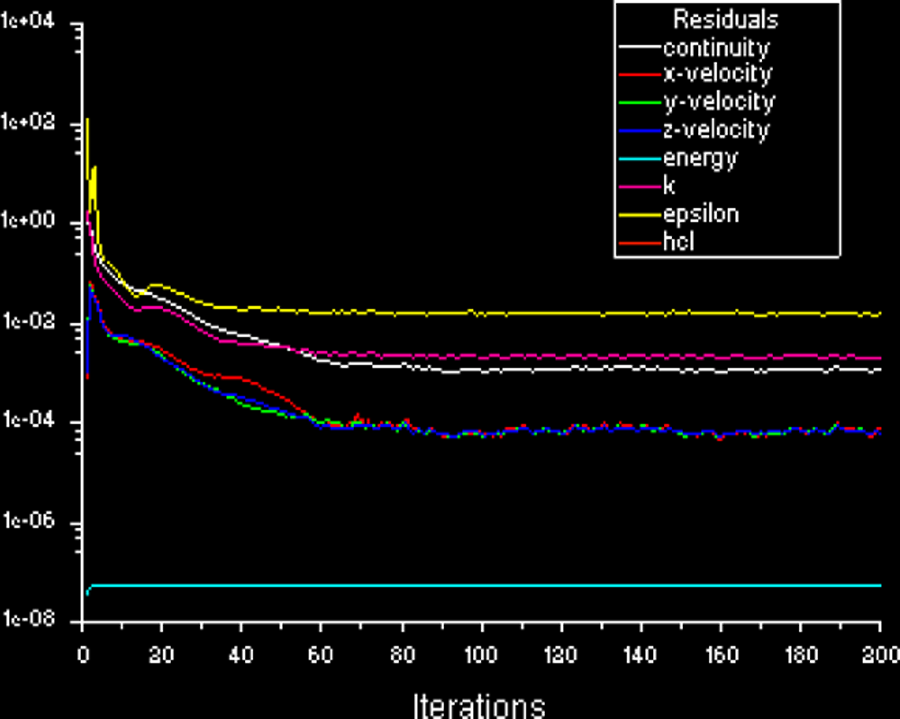
Grid generation. The tet/hybird-type grid was selected for the spatial discretization, and the grid spacing was 0.5, the results of the grid generation were shown in Figure 5. Distribution assumptions and convergence judgments of dependent variables: Distribution assumptions of dependent variables. Different distribution assumptions were used for different dependent variables in this article. According to different calculation circumstances, first-order or second-order upwind scheme was adopted in order to ensure the accuracy and stability of the calculation results. Convergent conditions. Combined with the assumed initial speed Convergence conditions included the relative error of the flow equation of 0.001 (such as the convergence criteria of the speed) and the relative error of the energy equation of 1 × 10⁻⁶. The convergence process is presented in Figure 6, and as shown in the figure, the convergence results were quite well.
Grid generation results of the calculation region.
Convergence process map.
Wind field initialization
The wind speed was set at 0.5 m/s, and the quality inlet of HCl was changed into wall temporarily. The standard
Numerical simulation results and discussions
Flow velocity field analysis
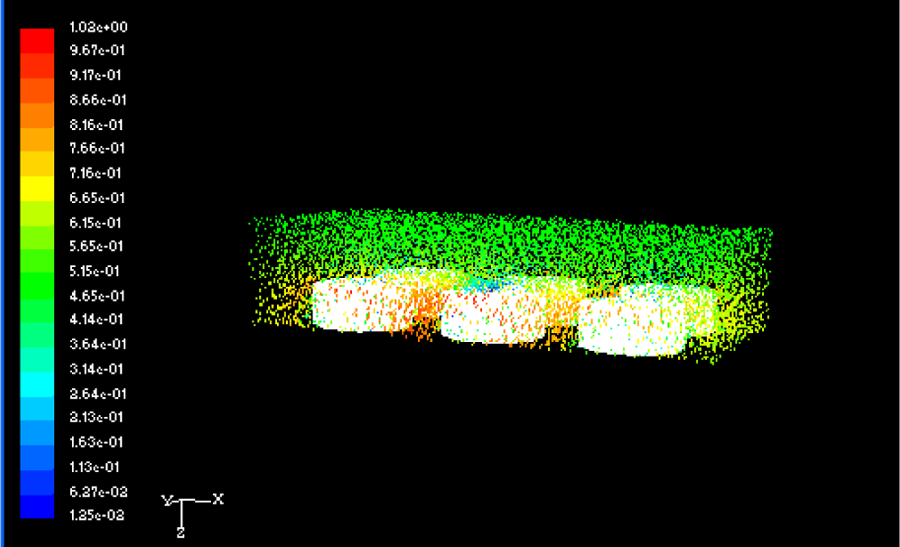
The simulation object was the HCl gas, and the concentration of HCl was 920 ppm in the case of no vacuum purging. The velocity field was shown in Figure 7. Generally speaking, the air entered the clean room from the ceiling and then flowed with uniform motion to the upper room, the turbulence was enhanced when impeded by the machines and the flow rate increased, the leakage source of the local air was less due to the jet of the initial leakage.
Velocity vector in the calculation domain.
In order to facilitate analysis, the velocity field impact on the dissipation, the velocity field on the cross-section of X, Y and Z axes was selected, respectively.
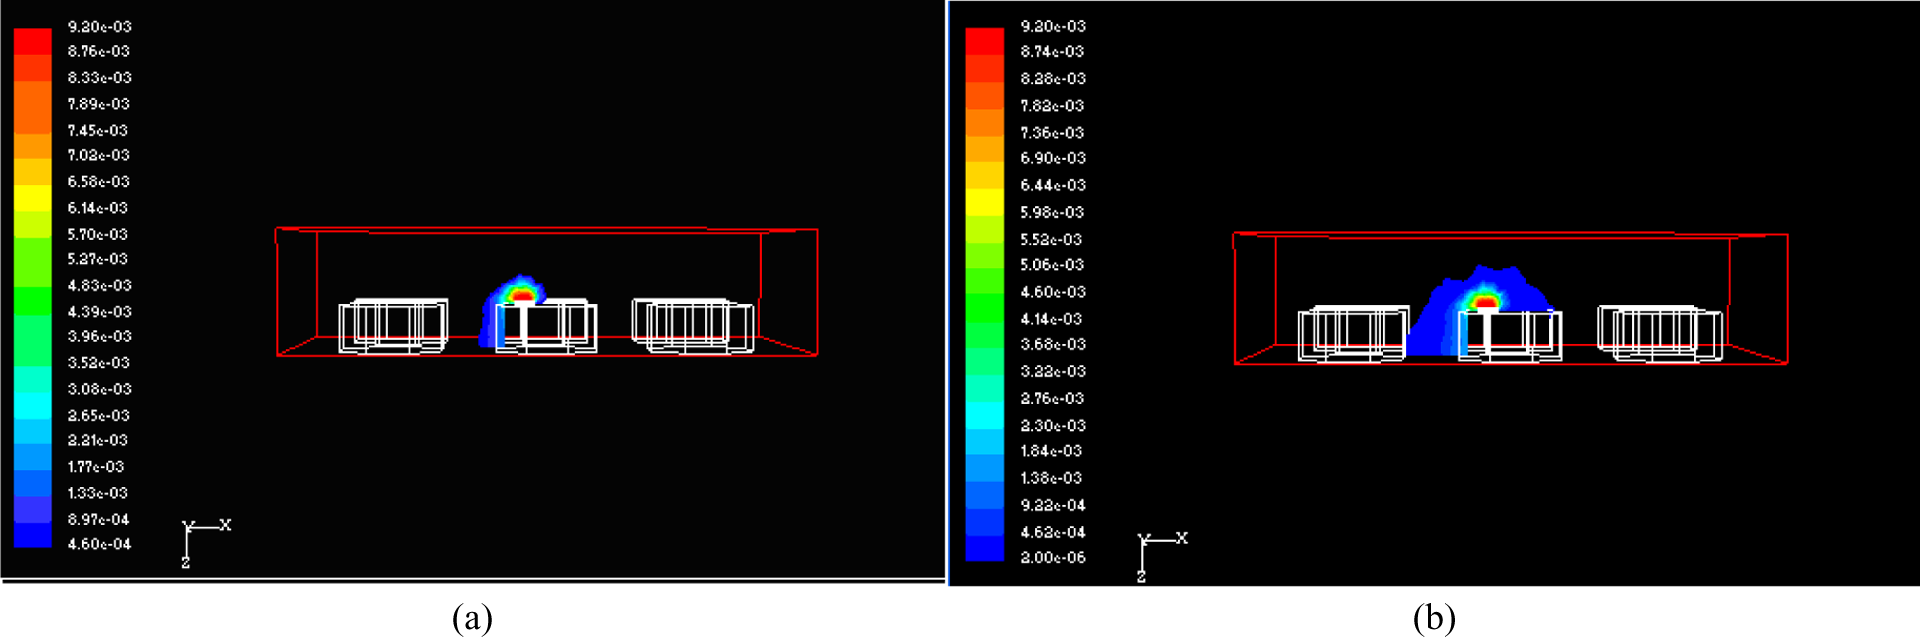
Figure 8(a) shows the velocity field map on the cross-section of Z axis (Z = 0.4 m) for the HCl leakage source. As shown in the figure, the airflow speed on the machine surface was very small and almost 0, due to the obstacles in the machine, the shear flow was separated and the turbulence role was enhanced, the airflow velocity on the machine edge was gradually increased. The airflow velocity was further increased and reached about 7 m/s because of the channel effect among the machines. Because the HCl leakage source of middle No. 2 machine at north side had an initial upward velocity of 0.4 m/s, thus the velocity at the leakage source was higher than the surrounding. In addition, because of the interaction between the airflow and the escaped gas flow, the flow in the nearby area of No. 2 machine, particularly in the middle region with the No. 1 machine was active and the speed reached 7.5 m/s, which was much higher than the initial velocity.
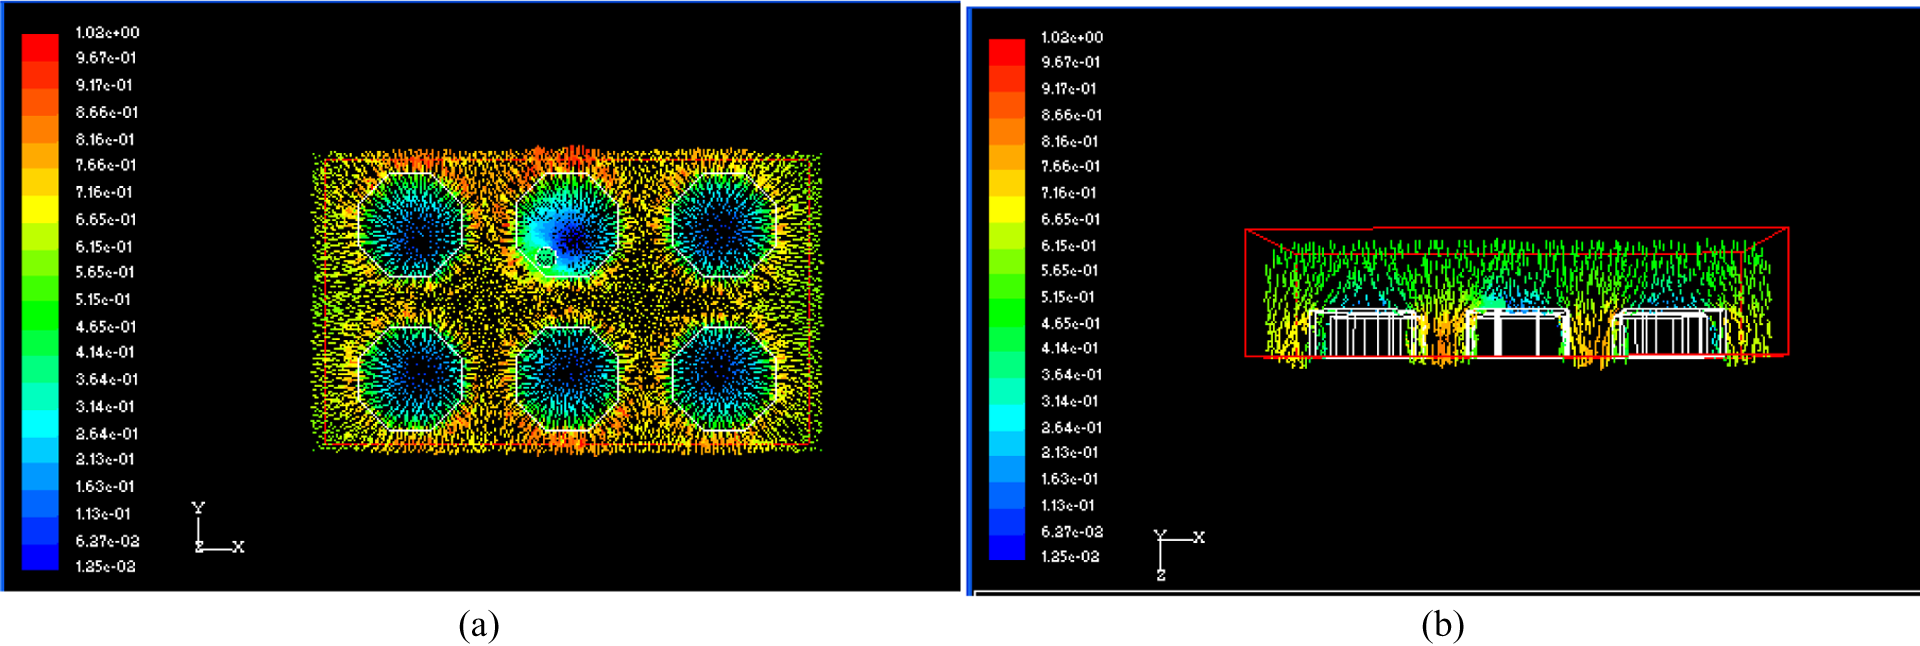
Velocity vector map on (a) Z axis cross section (Z = 0.4 m) and (b) Y axis cross section (Y = 1.5 m).
Figure 8(b) shows the velocity field map on the cross section of Y axis (Y = 1.5 m) for the HCl leakage source.
As can be observed from the figure, the air entered the clean room from the roof and got diverted when encountering the machines. When the air passed the narrow channel among machines, it was extruded and resulted in “channel” effect, and the wind speed increased. The airflow through the top of the leakage point resulted in collision and mixing with the dissipated gas, the vortex was produced, the air flowed more fully and the local wind speed can reach 0.8 m/s or so. The pollutants were diluted and discharged outdoor under the pumping action of the exhaust port.
According to the symmetry of the calculation space, the velocity distribution characteristics on the cross section of X axis and Y axis were similar and will not be described in detail here.
HCl concentration field analysis
To better display the HCl distribution and its impact on the personnel within the calculation region, the following two standards were used to divide the HCl concentration:
Standard 1. “Occupational exposure limits of harmful factors in the workplace” (GBZ2-2002), a hygiene standard formulated by the government of China. The professional standard specified that the maximum allowable concentration of HCl within the workplace was 7.5 mg/m3, which was 0.00046% when converted into volume fraction.
Standard 2. From the conservative principle, the detection limit of the gas detector was used as the standard to achieve absolute security. The detection limit of the gas detector used in this study was 0.02 ppm, the volume fraction was 0.000002%.
HCl concentration distribution in the calculation region
Figure 9 shows the distribution map of HCl concentration in the whole calculation domain.
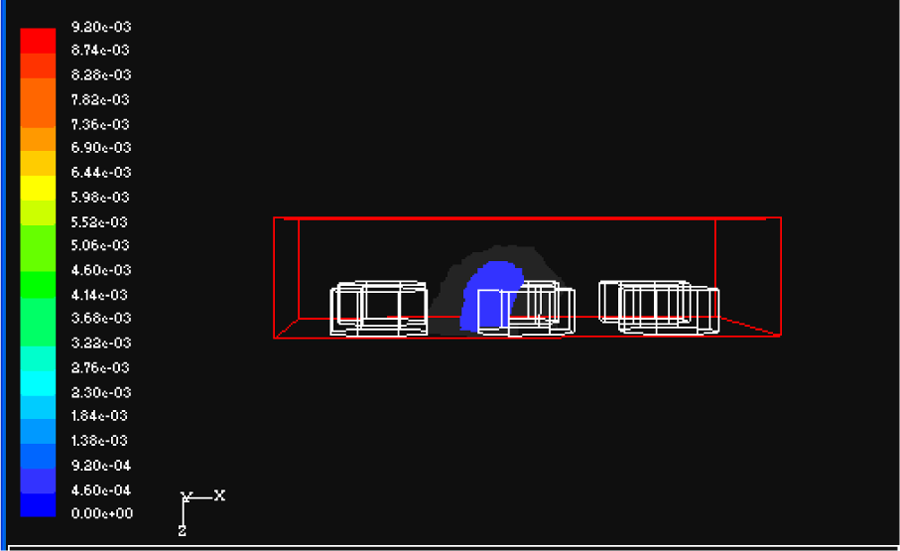
HCl concentration distribution contour map in the calculation domain.
The HCl concentration in the blue region is greater than the exposure limit. It can be seen that the HCl coverage area at the left side of No. 2 machine was significantly larger than the right side, and the concentration was higher than the exposure limits, indicating that the maintenance staff would be exposed to a harmful environment whose concentration was excessive and in a high occupational health risk. In addition, due to the jet role, the HCl concentration above a certain height from the leakage source would be higher than the exposure limits.
The persons in the gray area (exposure limit ≥ HCl concentration ≥ detection limit) were with a small exposure concentration and may be subject to occupational health hazards.
The region outside the gray air mass can be considered as absolutely safe under normal operating conditions and will not be affected by the HCl dissipation, therefore, it can be seen that the impact scope of HCl dissipation was not very large and mainly concentrated on the left side of the calculation domain close to leakage source.
The distribution of the HCl air mass in the clean room was basically hemispherical, the HCl air mass whose concentration exceeded the standard 1 will extend 1.5 m farthest away from the leakage source center, whereas the HCl air mass whose concentration exceeded the standard 2 will extend about 1.5 m away from the leakage source center.
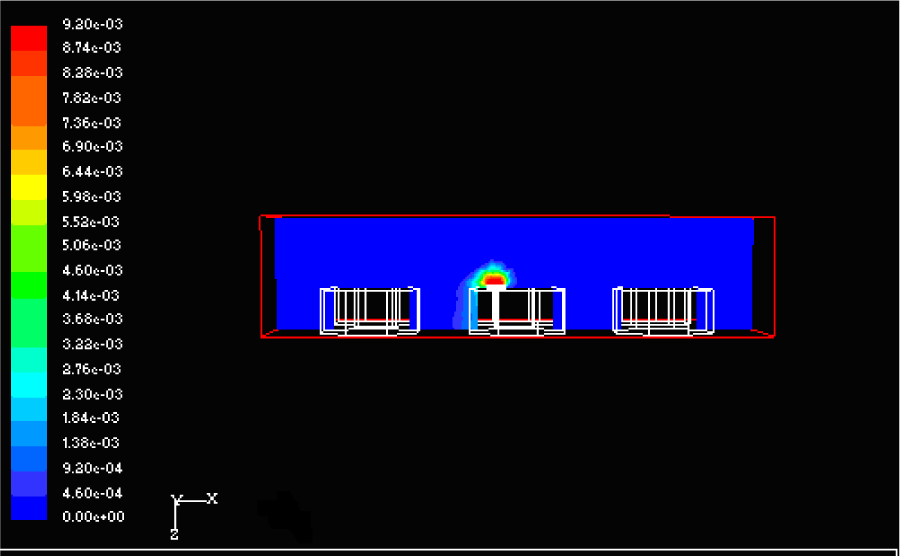
Concentration distribution on the cross section of Z axis
Figures 10(a) and (b) and 11 show the distribution maps of HCl concentration, which is ≥0.00046%, ≥0.000002% and full-scale on the Z axis cross section (Z = 0.4 m) of the leakage source center, respectively.
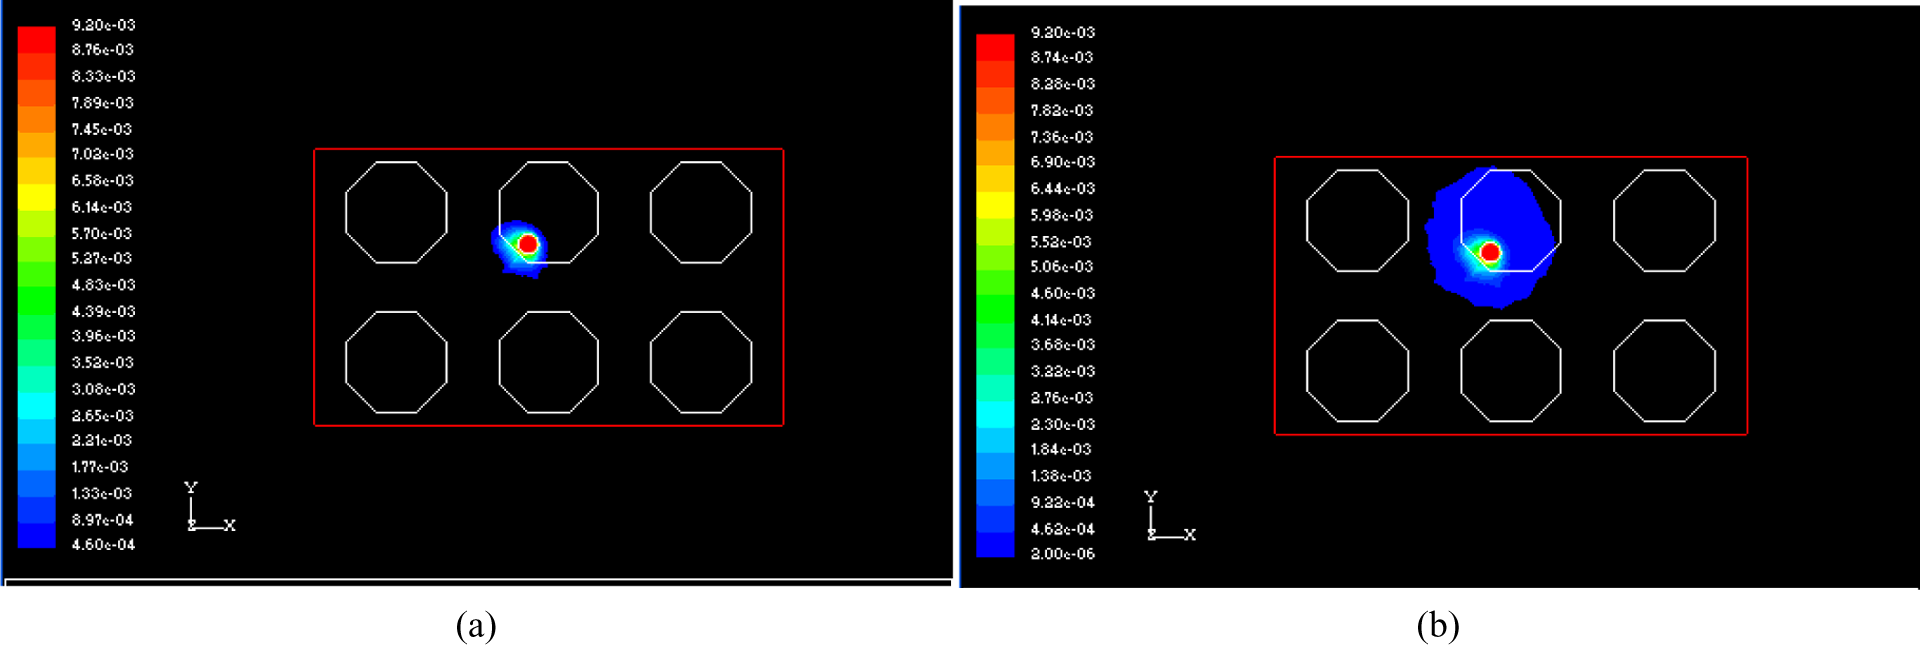
HCl concentration contour map on Z axis cross section (Z = 0.4 m). (a) volume fraction ≥ 0.00046% and (b) volume fraction ≥ 0.000002%.
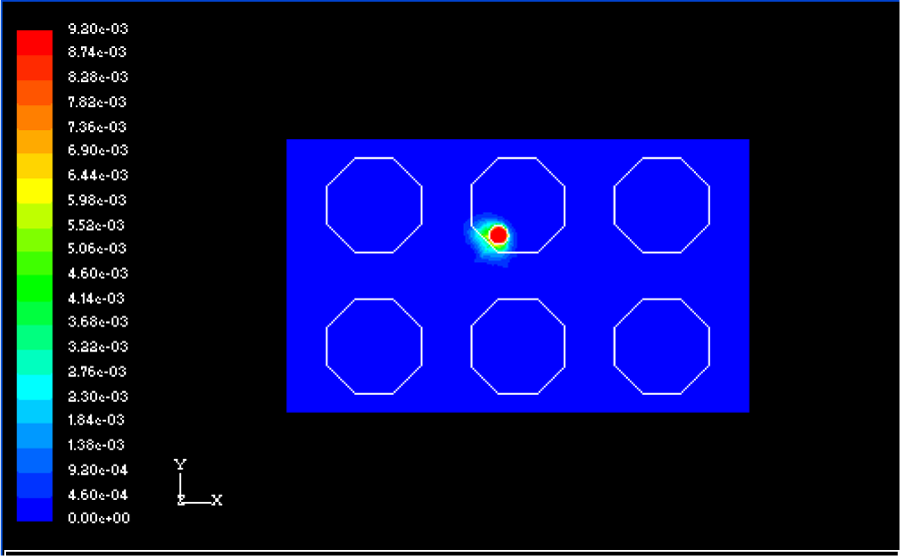
Full-scale HCl concentration contour map on Z axis cross section (Z = 0.4 m).
The cross-section elevation was 1.6 m, which is the plane for the human breath. From the figures, it can be seen that the HCl concentration on the left side of the leakage source was higher than the corresponding location on the right side, the concentration decreased gradually with increase in the distance. The HCl concentration gradient in the left bottom of the leakage source changed more moderately, and the concentration was higher. According to the airflow velocity map discussed in the “Flow velocity field analysis” section, the latter located at the near wall cavity, which was formed when the airflow passed the machines, there was a small circular-shaped vortex, the flow velocity was low, thus the concentration was higher, the HCl volume fraction at the edge of the machine was about 0.065%, the coverage area of the pollutants extended from No. 1 machine to No. 5 machine.
The coverage area of the HCl air mass whose concentration exceeded standard 1 on the plane was basically fan shaped, it can extend about 1.2 m away from the leakage source center. Although the coverage area of the HCl air mass whose concentration exceeded standard 2 on the plane was basically round in shape, it can extend about 2.9 m away from the leakage source center.
Concentration distribution on the cross section of Y axis
Figures 12(a) and (b) and 13 show the distribution maps of HCl concentration, which is ≥0.00046%, ≥0.000002%, and full-scale on the Y axis cross-section (Y = 1.5 m) of the leakage source center, respectively.
HCl concentration contour map on Y axis cross section (Y = 1.5 m). (a) volume fraction ≥ 0.00046% and (b) volume fraction ≥ 0.000002%.
Full-scale HCl concentration contour map on Y axis cross section (Y = 1.5 m).
As can be seen from the figures, after escaping from the reaction chamber, due to the upward velocity, the HCl pollutants diffused upward first, and then the pollutants gradually spread to the surrounding because of their own gravity and the dilution effects of the airflow.
The pollutants in the left of the leakage source diffused fast and the concentration gradient changed quickly. This phenomenon can be explained in two ways. First, when the airflow passed this region, it was squeezed, the velocity increased and the advection of gas clouds intensified. The gas clouds were transported down in the direction of wind, greater of the wind speed, more remarkable of the transport effect, so that the gas concentration in the direction of was decreased. Second was the intensification of turbulence. Due to the increase in the wind speed, the fluctuating velocity increased, the turbulent motion was intensified and then the turbulent diffusion accelerated, so that the gas cloud concentration decreased. In addition, the airflow had a collision with the HCl ejected from the leakage source, the gas friction was intense, enhancing the turbulence and thereby accelerating gas diffusion.
On this plane, the most remote vertical distance of the HCl air mass whose concentration exceeded the standard 1 was about 0.6 m, the part spread to the left side was about 1.1 m to the machine (Figure 12(a)). Although the most remote vertical distance of the HCl air mass whose concentration exceeded the standard 2 was about 1.4 m, the horizontal dissipation can reach the left No. 1 machine.
Concentration distribution on the cross section of X axis
As the calculation space was symmetric, the concentration distributions on the cross section of the X axis and the Y axis were basically similar. The concentration was mainly affected by the organizational form of air, the pollutants spread fast in the area with a large wind speed.
The above analysis showed that with the CFD numerical simulation method, the indoor fluid patterns and the pollutants dissipation under the influence of the indoor air can be clearly and intuitively demonstrated using various forms of postprocessing results. It is very helpful in studying the pollutants’ distribution and the control measures.
Field detections and comparative analysis with CFD simulation results
To further prove that CFD was reliable to simulate the pollutants’ dissipation, the on-site monitoring data will be used in this section to compare with the numerical simulation results, so that the accuracy of the numerical simulation methods can be tested. The health hazard of HCl is to stimulate eyes and respiratory mucosa, its effects on people depend largely on the pollutants’ concentration above the respiratory belt, so the breathing domain height of the operating personnel was selected to set monitoring points, that is, the horizontal plane which was 1.6 m from the floor. For the numerical simulation, the concern was to calculate the HCl concentration distribution on the cross section with an elevation of 1.6 m (Z = 0.4 m).
Contents of HCl dissipation concentration for on-site monitoring
The monitoring object was the HCl that escaped from the AMAT (Applied Materials, Inc., CA, USA) metal-etching reaction chamber of chip factory during the maintenance prevention process. The monitoring instrument was the Japanese “RIKEN SC-90” gas detector (as shown in Figure 14). For on-site monitoring, the monitoring instruments should be adjusted first.
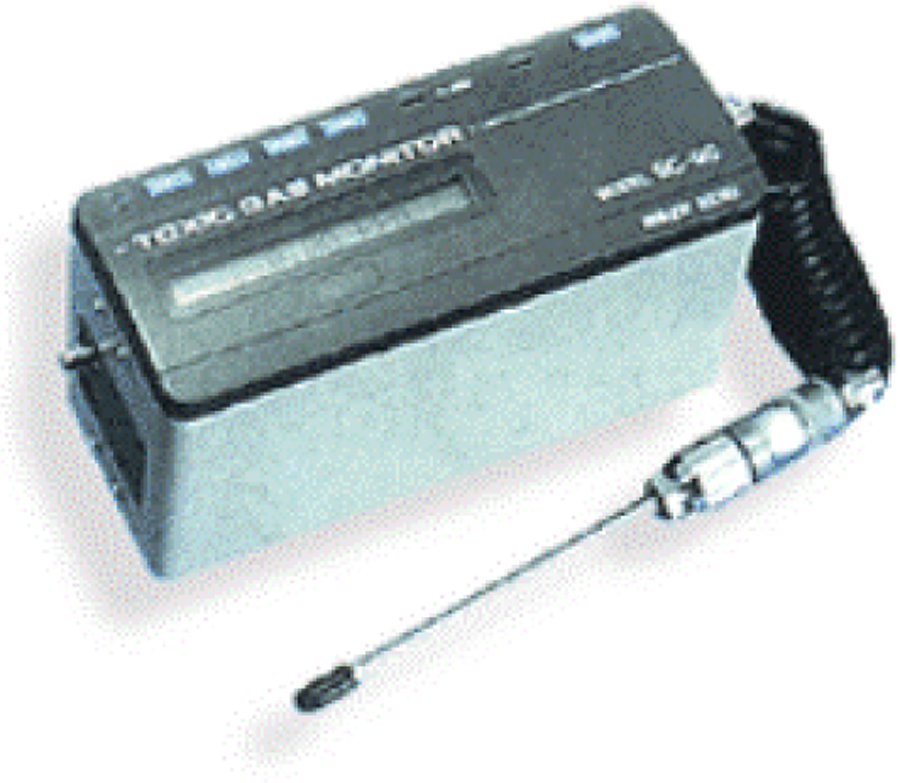
Gas detector appearance.
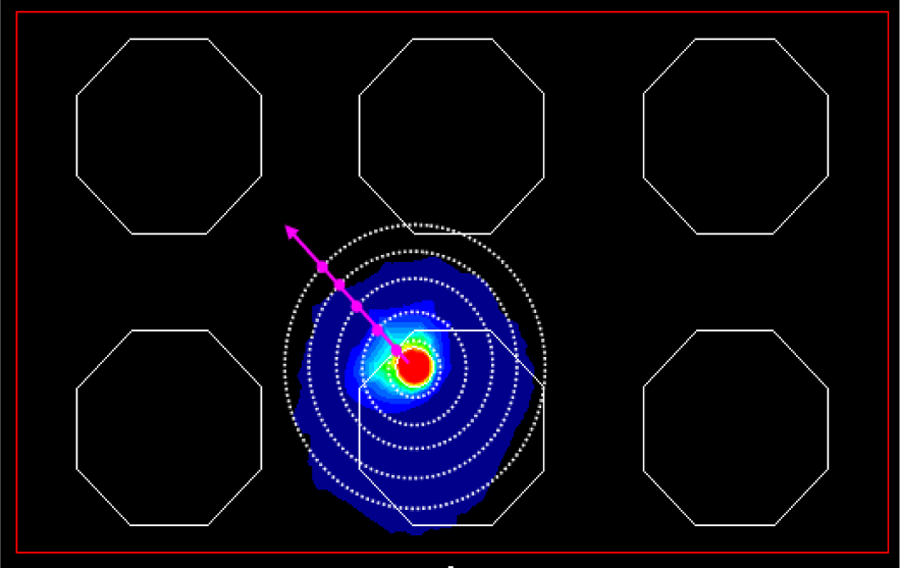
The center of the reaction chamber mouth was used to measure the initial HCl dissipation concentration. The reaction chamber was set at the center, the monitoring points were set up for every 0.5 m of horizontal projection distance, number followed by 1, 2, …, 6, the specific layout can be seen in Figure 15. The red dots in the figure indicate the level projection positions for gas detectors, whereas the dashed lines were equidistant lines relative to the chamber center.
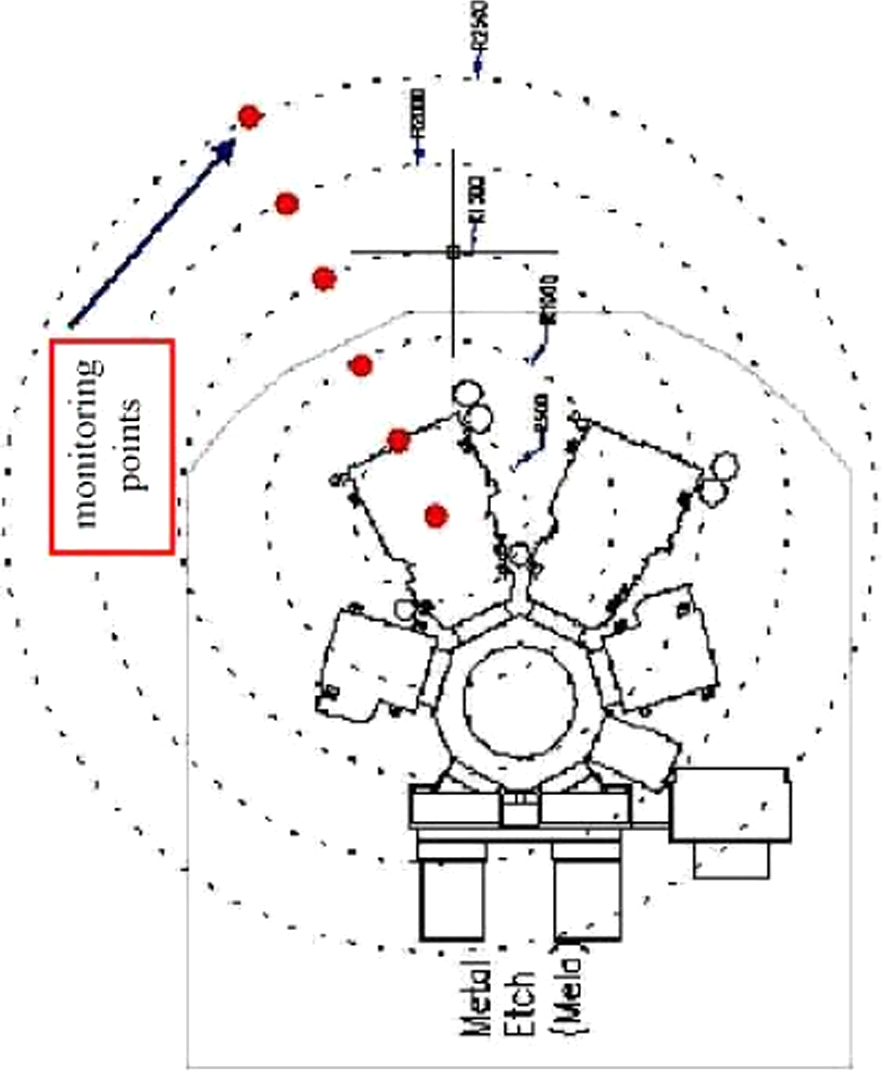
Layout of on-site monitoring points.
Comparison and error analysis of on-site monitoring and CFD simulation
The on-site monitoring and the numerical simulation were carried out under the same conditions. Figure 16 shows the numerical simulation results at monitoring points. The comparison and the relative error at each monitoring point can be seen in Table 2. Figure 17 shows the comparison chart of HCl concentration at the monitoring sites based on the data in Table 2.
Numerical simulation map of HCl.
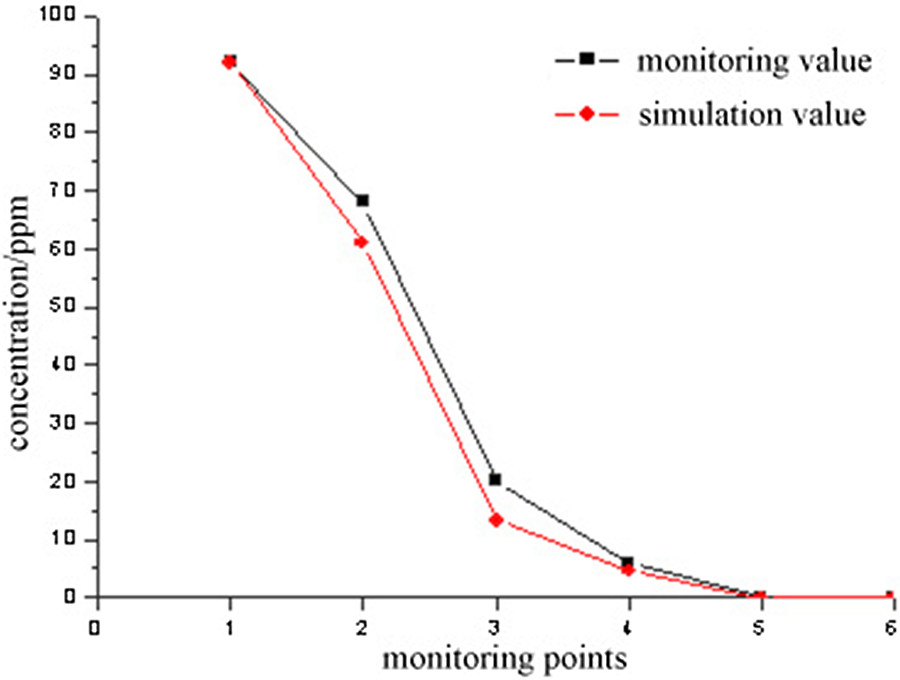
Comparison of two methods.
Comparison of the monitoring and simulation values.
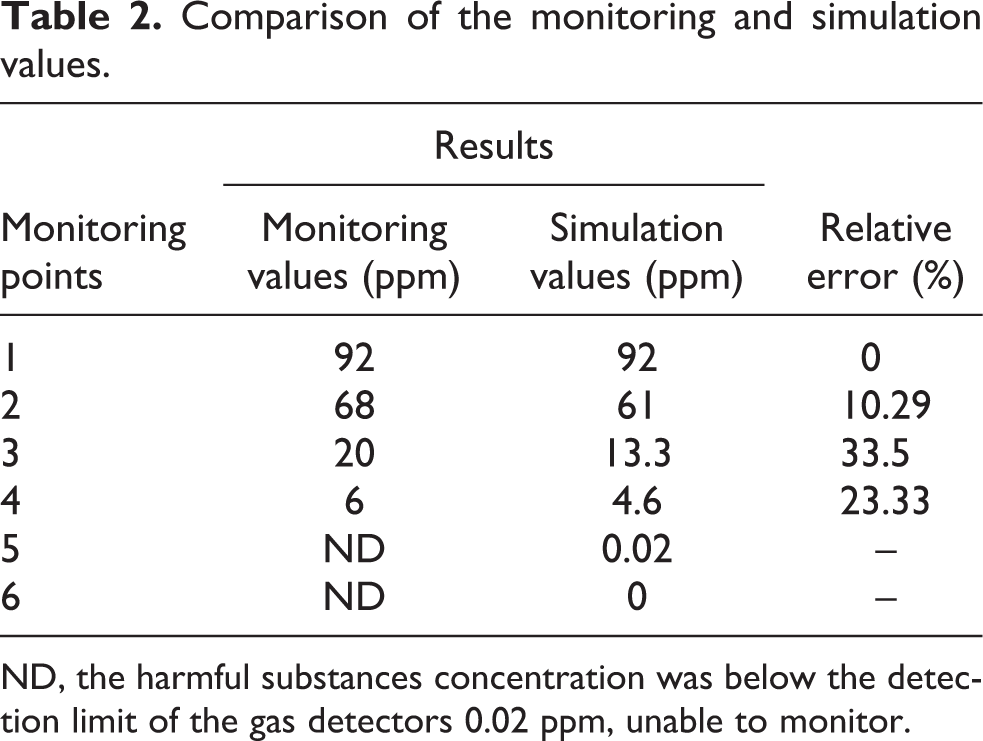
ND, the harmful substances concentration was below the detection limit of the gas detectors 0.02 ppm, unable to monitor.
As can be seen from Table 2, the monitoring and simulation values of HCl concentration at each monitoring point agreed well, comparatively speaking, the CFD simulation values were lower than the monitoring values in global aspect. Besides the error of the test equipment itself, other bias errors were due to the (1) differences between the actual scenario and the physical model; (2) the HCl leakage was assumed to be continuous in the numerical simulation. While in the actual case, the spread of the pollutant gas will take some time, so the measured data of the portable gas detection instrument had some deviations in time with the numerical simulation results. (3) The experiment staffs moving back and forth will disturb the entire flow field and change the actual concentration field. (4) The temperature of the dissipation gas and the clean room was assumed to be unchanged. Although the turbulence intensified because of the gas collisions and friction, the heat exchange between the air mass and the surrounding environment became violent, the temperature increased rapidly, the density decreased and the pollutants diffused more easily under the influence of the wind and the resulting simulation was slightly lower. (5) The simulation model simplification was another reason causing the error, and this issue will be improved with the improvement of the turbulence model and the computer capacity.
Figure 17 reflects the comparison of the monitoring and simulation values at each monitoring points, through regression statistics, the value of R 2 was 0.95, the value of p was less than 0.05. It can be concluded that, although there was a certain bias between the measured results and the calculation results, the CFD-simulated curves and the monitoring curves were found to be uniform and agreed well.
Through the comparative analysis of the on-site monitoring and simulation results, the errors were both in the allowable range, indicating that the numerical simulation results had a good reference value in the study of the pollutants dissipation in the clean room. Using the standard
Occupational hazards’ prevention and control based on CFD simulation
The effect of the prevention and control measures for hazard dissipation will be discussed in this article, and the most optimal control measures will be selected on this basis.
Occupational health hazards analysis based on numerical simulation
Hazardous area division
Based on “GBZ2-2002” and the surveillance limit of the gas monitor, the typical plane was divided into three regions.
Grade I—occupational exposure control area. The maximum allowable concentration of HCl in the workplace is 7.5 mg/m3, which will be selected as the control threshold. The etching reaction chamber will be set at the center of a circle, and the region where the HCl concentration was higher than or equal to the control threshold was defined as the control areas. In this region, appropriate protective measures must be adopted to eliminate or control the potential personnel health hazards.
Grade II—occupational exposure restricted area. The upper limit was the maximum allowable concentration; the lower limit was the surveillance limit of the gas monitor. In this region, appropriate protective measures should be taken in order to eliminate the possible health risks.
Grade III—security area. The region where the HCl concentration was below the detection limit was defined as a safe area. Staffs in this region will not be affected by the HCl dissipation basically.
Occupational health hazard analysis
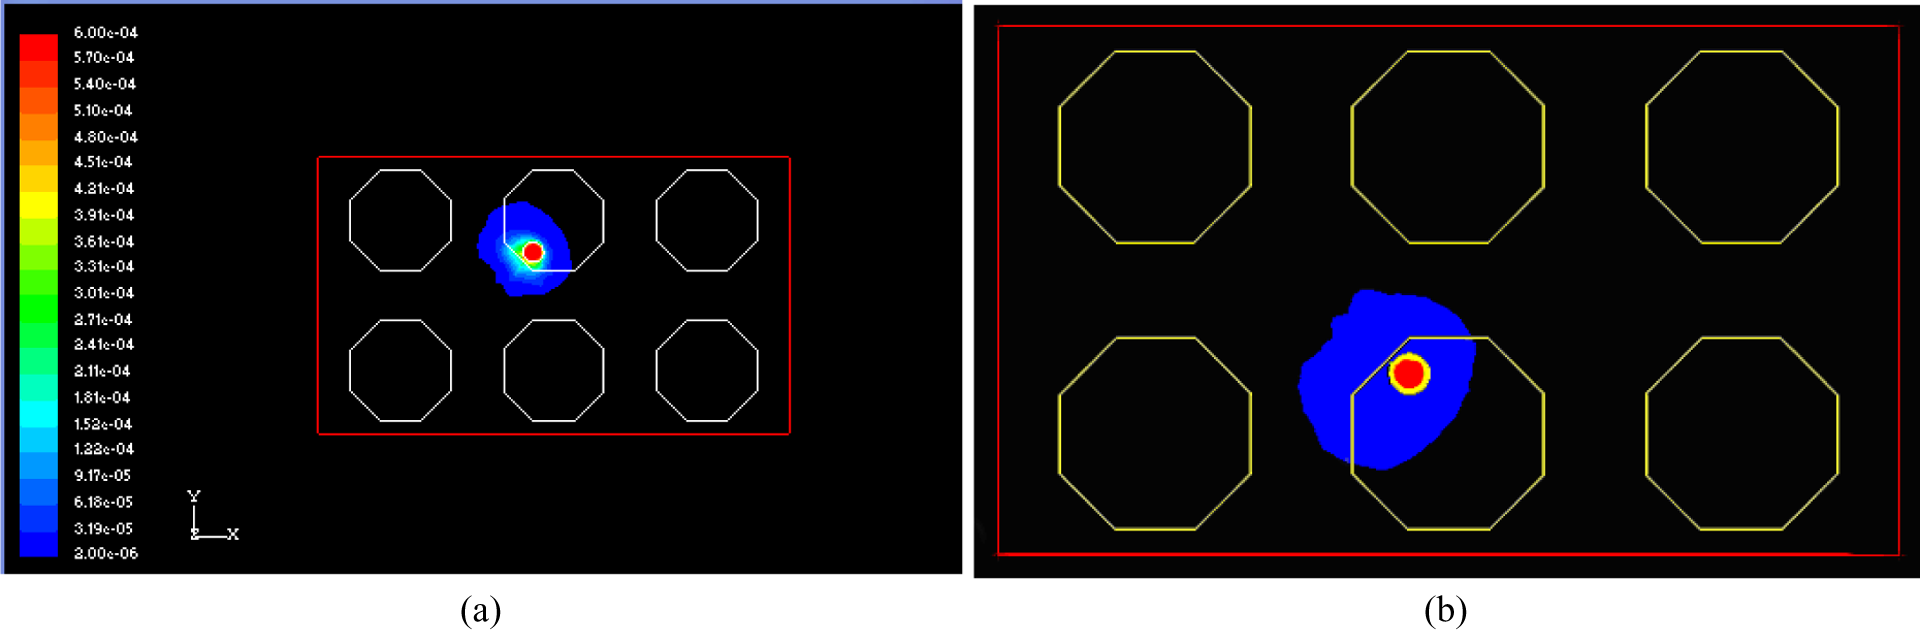
According to the simulation results, in accordance with the above principles, the typical plane was divided into three regions, as shown in Figure 18. The red area in the figure represents the HCl leakage source. The yellow area represents the occupational exposure control area (grade I area), the blue area represents the occupational exposure-restricted area (grade II area) and the black area represents the security zone (grade III area).
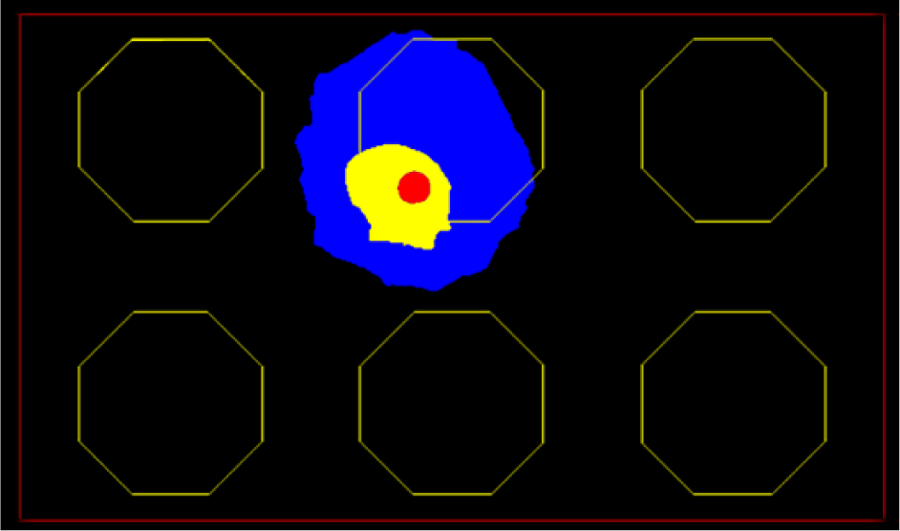
Hazardous area division map.
The grade I area was basically fan shaped, and the most remote distance from the leak source center was about 1.2 m. The grade II area was round in shape, with a radius of about 2.9 m.
Prevention and control measures of occupational hazards
Comprehensively considering the safety, economy and comfort of the protective measures, it can be drawn that the measure of “vacuum purge before opening the reactor chamber” is the best protective measure, which radically reduces the HCl dissipation concentration and does not increase the production cost and not affect the workers and operations. It should be used as the preferred protective measures.
Effectiveness analysis of the control measures
In this section, the CFD technology will be used to simulate the HCl concentration field on the typical plane for vacuum purge 5 times, 10 times, 15 times, 25 times and 35 times. The hazardous region changes will be analyzed for the three levels of occupational exposure, and the pollutants’ concentration at the most sensitive location will be calculated under different conditions. Based on this, the effectiveness of the vacuum purge measure will be quantitatively evaluated.
Qualitative analysis of control measures effect
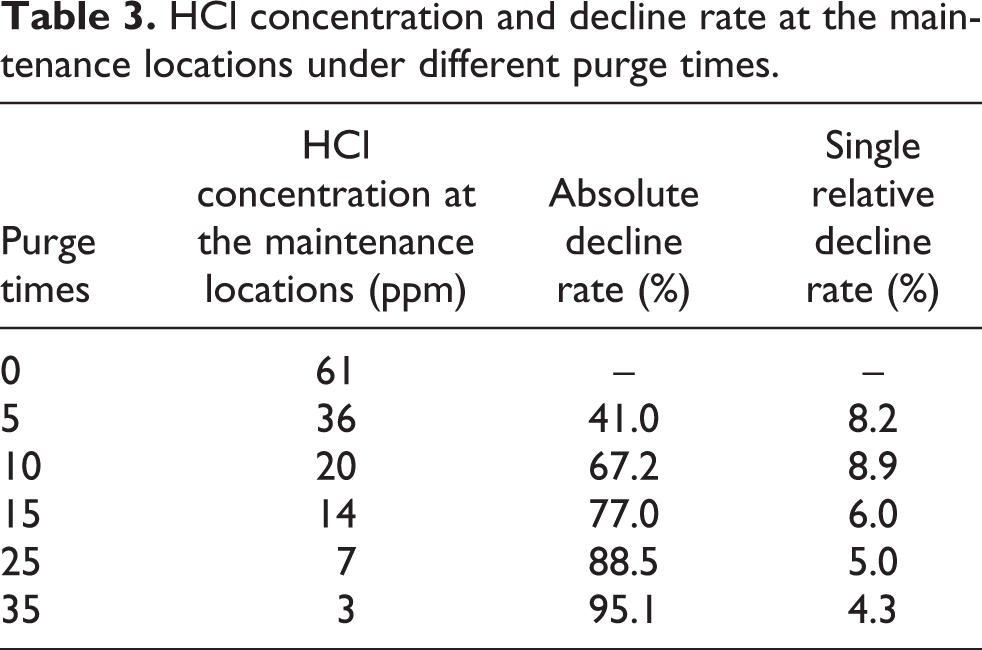
Figures 19 to 23 show the HCl concentration distribution on the human breath plane and the corresponding area division under different purging times, respectively.
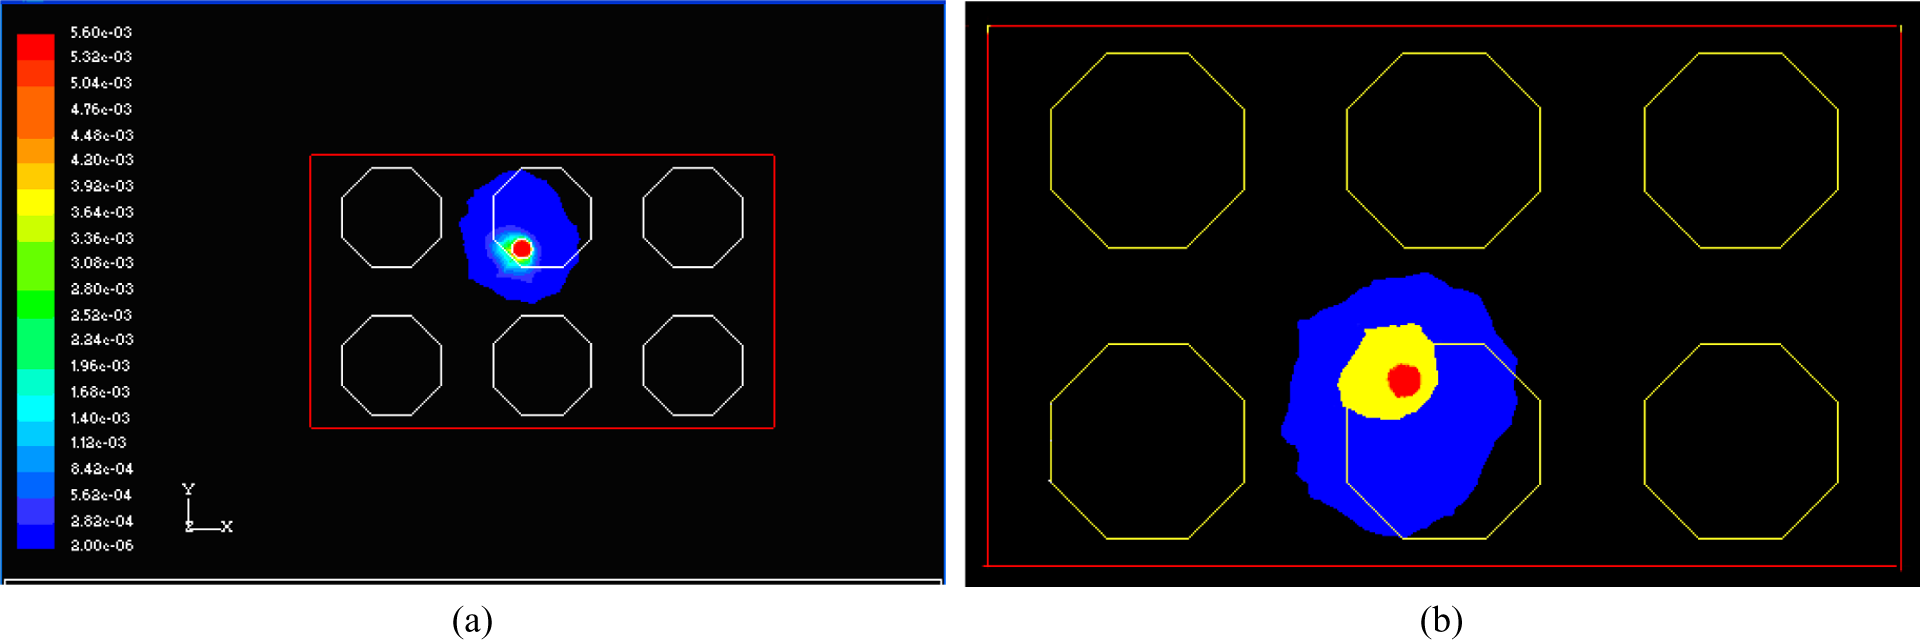
HCl concentration distribution and area division with 5 times vacuum purge: (a) concentration distribution and (b) area division.
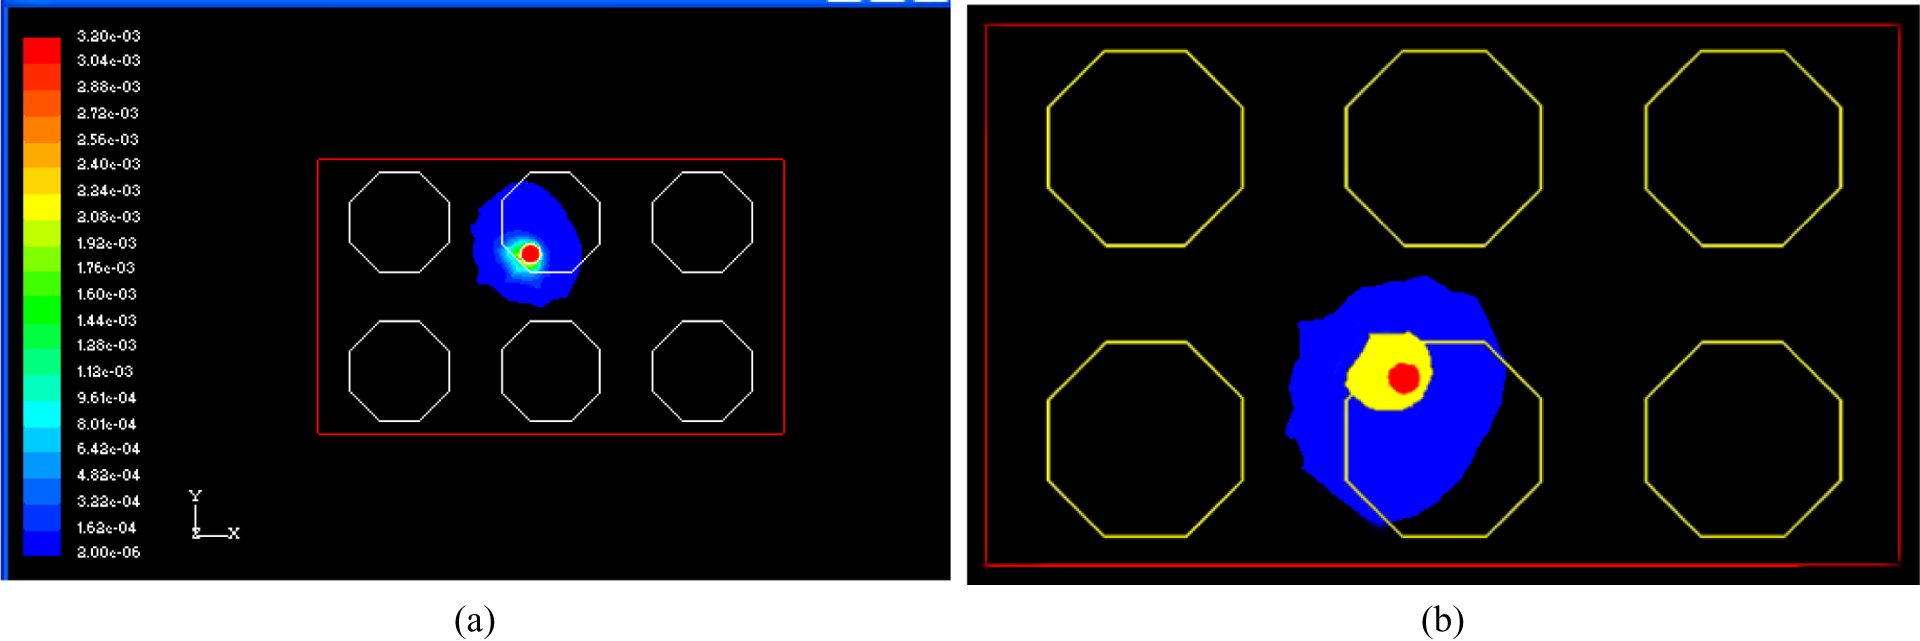
HCl concentration distribution and area division with 10 times vacuum purge: (a) concentration distribution and (b) area division.
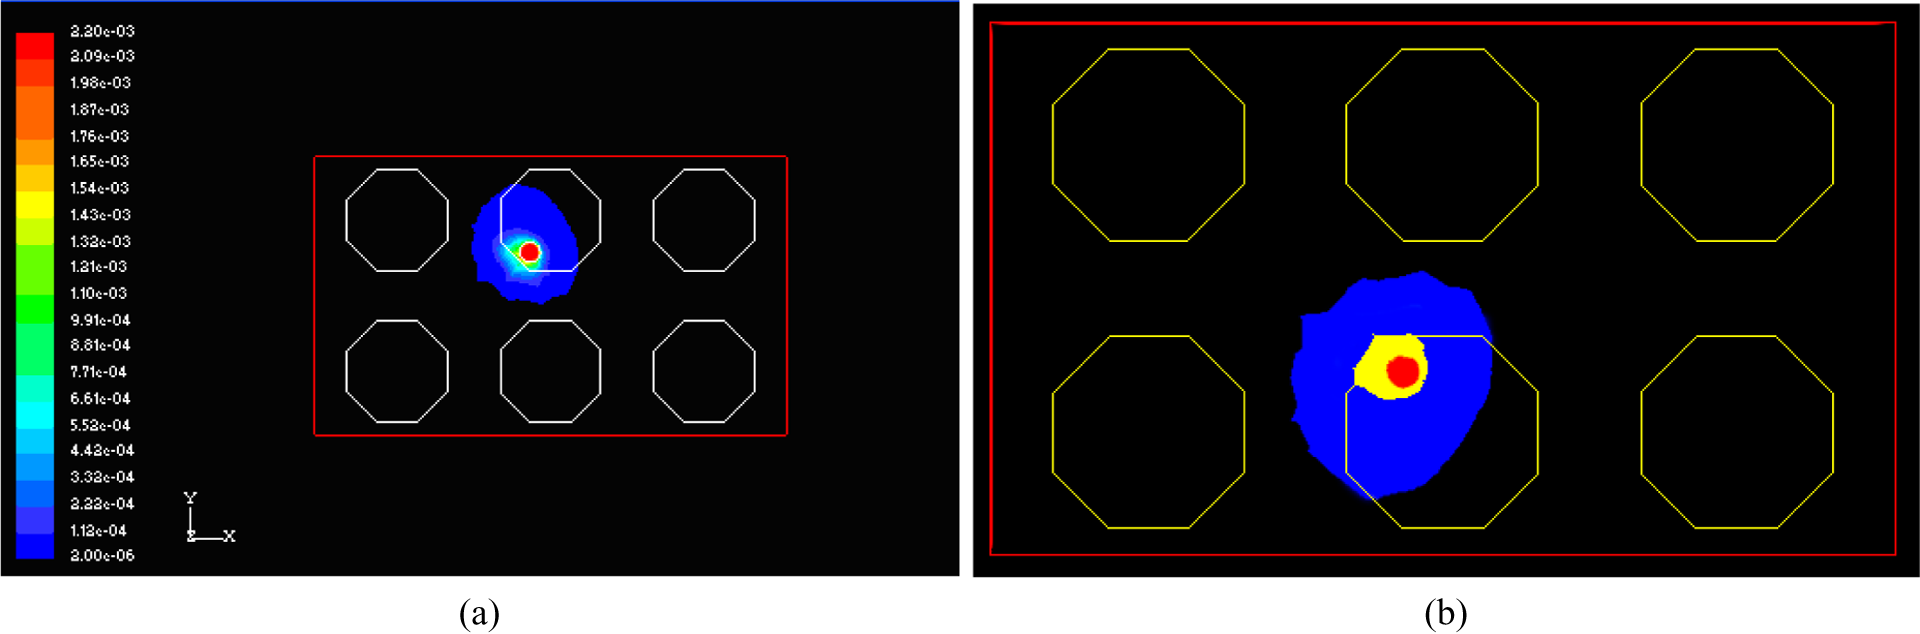
HCl concentration distribution and area division with 15 times vacuum purge: (a) concentration distribution and (b) area division.
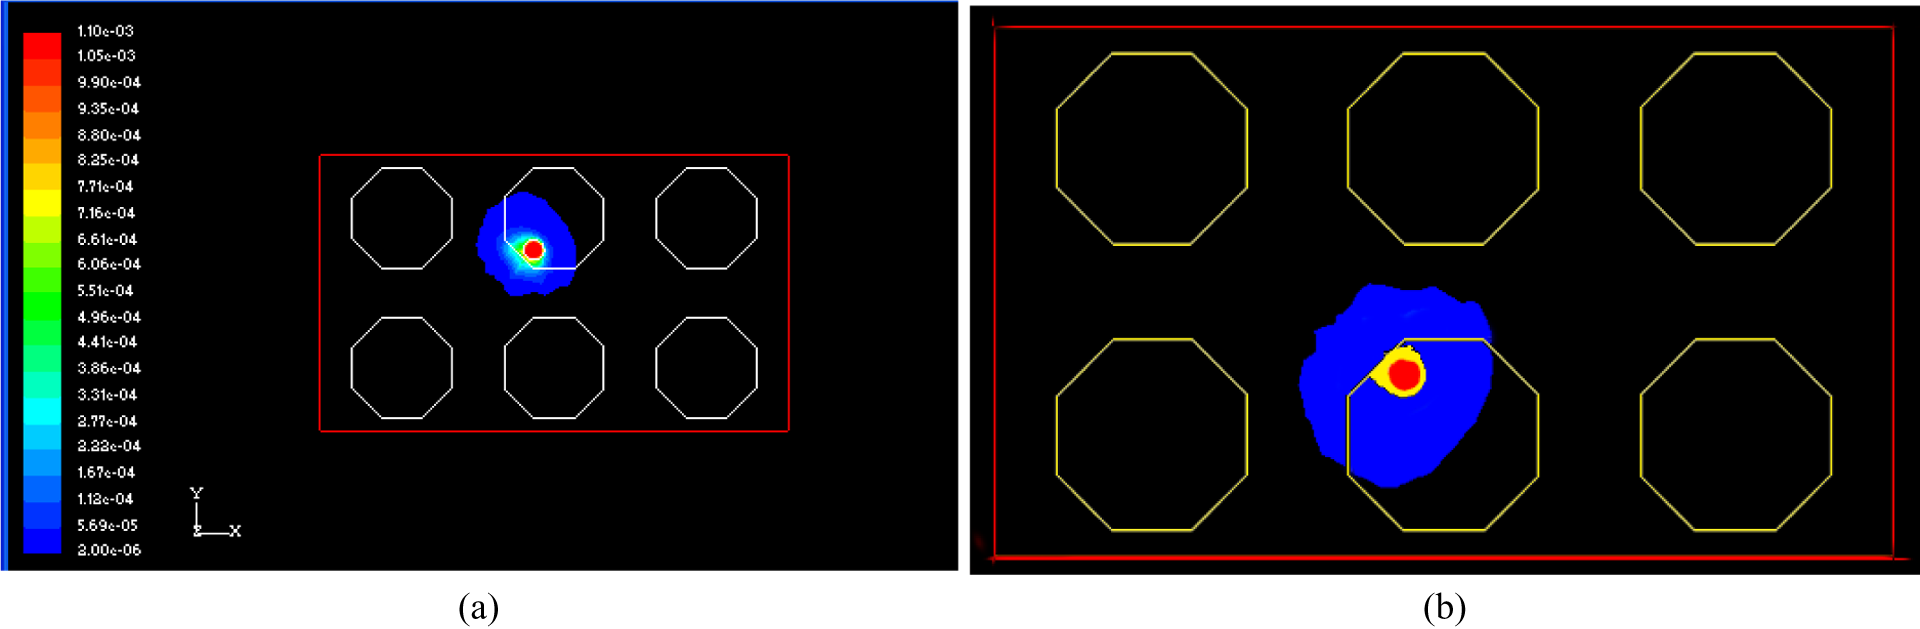
HCl concentration distribution and area division with 25 times vacuum purge: (a) concentration distribution and (b) area division.
HCl concentration distribution and area division with 35 times vacuum purge: (a) concentration distribution and (b) area division.
As shown in the figures, with the increase in vacuum purge number, both the control region and the restricted area have been narrowed at varying degrees. After vacuum purging 25 times, the radius of the control region was no more than the edge of the metal-etching machine. After 35 times, the HCl exceeding the maximum allowable concentration was only confined around the export of the reaction chamber, the nearest maintenance staff will not be exposed to the environment where the harmful substances were over standard. The numerical simulation results suggested that the vacuum purge can effectively reduce the HCl concentrations and had the desired effects for the occupational exposure control.
Quantitative analysis of the control measures effect
The HCl concentration values at the maintenance staff position were first read in the numerical simulation results as shown in Figures 19(a) to 23(a) and Table 3. As can be seen, the HCl concentration at the maintenance staff location had a sharp decline with the vacuum purge number increasing. When purging 25 times, the HCl concentration was 7 ppm, which was lower than the workplace exposure limits. Compared to that not taking any measures, the HCl concentration with 5 times, 10 times, 15 times, 25 times and 35 times vacuum purge was reduced 41.0%, 67.2%, 77.0%, 88.5% and 95.1%, respectively, showing that the protective measures were very effective in reducing the levels of contaminants. The contribution of completing a vacuum purge to a relatively lower HCl concentration was in sequence of 8.2%, 8.9%, 6.0%, 5.0% and 4.3%, showing that when the number of vacuum purge was fewer, the HCl concentration was basically stable, with the increase in the number, the trend of influence degree began to slow down.
HCl concentration and decline rate at the maintenance locations under different purge times.
In summary, through the qualitative analysis of the region-wide changes on a typical plane and quantitative analysis of the degree that protective measures influenced the HCl concentration at the most sensitive position, it can be seen that the vacuum purge can effectively reduce the pollutants concentration, improve the indoor air quality and decrease the on-site occupational health risks.
Benchmark number of vacuum purge determination
A proper standard vacuum purge frequency can not only work without affecting the health but also reduce the production costs. So it is necessary to find a benchmark vacuum purge frequency with minimum purge times, ensuring that the HCl concentration of the maintenance staff at the highest concentration position is below the occupational exposure limits.
According to the relationship between the vacuum purge frequency and the HCl concentration, using the linear regression method, the best fitting curve can be obtained as follows
Figure 24 shows the corresponding curve. The red curve in the figure is the fitting curve of the HCl concentration changing with the vacuum purge frequency, the blue line shows that the HCl concentration is equal to the occupational exposure limit of 7.5 ppm. Based on health risk management principles, the HCl concentration at the most sensitive location can be seen as acceptable if it is below the occupational exposure limit, so the intersection of the blue line and the red curve was taken as the benchmark vacuum purge frequency, about 23 times.
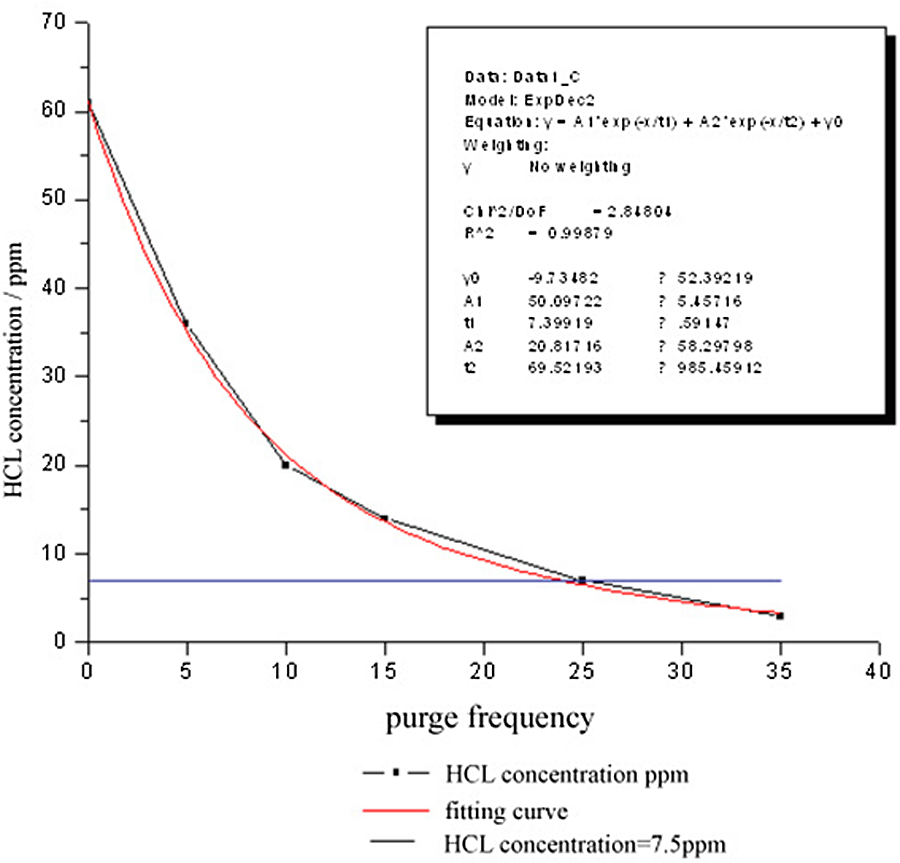
HCl concentration trend with the change in vacuum purge frequency.
In the actual production, taking into account that the air disturbance will expand the scope of the hazardous zones, it is necessary to appropriately increase the vacuum purge procedure several times.
Conclusions
In this article, the physical model of the metal-etching area in the clean room was established, the HCl airflow velocity field and concentration field were simulated with the CFD technology, then the flow velocity distribution and HCl concentration characteristics on the X axis plane, Y axis plane and the breathing zone plane of the standing human body (Z = 1.6 m) in the leakage source center were examined. The study had shown that when the airflow entered the clean room from the roof, because of the channel effect, its velocity became larger. And the air flowing through the top of leak point collided, mixed, resulting in Eddy current with dissipation of gas, which made the flow full and diluted the pollutants. Therefore, the HCl concentration of the machine causing HCl dissipation was higher than the machines nearby, and the concentration gradient changed fast. On the breathing plane, the HCl concentration on the left side of the leak source was higher than the corresponding position in the right and exceeded the occupational exposure limits, indicating that the maintenance staff without protective measures will be exposed to the harmful environment exceeding the limit and had high occupational health risk.
Lacking field measurements to compare with the simulation results was a defect of the previous study of the indoor gas dispersion. The on-site HCl dissipation concentration in the actual situation of the clean room was monitored in this article, then the monitoring values was compared with the simulated values. It can be seen that the CFD simulation results of the pollutants’ concentration field in the clean room were in good agreement with the monitoring results, proving that the application of CFD technology in the research of dissipation of harmful substances in the clean room gave accuracy results.
The study showed that if no measures were taken, setting the leak source as the center, the personnel in the maximum width of about 0.85 m circular area will be exposed in the environment where the HCl concentration exceeded the maximum allowable limits in the workplace. Therefore, after discussing the advantages and disadvantages of the various pollutants’ control measures, the vacuum purge was found to be the best measure, and the effectiveness and efficiency of this measure were qualitatively and quantitatively evaluated. The results showed that the occupational exposure control area and the occupational restricted area had varying degrees of narrowing, with the vacuum purge times increasing. After vacuum purging 35 times, the HCl exceeding the maximum allowable concentration was confined around the exterior of the reaction chamber, and the HCl concentration at the most sensitive location reduced 95.1%. By studying the relationship between the HCl concentration and the vacuum purge frequency, the standard vacuum purge number calculated using a linear regression method was 23 times.
Compared with the existing occupational health management whose attention is on the cause and the event of the occupational health hazard itself, the occupational health risk management should focus on the risk factors and system vulnerabilities, which will be more effective in solving the occupational health problem.
Footnotes
Funding
This research received no specific grant from any funding agency in the public, commercial, or not-for-profit sectors.