






Abstract
Zinc oxide nanoparticles (ZnO NPs) are important nanomaterials with myriad applications and in widespread use. The main aim of this study was to evaluate the direct effect of ZnO NPs on steroidogenesis by considering mouse testicular Leydig cells (TM3) as an in vitro model system. The uptake, intracellular behaviour, cytotoxicity and morphological changes induced by ZnO NPs (0–200 µg/ml) in a time-dependent manner in the TM3 were assessed. A significant (p < 0.05) decrease in TM3 viability was observed at 2 µg/ml ZnO NP after a 1
Introduction
Nanomaterials and nanotechnology are becoming extremely popular in each and every field, including daily household products, food and feed additives, biological products, medicines, therapeutics, for pathogen detection, as antimicrobial agents, and agriculture (Kuzma, 2010; Sekhon, 2014). However, many reports are available amply demonstrating that nanoparticles (NPs) are actively interacting with biological systems in vitro (Rafeeqi and Kaul, 2010a, 2010b) and may interfere with their function (Albanese et al., 2012; Ickrath et al., 2017). Nanomaterials have unique chemical, electrical and physical activity because of their small dimensions. Zinc oxide (ZnO) NP is one of the most important nanomaterials used in diverse applications, since it has superior ultraviolet (UV) light absorption, antimicrobial activity, catalytic, semiconducting ability and unique magnetic properties (Serpone et al., 2007; Suh et al., 2009; Wiench et al., 2009). Among metal-containing NPs, ZnO NPs (550 tons) account for the third highest annual global production after silicon dioxide (5500 tons) and titanium dioxide (TiO2) NPs (3000 tons) (Piccinno et al., 2012).
In recent years, there have been a number of reports demonstrating that different NPs, because of their small size, can penetrate the cell membrane easily and even pass through the blood–brain or blood-testes barrier (De Jong et al., 2008; Khosravi-Kaluti et al., 2018; Lankveld et al., 2010). Reduction in mitochondrial function, induction of apoptosis or necrosis, morphological changes, increased reactive oxygen species (ROS) production, autophagic vacuole formation and genotoxicity are the changes observed in the cells after exposure of ZnO NP in vitro in various model systems (Khosravi et al., 2018; Wang et al., 2017; Yu et al., 2013; Zhang et al., 2015). Numerous studies have reported that NPs including ZnO NP may influence reproductive parameters (Yoshida et al., 2006, 2009) and interfere with normal endocrine functions (Reza et al., 2013). ZnO NPs can also cross the blood-testes barrier resulting in significant changes in epididymal semen parameters including sperm number, motility and percentage of abnormality, epithelial vacuolization, sloughing and detachment of germ cells, decrease in seminiferous tubule diameter, seminiferous epithelium height and maturation arrest in mice (Talebi et al., 2013). These results suggest that NPs may impair male reproductive functions in vivo; however, the mechanisms involved in this process remain to be elucidated, even for evolutionary lower and simpler animals like the non-vertebrates (Abinaya et al., 2018; Gallo et al., 2016). Thus, in vitro systems, using cell lines, is a simple experimental system for studying toxicological mechanisms at molecular and cellular levels which, in addition to various advantages, also provides for a controlled environmental and repeatable system (Park et al., 2016).
Leydig cells are the main producer of testosterone in mammalian testes. Leydig cells are used for the study of steroidogenesis because these cells express luteinizing hormone (LH) receptors and steroidogenic acute regulatory protein (StAR). Mouse testicular Leydig cells (TM3) are continuous, non-transformed cell lines that share morphological and functional properties with resident Leydig cells in situ. To investigate direct effects of any chemicals on steroidogenesis (testosterone biosynthesis), TM3 cells provide a good in vitro model system, and theymimic the process of steroidogenesis taking place in Leydig cells present in situ.
The aim of the present study was to investigate the direct effect of ZnO NP on the TM3 line and to compare these effects with bulk ZnO. We examined the uptake, intracellular behaviour, cytotoxicity, apoptosis, antioxidant enzymes activity and morphological changes caused by ZnO NPs in the cultured mouse TM3 cells.
Materials and methods
Chemicals and materials
ZnO NP dispersion (CAS no: 1314-13-2), bulk ZnO (cat no: 93632), trypsin (cat no: T4049), 3-(4,5-dimethylthiazol-2-yl)-2,5-diphenyl tetrazolium bromide (MTT; cat no: M2128), neutral red (NR; cat no: N4638), ethylene diamine tetra acetic acid, DAPI (cat no: D9542), Annexin V-FITC (cat no: A9210-20TST), gentamicin (cat no: G1272) and isopropanol (cat no: CAS-67-63-0) were purchased from Sigma Aldrich (St Louis, MO). 5,5-Dithiobis-(2-nitrobenzoic acid) and pyrogallol (cat no: 1649240) were obtained from Sisco Research Laboratories (India). Fetal bovine serum (FBS; cat no: SH30071.03) and Dulbecco’s Modified Eagle’s medium (DMEM): F12 1:1 (cat no: SH-30023.01) media were purchased from Hyclone (South Logan, UT). TRIzol was purchased from Invitrogen (Carlsbad, CA) and Maxima SYBR Green/ROX qPCR Master Mix was purchased from Fermantas, Thermo Fisher Scientific (Waltham, MA). All other chemicals purchased were of the highest analytical grade.
Characterization of ZnO NPs
ZnO NPs were characterized by dynamic light scattering (DLS), scanning electron microscopy (SEM) and transmission electron microscopy (TEM). Average hydrodynamic size and size distribution of particles suspended in distilled water were determined by DLS (UK). The micrograph of ZnO NPs was examined by SEM (Carl ZEISS, UK) and TEM ((Morgagni) 268D, Fei Electron Optics, Hillsboro, OR).
Cell culture and NP treatment
Mouse testis Leydig cell line TM3 was procured from National Centre for Cell Sciences (Pune, India). TM3 cells were cultured in DMEM: Ham’s F-12 (1:1) media supplemented with 10% heat inactivated FBS and 0.1% gentamicin (Sigma Aldrich). Cells were incubated in a carbon dioxide (CO2) incubator at 37°C, 95% humidity and 5% CO2. Cells were passaged twice a week. Culture media was changed after every 2 days. At 90% confluence, the cells were trypsinized (0.25%) and were subcultured into 25 cm2 flasks, 6 well plates or 96 well plates according to the experimental design. The cultured cells were finally treated with varying concentrations of ZnO NPs and bulk ZnO as per the experimental designs.
SEM analysis
TM3 cells were grown in six well cell culture plates for 48 h and incubated with the ZnO NPs (50 µg/ml) prepared in serum-free media for 2 h. After incubation, media was discarded and the six well plates were cut into small spherical shape with the help of gel borer from back side. This was followed by fixing cells with 2.5% glutaraldehyde, which was buffered in sodium cacodylate (pH: 7.4) for 2 h at 4°C. The samples were washed with sodium cacodylate buffer three times (each washing for 5 min); one drop of osmium tetraoxide was added to each sample and kept at 4°C for 1.5 h followed by dehydration through a series of alcohol concentrations (25%, 30%, 50%, 85%, 95% and 100%). The samples were then coated with gold and examined by SEM (Carl ZEISS, UK) (Osahor et al., 2017).
Cell viability assay
TM3 cells activity after ZnO NPs or bulk ZnO exposure was measured by two assays: MTT and NR . Mitochondrial function was measured using the MTT assay (Mosmann, 1983). The NR assay was used to evaluate the lysosomal function of the cells (Borenfreund and Puerner, 1985) with some modifications (Ahamed et al., 2011). The monolayer of the cells in 96-well plates was treated with 10 different concentrations (0, 1, 2, 5, 10, 20, 50, 100, 150 and 200 µg/ml) of ZnO NPs and bulk ZnO suspended in serum-free medium and incubated for three different exposure time periods (1, 4 and 12 h). The MTT assay was performed to assess cell viability by measuring the enzymatic reduction of yellow tetrazolium MTT to purple formazan crystals at 570 nm using a microplate reader (Microscan (MS5605A) Electronic Co-operation of India Ltd, India). A parallel set of experiments without cells were carried out to exclude the potential interaction of the NPs with the dyes used in MTT and NR assays. The data obtained demonstrated no interaction between the ZnO NPs tested and the dyes used for cytotoxicity assessment.
Cell morphology
Leydig TM3 cells were exposed to different concentrations (5, 10 and 50 µg/ml) of ZnO NPs and bulk ZnO for 4 h. After completion of the exposure period, the cells were observed by phase contrast inverted microscopy (Olympus, Japan) at 100× magnification. Morphological changes in TM3 cells induced by ZnO NP and bulk ZnO were observed, recorded and compared.
Antioxidative enzyme assay
Cell lysis
TM3 cells cultured in six well plates were treated with ZnO NP and bulk ZnO (1, 5, 20 and 50 µg/ml) for 4 and 12 h. The cells were, thereafter, harvested by scraping and then washing with phosphate buffer saline (PBS). Supernatant was removed from the cell suspension by centrifuging for 5 min at 800 × g. Cells were resuspended in ice cold PBS and sonicated (Branson Sonic Power Company, Danbury) for 30 s. This was followed by centrifugation for 5 min at 800 × g to obtain cell lysates that were used for measurement of superoxide dismutase (SOD) and catalase (CAT) activities. Cellular protein concentration was determined by the Lowry assay (Lowry et al., 1951).
Determining SOD activity
SOD activity in the cell lysates was assayed by measuring its ability to inhibit the auto-oxidation of pyrogallol (Marklund and Marklund, 1974). The rate of auto-oxidation of pyrogallol was measured after observing an increase in absorbance at 420 nm against a reference cuvette containing 3 ml of diethylene triamine pentaacetic acid (DTPA)-tris-hydrochloric acid (HCl) buffer (5 mMTris, 1 mM DTPA, pH 8.2) using a Specord 200 double beam UV/visible spectrophotometer (Analytik Jena AG, 07745 Germany). The volume of pyrogallol at which an increase in absorbance at the rate of 0.02 min−1 was chosen to be 60 µl for the reaction mixture. Reaction mixture contained 100 µl of cell lysate, 60 µl pyrogallol and DTPA-tris-HCl buffer to make a total volume of 3 ml. Absorbance was read against a blank containing sample and DTPA-tris-HCl buffer but not pyrogallol. The change in absorbance was recorded at 5 and 65 s at 420 nm.
Determining CAT activity
CAT activity was measured essentially following the method of Aebi (1984). Before the assay, all reagents were brought to room temperature. The initial absorbance A = 0.500 was set using 30 mM hydrogen peroxide (H2O2; 1 ml), and a decrease in absorbance was recorded at an interval of 30 s for 3 min. The reaction mixture contained 100 µl of cell lysate, 1 ml of 30 mM H2O2, and the total volume was made up to3 ml with phosphate buffer. The reaction was initiated by addition of H2O2, and the decomposition of H2O2 was observed as decrease in absorbance at 240 nm using a Specord 200 double beam UV/visible spectrophotometer. The enzyme activity in the cell was calculated using an extension coefficient of 39.4 M−1 cm−1 and expressed as unit per milligram of protein, where unit enzyme activity is 1 µ mole of H2O2 consumed/min.
Cell death analyses by Annexin V-FITC/DAPI staining
TM3 were first cultured on four chamber slides and exposed with various concentrations of ZnO NPs (5 or 20 µg/ml) for 4 h. After treatment, cells were fixed by incubating in 4% paraformaldehyde for 30 min. After washing in PBS, the cells were incubated in 1 µg/ml DAPI solution for 30 min in the dark, and then Annexin V-FITC (5 µl) was added to the samples followed by incubation at room temperature for 10 min in the dark. The cells were observed with a fluorescence microscope (Figure 8). Cells thatare in an early apoptotic stage will stain with the Annexin V-FITC conjugate. Intensity of green fluorescence is directly proportional to the degree of apoptosis. DAPI will stain the nucleus of the cells and fluorescence as a blue colour.
TEM analysis: Cellular uptake of ZnO NPs
To determine the intracellular distribution of ZnO NPs, ultra-thin cell sections were analysed using TEM (Morgagni 268D; Fei Electron Optics, USA) in All India Institute of Medical Science, New Delhi. Briefly, the TM3 cells were treated with 50 µg/ml of ZnO NPs for 4 h, washed two times with phosphate buffer, fixed in 2.5% glutaraldehyde for 2 h, dehydrated in an ethanol series and embedded in epoxy resin. Morphological characteristics of Leydig cells, (NPs) uptake, distribution and agglomeration within cells were investigated using ultra-thin sections placed on grids and examined by TEM.
Relative expression of steroidogenesis-related genes
Total RNA was isolated from Leydig cells using a TRIzol (Ambion) method (Rio et al., 2010). Briefly,the TM3 cell monolayer was rinsed with ice cold PBS once. Cells were lysed directly in a culture dish by adding 0.5 ml of TRIzol reagent per 3.5 cm diameter dish and removed with cell scraper. Cell lysate was passed several times through a pipette followed by vortex mixing for 5 min at room temperature. The samples were incubated for 5 min at room temperature, followed by addition of 0.2 ml of chloroform (HiMedia, Einhausen, Germany) per 1 ml of TRIzol and centrifuged at 12,000 × g for 15 min at 2–8°C. The aqueous phase was transferred to a new tube, 0.6-ml isopropyl alcohol was added per ml TRIzol, and the tube contents were mixed and incubated for 10 min at room temperature. The samples were centrifuged at 12,000 ×g for 10 min at 2–8°C, and the RNA pellets were washed by adding 1-ml of 75% ethanol per 1 ml TRIzol, after which samples were vortexed and centrifuged at 8500 × g for 5 min at 2–8°C. The ethanol was removed and the pellets were left to air dry for 15 min. The dried RNA pellet was dissolved in 40 µl RNase free water. cDNA was synthesized from 1.5 µg of total RNA. Quantitative real-time PCR (RT-PCR; Applied Biosystems 7500 Fast RT-PCR System) was performed using Maxima SYBR Green/ROX qPCR Master Mix according to the manufacturer’s instructions. Details of primers are shown in Table 1. The expression of each gene was analyzed in triplicate and normalized with glyceraldehyde-3-phosphate dehydrogenase, which was used as a housekeeping gene. The relative gene expression level was evaluated by the 2−ΔΔCt method.
Primers used in RT-PCR.

GAPDH: glyceraldehyde-3-phosphate dehydrogenase; StAR: steroidogenic acute regulatory protein; P450scc: cytochrome P450 side-chain cleavage enzyme; SOD: superoxide dismutase; RT-PCR: real-time PCR.
Testosterone production
TM3 cells were pre-incubated for 24 h in 48 well plates and then treated with different concentrations (0.5, 1 and 2 µg/ml) of ZnO NPs and bulk ZnO for 12 h. Along with NP treatment, Leydig cells were stimulated with 100 ng/ml of LH prepared in serum containing medium. After the 12-h incubation period, supernatants from the control and treated groups were collected, centrifuged at 800xg at 2–8°C, and the supernatants were used for the testosterone production assay via a commercially available ELISA kit (Endocrine Technologies, Newark, CA) to investigate and compare the steroidogenic effect of ZnO NP with bulk ZnO and control as per the manufacturer’s instructions. The assay range was between 0.2 ng and 20 ng/ml testosterone.
Statistical analysis
Statistical analyses were performed using the GraphPad Prism software (GraphPad Software Inc., San Diego, California, USA). All the data were expressed as mean ± standard error of the mean and were analysed by one-way analysis of variance followed by Tukey’s multiple comparison test (Schlattmann and Dirnagl, 2010). A minimum of three independent experiments were performed for each experimental condition tested. The value of p < 0.05 was considered to be statistically significant.
Results
Characterization of ZnO NPs
ZnO NPs were characterized based on their size and shape.
Characterization by SEM and TEM
TEM is one of the most effective methods to analyse the size and morphology of NPs. The SEM and TEM images of ZnO NPs indicated that the particles were spherical in shape (Figure 1(a) and (b)). The size of ZnO NPs ranged from 20 nm to 40 nm (Figure 1(b)) as indicated by TEM analysis.
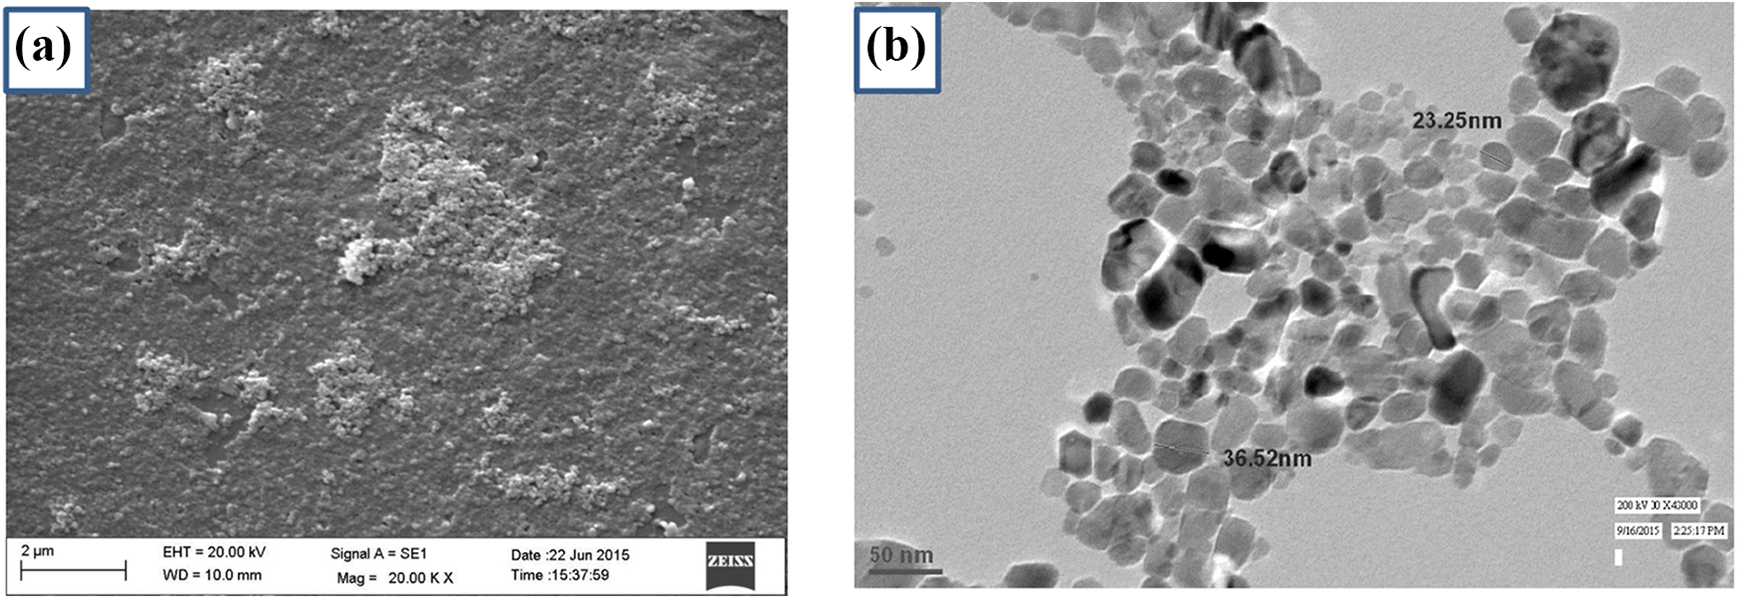
Characterization of ZnO NPs by SEM and TEM. (a) SEM micrograph showing ZnO NPs are spherical in shape. (b) TEM micrograph of ZnO NPs illustrate that size of the NPs is ranging between 20 nm and 40 nm. ZnO: zinc oxide; NP: nanoparticle; SEM: scanning electron microscopy; TEM: transmission electron microscopy.
Characterization by DLS
Average hydrodynamic size and size distribution of particles in suspension were determined by DLS using a Zetasizer Nano-ZS90 (Malvern Instruments Ltd, Malvern, UK). DLS measures the size of particles typically in the submicron region and also referred to as photon correlation spectroscopy. The average hydrodynamic size of ZnO NPs was 75 nm (Figure 2), with uniform size distributions in Milli-Q water.

Dynamic light scattering graph showing hydrodynamic diameter of ZnO NPs. ZnO: zinc oxide; NP: nanoparticle.
NP cell interaction analysis by SEM
Interaction of NPs with TM3 cells was observed by SEM. The control TM3 cells were healthy, flat and confluent (Figure 3(a) and (b)). The NP-treated samples showed physical interaction between TM3 cells and ZnO NPs. NPs adhered to the TM3 cell surface, but no intertwining of microvilli with the NPs was observed. Instead, there were some ‘bumps’ observed on the TM3 cell membranes after their incubation with the NPs, as shown in Figure 3(d). ZnO NPs at shorterincubation periods (2 h) caused aberration and detachment of cells from the surface as indicated by the arrows in Figure 3(c).

SEM images of TM3 cells after 2-h exposure to the ZnO NPs. (a) and (b) control TM3 cells not treated with ZnO NPs and (c) or (d) treated with 50 µg/ml of ZnO NPs. Control TM3 cells were healthy, fiat and well spreaded ((a) or (b)). (a) The TM3 cells not treated with ZnO NPs are flat and well spread. Cells treated with ZnO NPs are large aberration in cell morphology, detachment from surface (c) and bumps stimulation (d) was found indicated by red arrow. ZnO: zinc oxide; NP: nanoparticle; SEM: scanning electron microscopy; TM3: mouse testicular Leydig cells.
Cell viability assay
TM3 cells were exposed to ZnO NPs or bulk ZnO (1–200 µg/ml) for 1, 4 or 12 h time period, and cytotoxicity was determined with MTT and NR assays. Results obtained from both cytotoxicity tests are presented in Figures 4 and 5. The MTT and NR assay results demonstrated a concentration and time-dependent cytotoxicity after exposure to ZnO NPs and bulk ZnO. Our results demonstrated that ZnO NPs were highly cytotoxic for TM3 cells even at lower concentrations and shorter incubation times. For differentiating the cytotoxicity of ZnO NPs due to ZnO or the nano size range, we compared cytotoxicity of ZnO NPs with bulk ZnO and found, in comparison to bulk ZnO, that ZnO NPs showed 15–20% more cytotoxicity. A significant decrease in cell viability was observed at 2 and 50 µg/ml concentration after 1-h incubation for ZnO NPs and bulk ZnO, respectively. It was observed that the difference was statistically significant (p < 0.05) and the ZnO NPs showed higher toxicity to testicular Leydig cells.
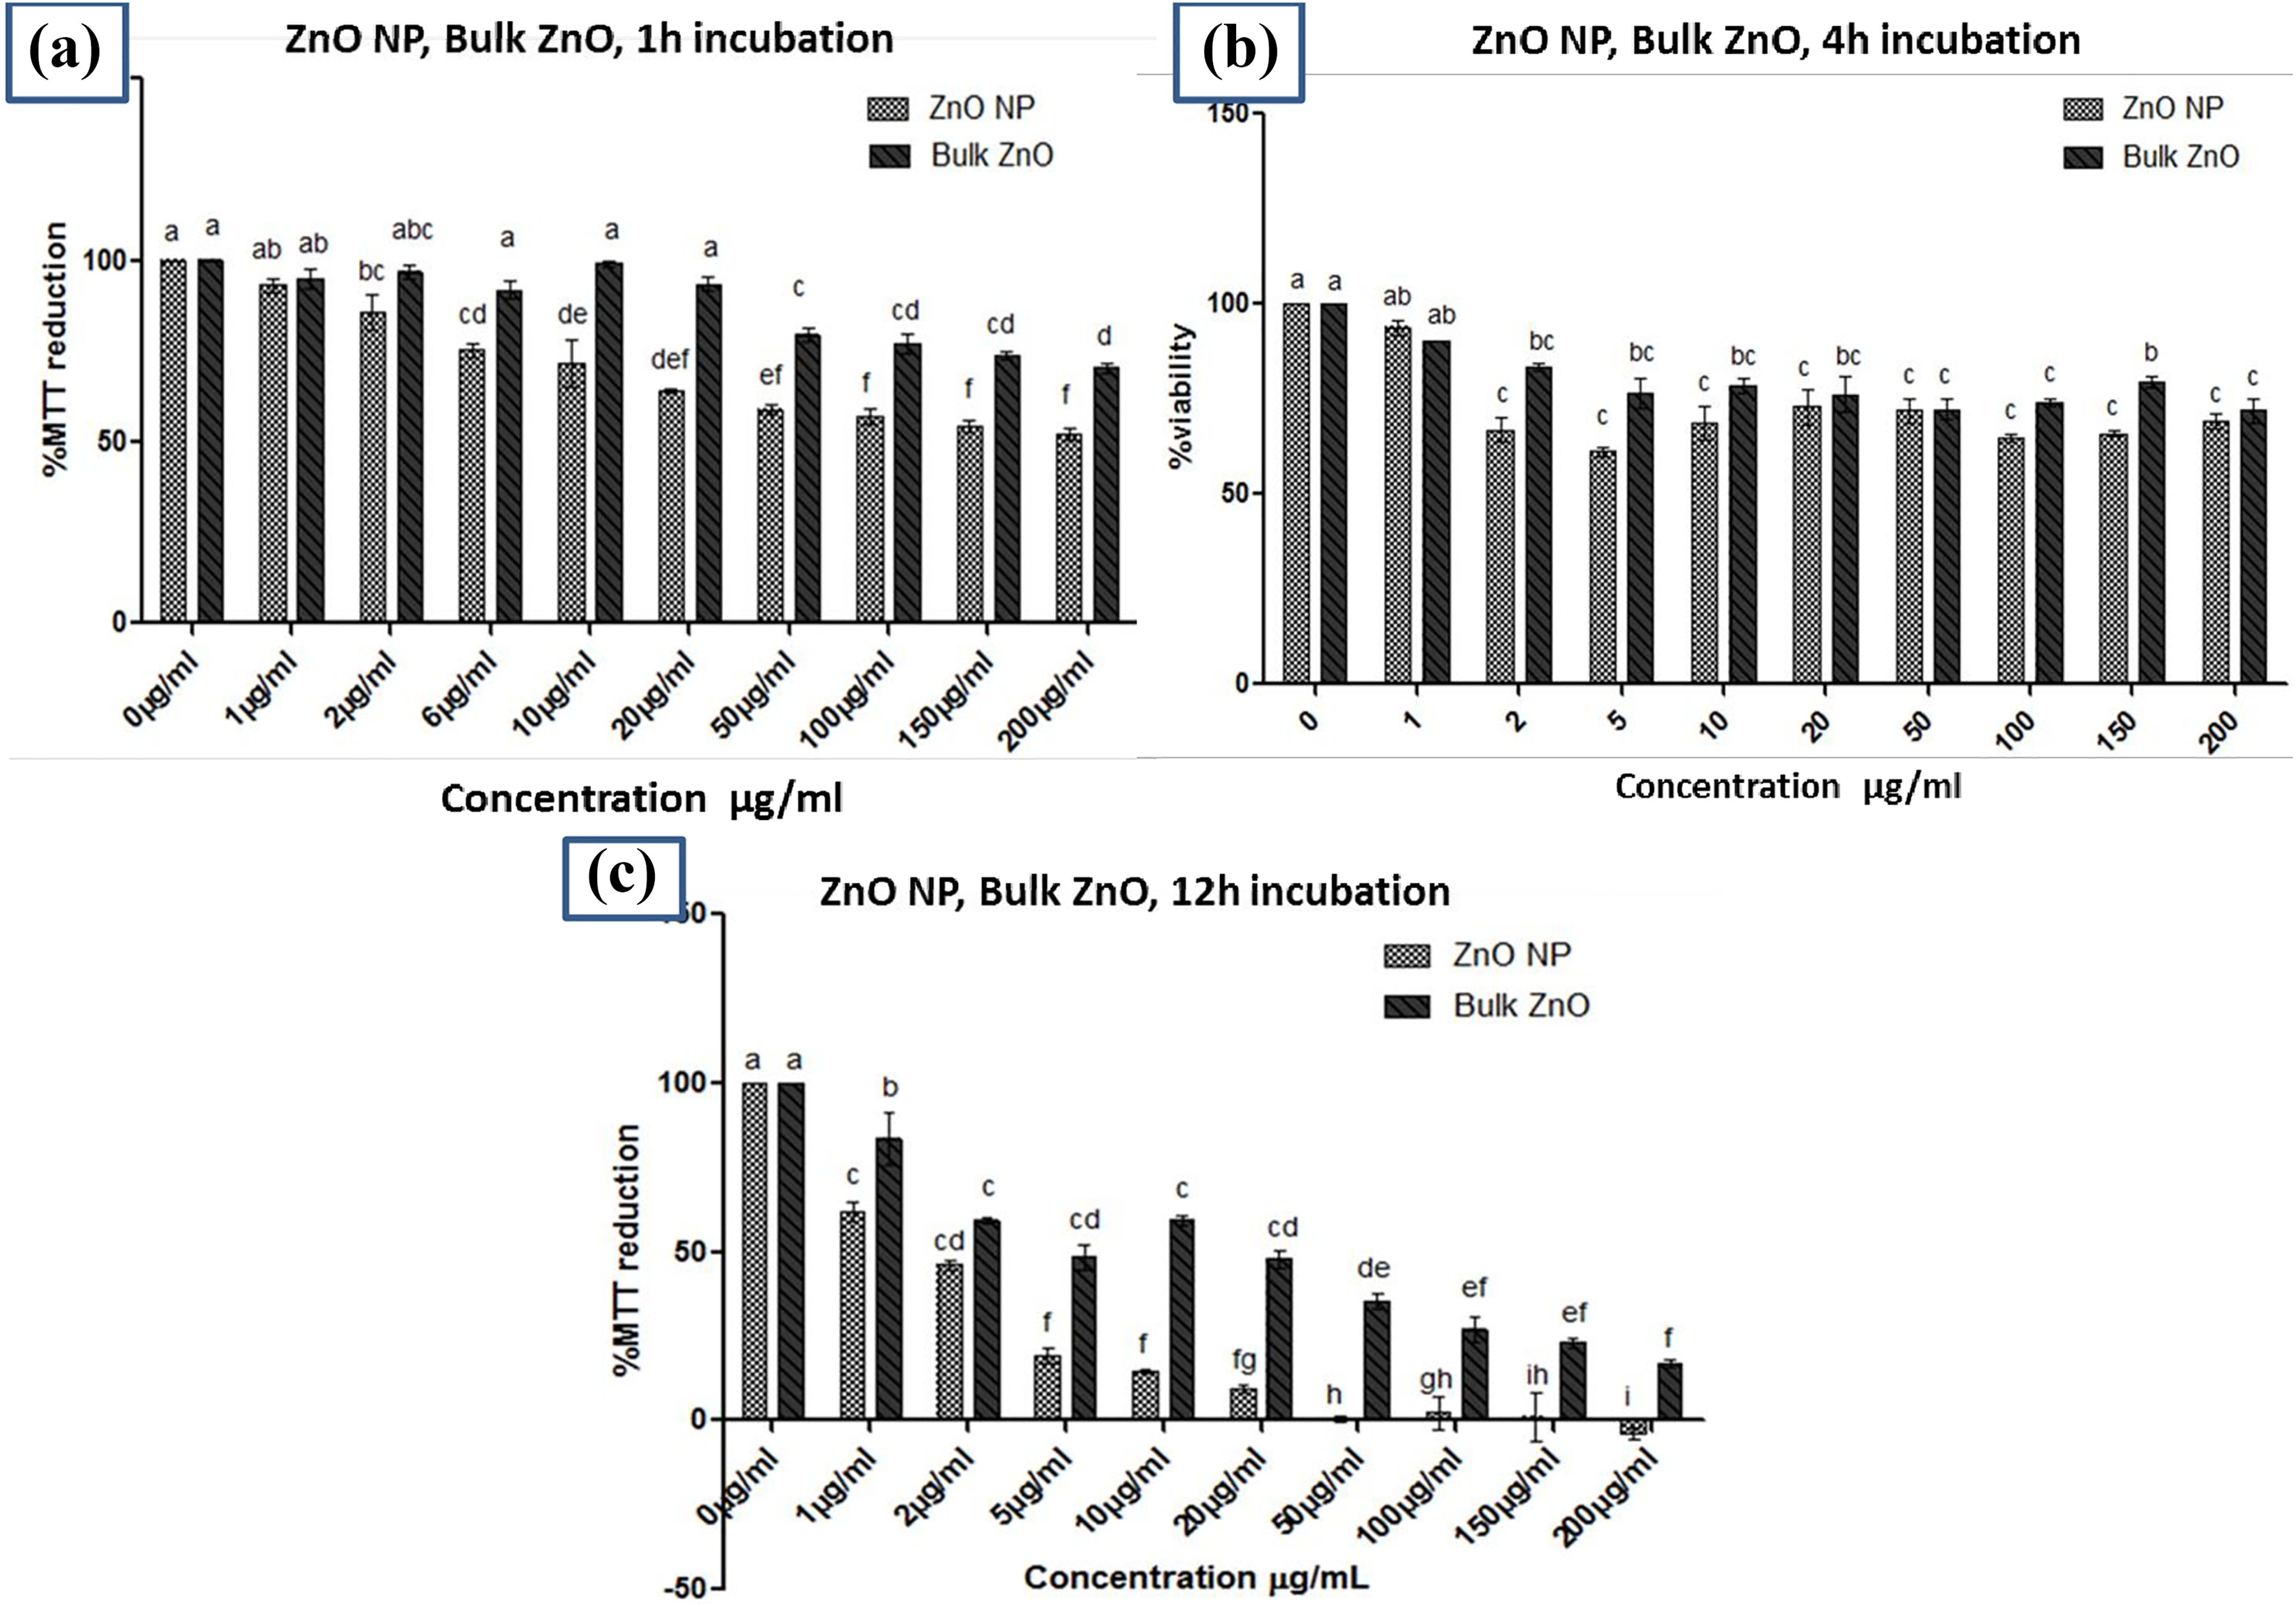
Cytotoxicity of ZnO NPs and bulk ZnO compared in TM3 cells treated with 0–200 µg/ml concentrations by MIT assay for (a) 1 h, (b) 4 h and (c) 12 h. Results showed that the ZnO NPs were more cytotoxic (approximately 15.20%) than bulk ZnO. All values represent mean ± SD of three individual experiments (n = 3). Bar with different superscripts represents the significant difference at p < 0.05. ZnO: zinc oxide; NP: nanoparticle; TM3: mouse testicular Leydig cells; SD: standard deviation.
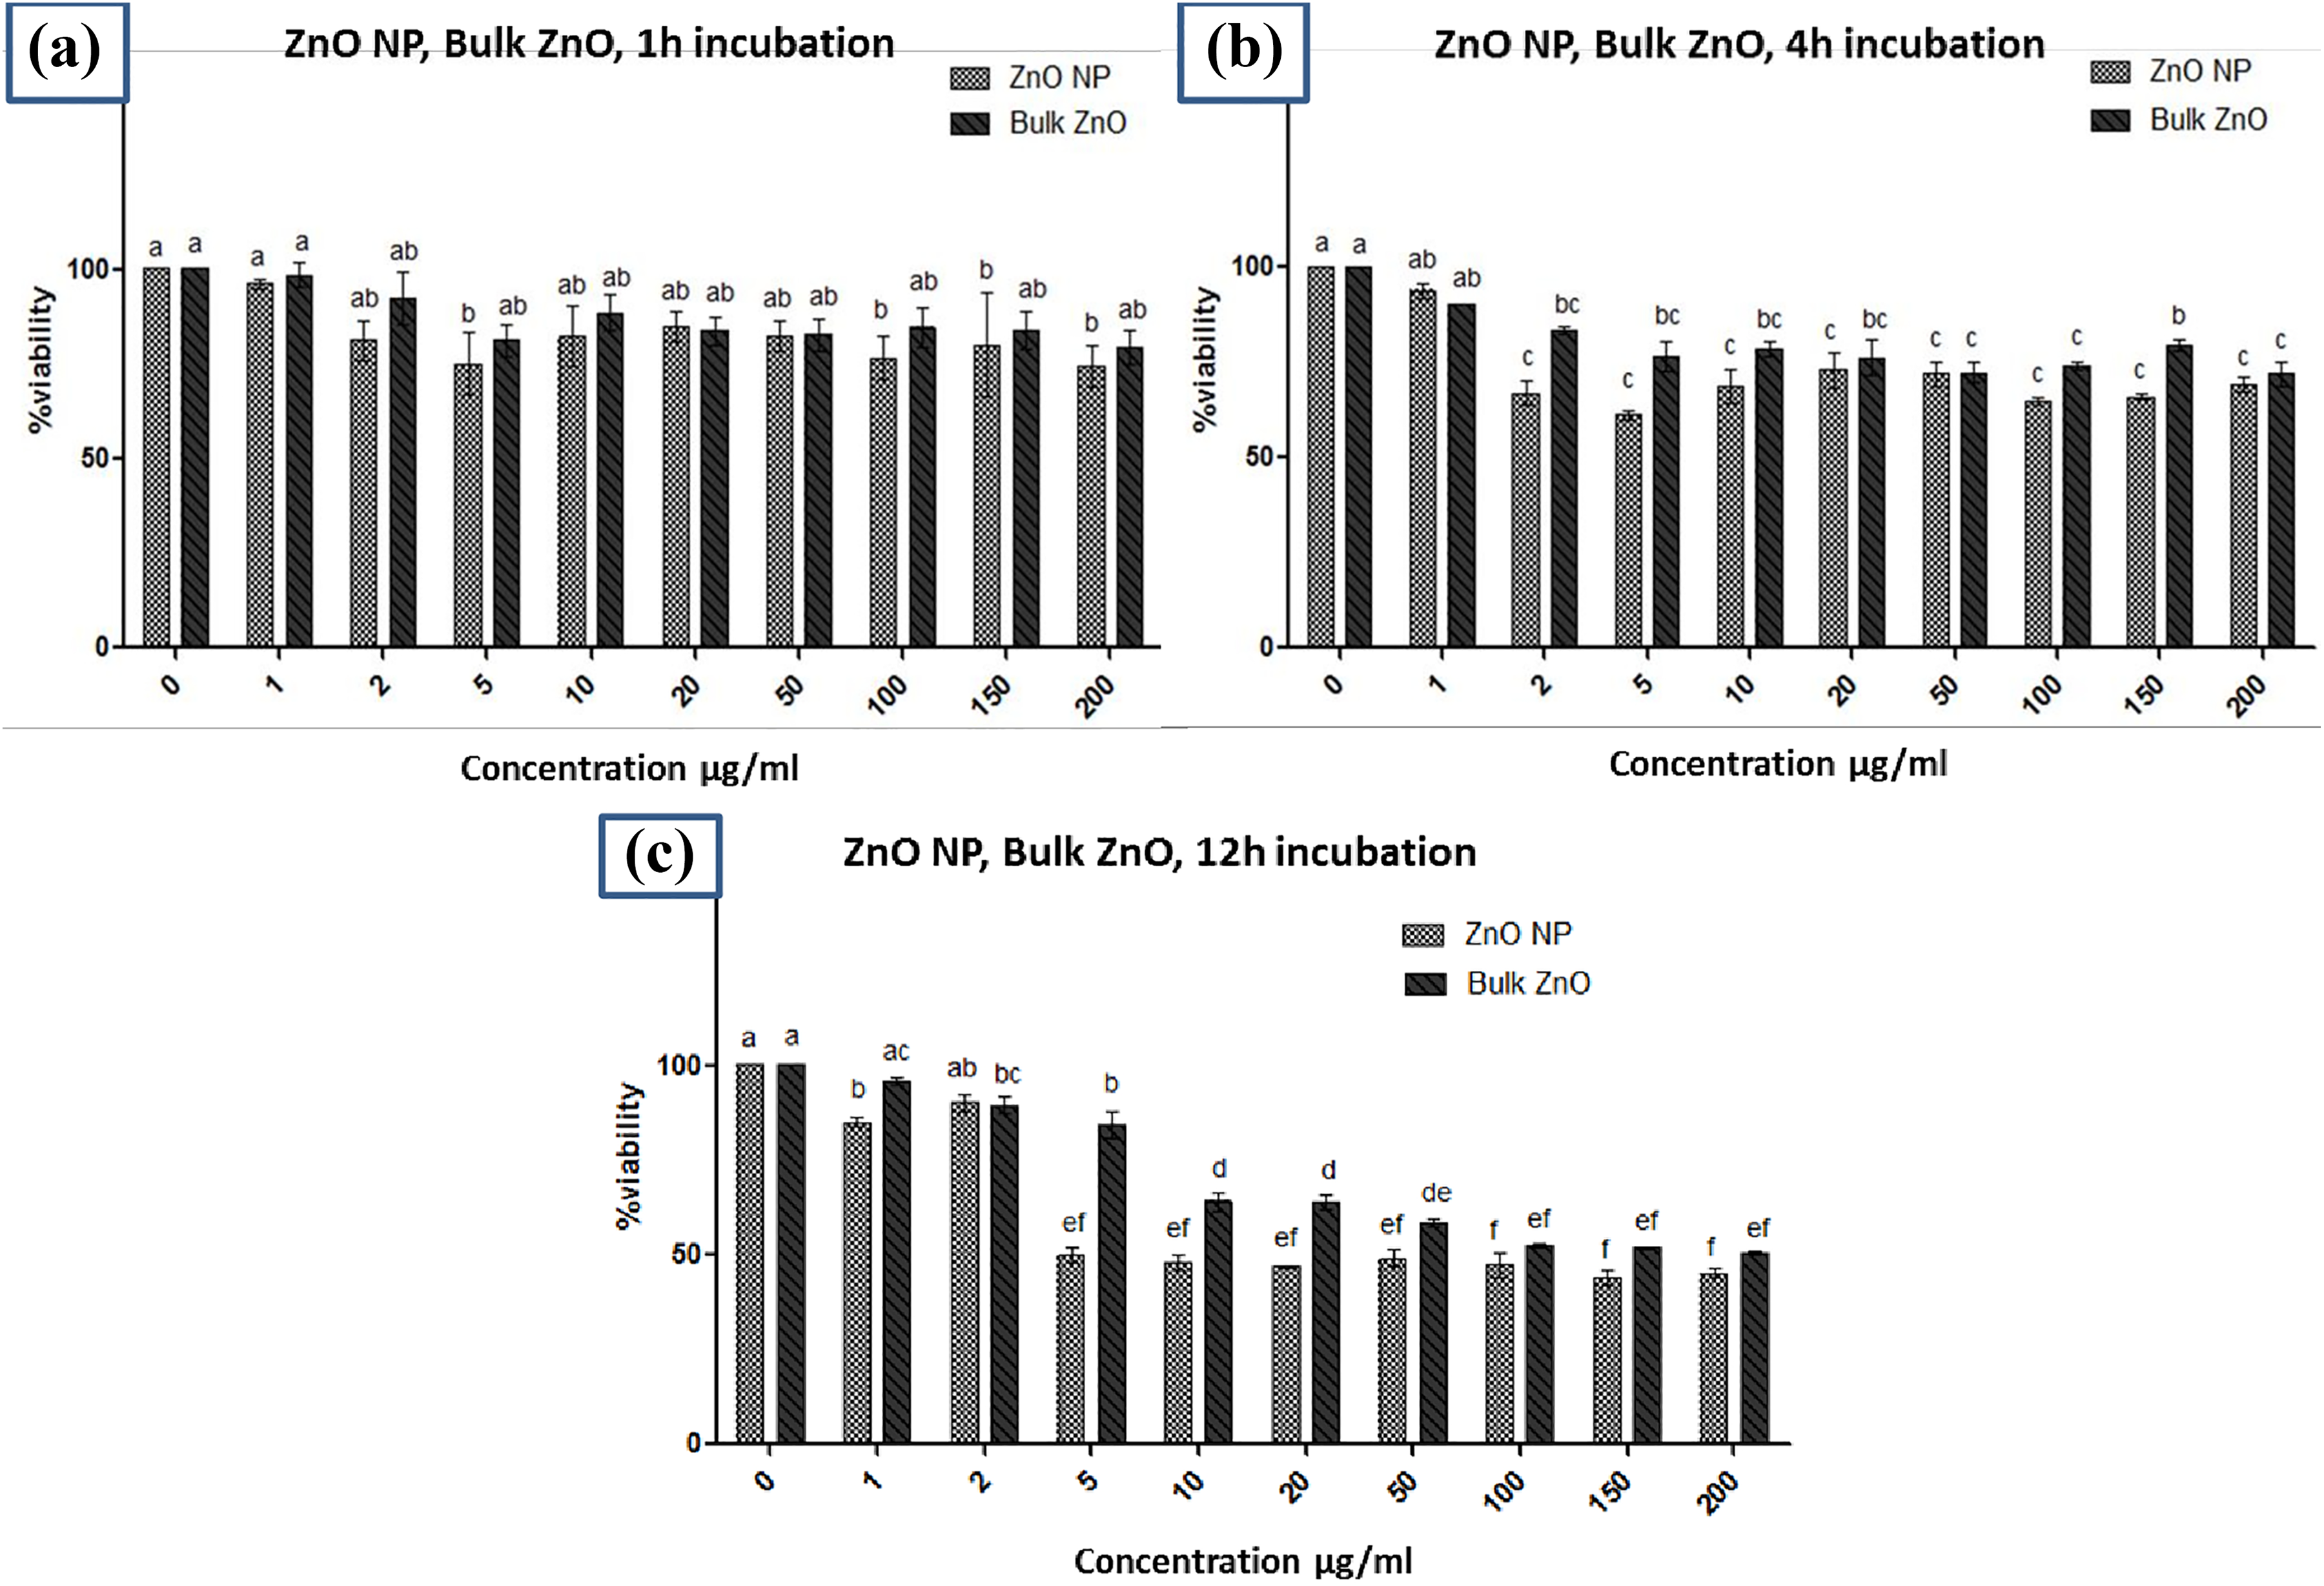
NR assay for evaluation of comparative cytotoxicity of ZnO NPs and Bulk ZnO in TM3 cells. Cells were exposed with 0–200 µg/ml concentration of each of NMs at different incubation periods (a) 1 h, (b) 4 h and (c) 12 h. All values represent mean ± SD of three individual experiments (n = 3). Bar with different superscripts represents the significant difference at p < 0.05. ZnO: zinc oxide; NP: nanoparticle; TM3: mouse testicular Leydig cells; SD: standard deviation; NR: neutral red; NM: nanomaterial.
Cell morphology
TM3 cells were exposed to ZnO NPs and bulk ZnO (5, 10, 20 and 50 µg/ml) for 4 and 12 h. The cytotoxicity of ZnO NPs was observed by morphological changes in TM3 cells. Figure 6 represents the morphology of TM3 cells (control and treated with different concentrations of ZnO NPs and bulk ZnO). Loss in the normal morphology started gradually and appeared after a 4-h incubation period and at 5 µg/ml of ZnO NP treatment. The normal morphology was observed up to 10 µg/ml with bulk ZnO treatment. With a concomitant increase in exposure time and concentration, the cells retracted into spherical shapes and formed clusters in media after detachment from the surface. It may be concluded that compared to bulk ZnO, their nano form caused alterations in normal cell morphology even at the lower concentrations tested.
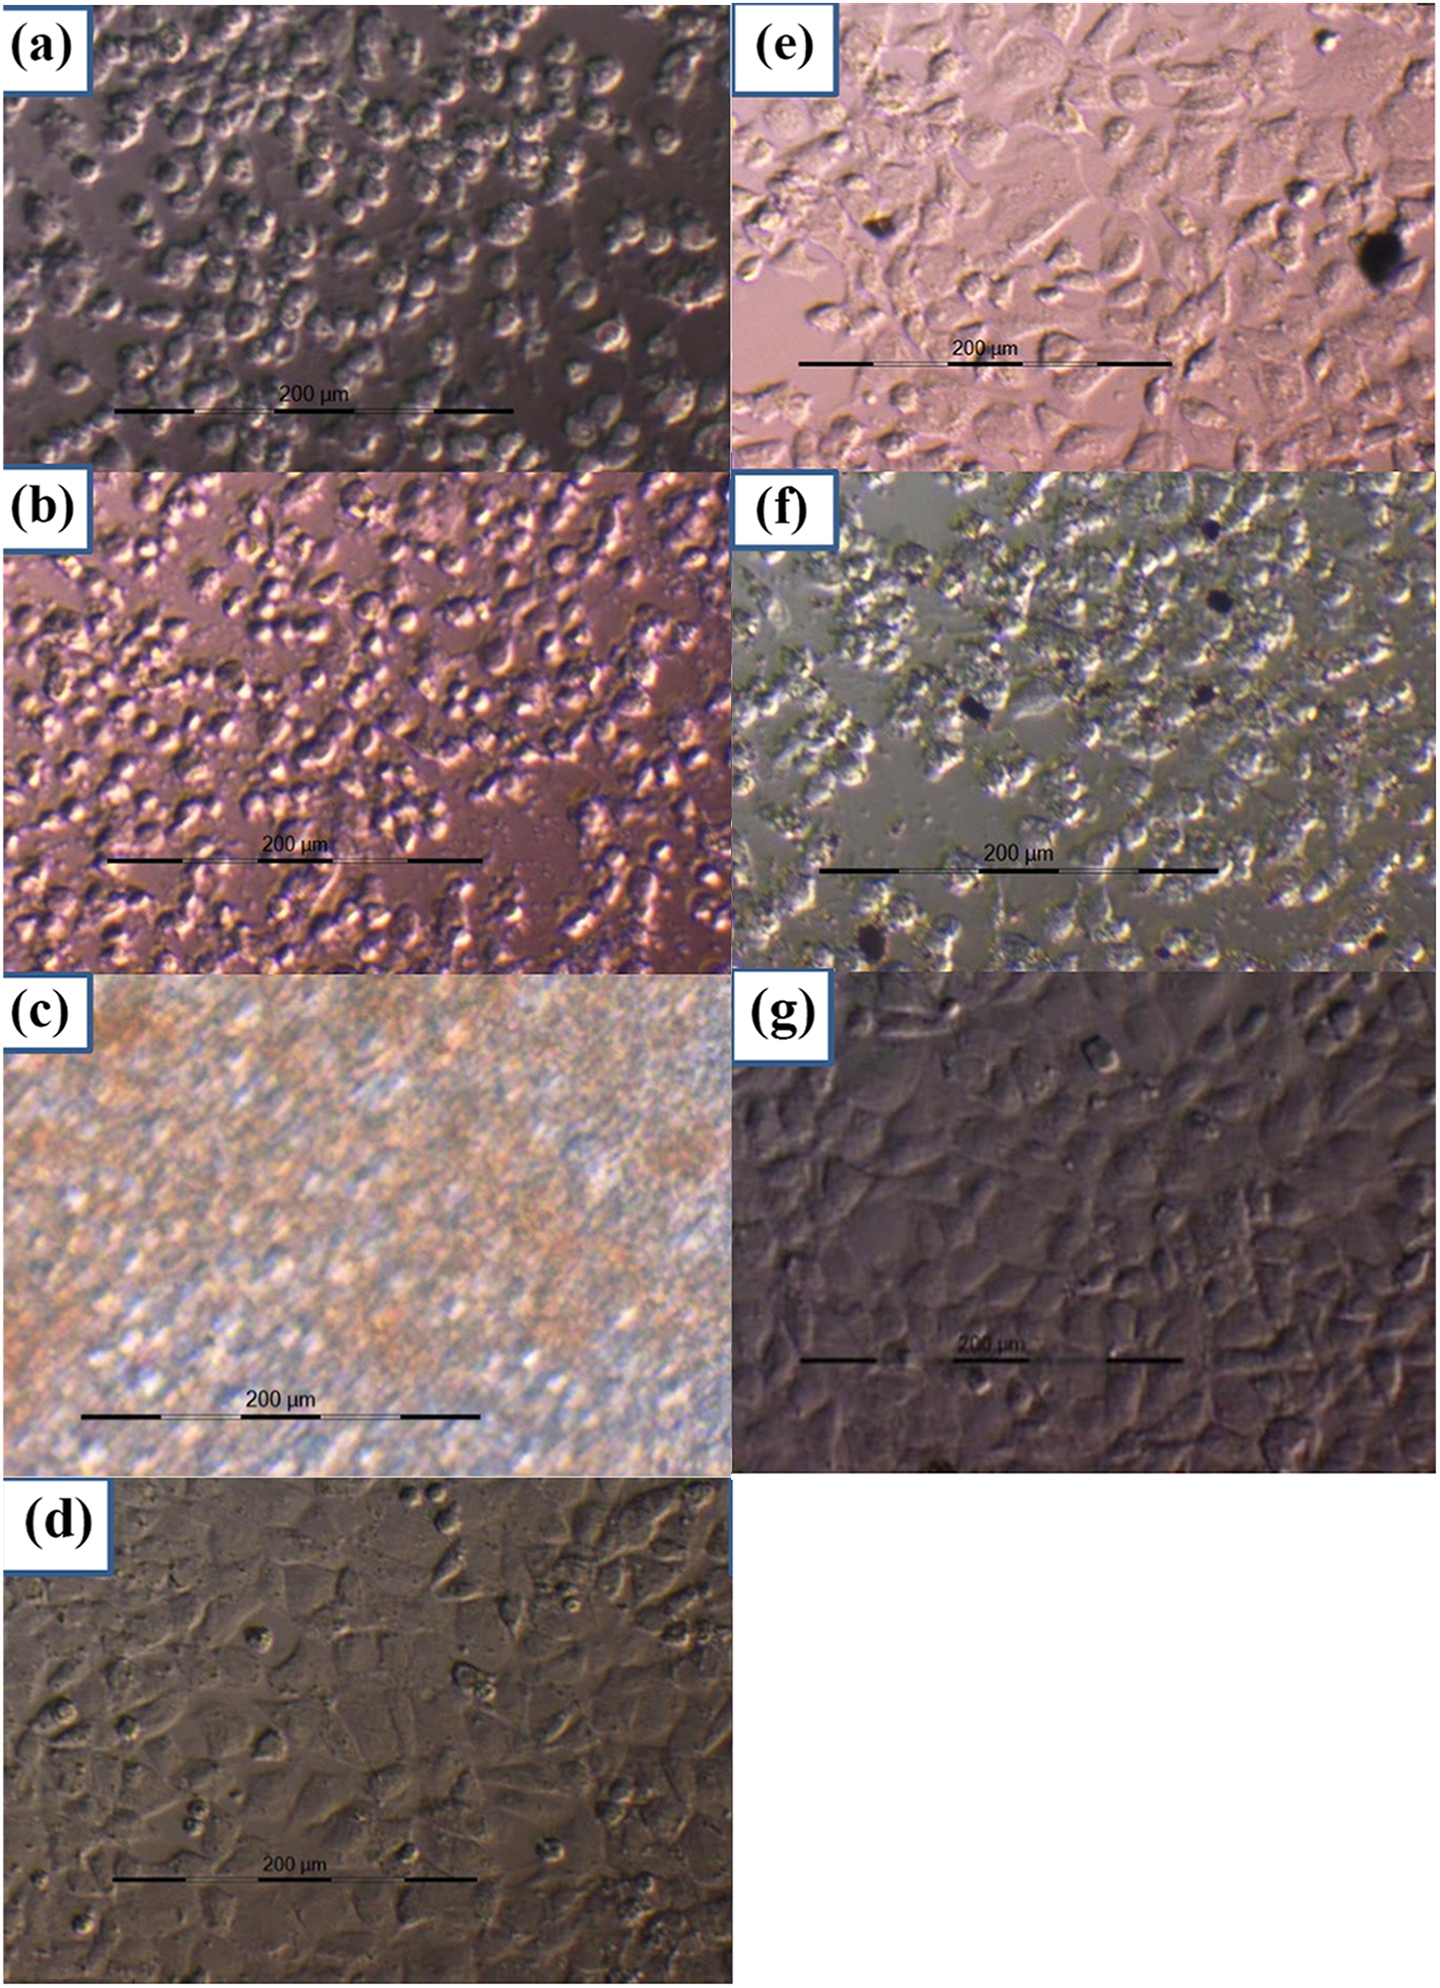
Morphological changes in TM3 cells induced by ZnO NPs and bulk ZnO were compared after 4-h incubation with (a) 5 µg/ml ZnO NPs, (d) 5 µg/ml bulk ZnO, (b) 10 µg/m1 of ZnO NPs, (e) 10 µg/ml of bulk ZnO, (c) 50 µg/m1 of ZnO and (f) 50 µg/ml of bulk ZnO. (g) The control TM3 cells. Optical micrograph indicated that compared to bulk ZnO, their nano form was causing alteration in normal cell morphology at lower concentration. ZnO: zinc oxide; NP: nanoparticle; TM3: mouse testicular Leydig cells.
Analysis of ZnO NP uptake by TEM
Morphologic characteristics of the cells and the distribution and agglomeration state of the particles within the cells were investigated using ultra-thin sections placed on grids and examined by TEM. The cultured cells were treated with 50 µg/ml ZnO NPs for 4 h. TEM images showed that ZnO NPs were taken up by TM3 cells, which was observed in the form of randomly dispersed agglomerates in the cytoplasm and also observed crossing nuclear membranes (Figure 7(b)). Cells that were not treated with NPs appeared healthy with intact nuclei, cytoplasm and mitochondria (Figure 7(a)). ZnO NP-treated cells (50 µg/ml for 4 h) characteristically showed NPs agglomeration, accumulation of autophagosomes, autolysosomes (Figure 7(b) to (e)) and damaged mitochondria in TM3 cells (Figure 7(b)). Additionally, the ZnO NPs were observed to cross into the nucleus of the TM3 cells (Figure 7(b)). ZnO NP treatments have also shown the presence of crescent shape vacuoles (Figure 7(c)) and double-layered membrane bounded autophagic vacuoles containing cellular debris (Figure 7(c)).
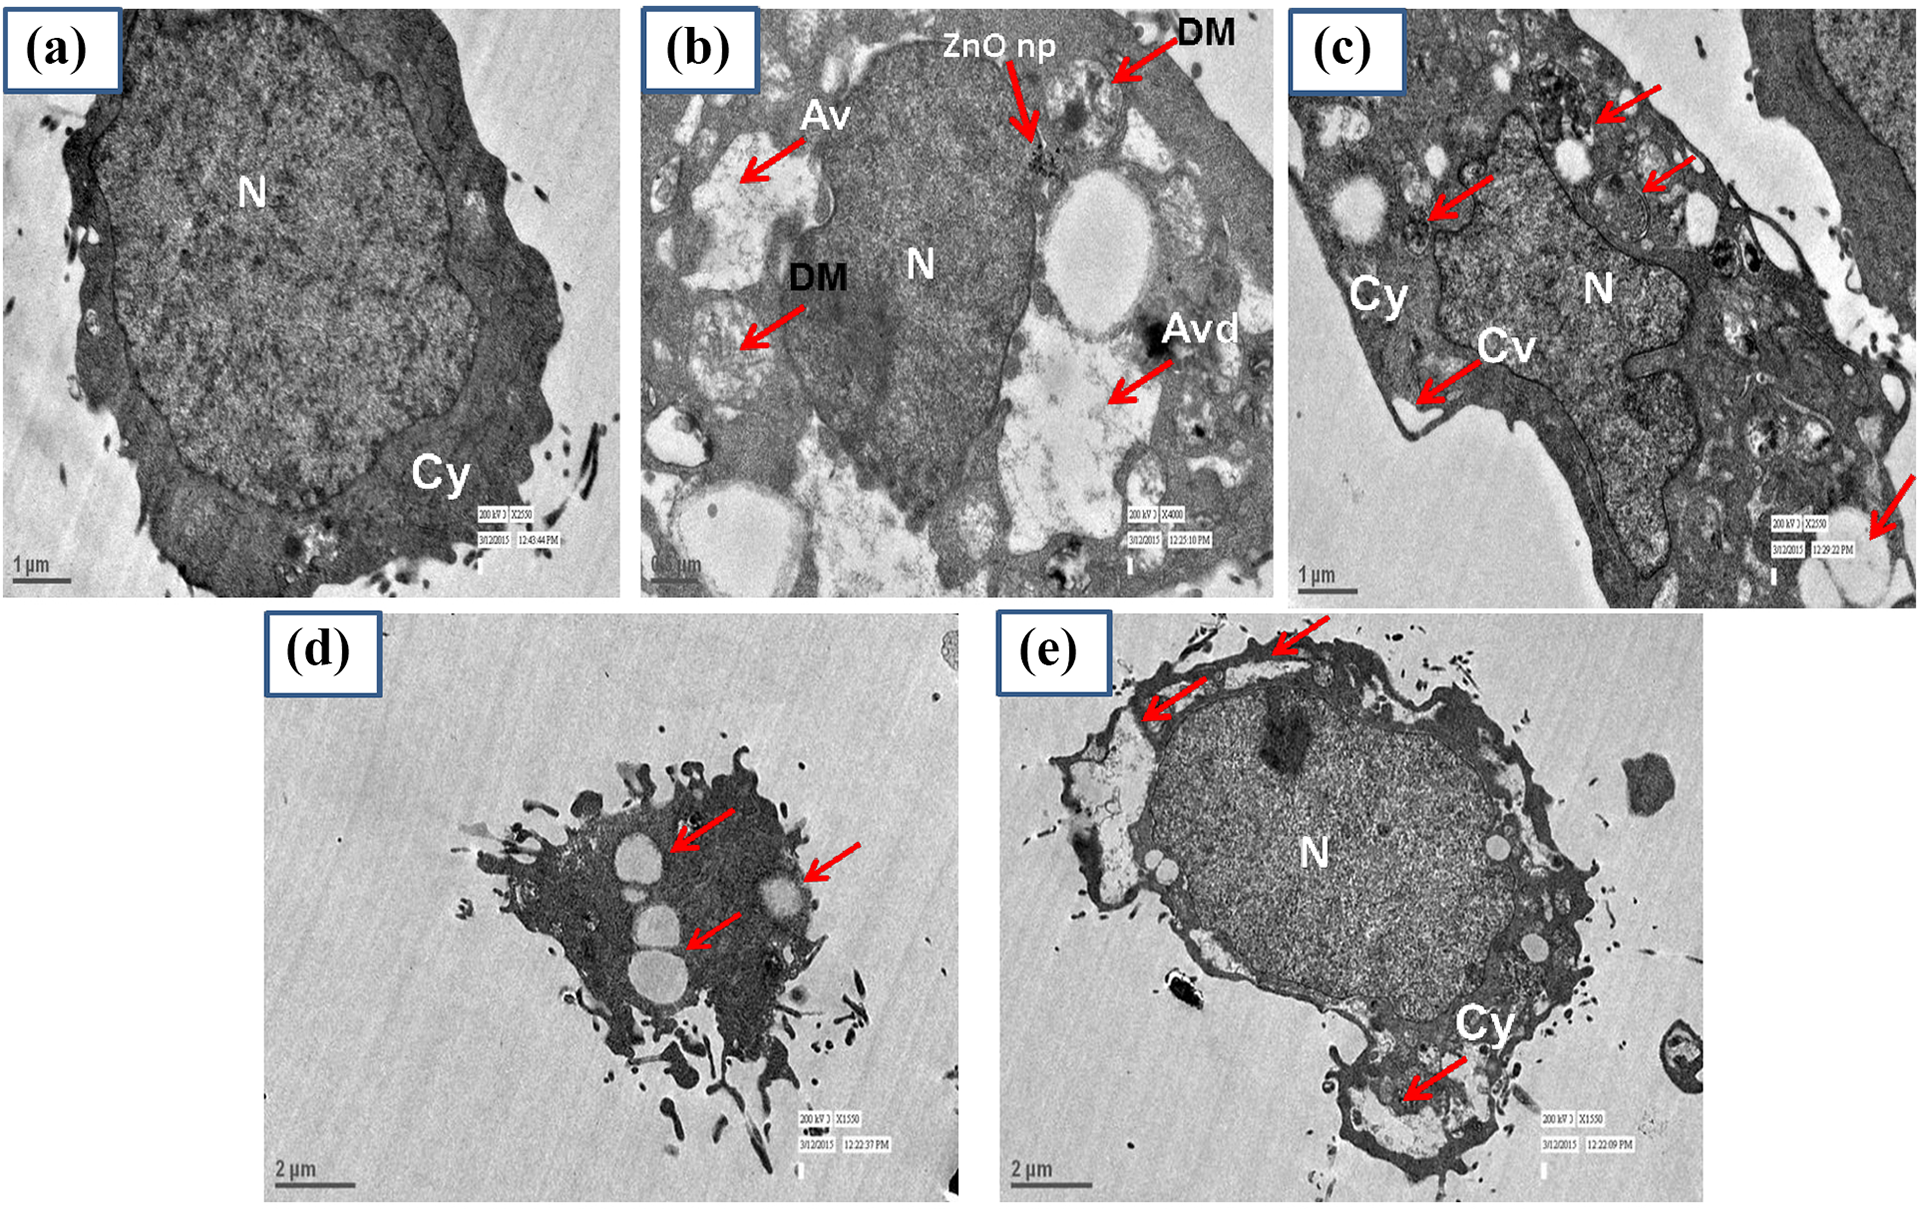
Thin-section TEM of TM3 cell incubated with 50 µg/m1 ZnO NPs for 4 h. (a) control TM3 cells. (b) to (e) ZnO NP-treated cells showing AV; DM indicated with red arrows. Cellular uptake of ZnO NPs induces accumulation of autophagusomos and autolysosomes. AV: autophagic vacuoles; N: nucleus; Cy: cytoplasm; DM: damaged mitochondria; ZnO: zinc oxide; NP: nanoparticle; TEM: transmission electron microscopy; TM3: mouse testicular Leydig cells.
Annexin V/DAPI staining
To directly assess cell death after exposure to the NPs, attached cells were stained with DAPI (1 µg/ml) and Annexin V-FITC, and plasma membrane integrity and nuclear morphology were evaluated under a fluorescence microscope. Cells with clearly or partially condensed chromatin and/or fragmented nuclei were counted as apoptotic cells. Annexin V-FITC is a fluorescent probe that binds to phosphatidylserine in the presence of calcium. At the onset of apoptosis, phosphatidylserine, which is normally found on the internal part of the plasma membrane, translocates to the external portion of the membrane to which Annexin V-FITC binds and is stained green. Figure 8 shows the morphology of TM3 cells stained with Annexin V-FITC/DAPI. When the TM3 cells were treated with 5 or 20 µg/ml of ZnO NPs, the cell viability was remarkably decreased compared to control. With Annexin V-FITC/DAPI staining, we observed that apoptosis was increased in ZnO NP-treated cells. Moreover, cell shrinkage and irregular morphology were also observed.
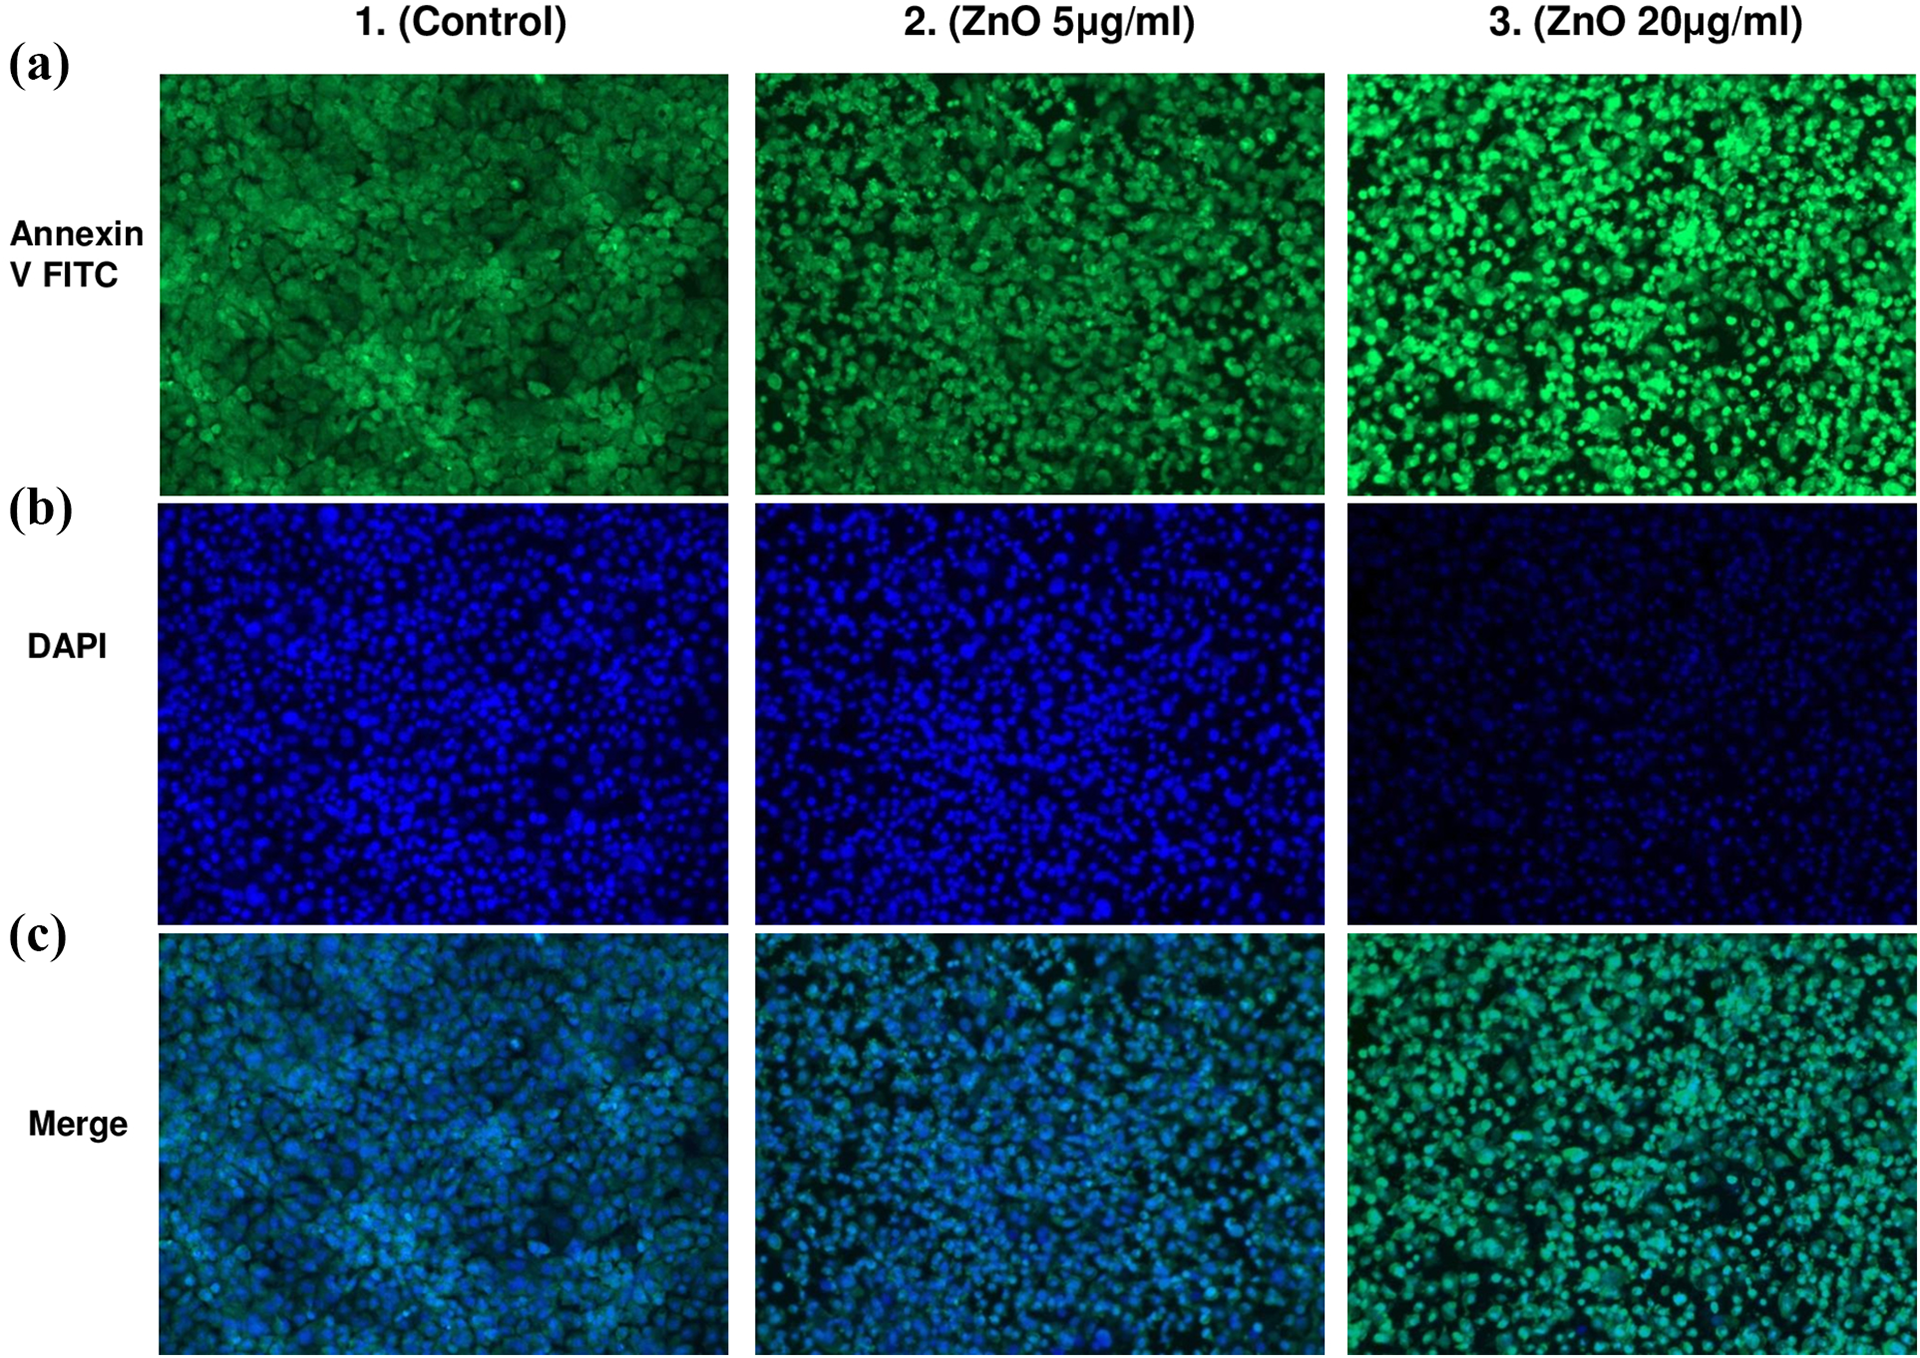
Characterization of NPs induced death in TM3 cells. (a) TM3 cells stained with FITC. (b) TM3 cells stained with DAPI. (c) Merge (1) control, (2) 5 µg ZnO and (3) 20 µg ZnO. ZnO: zinc oxide; NP: nanoparticle; TM3: mouse testicular Leydig cells.
Antioxidant enzymes activity
The activity profiles of SOD and CAT in the TM3 cell lysate upon treatment with ZnO NPs as well as with their respective bulk form are presented in Table 2. At 1 and 5 µg/ml concentrations after 4-h incubation, ZnO NPs showed 48% and 27% significant (p < 0.01) increase in SOD activity, respectively. However, with the bulk ZnO, we observed an increase of only up to 16% and 11% (non- significant) in SOD activity when tested after a 4-h incubation period at 1 and 5 µg/ml concentrations, respectively. After 12-h incubations, a 20%, 18% and 11% increase in SOD activity was recorded, respectively, with 5, 20 and 50 µg/ml of ZnO NP exposure. Broadly speaking, there was no significant (p < 0.05) difference in SOD activity for all concentrations and incubation periods tested with the bulk ZnO. A significant (p < 0.05) increase in CAT activity; 36% (1 µg/ml), 23% (5 µg/ml), 17% (20 µg/ml) and 16% (50 µg/ml) in ZnO NP-treated group; and 27% (50 µg/ml) in bulk ZnO group was observed after 4-h incubation. Moreover, after a 12-h incubation period, a significant (p < 0.05) increase in 46% (5 µg/ml), 21% (20 µg/ml) and 27% (50 µg/ml) in the ZnO NP-treated group and 32% (1 µg/ml), 62% (5 µg/ml), 49% (20 µg/ml) and 27% (50 µg/ml) in bulk ZnO-treated group was measured. A significant (p < 0.05) difference in CAT activity between ZnO NP- and bulk ZnO-treated groups was found following 12-h incubation. We also observed that in general with increasing concentrations of ZnO NPs, both SOD and CAT activity first increased and then decreased.
Activity profile of SOD and CAT in TM3 cells exposed with various concentrations of ZnO NPs and bulk ZnO.

SOD: superoxide dismutase; CAT: catalase; TM3: mouse testicular Leydig cells; ZnO: zinc oxide; NP: nanoparticle; SEM: standard error of the mean.
aSignificant difference in the enzyme activity compared with control. All values represent mean ± SEM of three individual experiments (n = 3); p value ≤ 0.05.
RT-PCR in TM3 cell line
In this study, we further analysed two common steroidogenesis-related genes, StAR and cytochrome P450 side-chain cleavage enzyme (P450scc), and one antioxidant enzyme-related gene, SOD (Figure 9). To understand the effect of exposure time period and concentrations, we analysed data at two different concentrations (1.0 or 5.0 µg/ml) and at two different exposure periods (4 or 12 h). At the 4-h incubation period, an increase in 183 fold or 215 fold and 94 fold or 58 fold was observed in the expression of StAR gene on treatment of 1 and 5.0 µg/ml of ZnO NPs or bulk ZnO treatment, respectively. But after the 12-h incubation period, there was a reduction in fold increase of StAR gene expression levels, recorded 24 fold at 1 µg/ml of ZnO NPs compared with 4 h. However, and surprisingly with bulk ZnO at 1 µg/ml concentration, there was a significant (p < 0.05) increase of 534 fold in StAR mRNA levels after 12-h incubation. When bulk ZnO concentration was increased from 1 µg/ml to 5 µg/ml, StAR mRNA expression decreased. A very high fold increase was also recorded in relative expression of P450scc, 275 fold and 129 fold for 1 and 5 µg/ml concentrations of ZnO NP treatment, respectively, after the 4-h incubation period. After the 12-h incubation period, no significant difference was observed in the expression of P450scc with ZnO NP treatment. It was also observed that bulk ZnO treatment increased the P450scc expression at 5 µg/ml concentration and at 1 µg/ml concentration there was no difference vs. control after 4-h incubation. These data suggest that ZnO NPs have a steroidogenic effect at lower concentrations and incubation periods, and as the concentration and the incubation period increased, the steroidogenic ability of TM3 cells decreased. Bulk ZnO showed steroidogenic responses at higher concentrations and incubation times compared with ZnO NPs. Relative expression of the SOD gene was decreased after 4-h incubation; however, no change was observed after a 12-h incubation period.
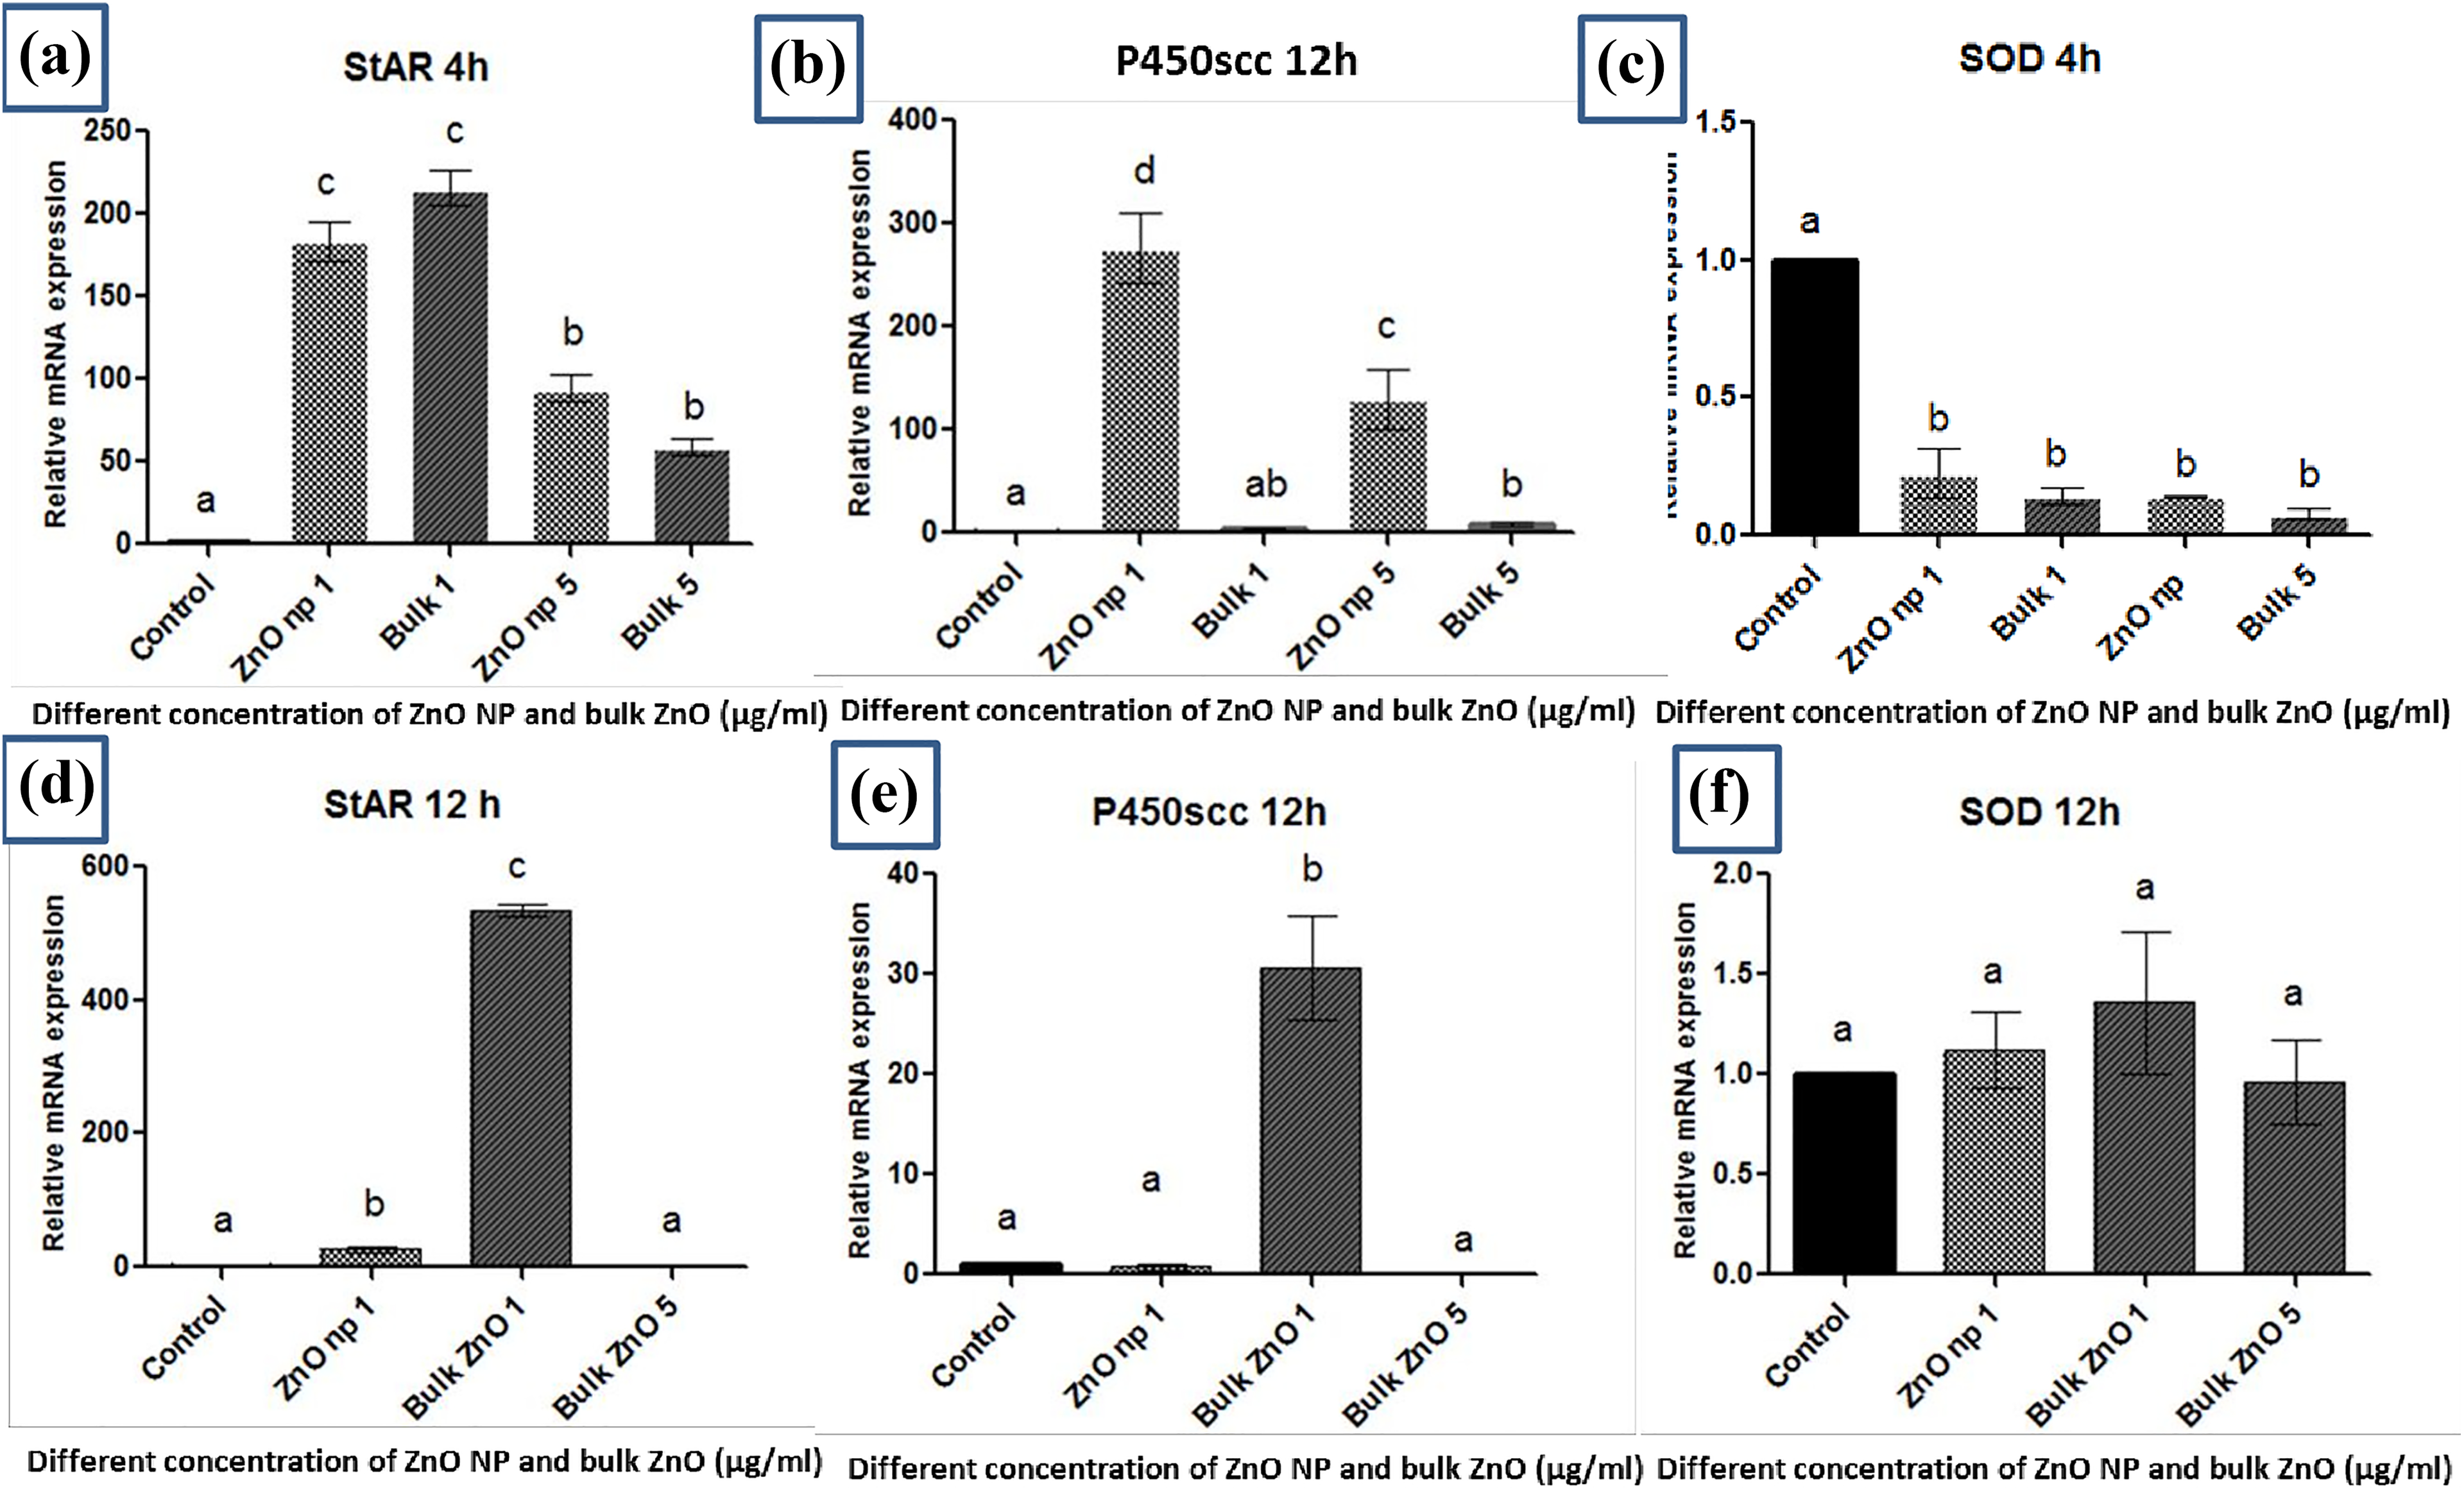
Relative expression of StAR. P450scc and SOD mRNA in TM3 Leydig cells treated with ZnO NPs and bulk ZnO after 4- and 12-h exposure. (a), (b) or (c) and (d), (e) or (f) Relative expression of StAR, P450scc and SOD genes after 4- and 12-h incubation, respectively. Data are expressed as the mean relative gene expression ± SD of three independent experiments performed in duplicate: p value ≤ 0.05. ZnO: zinc oxide; NP: nanoparticle; StAR: steroidogenic acute regulatory protein; cytochrome P450 side-chain cleavage enzyme; SOD: superoxide dismutase; SD: standard deviation; TM3: mouse testicular Leydig cells.
Estimation of testosterone production in TM3 cells
Table 3 illustrates the results obtained on testosterone production in TM3 cells treated with ZnO NPs and bulk ZnO for 12 h. There was an observed increase in the testosterone production of TM3 cells when treated by ZnO NPs and bulk ZnO. No significant difference was observed in testosterone concentration in the cell supernatant treated with 0.5 and 1 µg/ml of ZnO NPs and bulk ZnO compared with control; however, it was significantly (p < 0.05) higher in the 2 µg/ml ZnO NP-treated group with respect to control.
Testosterone production in TM3 treated with varying concentrations of ZnO NPs or bulk ZnO for 12 h compared with control.

TM3: mouse testicular Leydig cells; ZnO: zinc oxide; NP: nanoparticle; SEM: standard error of the mean.
a Significant difference in the enzyme activity compared with control. All values represent mean ± SEM of three individual experiments (n = 3); p value ≤ 0.05.
Discussion
The areas encompassing nanotechnology have steadily increased in the general field of research and product development because of the unique and valuable properties of nanomaterials. Nanomaterials, nowadays, are being widely used from common household products to specific industry-based products; however, their release into the environment may threaten ecological systems, the environment and human or animal health (Charitidis et al., 2014). The size of the nanomaterials distinguishes their properties from the bulk materials and thus their toxicity has to be explored and differentiated from bulk materials before they are incorporated into daily-use products and discarded into the environment. Hence, comprehensive studies are required for understanding the potential health risk of engineered nanomaterials, including the potential effects on reproduction and fertility, which are very relevant to this type of risk evaluation (Pawar and Kaul, 2014). Numerous studies have been done to evaluate the toxic effect of ZnO NPs in various model systems like different cell lines, organs and animals (Guan et al., 2012; Khan et al., 2015; Valdiglesias et al., 2013). As the information is still preliminary, a number of systematic studies are further required for the proper understanding of the mechanisms of ZnO NP-induced reprotoxicity.
In the current study, we have evaluated the impact of direct exposure of ZnO NPs on the TM3 cell line in vitro. Our findings demonstrate that direct exposure of TM3 cells to ZnO NPs induces steroidogenesis by elevating the relative expression of StAR or P450scc genes. This effect, however, quite surprisingly decreased at higher concentrations. It may indicate a StAR-independent steroidogenic effect on the cell line. Further, in this study, we found that ZnO NPs at the concentration of 50 µg/ml could be taken up by TM3 cells when tested after a 4-h incubation period as evidenced through TEM micrographs. To assess the biological effects of different concentrations or incubation times of ZnO NPs on TM3 cells, cell viability was first determined by two common viability tests, namely, the MTT and NR assays. The MTT assay reflects mitochondrial activity, particularly, mitochondrial redox metabolism in live cells (Monteiro-Riviere et al., 2009), while the NR assay reflects lysosomal function (Repetto et al., 2008). Results obtained from MTT and NR assays showed that ZnO NPs diminished the viability of the Leydig cells in a dose-dependent manner at various time intervals. Our results also demonstrate that ZnO NPs inhibit the mitochondrial activity more prominently than lysosomal activity, thereby suggesting a profound and direct effect on mitochondria, which may in turn cause cellular disruptions leading to enzymatic perturbations.
Oxidative stress is supposedly one of the main mechanisms of NP-induced toxicity (De Berardis et al., 2010; Hsin et al., 2008; Xia et al., 2006). It is an imbalance of the pro-oxidant and the antioxidant homeostasis systems (Rahal et al., 2014). Increased oxidative stress has been observed in different cell lines after exposure to ZnO NPs (Khan et al., 2015; Song et al., 2014). It is well established that an extensive increase in ROS production exceeds the capacity of the antioxidant mechanisms, thereby causing injury to cell organelles and biomolecules; primarily, the mitochondria but also biomolecules like lipid, protein and DNA are affected (Valko et al., 2007). SOD, an important enzyme to control ROS, catalyses the conversion of superoxide radical (O2.−) to H2O2, while CAT converts H2O2 to water (Ighodaro and Akinloye, 2017). Increased ROS production causes a rise in the SOD and CAT activities initially but when it persists or its level is very high, the protein damage becomes profound. SOD activity may decrease either by direct oxidative damage to SOD molecules or via an altered SOD gene expression (Fukai and Ushio-Fukai, 2011; Limon-Pacheco and Gonsebatt, 2009). Increased SOD and CAT activities were also recorded in human erythrocytes, Oreochromis mossambicus cells and mouse liver when exposed to ZnO NPs (Khan et al., 2015; Subramanian and Bupesh, 2011; Syama et al., 2013). Consistent with this, we also found an increase in SOD and CAT activities after ZnO NP treatment. In our study, ZnO NPs appeared to induce antioxidant enzyme activity in response to stress in TM3 cells, which is indicated from the typical changes in SOD and CAT activities. ZnO NP treatment significantly increased the SOD activity (at 1 or 5 µg/ml concentrations) and we also recorded a significant increase in the level of CAT at all the concentrations tested after 4-h incubation period. Whereas, in the case of bulk ZnO treatment, no significant difference in the SOD activity was recorded at either 4- or 12-h incubation periods, but surprisingly, changes were recorded in CAT levels. Thus, the activity profile of SOD and CAT suggests that ZnO NPs were causing significantly more oxidative stress than its bulk ZnO form.
Under stress conditions, cells activate different cellular processes that are important for the cells to either adapt to adverse conditions or to activate cell death mechanisms such as apoptosis or necrosis (Hanahan, 2000). Autophagy formation inside the cells is one of the adaptive mechanisms under stress condition and involves a multistep lysosomal degradation process in which cells degrade aged proteins and discard organelles such as mitochondria (Mizushima et al., 2008; Wang et al., 2011). Endogenous physiological stress or exogenous stimuli, including chemicals and invading particles, are the probable reasons for autophagy. Progressive autophagy during prolonged stress conditions leads to cell death (Mathew et al., 2007) and is one of the possible tumour suppression mechanisms (Kroemer and Levine, 2008). Different types of nanomaterials have been reported that induce autophagy in many cell types (Johnson-Lyles et al., 2010; Li et al., 2010; Stelzer and Hutz, 2009; Yamawaki and Iwai, 2006; Yu et al., 2013; Zabirnyk et al., 2007; Zhang et al., 2015). In the present study, TEM results indicated that ZnO NPs were taken up and agglomerated inside TM3 cells and also crossed the nuclear membrane (Figure 7(b)). ZnO NP (50 µg/ml) treatment induced the formation of several multivesicular and membrane-rich autophagosome aggregates and also caused mitochondrial damage after 4-h incubation, which was the shortest incubation period reported for such damage. These results indicated that ZnO NPs induce autophagosome formation and alter intracellular homeostasis and adaptation on account of stress in TM3 cells. A close relationship was found between mitochondria and oxidative stress, and an excessive ROS production and oxidative stress have caused mitochondrial damage. There is prior evidence to show that NPs are damaging, thereby affecting the mitochondria and their function (Unfried et al., 2007). In one of our studies, we also found that mitochondrial damage was caused by both ZnO NPs and mesoporous silica NPs (unpublished work). Previous studies have reported that diesel exhaust particles, TiO2 and Carbon Black (CB) NPs, were taken up by Leydig cells and induced the formation of phagosomes (Komatsu et al., 2008). Zhang et al. (2015) reported that exposure of TM3 cells to silver NPs for 24 h resulted in the development of double-membrane autophagosomes, autolysosomes and autophagic vacuoles. Consistent with these results, our findings also indicated that ZnO NPs exposure to TM3 cells resulted in autophagosomes, autolysosomes and autophagic vacuole formation and caused ultra-structural changes also.
Leydig cells are involved in the synthesis of testosterone and are stimulated by LH. Testosterone is the main male sex hormone having important functions like regulation of spermatogenesis, sperm maturation and sexual function in the adult (Ewing and Keeney, 1993). StAR and P450scc proteins are importantly and intricately involved in the testosterone biosynthesis. Many studies have stated that NPs are also acting as endocrine disruptors, affecting both female and male reproductivities (Sun et al., 2013). Mouse Sertoli (TM-4) and spermatocyte cell lines (GC2-spd) were used as in vitro models to explore the reproductive effects of ZnO NPs at sublethal doses (Liu et al., 2016). In order to understand the consequences of ZnO NPs and bulk ZnO exposure on steroidogenesis and testosterone biosynthesis, we measured the testosterone concentration in TM3 supernatant and also assessed steroidogenesis-related gene expression study in TM3 cells. Other researchers have also used TM3 cells as a model for steroidogenic studies like the testosterone release assay or steroidogenesis-related gene expression analysis (Edjenguele et al., 2014; Opuwari and Monsees, 2015). It has been suggested that the StAR gene may be an important target/indicator for environmental pollutants (Walsh et al., 2000), and its expression may also be affected by oxidative stress (Murugesan et al., 2007). StAR protein is involved in the delivery of cholesterol from outer to inner mitochondrial membrane (West et al., 2001) and is expressed in steroidogenic tissues (Gudermann et al., 1992; Stocco and Clark, 1996). The conversion of transferred cholesterol into pregnenolone by P450scc is considered to be the rate-limiting step in steroidogenesis (Raucci et al., 2014). On being exposed to ZnO NPs, after a 4-h incubation period, we observed a manifold increase in the relative expression of the steroidogenesis-related genes, StAR and P450scc. However, no such change in StAR and P450scc gene expression was observed when tested after a 12-h incubation period. Gene expression profiles clearly indicated that ZnO NPs were having a steroidogenic effect, but it depends on the exposure concentration and time. Similarly, increased StAR gene expression was also observed by Komatsu et al. (2008) when TM3 cells were exposed to carbon black and diesel exhaust particles albeit not at 16-h incubation but at 48-h incubation. Bulk ZnO (1 or 5 µg/ml) was also found to increase StAR and P450scc gene expression compared to control with no Zn at 4-h incubation period and also with ZnO NPs at 12-h incubation and even at 1 µg/ml concentration but not to the same levels as Zn NPs. Our findings demonstrated that both ZnO NPs and bulk ZnO are having steroidogenic effects, which are highly dependent on exposure time and concentration. However, and not surprisingly, ZnO NPs cause this effect at lower concentrations and incubation times than bulk ZnO. Effects of ZnO NPs and bulk ZnO on steroidogenesis were further checked by measuring testosterone concentration in the supernatant of TM3 cells treated with these NPs by ELISA following a 12-h incubation period. We found a significant increase in testosterone concentration in the 2 µg/ml ZnO NP-treated group with respect to control.
Conclusions
In this study, ZnO NPs interacted with TM3 cells and in general, they appeared to be 15–20% more cytotoxic than bulk ZnO. ZnO NP exposure induced the accumulation of autophagosomes and autolysosomes, affected mitochondria in cells, and had steroidogenic effects at lower concentrations and incubation periods. However, no clear decipherable pattern emerged as incubation time periods increased, that is, the steroidogenic ability of TM3 cells were highly variable. Rather than having a direct and mathematically proportional effect on steroidogenesis, it appears that there is some other mechanism and most likely more than one through which the NPs are influencing the cells. The results obtained demonstrated the direct and profound effect of ZnO NPs on Leydig cells and an indirect effect on steroidogenesis. Since ZnO NPs have been found to be highly toxic to Leydig cells, further studies are needed to elucidate the intricate mechanism of this effect. Moreover, necessary safety precautions and exposure limits are also needed to be specifically and separately developed for reproductive nanotoxins.
Footnotes
Acknowledgements
The authors would like to thank All India Institute of Medical Science for technical assistance with transmission electron microscopy. Thanks to Dr S. K. Tomar for providing SEM facilities. We are grateful to Dr Sunil Mohapatra for kindly sparing his time and reading the manuscript.
Declaration of Conflicting Interests
The author(s) declared no potential conflicts of interest with respect to the research, authorship, and/or publication of this article.
Funding
The author(s) disclosed receipt of the following financial support for the research, authorship, and/or publication of this article: This work was supported by National Dairy Research Institute and Consortia Research Platform on Nanotechnology under the Department of Agriculture Research and Education, Ministry of Agriculture, Government of India. The first author was financially supported by a Rajeev Gandhi National Fellowship from the University Grant Commission, India.
