
Abstract
In the present research, a zinc oxide (ZnO)–silver (Ag)–neodymium (Nd) nanocomposite was synthesized via the combustion method for the degradation of dyes as organic pollutants. The synthesized nanophotocatalyst was characterized using X-ray diffraction, Fourier transform infrared spectroscopy, and scanning electron microscopy techniques. The process of organic pollutant (Acid Red 18) removal was carried out in a semi-batch photoreactor equipped with an ultraviolet lamp. Also, the influence of key operational parameters such as pH, temperature, initial concentration of solution, and nanophotocatalyst dosage was investigated to evaluate kinetic and thermodynamic properties. Under optimum process conditions (pH = 6.21, dosage of nanophotocatalyst = 0.08 g/l, and low initial concentration of the solution), degradation of pollutant was monitored by measuring the total organic carbon of the solution. Finally, an economic study showed that the photocatalytic advanced oxidation process is an viable treatment method for low concentrations of organic pollutants.
Introduction
Currently, colored wastewaters are known as hazardous industrial pollutants, which are produced by different industries such as textile, cosmetic, and foods. One of the largest groups of organic compounds, which are used in these industries, are the azo dyes. They consist of a number of azo bonds, which are distributed into mono, di, and tri azo groups, and some of them and their basis materials are hazardous for human health, because of their carcinogenic effects (Jonidi Jafari et al., 2016; Shannon et al., 2008). Different methods such as coagulation/flocculation, membrane separation, activated carbon, and biological methods have been applied for treatment of the colored wastewater, before their evacuation (Babaei et al., 2017; Hadjltaief et al., 2016), but some dyes were not well refined due to their molecular resistance. Accordingly, conventional refining processes have been replaced by photocatalytic treatment methods, because of the production of powerful hydroxyl radicals (Jorfi et al., 2018; Sanghi and Bhattacharya, 2002). To investigate photocatalysis performance, a variety of semiconductors as photocatalysts were used for decolorization. Ultraviolet (UV) irradiation helps to increase the production of hydroxyl radicals, which is the most important parameter for complete removal of pollutants (Nasseri et al., 2018). Recently, photocatalysts (with an acceptable band gap ≤3.3 eV) such as zinc oxide (ZnO) and ZnO-doped catalysts have been used for dye removal in colored wastewaters (Goncalves et al., 1999; Kong et al., 2009; Yu et al., 2011). Photocatalyst activity is related to the generation of electrons and holes on the surfaces of photocatalyst and their recombination to improve photocatalyst activity and the variety of metals that are doped on their surfaces (Daghrir et al., 2013; Jorfi et al., 2017). Also, some elements, like silver (Ag) metal, were doped on the surfaces of ZnO by various methods such as photochemical (Xie et al., 2010), solgel (Georgekutty et al., 2008), hydrothermal (Chai et al., 2014), solvothermal (Zheng et al., 2007), and microwave-assisted combustion synthesis (MACS) (Mohammadzadeh et al., 2015). Among these methods, MACS had proper photocatalytic activity for decolorization of azo dyes. Furthermore, according to the research of Khatamian et al. (2012), lanthanide-doped ZnO nanoparticles had different activity, and increasing lanthanide loading caused an increase in the degradation rate. They reported that neodymium (Nd)-doped ZnO has high photocatalytic activity, among the tested catalysts.
In this research, an Ag-doped ZnO photocatalyst was synthesized via the MACS method, and Nd was added as a dopant. Hence, Ag and Nd as a dopant on a ZnO surface were applied, and a ZnO-Ag-Nd nanocomposite was synthesized, and its structural morphology was characterized by Fourier transform infrared (FTIR), X-ray diffraction (XRD), and scanning electron microscopy (SEM) analysis. To evaluate the photocatalyst activity, its ability on the decolorization of azo dyes (Acid Red 18 (AR18)) and influence of effective parameters were investigated to obtain the optimum experimental conditions of the treatment process. Finally, kinetic and economic studies of the process were evaluated.
Materials and method
Materials
AR18 as a nonbiodegradable organic compound was purchased from Alvan Sabet Company (Iran) without further purification, and its properties are represented in Table 1. Zinc nitrate hexahydrate, silver nitrate, and Nd nitrate hexahydrate as the main materials and glucose as a fuel were used in the synthesis of the ZnO-Ag-Nd composite. The pH of solutions was adjusted using sulfuric acid (H2SO4) and sodium hydroxide (NaOH) solutions (Merck, Co., Germany).
Properties of the organic compound (AR18).
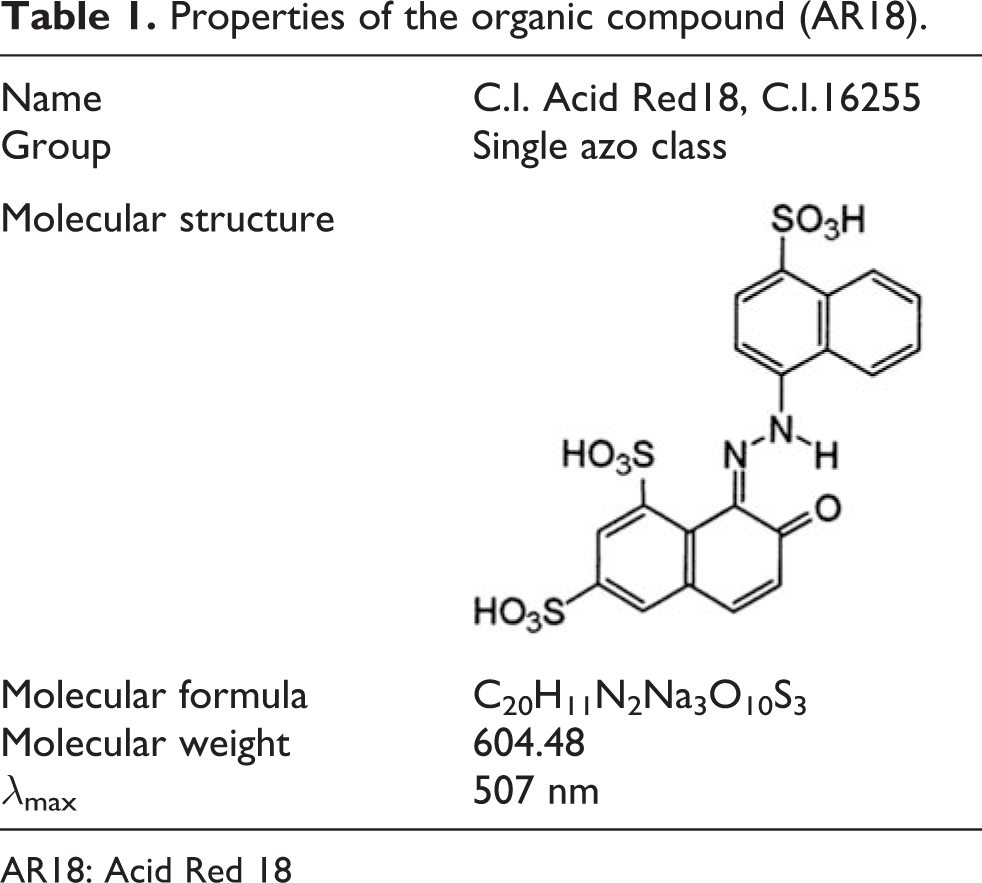
AR18: Acid Red 18
Synthesis of ZnO-Ag-Nd nanophotocatalyst
In this method, 5 g zinc nitrate hexahydrate and 1.15 g glucose as a fuel were dissolved in 20-mL deionized water at 25°C. Then, 0.1 g silver nitrate and 0.1 Nd nitrate hexahydrate were added as dopant groups. The mixed solution was heated at 80°C to evaporate in the presence of water and formed as a yellow gel. The prepared gel was combusted in a microwave (900 W) for 1 min, and as a result of combustion, a violet spongy foam was achieved with high porosity.
Characterization
The synthesized ZnO-Ag-Nd nanophotocatalyst was characterized by different analytical processes. The morphological and surface properties were investigated using a SEM (LEO 1455VP scanning microscope, England)), FT-IR (Perkin-Elmer One, USA) spectroscope, and an X-ray diffractometer (XRD, X’ Pert Pro model, Analytical company). The efficiency of the removal process was carried out by a UV/visible spectrophotometer (Perkin-Elmer lambda 25) and total organic carbon (TOC) analyzer (Shimadzu, Japan).
Photoreactor and treatment process
Figure 1 shows the schematic process flow diagram for the photocatalytic treatment. The solution entered the tank after adjusting pH with either 0.1 M H2SO4 or 0.1 M NaOH, then it was transferred to a semi-batch reactor was equipped with a 9 W UV light. All experiments were carried out with different concentrations (10, 20, 30 ppm) of dye solutions (V: 0.5 l). Absorbance number of the decolorization was determined by spectrophotometer analysis in λ max = 507 nm at various time periods; this evaluated the performance of the photocatalysis using equation (1)

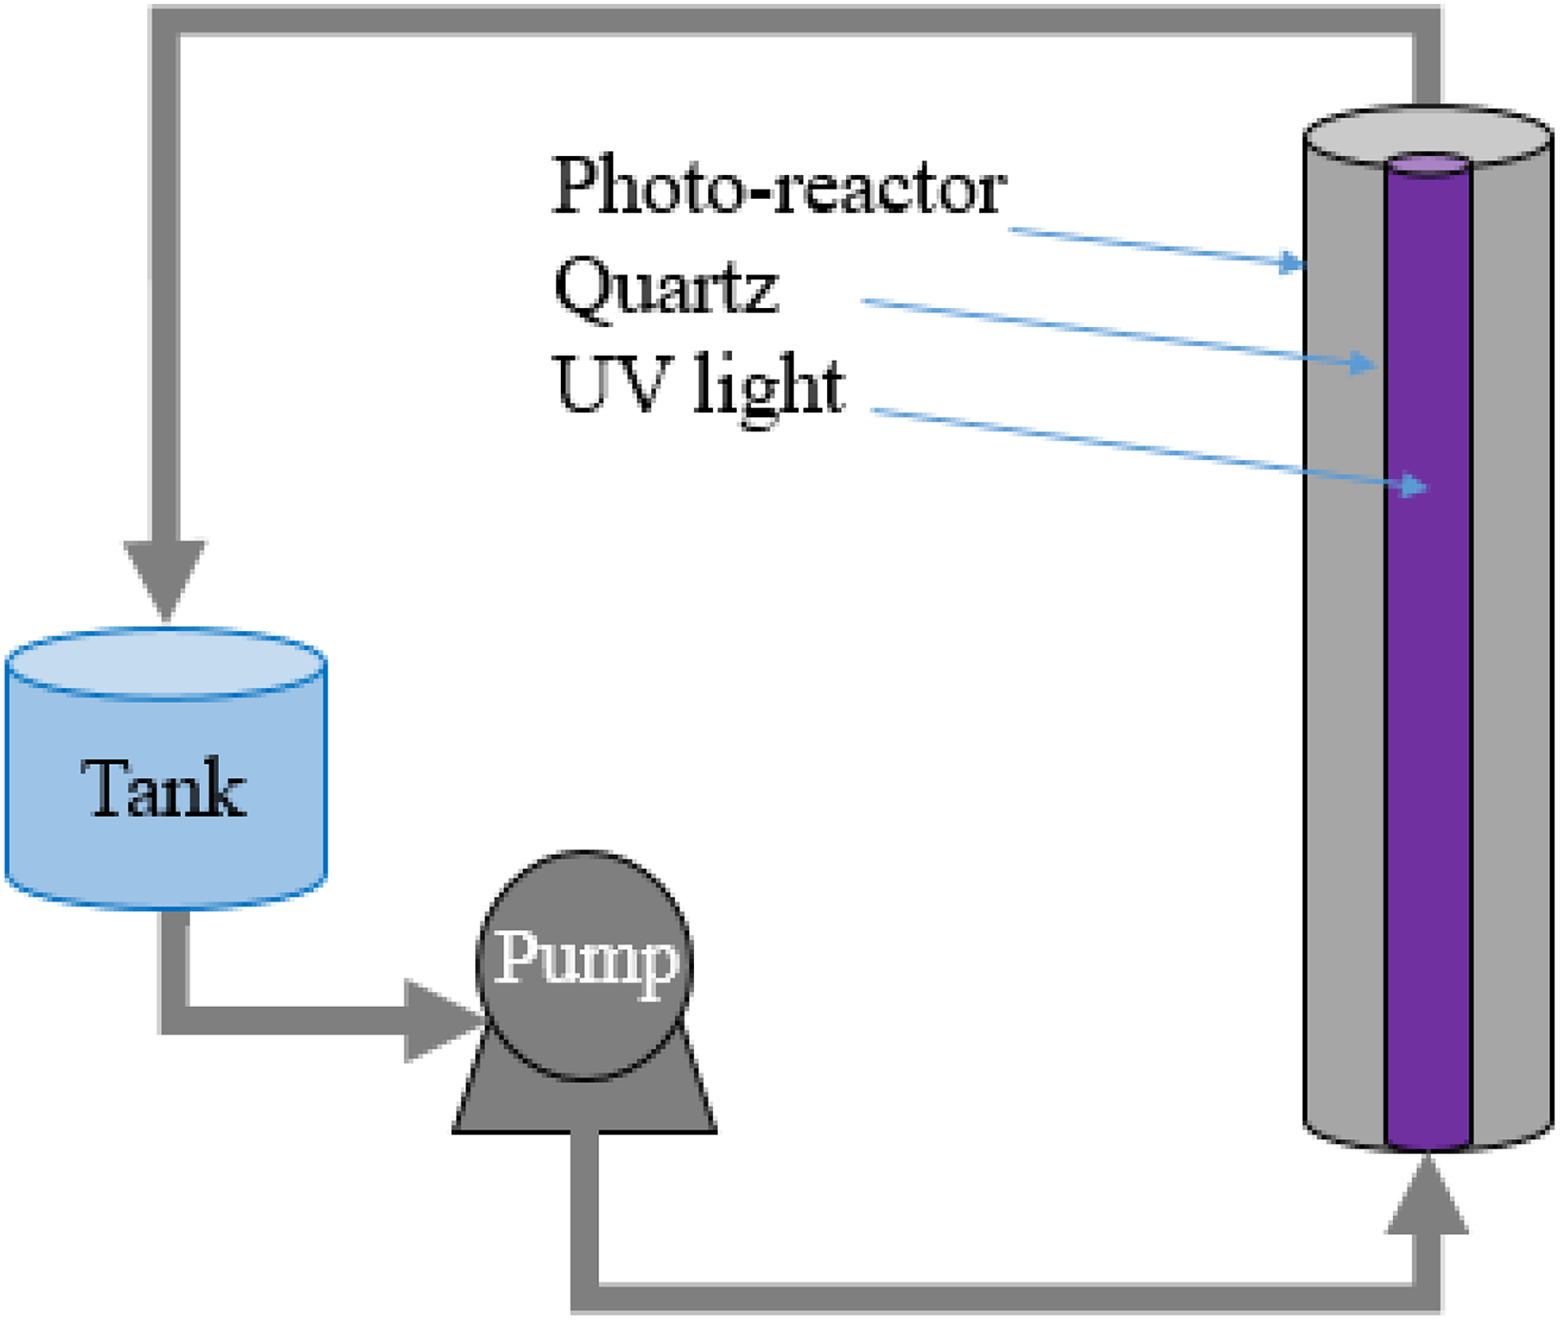
Schematic process flow diagram.
where A 0 and At are the absorbance of the solutions at initial (t 0) and time t, respectively.
Result and discussion
Characterization of ZnO-Ag-Nd nanophotocatalyst
XRD analysis was carried out for investigation of the nanophotocatalyst properties. Figure 2 shows the spectra of ZnO-Ag-Nd in the range of 0–80°, where the major peaks for the modified ZnO-Ag-Nd samples were found to be almost identical. A series of peaks: 31(100), 34(002), 36(101), 47(102), 56(110), 62(103), 66(200), 67(112), 68(201), 74(004), and 77(202) are related to hexagonal wurtzite ZnO (Mohammadzadeh et al., 2015); the other peaks: 37(111), 44(200), 64(220), and 78(311) are related to the dopants (Khatamian et al., 2012; Mohammadzadeh et al., 2015). The peaks of Ag and Nd as dopant groups were not significantly changed, which showed that all added ions were in host crystal lattice in the form of dopant.
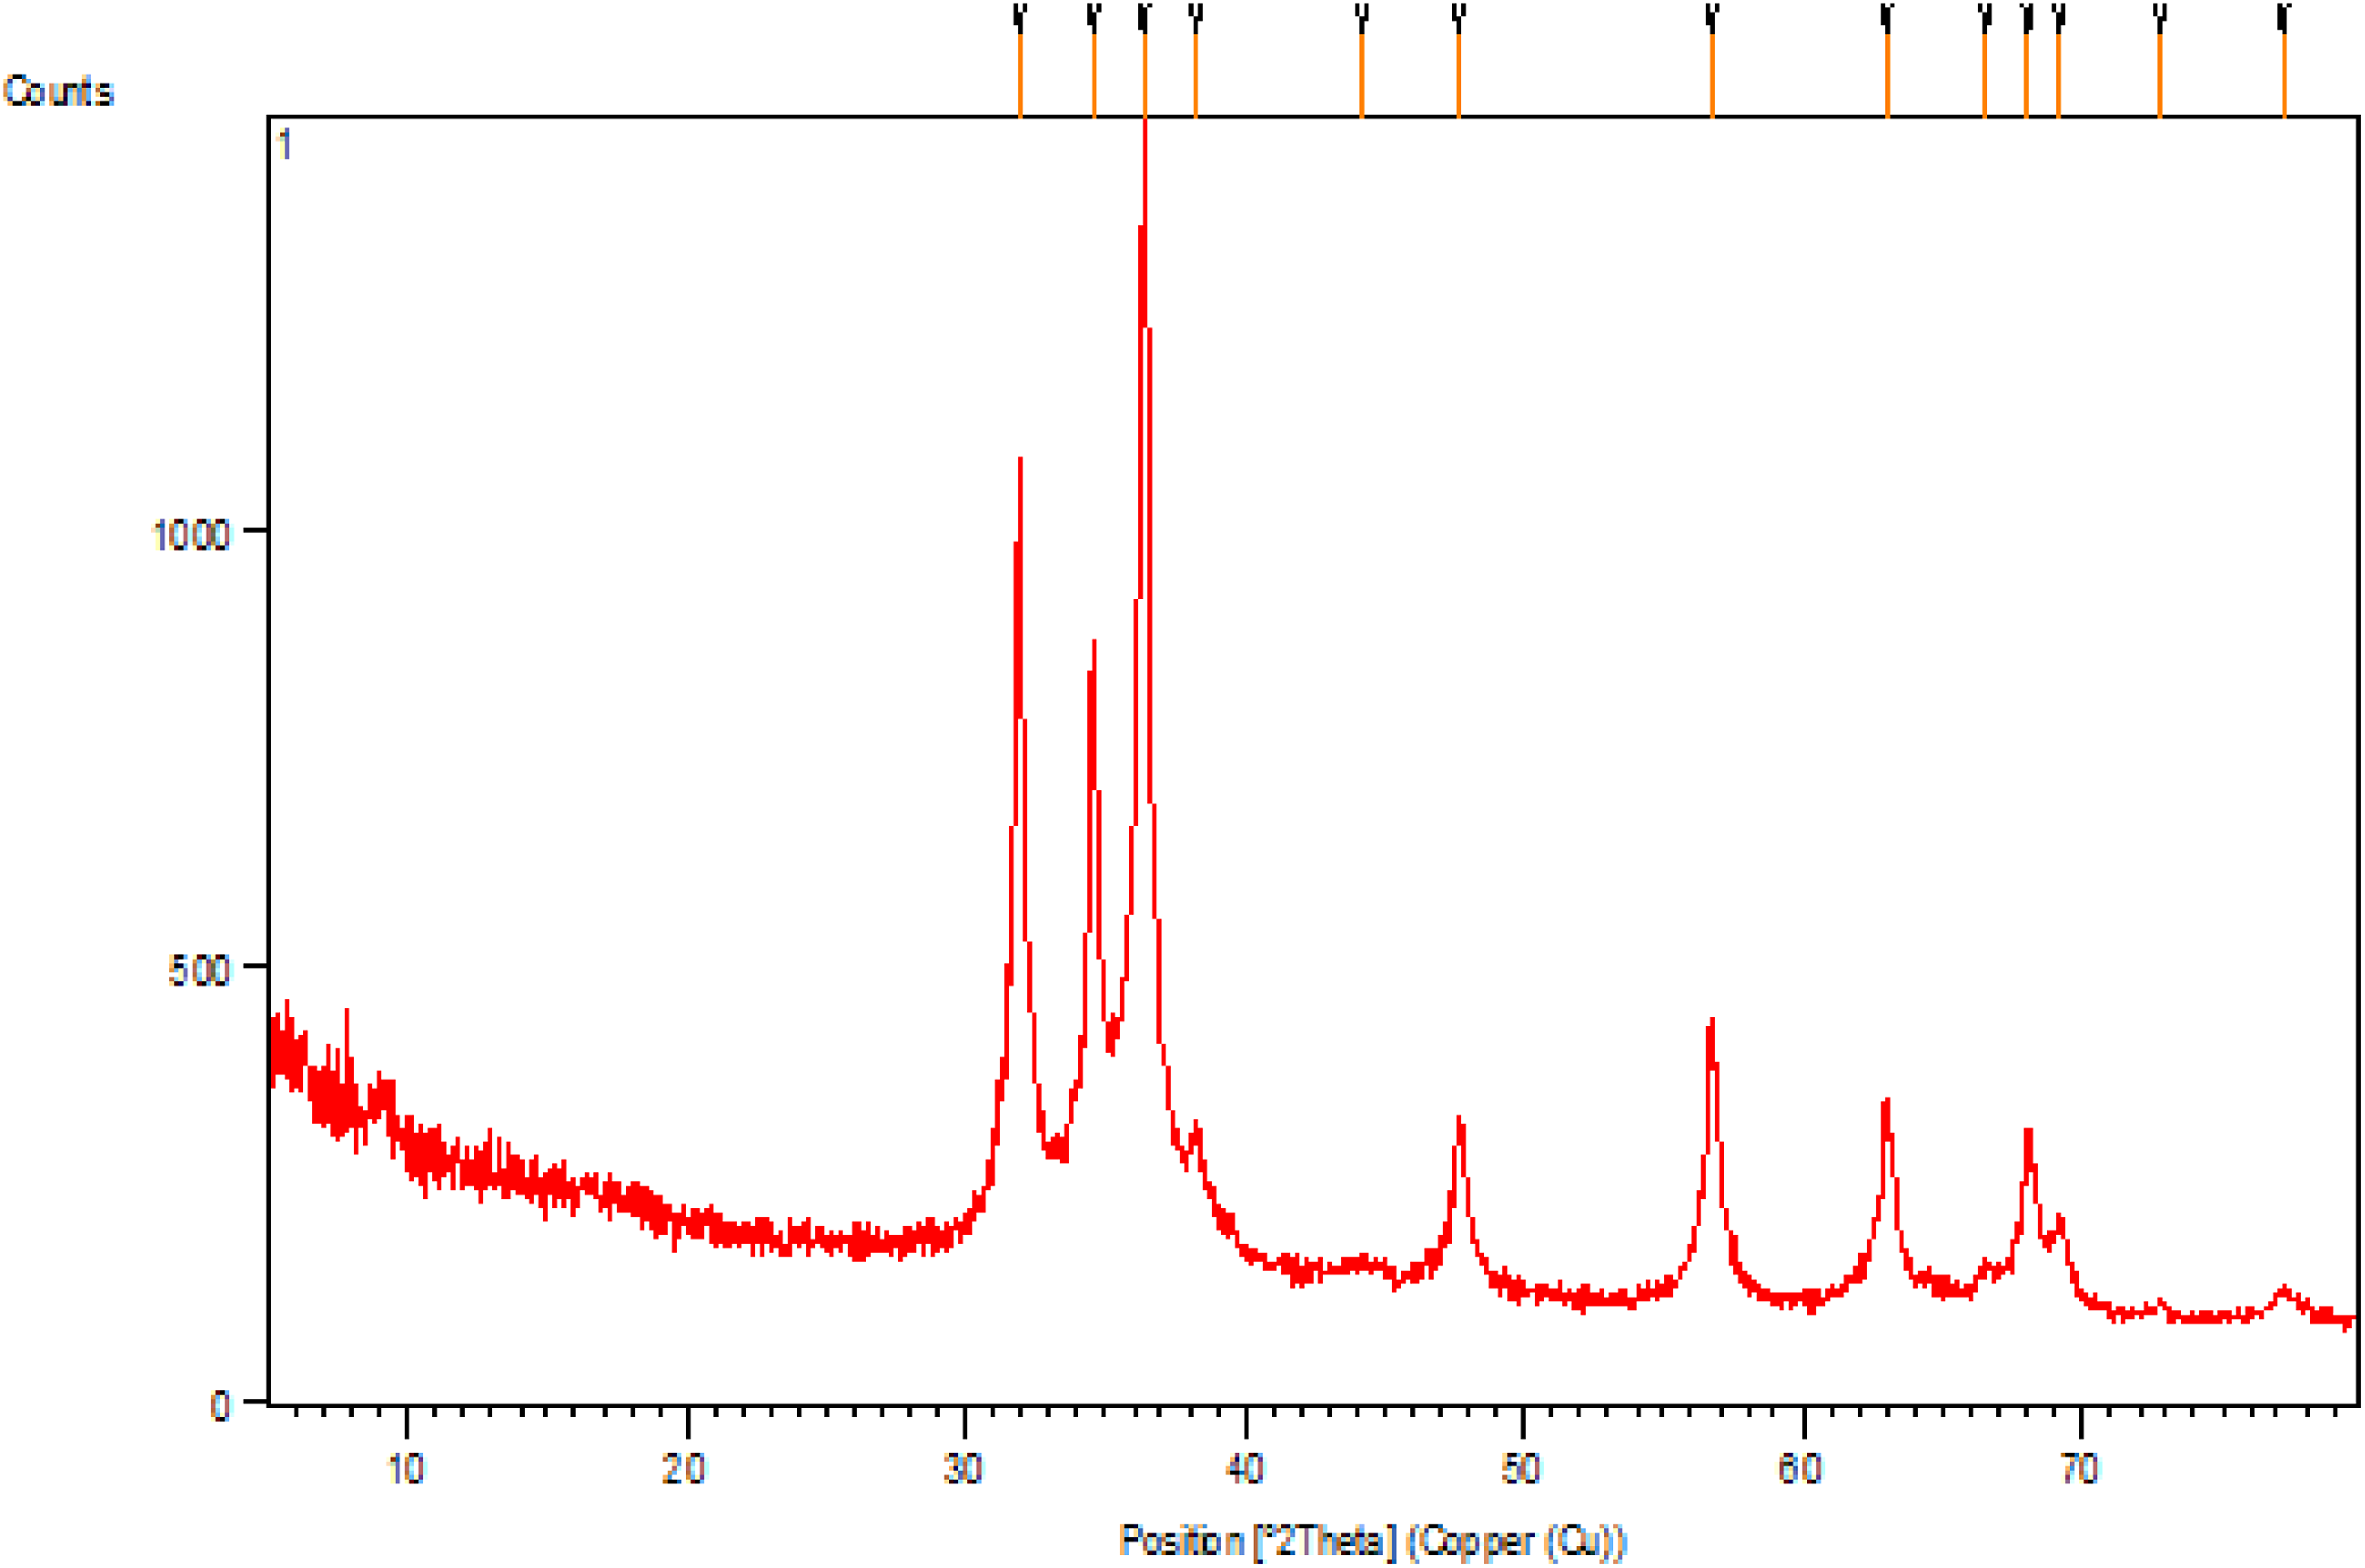
XRD patterns of ZnO-Ag-Nd photocatalyst. XRD: X-ray diffraction.
SEM analysis was applied to reveal the surface features of the ZnO-Ag-Nd photocatalyst. As can be observed in Figure 3, the synthesized photocatalyst with proper distribution has a porous structure with different sizes of about 60–80 nm, which are produced from the combustion synthesis and gas emissions resulting from the combustion. Therefore, the presence of dopants of Ag and Nd formed a hollow foam sticking together. In order to verify the efficiency of the structure of the synthesized ZnO-Ag-Nd photocatalyst, FTIR analysis was utilized, and several significant peaks appeared in the range of 450–4000 cm−1. Figure 4 shows the defined bands at 545.14 cm−1 by forming Zn–O (Kumar et al., 2013), at 3436.66 and 545.14 cm−1 by absorption of O–H (Hong et al., 2009) that the O–H groups are able to activate hydroxyl free radicals, at 1626.94 cm−1 by the bending vibration of water, at 2921.12 cm−1 by C–H bond and trapped carbon dioxide and stretching C=O bond at 1200 cm−1 range.
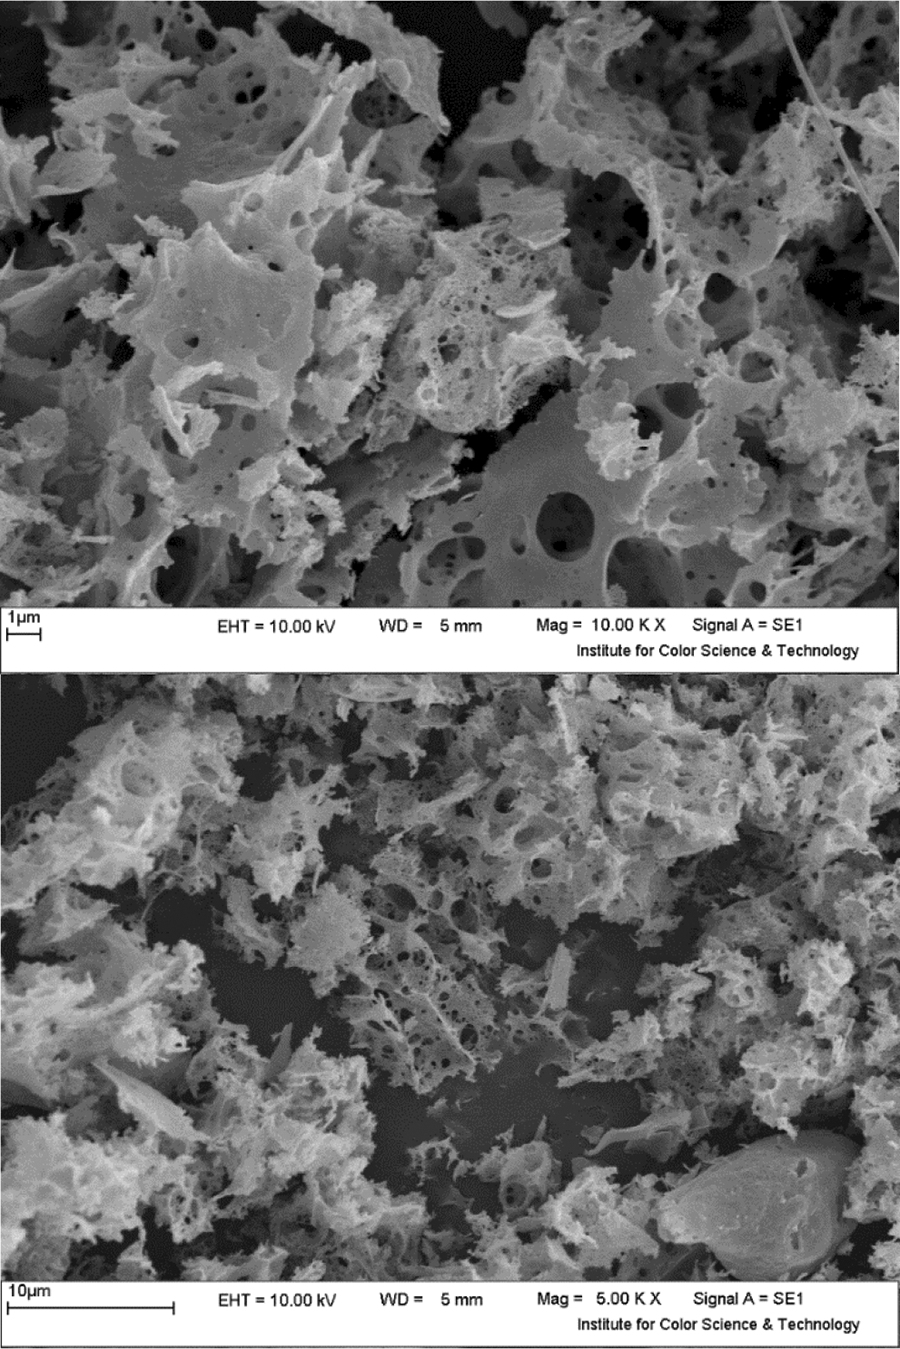
SEM images of ZnO-Ag-Nd photocatalyst. SEM: scanning electron microscopy.
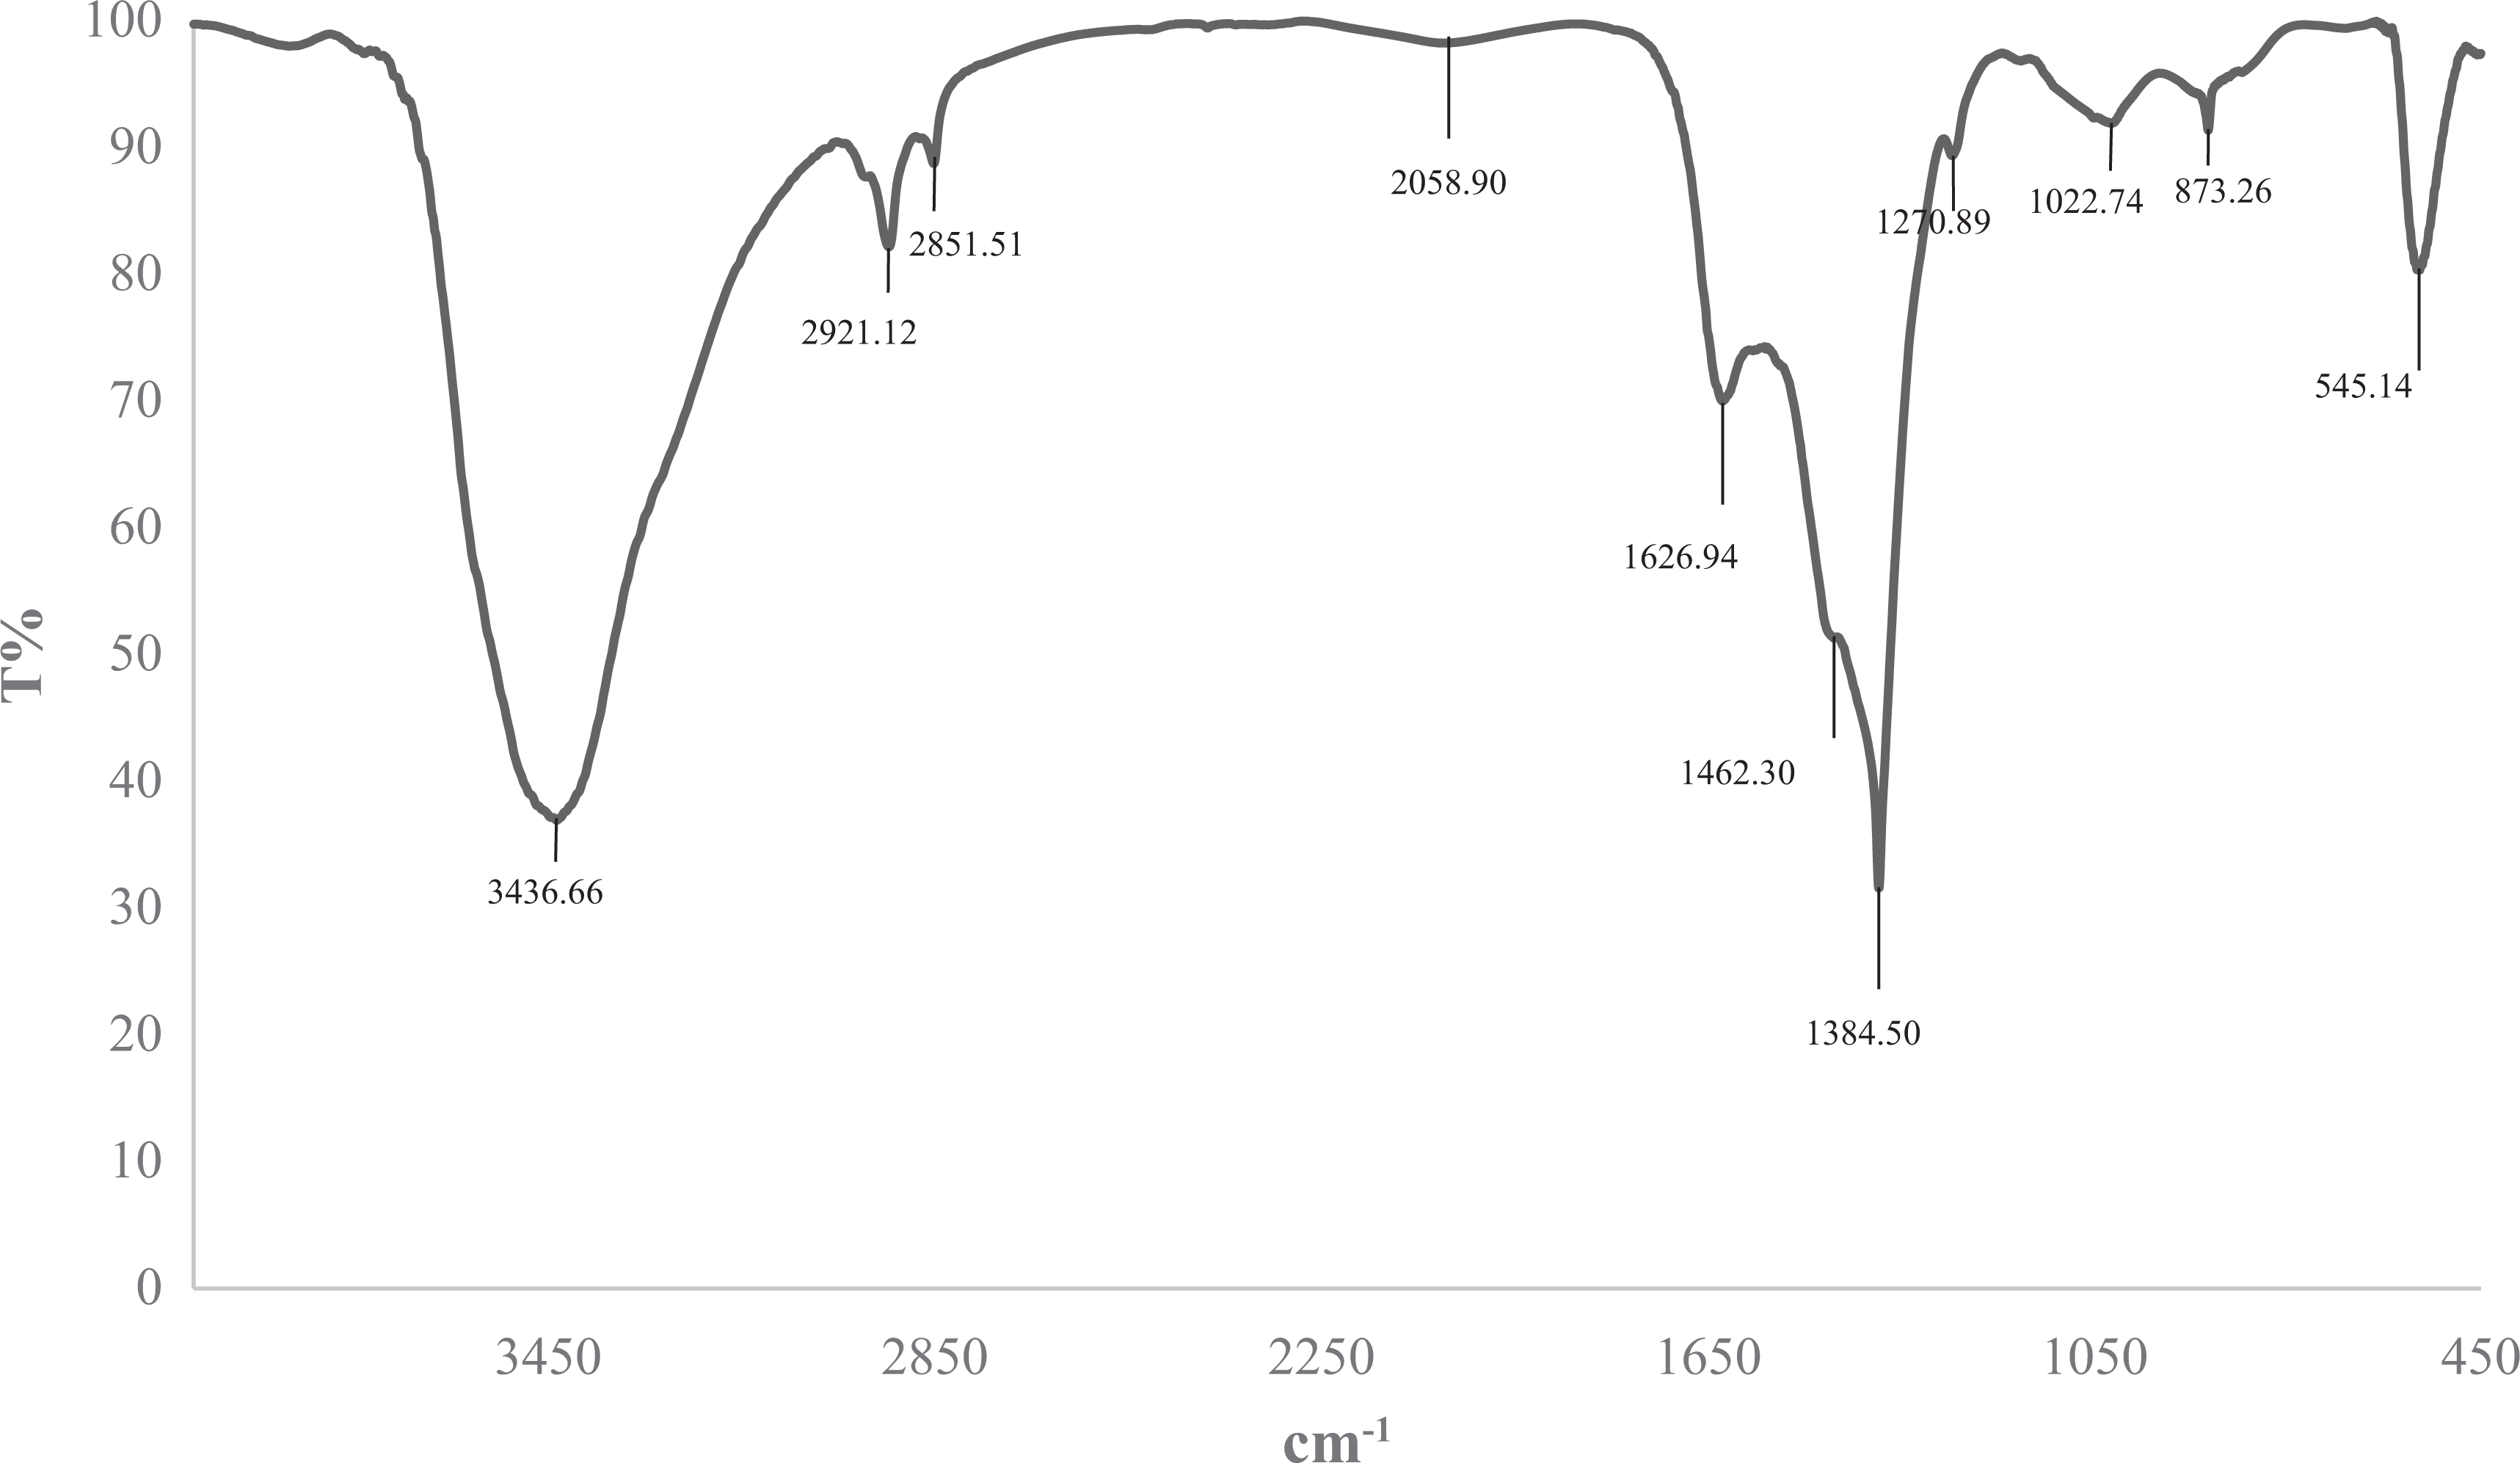
FTIR spectra of the ZnO-Ag-Nd photocatalyst. FTIR: Fourier transform infrared.
Effect of key operating parameters
Effect of photocatalyst dosage
Different mass of synthesized nanophotocatalyst (0.02, 0.04, 0.06, 0.08, 0.1 g/l) were applied to find the optimum quantity with maximum decolorization efficiency over 180 min. Results (Figure 5) showed that increasing the photocatalyst dosage led to an enhancement in the decolorization efficiency (up to 0.08 g/l) and then followed by a sharp decrease, because of increasing the number of active sites of the surfaces of the photocatalyst (Ahmadi et al., 2017b; Daneshvar et al., 2005; Kermani et al., 2018a). But, further increase in the photocatalyst dosage over 0.08 g/l caused decreasing the removal efficiency, due to increasing the turbidity of photocatalyst suspension and decreasing penetration of UV irradiation (Babaei et al., 2015; Kumar et al., 2013).
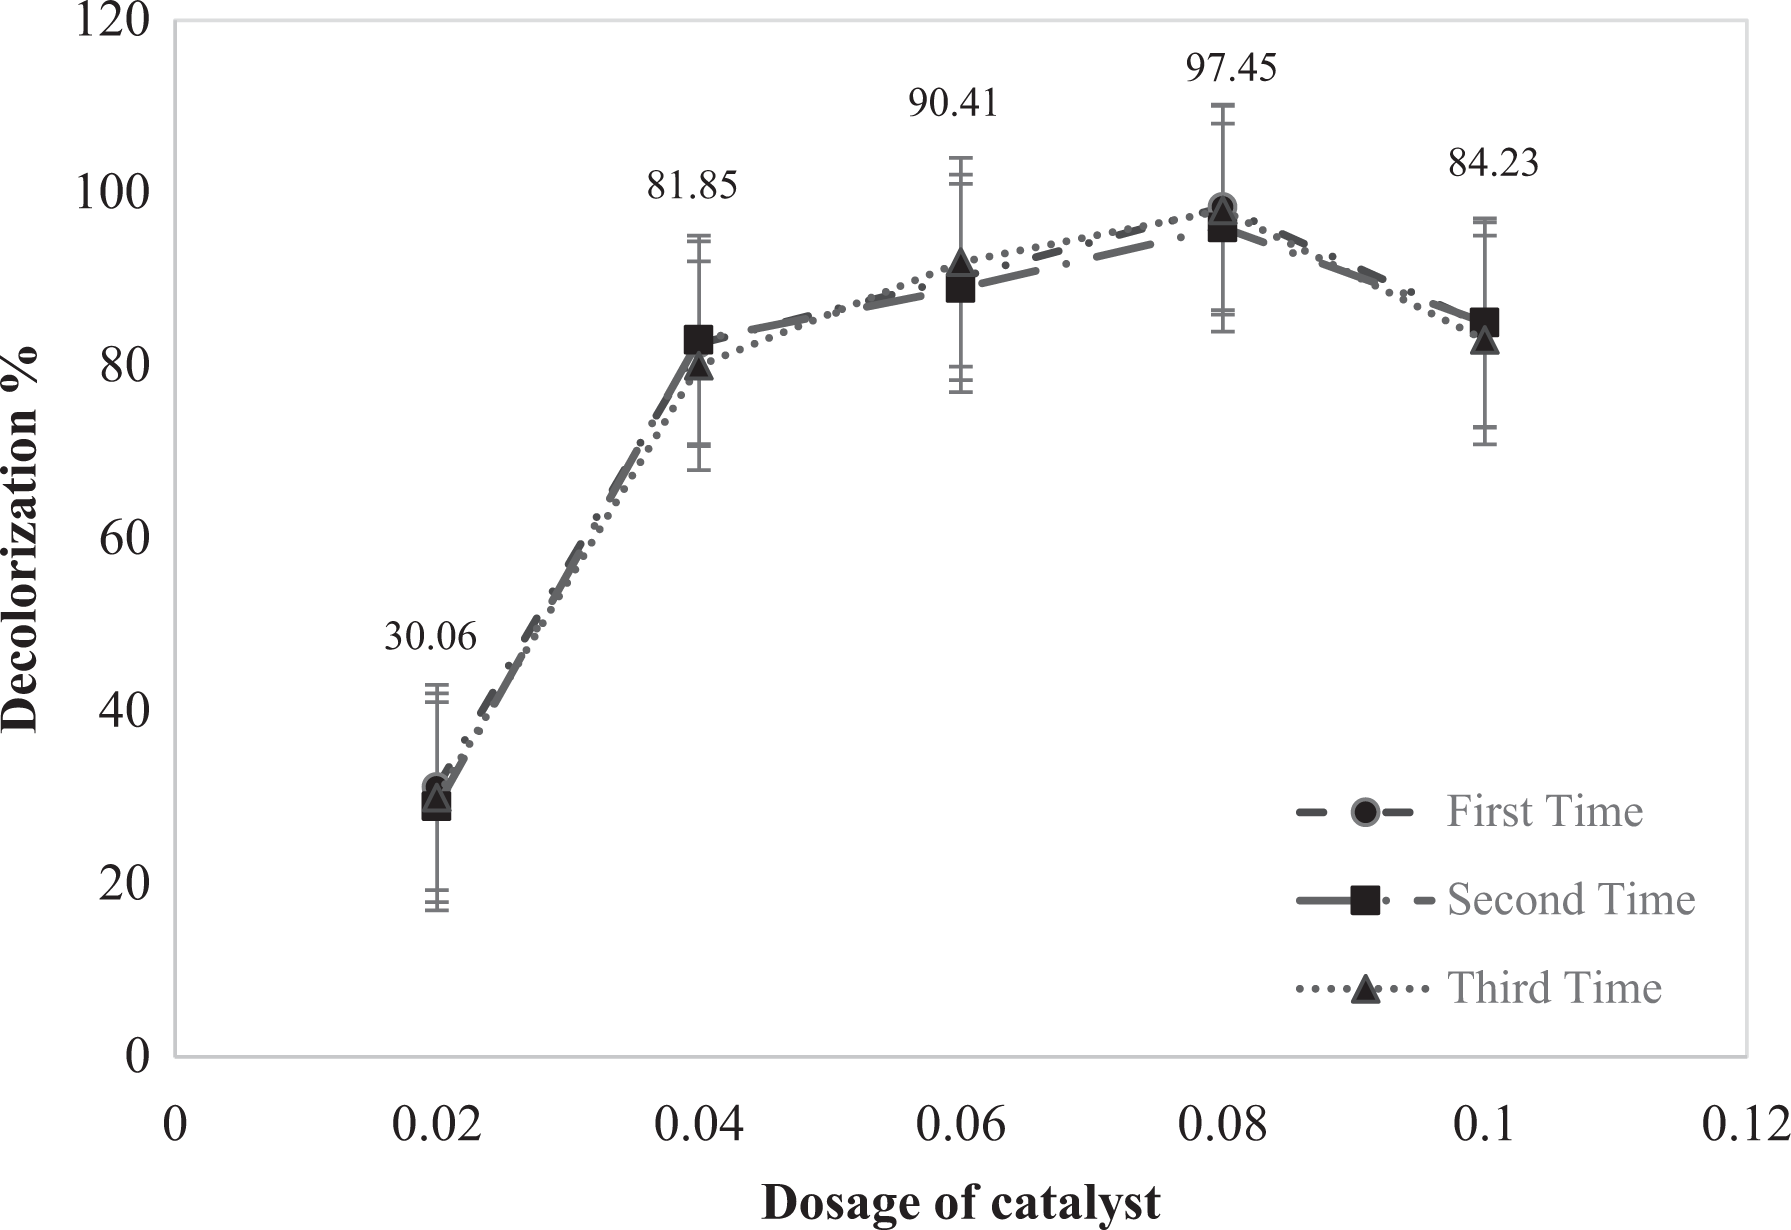
Effect of dosage of ZnO-Ag-Nd photocatalyst.
It can be observed that the optimal dosage of ZnO-Ag-Nd nanophotocatalyst is 0.08 g/l for decolorization of AR18.
Effect of pH
One of the most important parameters in decolorization of organic pollutants is initial pH of the solutions, regarding its effect on the amphoteric behavior of ZnO (Behnajady et al., 2007; Daneshvar et al., 2007; Modirshahla et al., 2011). In addition, it affects decolorization by the produced hydroxyl free radicals in the presence of UV irradiation (Nishio et al., 2006). Different values of pH were adjusted for the solutions. According to the results (Figure 6), AR18 decolorization efficiency was increased in the pH range of 3–6, and after it, the efficiency decreased at pH>6. Optimal point of pH value was found to be 6, because ZnO reacts with acidic and alkali solutions, where the reaction occurs between the hydrolyzed ZnO and H+ and OH− ions. At acidic and alkali pH values, hydroxide surfaces adsorb H+ and OH− to produce positively charged (at pH <6) and negatively charged surfaces (at pH >6; Degen and Kosec, 2000), and decolorization was decreased.
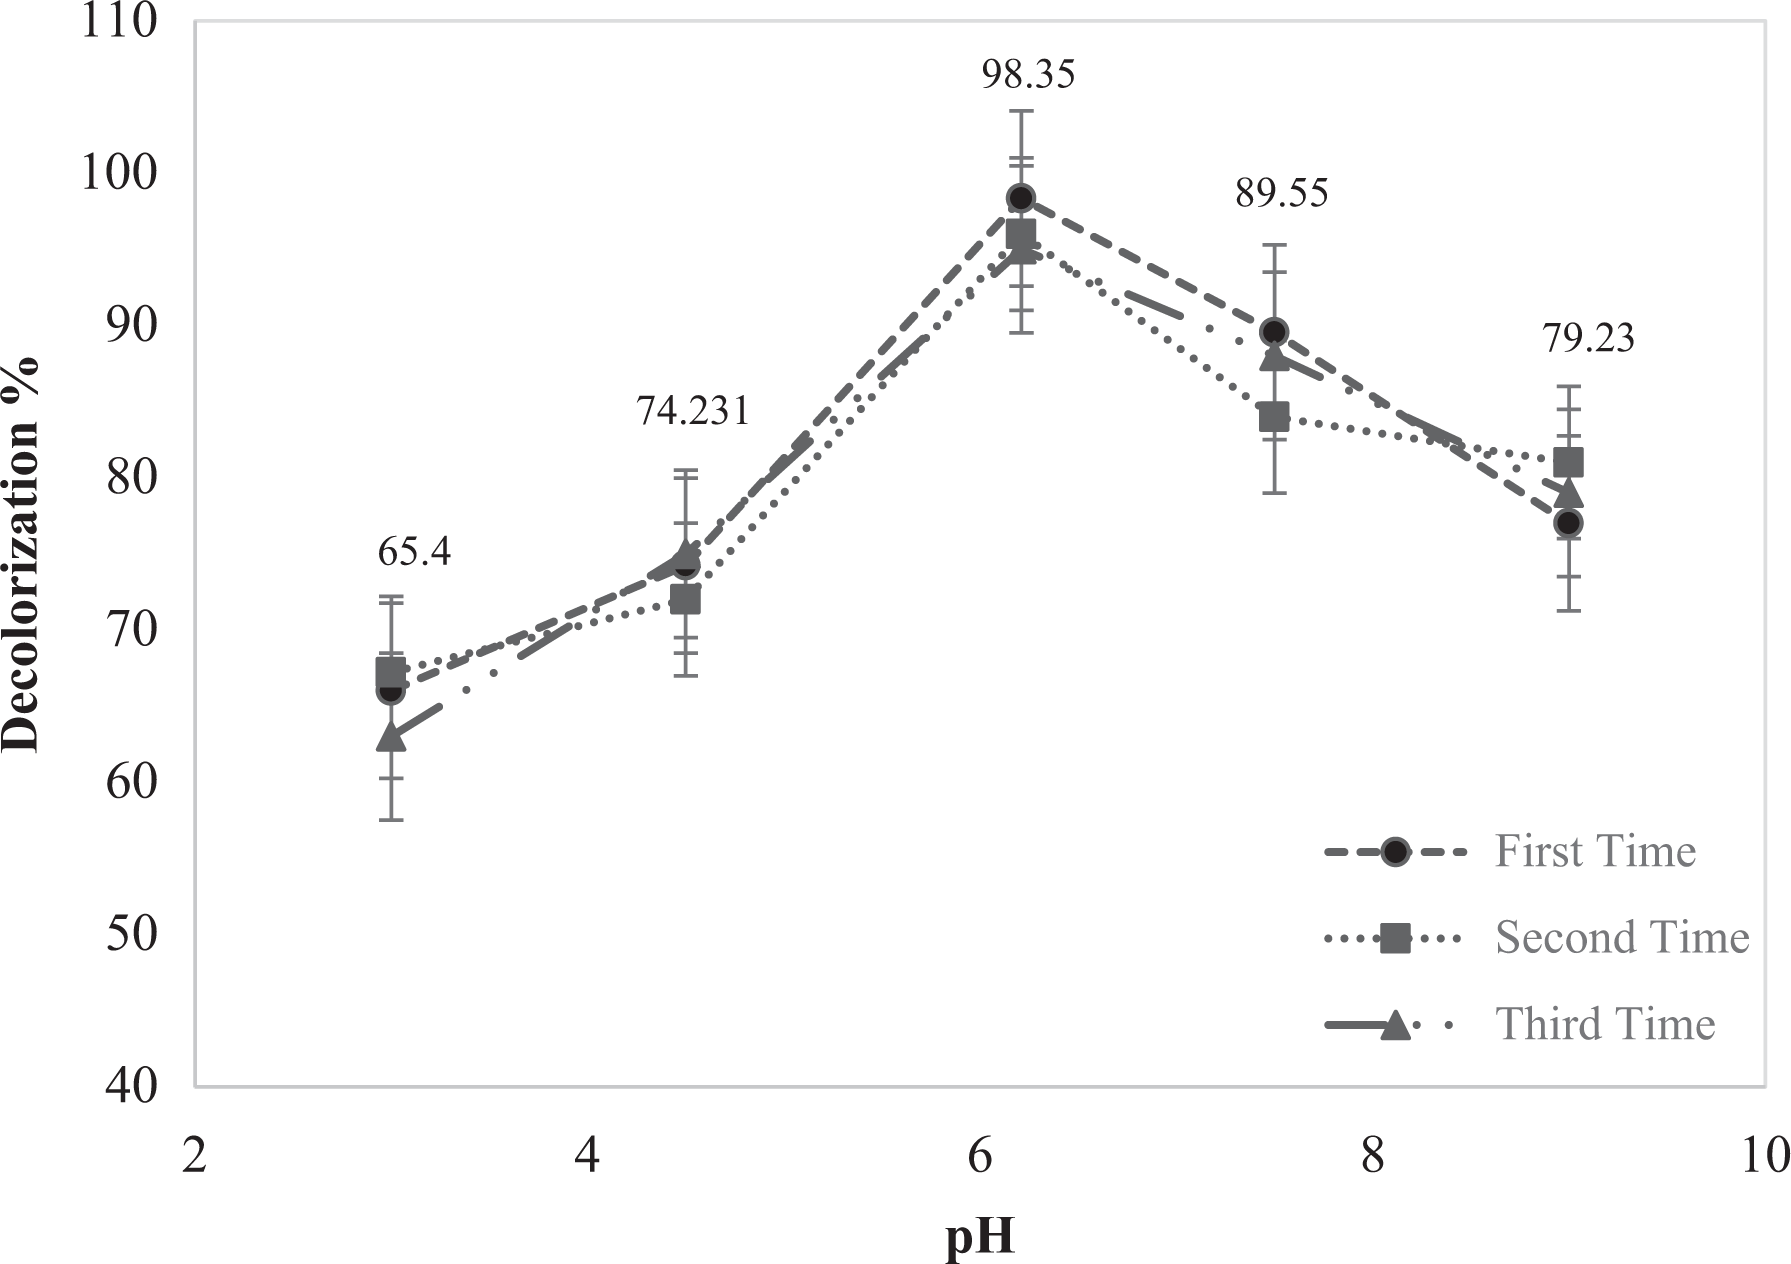
Effect of pH value of dye solution.
Effect of the initial dye concentration
Effect of different initial concentrations of dye on the removal efficiency was studied at optimum values of photocatalyst dosage and pH of solution. Figure 7 shows that at dye concentrations of 10, 20, and 30 mg/l, decolorization was decreased because of increasing adsorption of the dye molecules on the catalyst surfaces from 10 to 30 mg/l and decreasing UV irradiation onto the surfaces of photocatalyst (Ahmadi et al., 2017b; Kermani et al., 2018b).
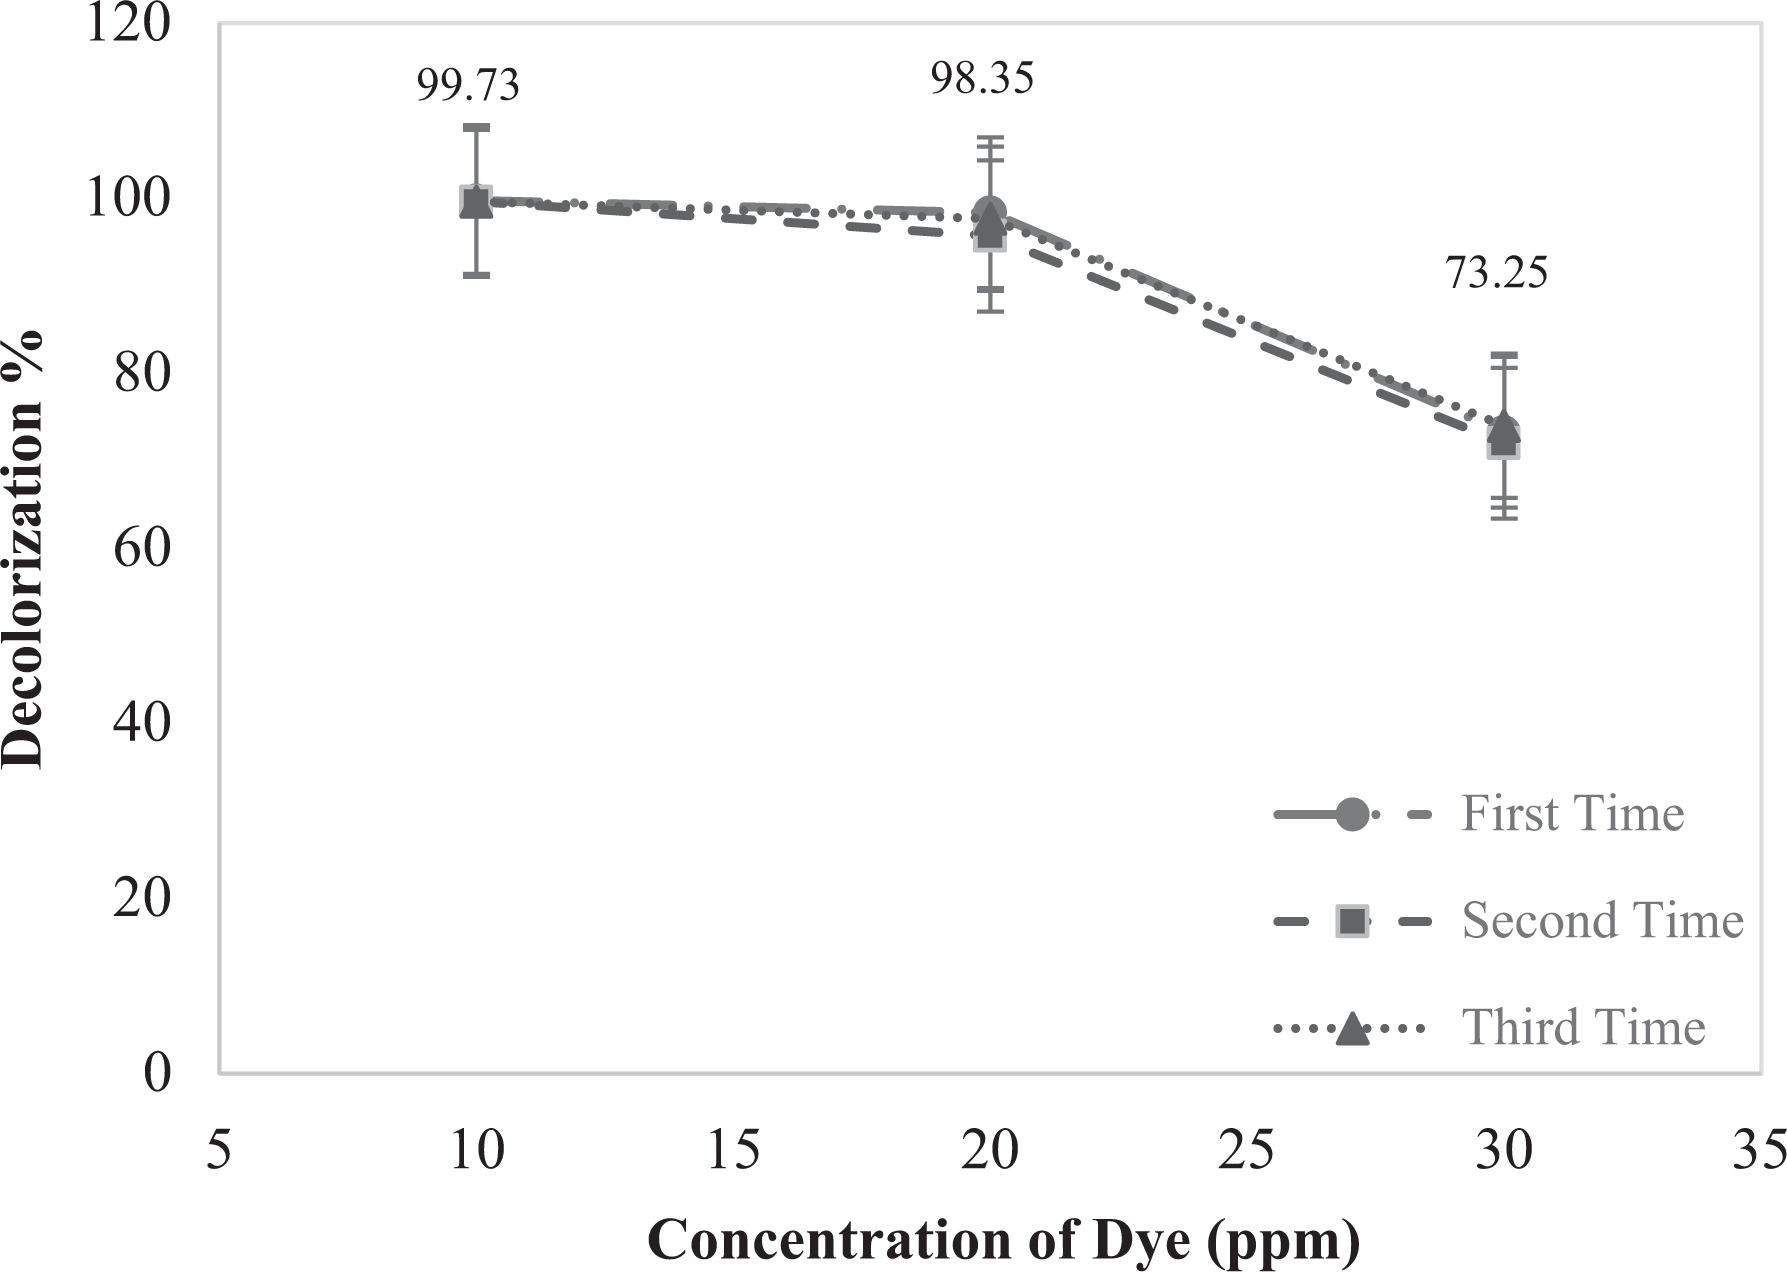
Effect of initial concentrations of dye.
Kinetic studies
Kinetics of AR18 decolorization were studied and compared with different kinetic orders (zero, first, and second orders). To find the correct kinetic order, equation (2) was concerned first as rate of reaction, as follows

where r is the rate of reaction, K is the kinetic constant, C is the concentration of AR18, and n is the kinetic order.
Figures 8, 9, and 10 show different kinetic orders for decolorization of different dye concentrations (10, 20, 30 mg/l) during 180 min of the process that the plot of C0–Ct for zero-order-kinetic, ln (C0/Ct) for first-order-kinetic, and
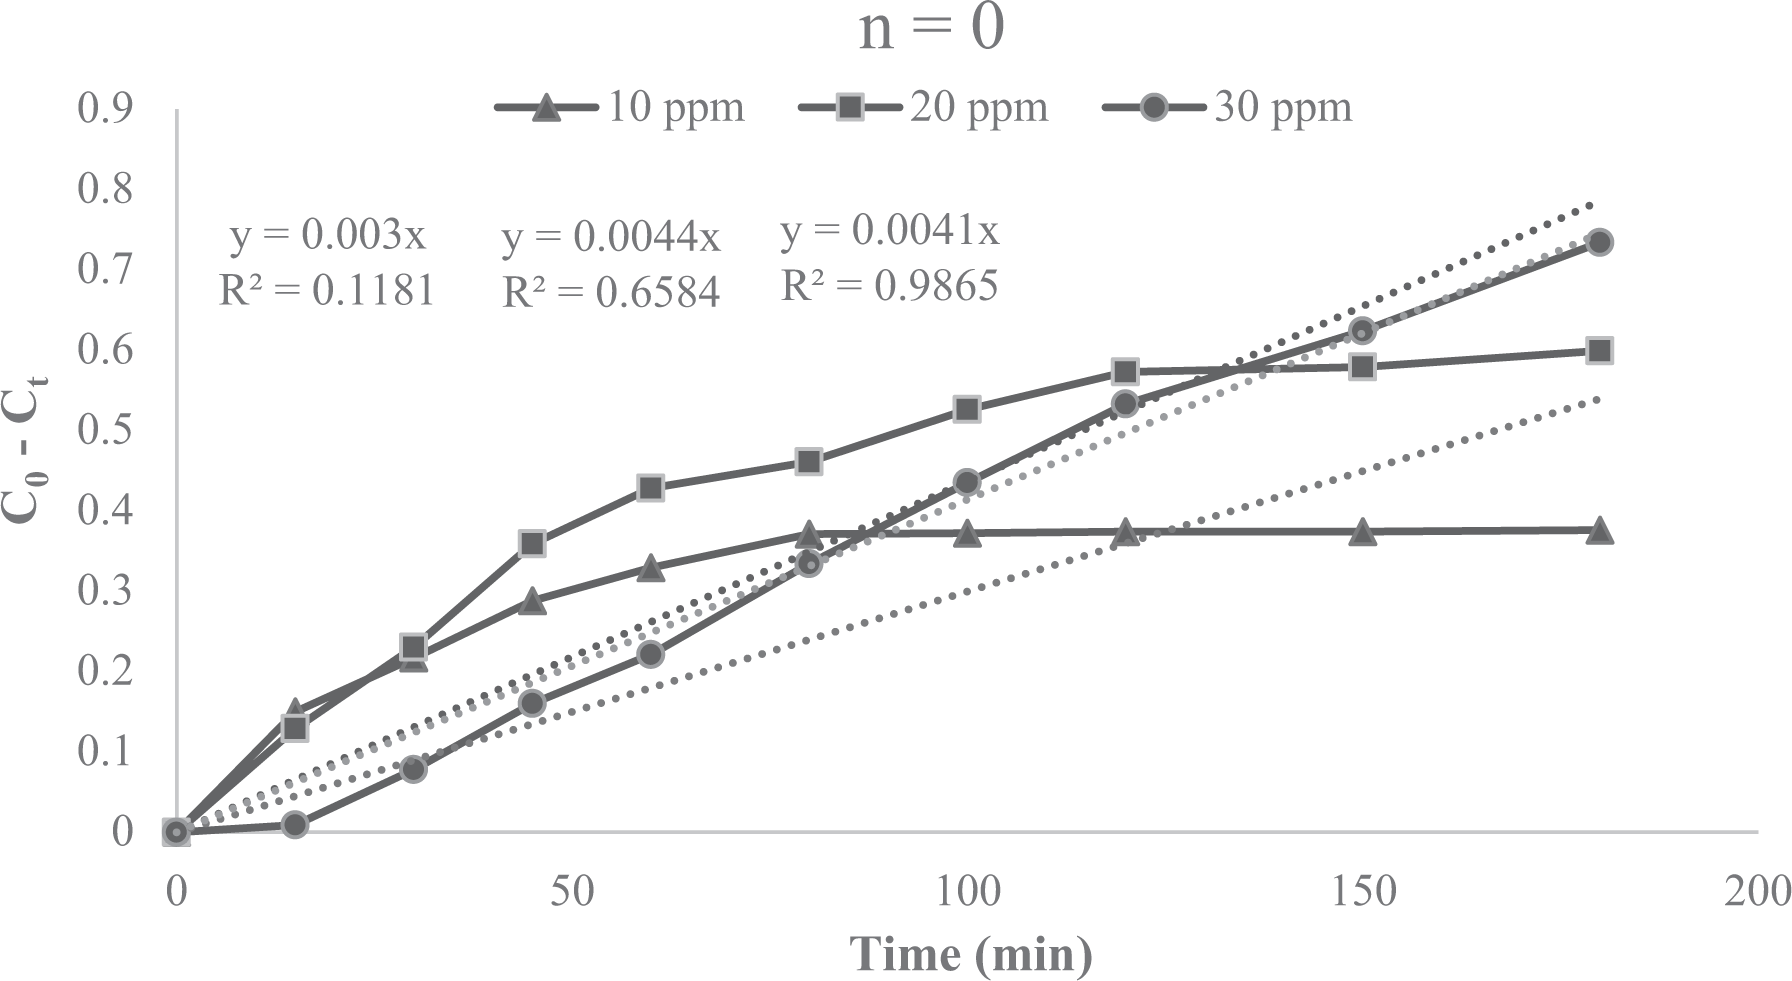
Zero-order kinetic of decolorization of AR18. AR18: Acid Red 18
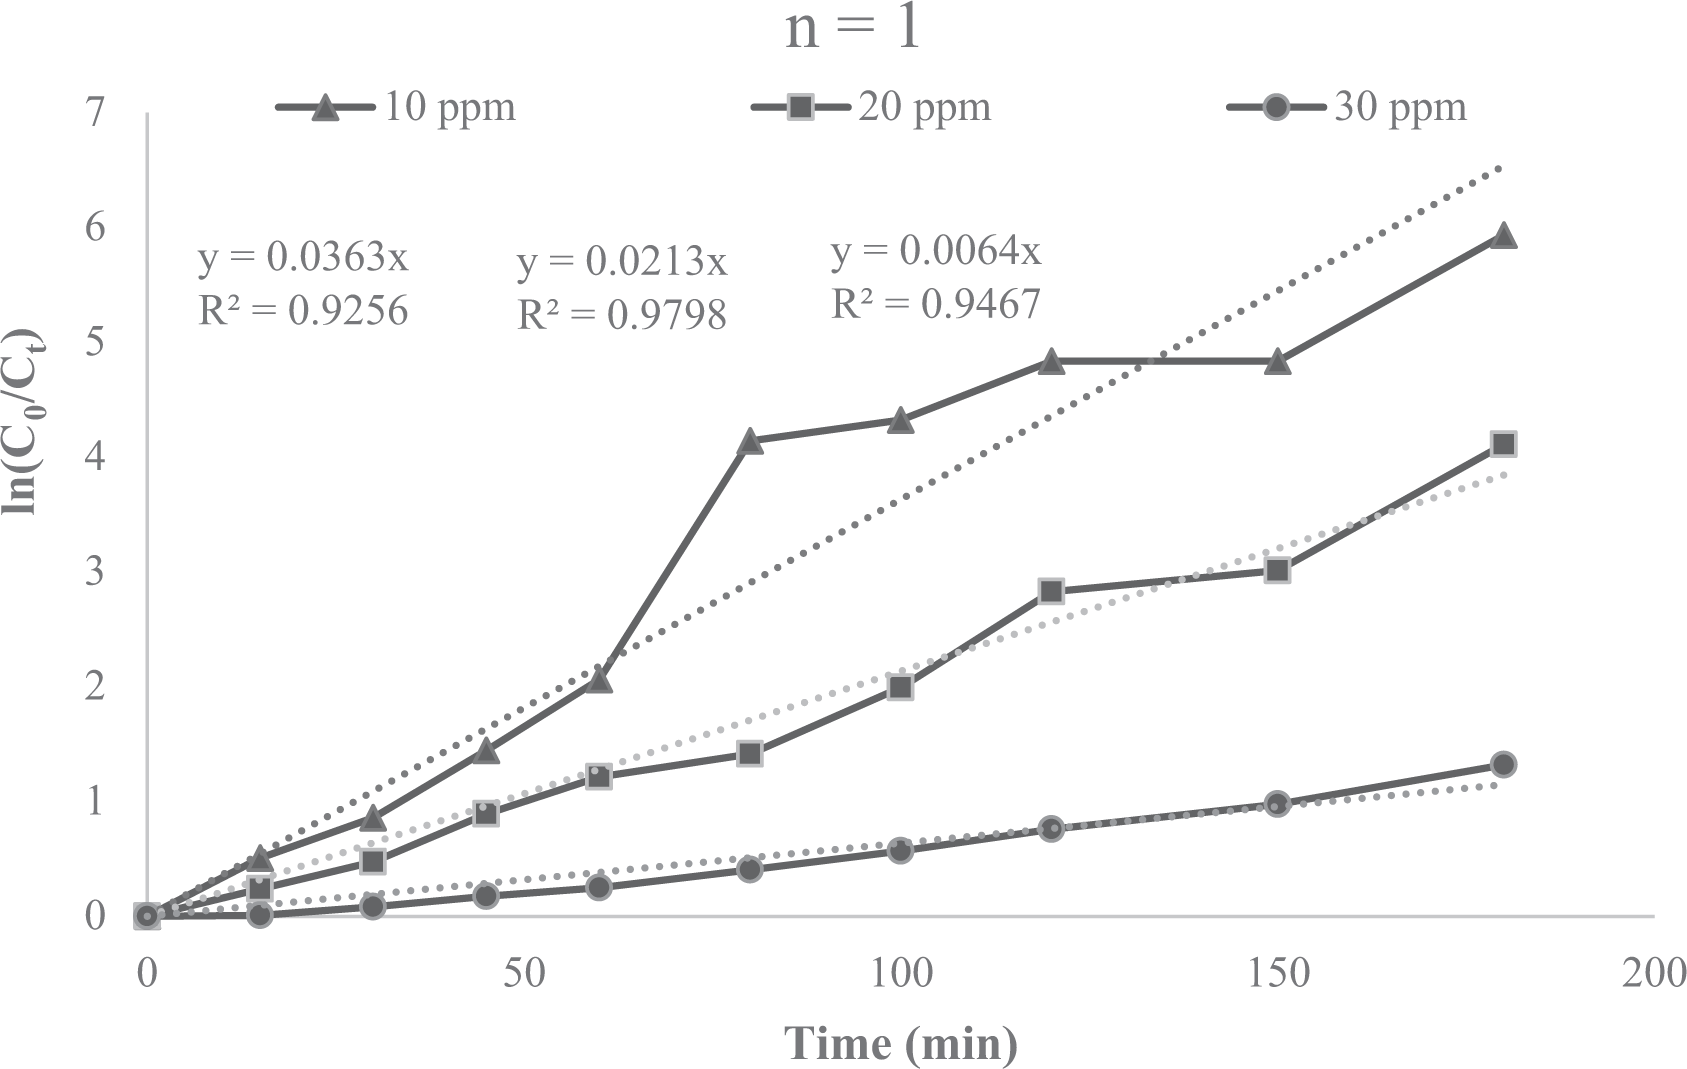
First-order kinetic of decolorization of AR18. AR18: Acid Red 18
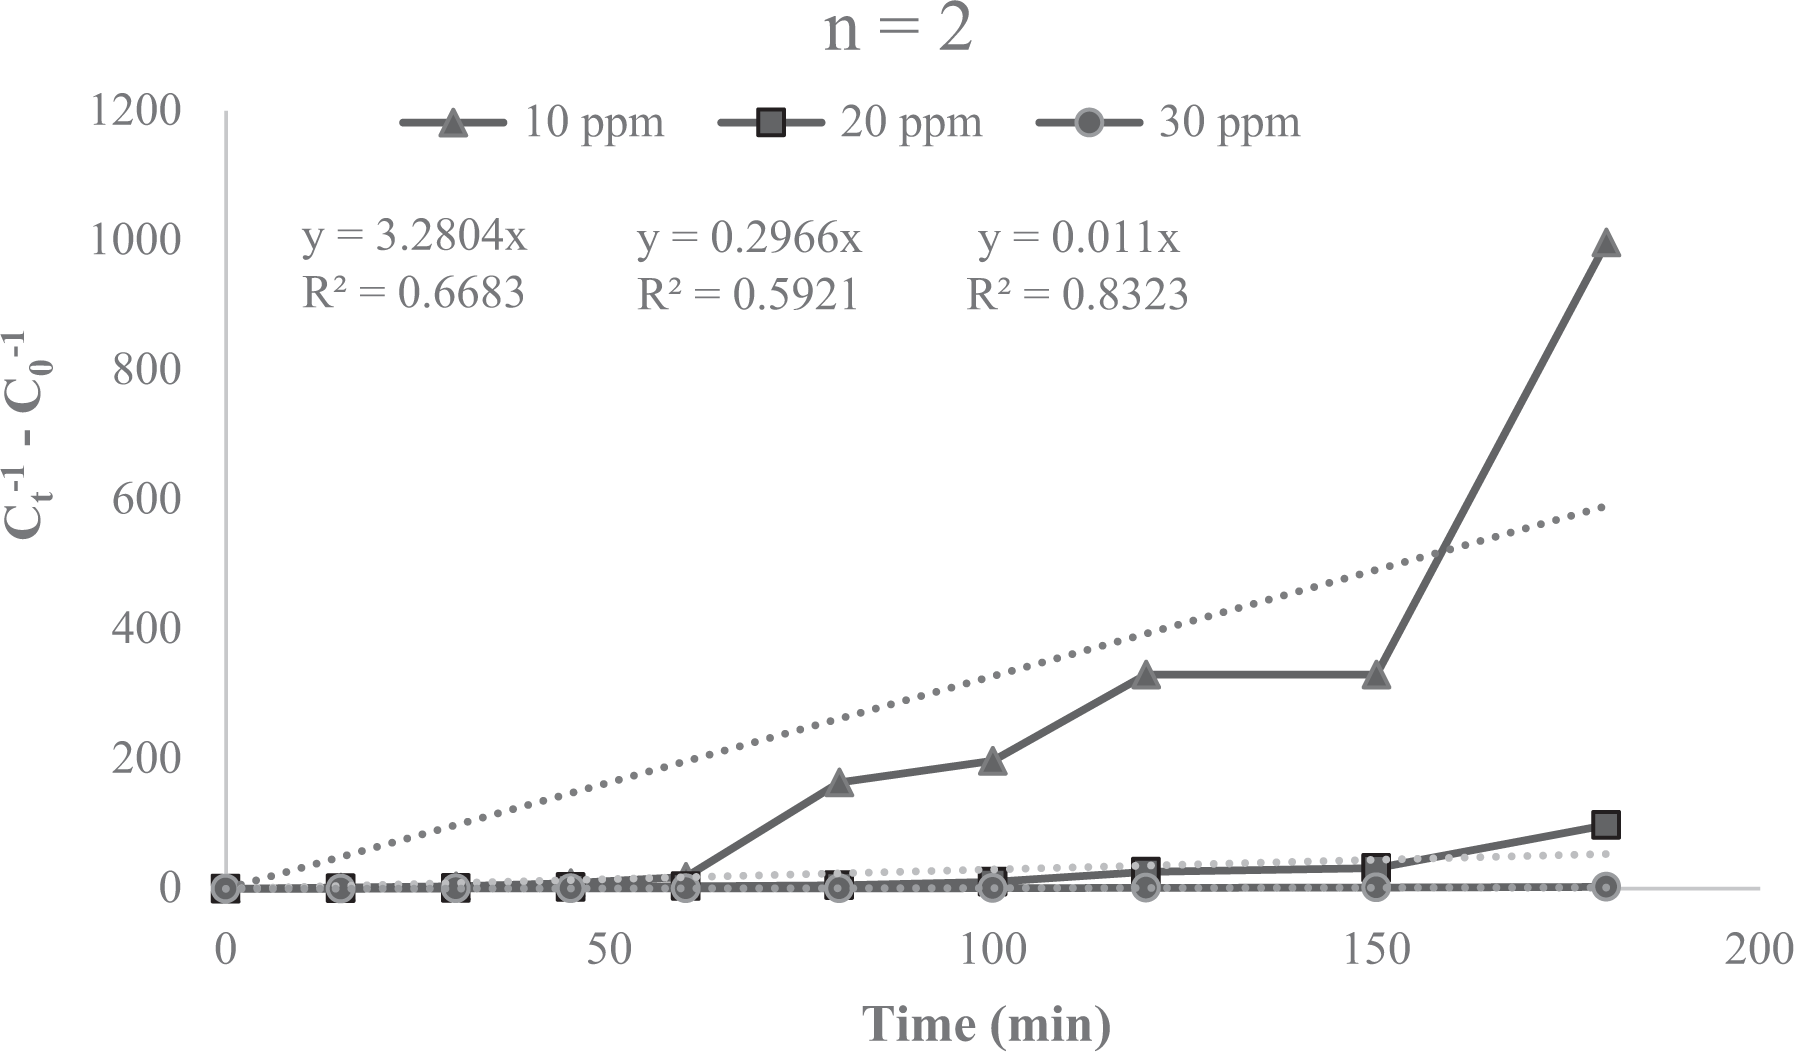
Second-order kinetic of decolorization of AR18. AR18: Acid Red 18
Equations of kinetic studies of AR18 decolorization.
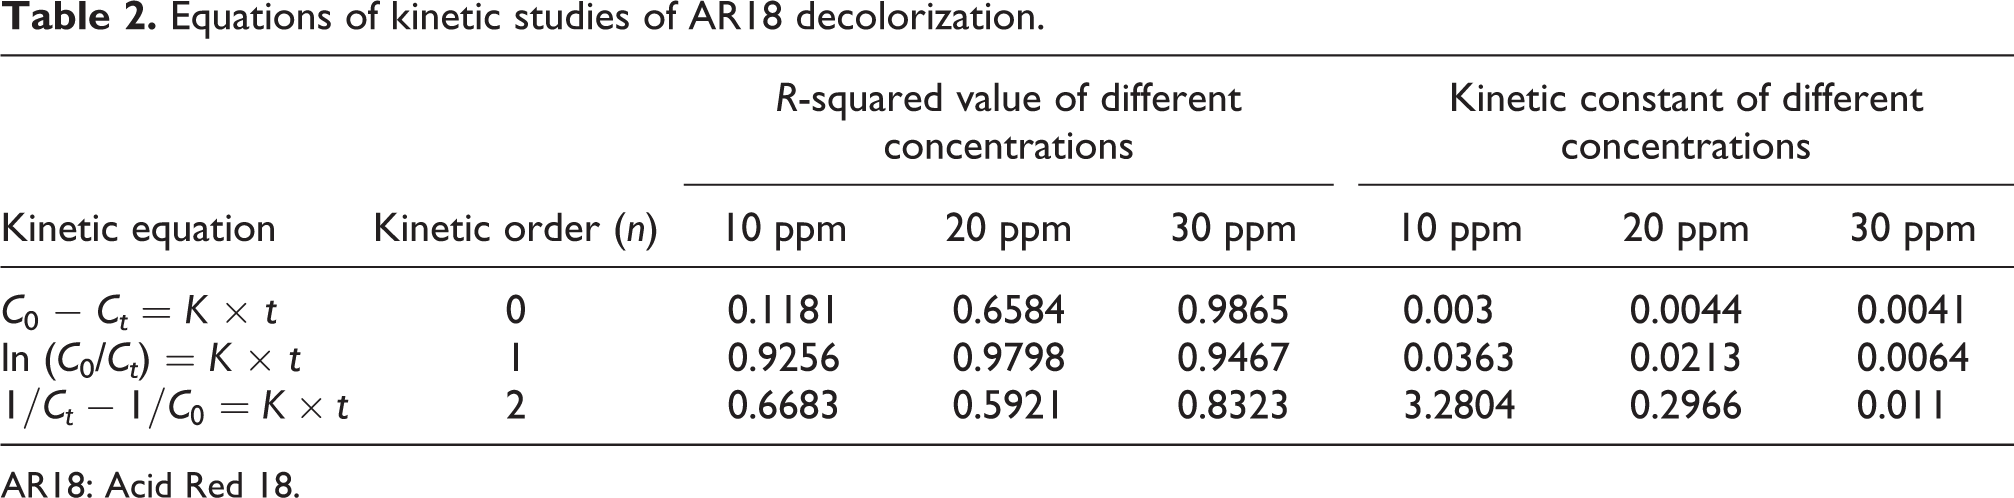
AR18: Acid Red 18.
Thermodynamic studies
To evaluate the effect of initial solution temperature on the decolorization process, several temperatures (293, 313, and 323 K) were adjusted. Figure 11 shows the influence of temperature on the process of AR18 decolorization. Accordingly, decolorization of AR18 at lower times for high temperature are more than the other conditions. Endothermic reaction and the thermodynamic studies were recognized calculating changes of Gibbs free energy, enthalpy, and entropy as the thermodynamic parameters using the following equations (Ahmadi et al., 2017a; Basturk and Karatas, 2015)


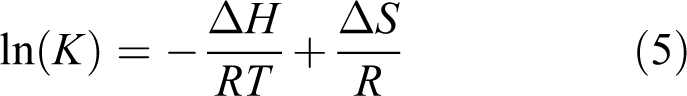
where ΔG is Gibbs free energy change (J/mol), ΔH is enthalpy (J/mol), ΔS is entropy (J/mol·K), R is the gas constant, T is the initial solution temperature (K), and K is the rate constant (first-order reaction rate constant).

Effect of initial temperature of dye solution.
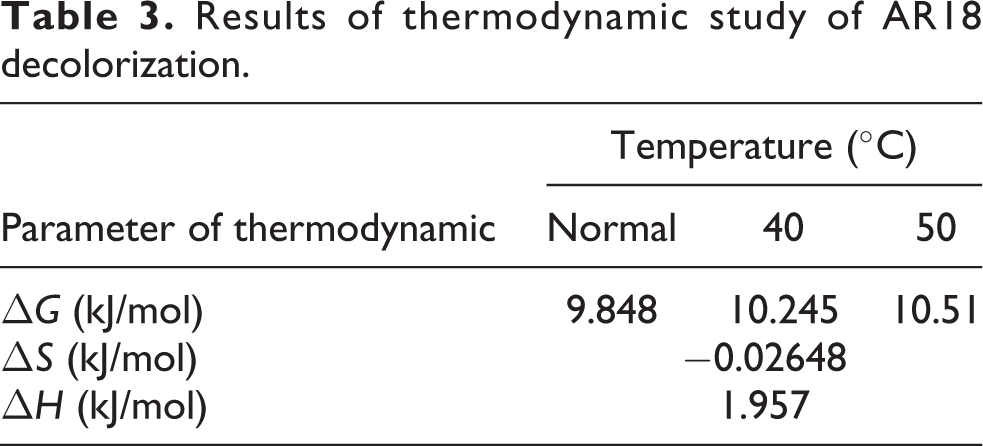
Figure 12 shows the first-order kinetic constants (ln [k1]) versus temperature (1/T), and its achieved results, the thermodynamic parameters, are presented in Table 3. Also, decolorization was decreased at the end of the process, because of increasing the solution concentration during the photocatalysis process at high temperature and decreasing dissolving gas. Actually, temperature and dissolving gas have an inverse relationship. Hence, decreasing dissolved O2 in solution, free radical O− also decreases, according to following reaction

Results of thermodynamic study of AR18 decolorization.
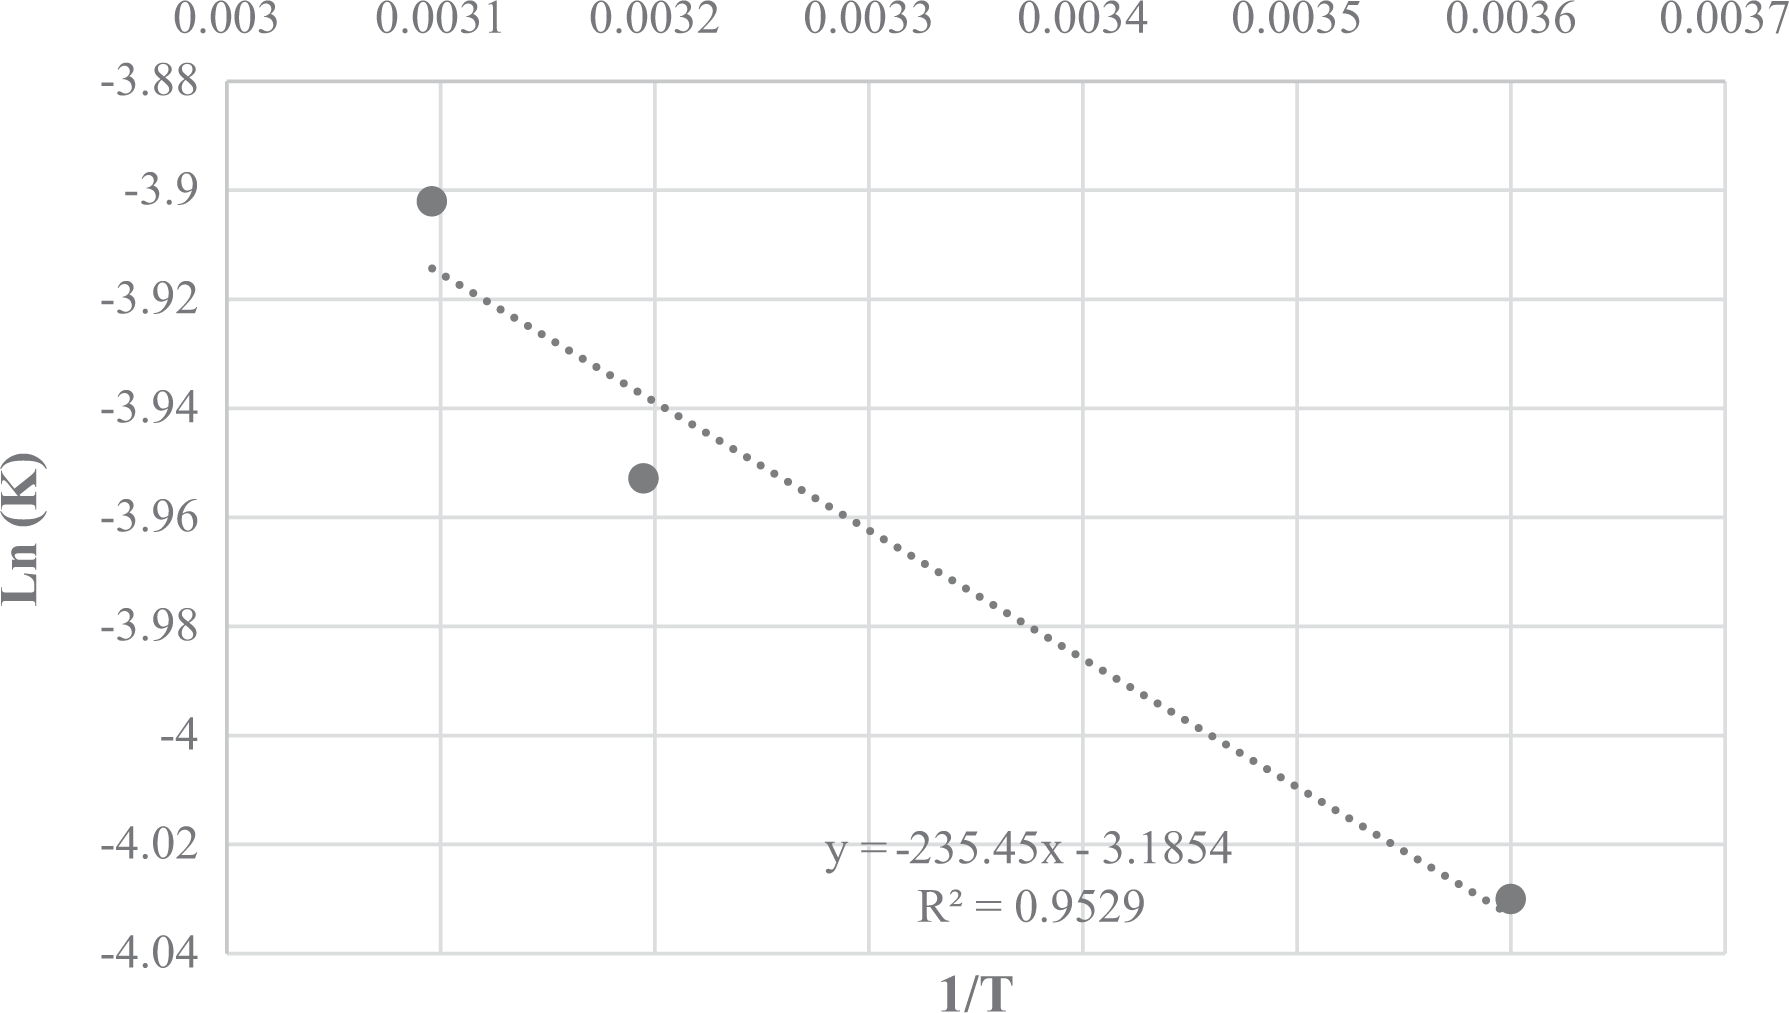
Van’t Hoff plot.
So, oxidation of dye decreases, which led to the less decolorization at the end of process than beginning for high temperature.
Mineralization
To compare degradation and decolorization of AR18, the extent of mineralization of the solution was measured during the process by TOC measurement. Figure 13 shows a comparison between decolorization and degradation after 180 min of UV irradiation. Accordingly, TOC removal of about 65% was achieved, while decolorization of dye was almost 100% after 180 min. Furthermore, the degradation was always less than decolorization at the same time, because the aromatic rings were broken later than chromophore groups in AR18 (Ghoreishian et al., 2014; Kakavandi and Babaei, 2016; Marandi et al., 2012).
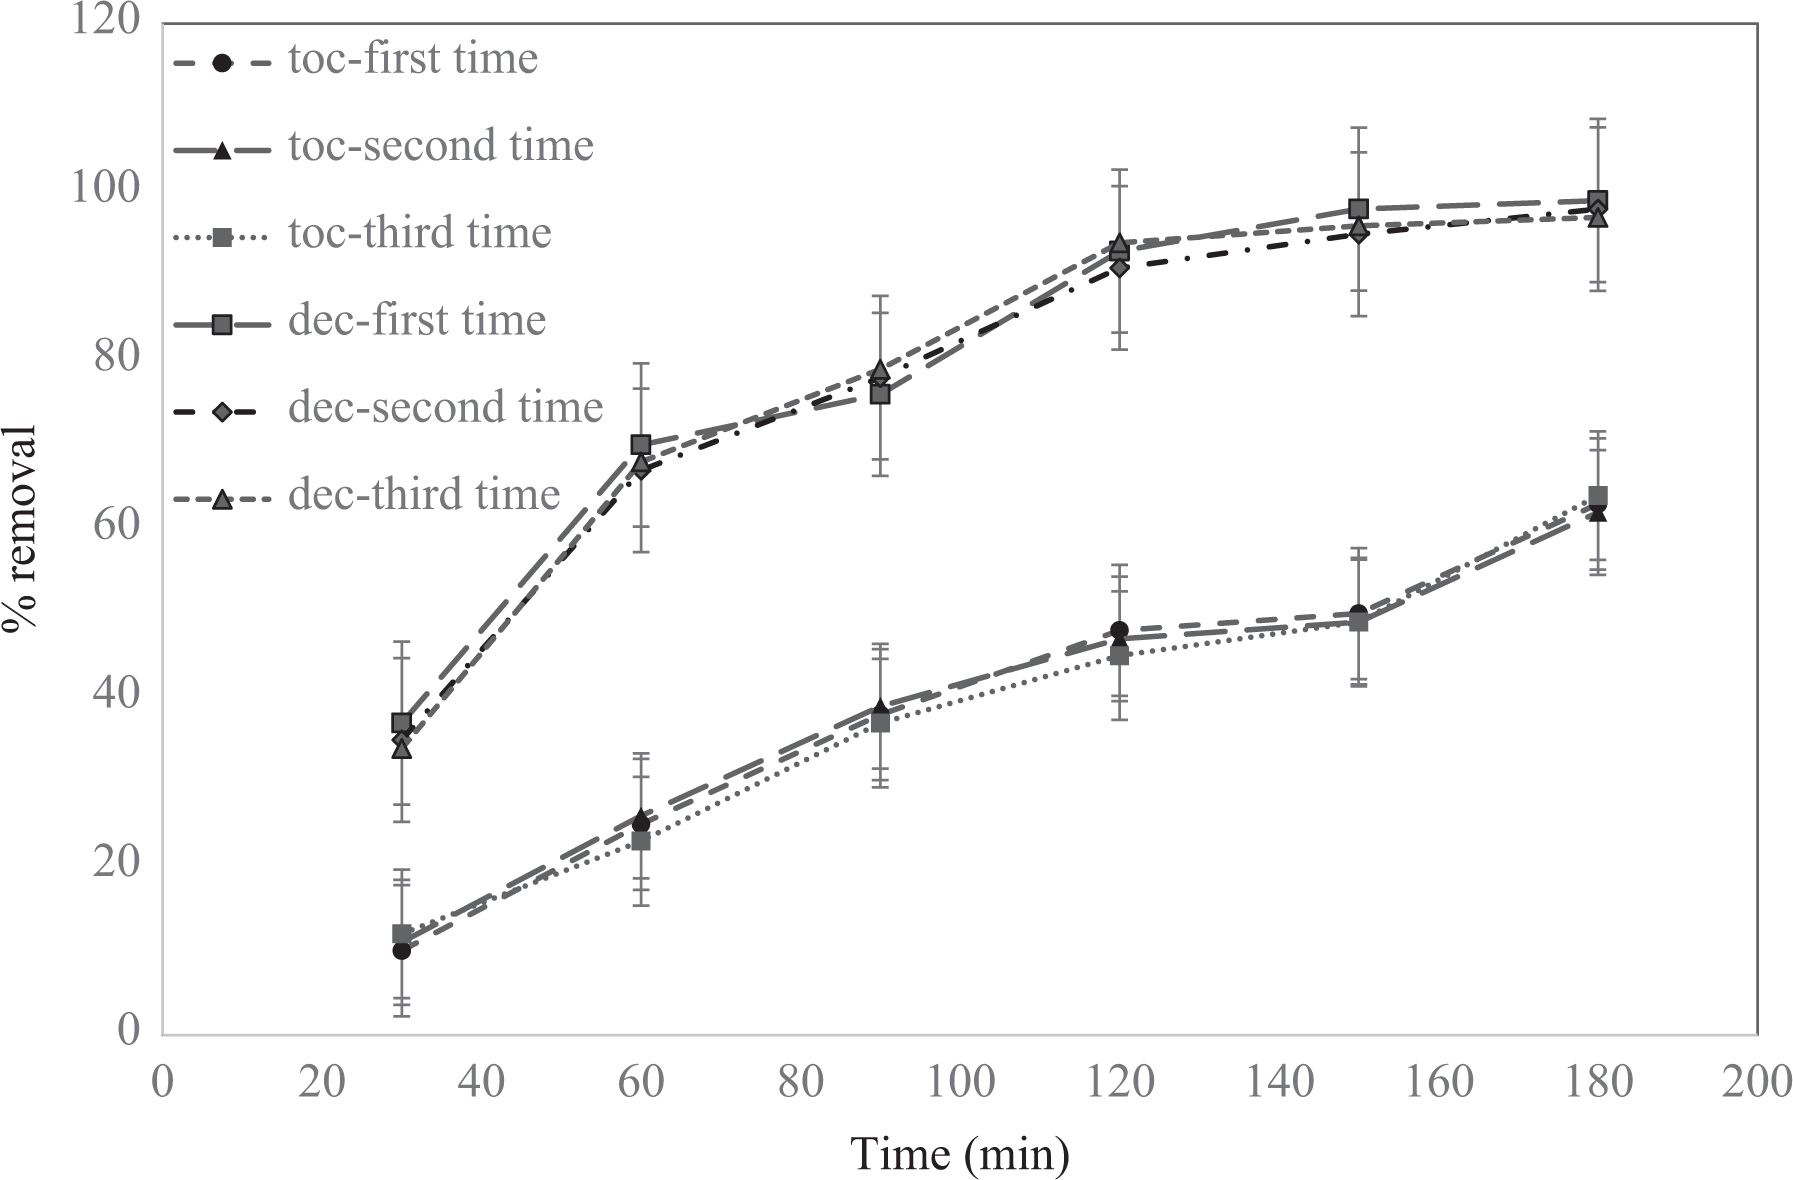
The comparison between decolorization and degradation.
Cost analysis
To manage the economy of photocatalytic treatment of AR18 by nanosized ZnO-Ag-Nd, economic studies were carried out. Cost of the electrical energy of the process as an economic factor has been determined for treatment of 1 m3 of the solution by following equation (Cater et al., 2000; Daneshvar et al., 2005; Khataee et al., 2009):
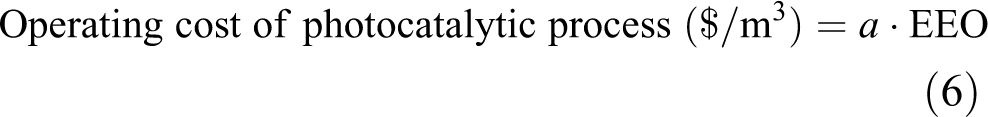
where, a is the unit price for the Iranian market in July 2017 and EEO is the electrical energy per order which was calculated by equation (7)

where P is the power of light (kW), V is the volume of solution, and K is the kinetic constant.
Results of the economic study of EEO with 1 L solution and various AR18 concentrations are presented in Table 4, in which the electricity price was 0.015 US$/kWh. Also, the operational costs were calculated (about 0.28–1.62 US$/m3).
Operating cost of photocatalytic process at various concentrations.a
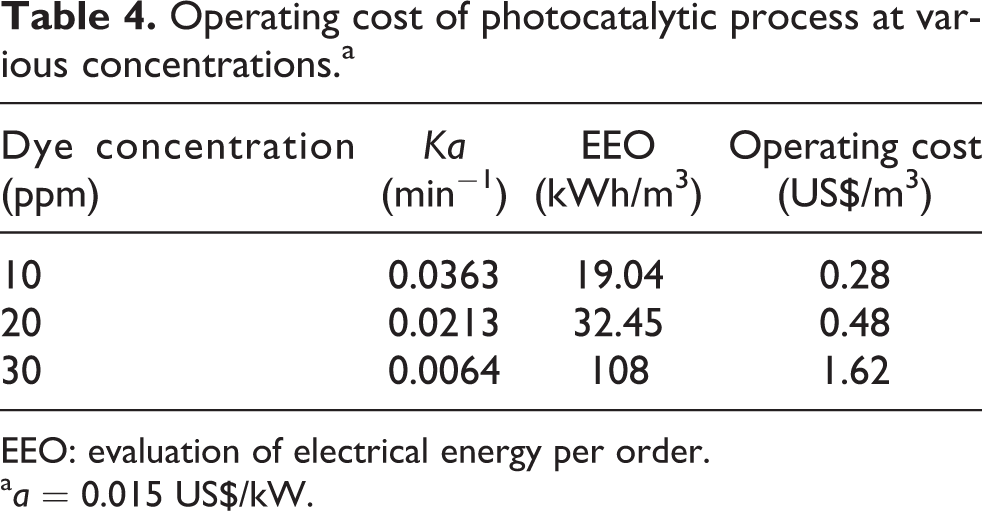
EEO: evaluation of electrical energy per order.
a a = 0.015 US$/kW.
Conclusion
In the present research, a ZnO-Ag-Nd nanophotocatalyst was synthesized via combustion method, and its features were measured using FTIR, XRD, and SEM methods. Influence of key operational factors such as pH, photocatalyst dosage, and initial concentration of dye shows an optimum condition of the decolorization (pH = 6.2, dosage of photocatalyst = 0.08 g/l, and low concentration of dye solution). Kinetic studies showed that the process follows a first-order model. Also, according to the results of thermodynamic studies (van’t Hoff plot), it was determined that the decolorization process of dye is endothermic. An economic analysis demonstrated that this advanced photocatalytic oxidation process was a cost-effective treatment method for low-concentration organic pollutants.
Footnotes
Acknowledgments
We would like to show our gratitude to Mr Ali Reza Naeimi and Mr Abdolkarim Sharifi (ICST, Iran) and wastewater treatment laboratory of ENSCMu (Haute-Alsace University, France) for their scientific helps.
Declaration of Conflicting Interests
The author(s) declared no potential conflicts of interest with respect to the research, authorship, and/or publication of this article.
Funding
The author(s) received no financial support for the research, authorship, and/or publication of this article.