
Abstract
Compact fluorescent lamps (CFLs) have become a popular lighting choice in recent years despite the good performance of light-emitting diode (LED) lamps. The CFLs that have been produced recently contain 1.5–3.5 mg Hg/lamp. There is evidence that even low doses of mercury are toxic. This study aimed to assess occupational exposure to mercury vapor in workers of a CFLs factory by determining mercury levels in personal and ambient air samples and urine of workers. This cross-sectional study was conducted on 59 workers in a CFLs factory in Iran. Personal and ambient air sampling of mercury vapor levels (MVLs) was performed during a workday. In total, 10 personal samples and 10 ambient air samples of mercury vapor were collected simultaneously from different units of the factory. Urine samples were collected before the work shift. Samples were analyzed using a cold-vapor atomic absorption spectrophotometer (CVAAS). The mean of the MVLs in the personal and ambient air samples was 14.78 ± 5.76 and 67.10 ± 59.37 µg.m−3, respectively. The highest MVL was measured for the production line supervisor (25 µg.m−3). There was a significant correlation between the MVLs in the ambient air and personal samples (r = 0.84, p = 0.005). The mean urinary mercury level (UML) was 13.85 ± 13.14 µg/g creatinine. The UML of 86.4% workers was below the 20 µg/g creatinine recommended by the Centre of Environmental and Occupational Health in Iran. There were significant differences between the UMLs in different areas of the factory (p = 0.041). Lamp breakage was an important determinant of exposure to mercury vapor; hence, effective programs to control mercury vapor are essential in the CFLs industry.
Introduction
Compact fluorescent lamps (CFLs) are electrical discharge lamps that contain low pressure mercury vapor and an inert gas, usually argon. The inside glass is coated with a fluorescent phosphor powder (Assari et al., 2015). The mercury vapor is excited by an electrical current between two electrodes and emits ultraviolet (UV) light. The UV light causes the phosphor coating to fluoresce and emit visible light (Assari et al., 2013, Kasraei et al., 2010, Shao et al., 2012). The CFLs are recommended as an alternative to incandescent lamps by many local and federal government agencies (Johnson et al., 2008; Shao et al., 2012). In recent years, because of a 75% reduction in energy usage, a 10-fold increase in useful life, affordable price, and being eco-friendly, CFL lamps are used extensively, in spite of good performance of other types such as light-emitting diode (LED) lamps. They have also become a popular lighting choice instead of incandescent lamps in Iran because of removal of energy subsidies, increasing electricity prices, implementing policies of energy consumption reduction, and encouraging people to use CFLs (Taghipour et al., 2014).
A disadvantage of CFLs is that they contain milligram quantities of mercury, and the amount of their mercury decreases over the years (Sarigiannis et al., 2012). Internationally, concerns have been raised regarding potential mercury release and consequently human exposures following CFLs breaking (Lang et al., 2015). The mercury content in a CFL is not listed on the packaging of the products and is not always easily accessible from manufacturer’s websites. It has been reported that the amount of mercury is up to 30 mg per light lamp of CFLs (Jang et al., 2005; Lang et al., 2015). Nevertheless, the quantity of mercury in a fluorescent lamp depends on the type (linear or CFL), brand, and the wattage. The amount of mercury vapor that will be released is highly dependent on the initial quantity of the mercury in the lamp and the age of the lamp. New lamps release more mercury vapor compared to older or spent lamps (Aucott et al., 2003; Stahler et al., 2008). As the bulb ages, the elemental mercury inside the bulb oxidizes and forms predominantly HgO, an inorganic mercury compound. (Jang et al., 2005). HgO is a highly toxic substance that can be absorbed into the body by inhalation of its aerosol, through the skin and by ingestion. The substance is irritating to the eyes, the skin, and the respiratory tract and may have effects on the kidneys, resulting in renal impairment (glomerulonephritis). However, the major target organ for elemental mercury toxicity in humans is the central nervous system.
Elemental mercury becomes dispersed throughout the lamp during operations, and 14% of the mercury can be diffused through the glass matrix (Lang et al., 2015). Hence, manufacturers add sufficient mercury to ensure that there is an adequate supply of mercury vapor for the life of the lamp (Aucott et al., 2003, Nance et al., 2012).
Mercury vapor is the dominant mercury form in the early stages of lamp life. Some CFLs are broken accidentally during shipping, retail sales, consumer use, and recycling and release a portion of their mercury vapor (Raposo et al., 2003). There is limited information on the timing and extent of mercury vapor release from fractured lamps (Lang et al., 2015). The release of only 1 mg of mercury vapor (∼20% of the Hg contained in a single CFL) into a 500 m3 room (10 × 10 × 5 m3) yields 2.0 µg/m3 or 10 times the ATSDR recommended level of 0.2 µg/m3 in the absence of ventilation (Johnson et al., 2008).
When a CFL has been broken, the mercury vapor will be released. Therefore, the key exposure pathway is inhalation. About 80–97% of the inhaled elemental mercury is absorbed through the lungs, and only 2.6% of elemental mercury vapor is absorbed through dermal exposure (HPA, 2006). The elemental mercury is lipid soluble and can cross biological membranes including the blood–brain barrier and the placenta (Park and Zheng, 2012). Half-life of mercury vapor in the body is 2 months (range 30–90 days) (Risher and De Rosa, 2007). Mercury can affect the liver, kidney, heart, lungs, immune system, brain, and central and peripheral neural system (Assari et al., 2015, Kasraei et al., 2010). These effects depend on the magnitude of the exposure, the exposure duration, the age and health status of the individual, as well as the mercury compound (Nance et al., 2012). Therefore, it is critical to determine levels of mercury in occupational exposures. Thus, this study aimed to assess occupational exposure of workers to mercury (personal and biological monitoring) and monitoring of workplace ambient air (air of indoor environment) in a CFLs manufacturing factory.
Materials and methods
Subjects
In this cross-sectional study, we studied 59 workers (9 male and 50 female workers) from different units of a compact fluorescent lamp factory in the Saveh City, a city in the central part of Iran. The inclusion criteria were workers with experience and exposure to mercury for at least one year. Informed consent was obtained from all subjects who agreed to participate in the study. Based on the exclusion criteria, subjects with chronic liver disease or kidney disorders or chronic drug consumption were excluded.
Questionnaire
Participants were interviewed at the factory clinic. All participants filled out an extensive questionnaire, which was assigned to ensure confidentiality. The questionnaire included seven questions divided between three sections; descriptive characteristics (e.g. gender, age, and lifestyle), factors affecting exposure in workplace (e.g. working positions, years of working, use of personal protective equipment, and personal hygiene), and medical history (such as mental and nervous system diseases, hypertension, diabetes, liver, and kidney diseases or use of antipsychotic drugs).
Air sampling strategy
Personal sampling of mercury vapor in air was performed during 8 h of a working day for the line supervisor, stock clerk, attendant, appliance repair, server, and truck driver. A personal sampler was attached to each worker’s breathing zone.
Since the time and intensity of exposure and also working tasks varied in the factory, ambient air sampling was also performed at each of the job units during 4 h of a workday. Samplers were placed at different fixed positions, at approximately 1.5 m above the floor level. The sampling stations were the lamp components assembly line A and line B, print, packing, quality control, lighting test, temperature test, warehouse, and repairing unit. There is a simple fan in the repairing unit to control the mercury vapor; therefore, to evaluate fan efficiency, two ambient air samples were collected in both “turn on” and” turn off” positions of the fan. Sampling from ambient air was carried out using low-flow personal air samplers (Airchek® 2000, SKC Inc., UK) and solid sorbent tubes (hopcalite in single section, 200 mg, SKC Inc., UK) according to a NIOSH analytical method (NIOSH, 1994). Before sampling, the sampler was calibrated by an electronic flow meter (DC-Lite BIOS Drycal, SKC Inc.). The flow rate of 0.15 l min−1 was determined for an 8-h sampling time (8-h time weighted average) according to recommended standard set by the NIOSH 6009 method. Finally, samples were capped and packed securely for shipment.
Urine specimen collection
Spot urine samples (25 ml) were collected from each participant prior to shift work and were kept in polypropylene sampling vessels and stored at 4°C prior to analysis (ACGIH, 2017). Because the levels of mercury in urine can be influenced by the intake of fluids, physical activity or temperature, they were adjusted by creatinine concentrations.
Determination of mercury levels in air samples
The hopcalite sorbent and the front glass wool plug from each sorbent tube was transferred into a 100-ml volumetric flask. Then 2.5 ml of concentrated nitric acid (HNO3) and 2.5 ml of concentrated HCl were added, mixed, and allowed to stand for a further 1 h. The solution’s color changed to dark brown, which was carefully diluted to 50 ml with deionized water.
Determination of mercury levels in urine samples
The levels of mercury in urine were measured using the method of Ham (1997). Briefly, 2 ml of each urine sample was mixed with 0.1 ml of 35% w/w HNO3, 0.2 ml of 50% w/w sulfuric acid, and 0.5 ml of 5% w/v potassium permanganate. Then, digestion was carried out for 15 min. The digested sample solution was allowed to stand at room temperature. If the solution’s color changed from purple to brown, then a further 0.5 ml of permanganate solution was added, mixed, and allowed to stand for a further 8 h. This process of adding successive aliquots of permanganate solution and allowing the reaction to proceed was maintained until the purple color was sustained. After the permanganate reaction was completed, 0.4 ml of 2.5% w/v potassium persulfate was added and mixed; then, it was placed in an incubator at 95°C for at least 2 h before cooling down to room temperature. Next, 0.5 ml of 5% w/v hydroxylamine hydrochloride and 1 ml of 10% SnCl2 solution were added.
The total volume of the solution was diluted with deionized water to 10 ml and mixed well prior to determination. Creatinine in urine samples were measured using Jaffe’s method. Finally, results of the analysis were expressed as µg mercury/g of urinary creatinine to minimize problems due to variations in the urine osmolality and specific gravity.
Quality control
The samples were analyzed at the Industrial Toxicology Laboratory at the health faculty of Hamadan University of Medical Sciences. A cold-vapor atomic absorption spectrometer (CVAAS) model Analyst 700 Perkin Elmer (Germany) was used for determination of mercury in samples. A Hg hollow cathode lamp (Lumina™ Perkin Elmer, Germany) was used as the radiation source. Peak absorbance of the transient signal was chosen for quantification. Triplicate readings were taken for each sample, and the mean values were calculated. Technique accuracy was well within the acceptable recovery range of 96.8–104%, and the precision was also within acceptable limits of 4.2% relative standard deviation (RSD). Field blank samples and laboratory blank samples were used in all of the analyses as a quality control. There was good agreement between the obtained mean and the mercury levels in standard solutions (correlation coefficient (r) = 0.99).
Statistical analysis
The statistical analysis was done using SPSS Version 20 (IBM Corp., Armonk, New York, USA). Descriptive statistical analysis was done for the mercury levels in air and urinary samples. The normality of the data was tested using a Kolmogorov–Smirnov test. Spearman’s correlation coefficient was used to test the associations between mercury levels in ambient air and total mercury levels of urine. Multiple linear regression analysis was used to investigate the effect of independent variables (such as gender, age, and work experience) on urinary mercury concentrations (dependent variable). A p value of less than 0.05 was considered statistically significant.
Results
Occupational parameters
Mean ± standard deviation (SD) age of females and males were 30.08 ± 7.92 and 27.40 ± 6.04 years, respectively. Also, mean ± SD work experiences were 12.35 ± 4.93 and 15.10 ± 7.44 months, respectively. There were no significant differences between females and males in terms of age (p = 0.317) and work experience (p = 0.287). All workers had been working for 8 h per day and 6 days per week.
Mercury vapor levels in personal air samples
In total, 10 personal samples of mercury vapor were collected over 8 h. The mean ± SD of the mercury vapor levels (MVLs) in personal samples was 15.90 ± 6.42 µg.m−3. The highest MVLs was estimated for a line supervisor (29 µg.m−3). The MVLs of other samples were lower than the threshold limit (25 µg.m−3) of the American Conference of Governmental Industrial Hygienists (ACGIH). The contours map of the individual exposure levels to mercury vapor in the different areas are presented in Figure 1.
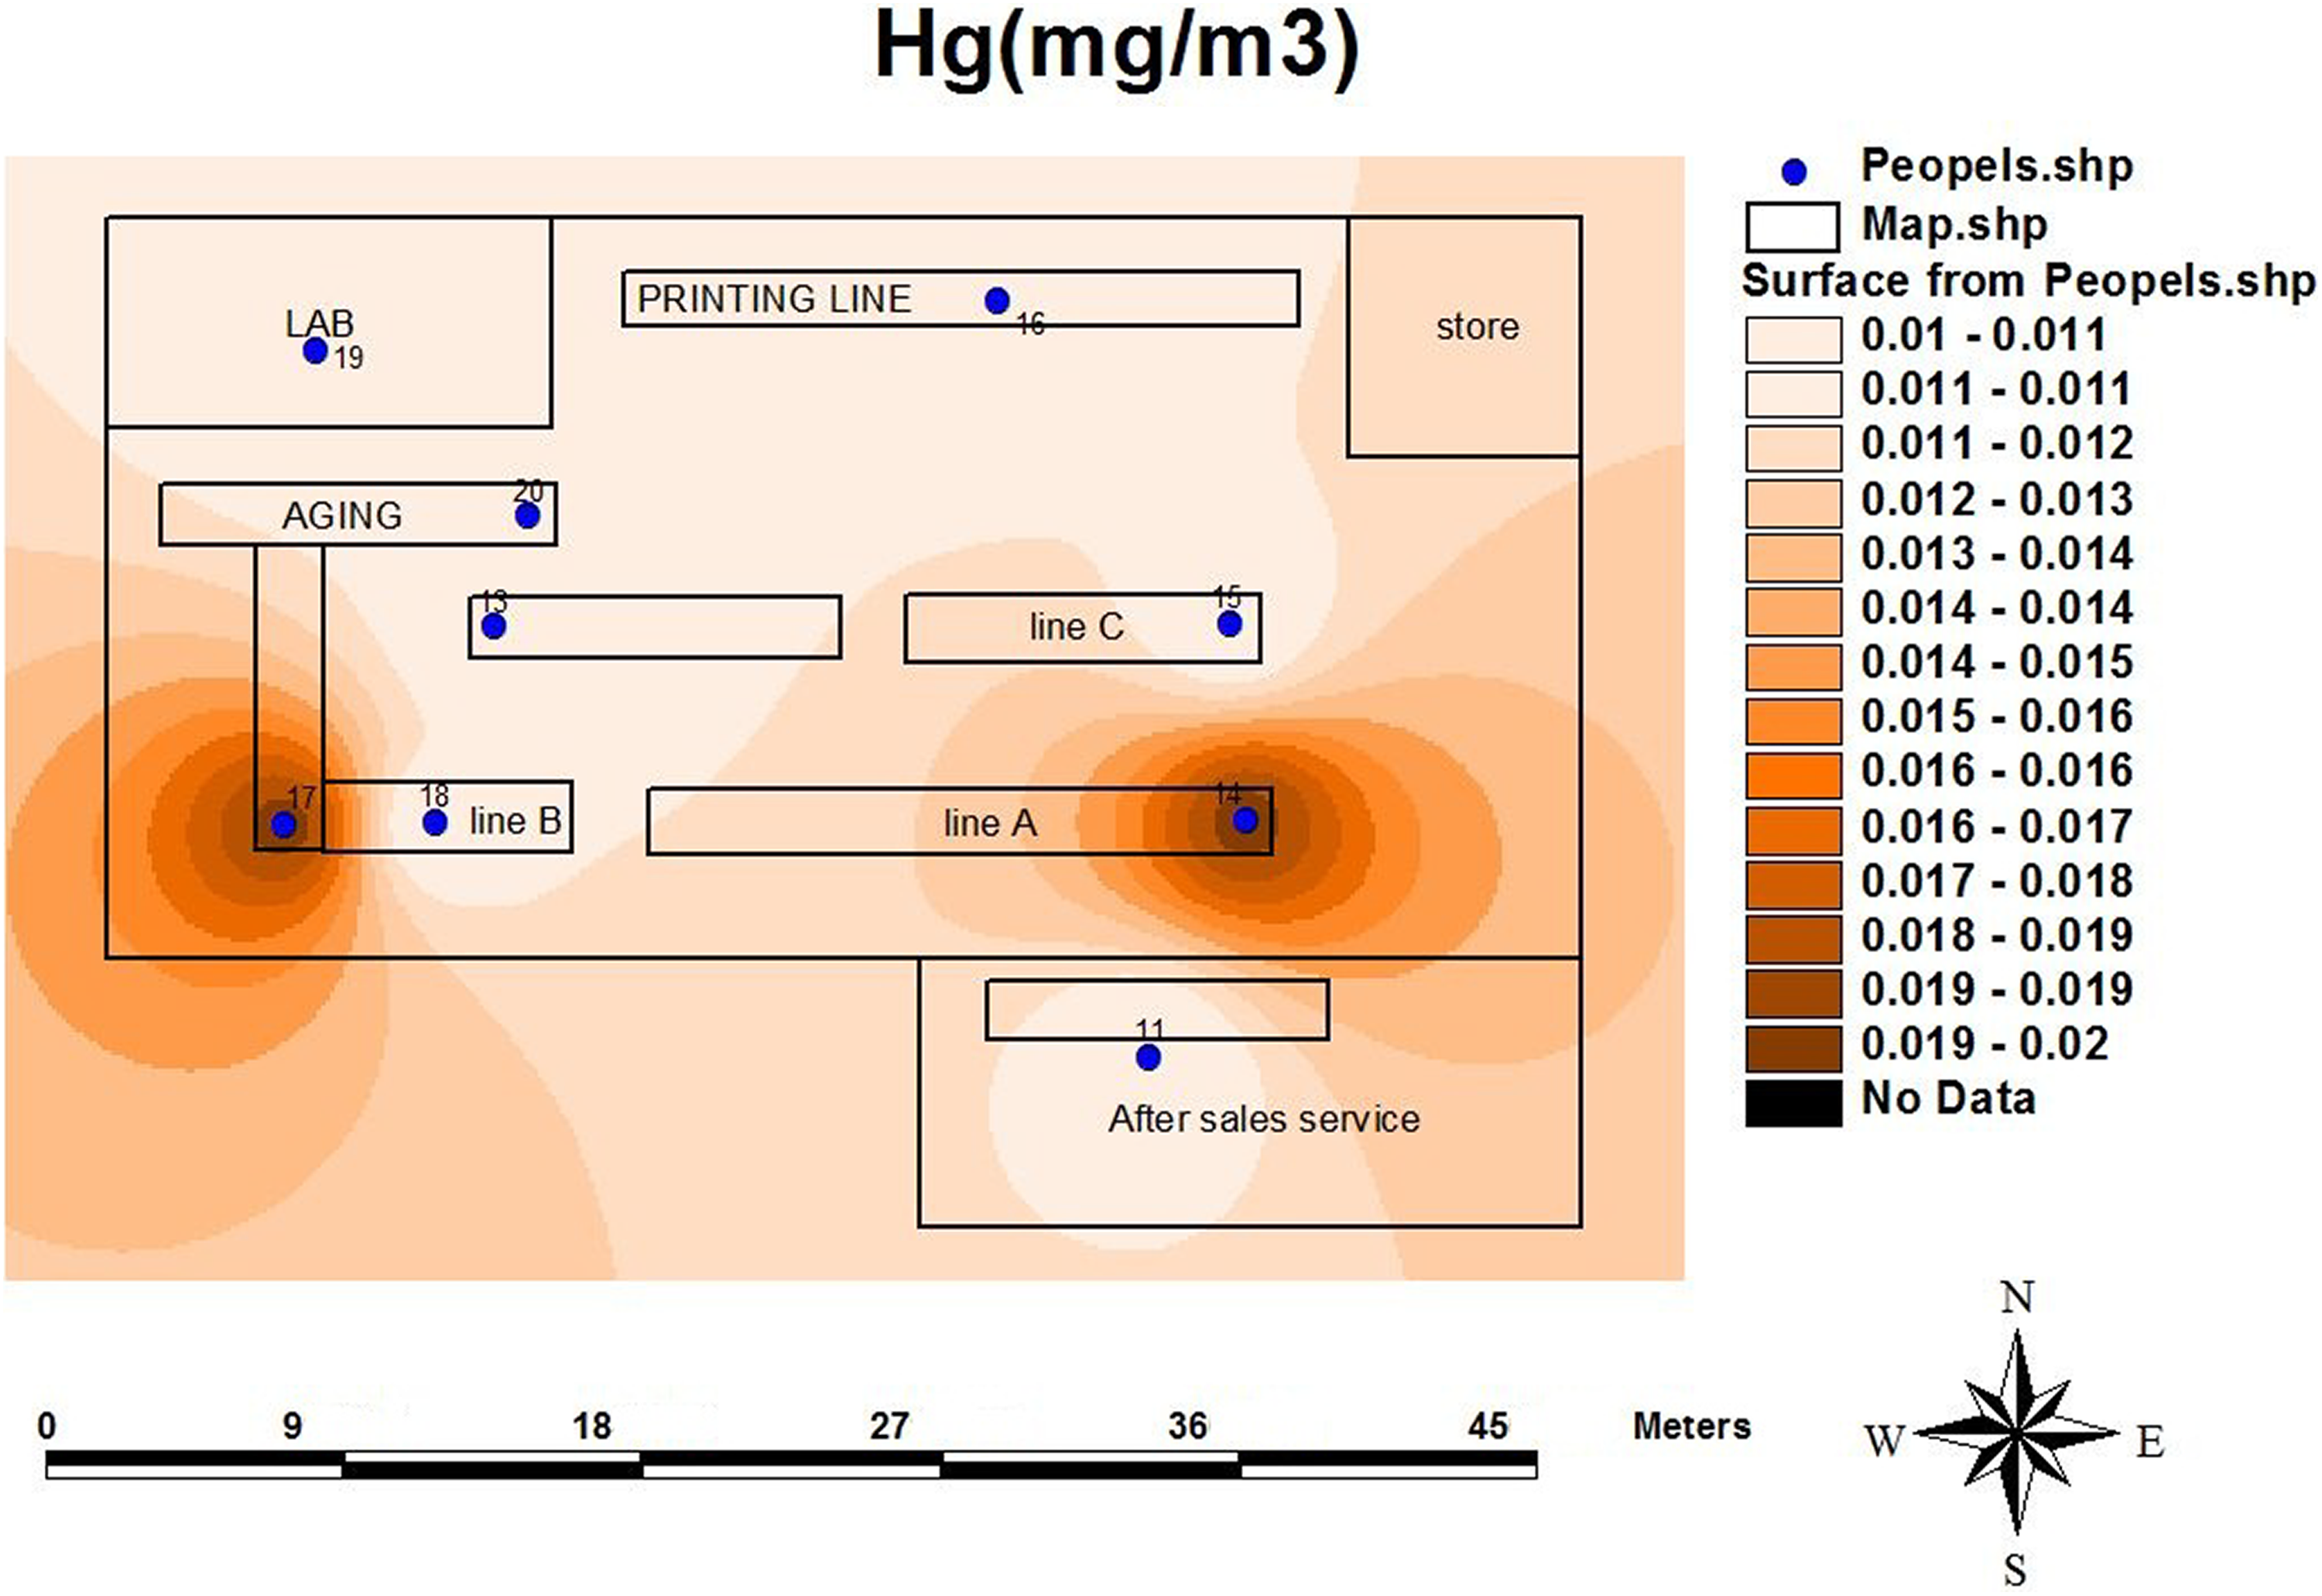
The contours map of individual exposure levels to mercury vapor.
Mercury vapor concentrations in ambient air samples
In total, 10 ambient air samples were collected over 4 h. The MVLs in ambient air samples ranged from 23 to 175 µg.m−3 (mean ± SD: 83.55 ± 56.81 µg.m−3). The MVLs, in the first and last of the lamp components assembly line A and line B, were 175 and 38 µg.m−3, and 137 and 42 µg.m−3, respectively. Also the MVLs in lighting test, print and packaging units were 93, 112, and 119 µg.m−3, respectively. Overall, the MVLs at eight stations exceeded threshold limit value (25 µg.m−3) of ACGIH. In the repairing unit, the MVLs in both “turn on” and “turn off” positions of the fan were 193 µg m−3 and 13 µg m−3, respectively, and the fan efficiency was 94%. The contours map of MVLs in ambient air in the different areas and in both “turn on” and” turn off” positions of the fan in the repairing unit are presented in Figure 2.
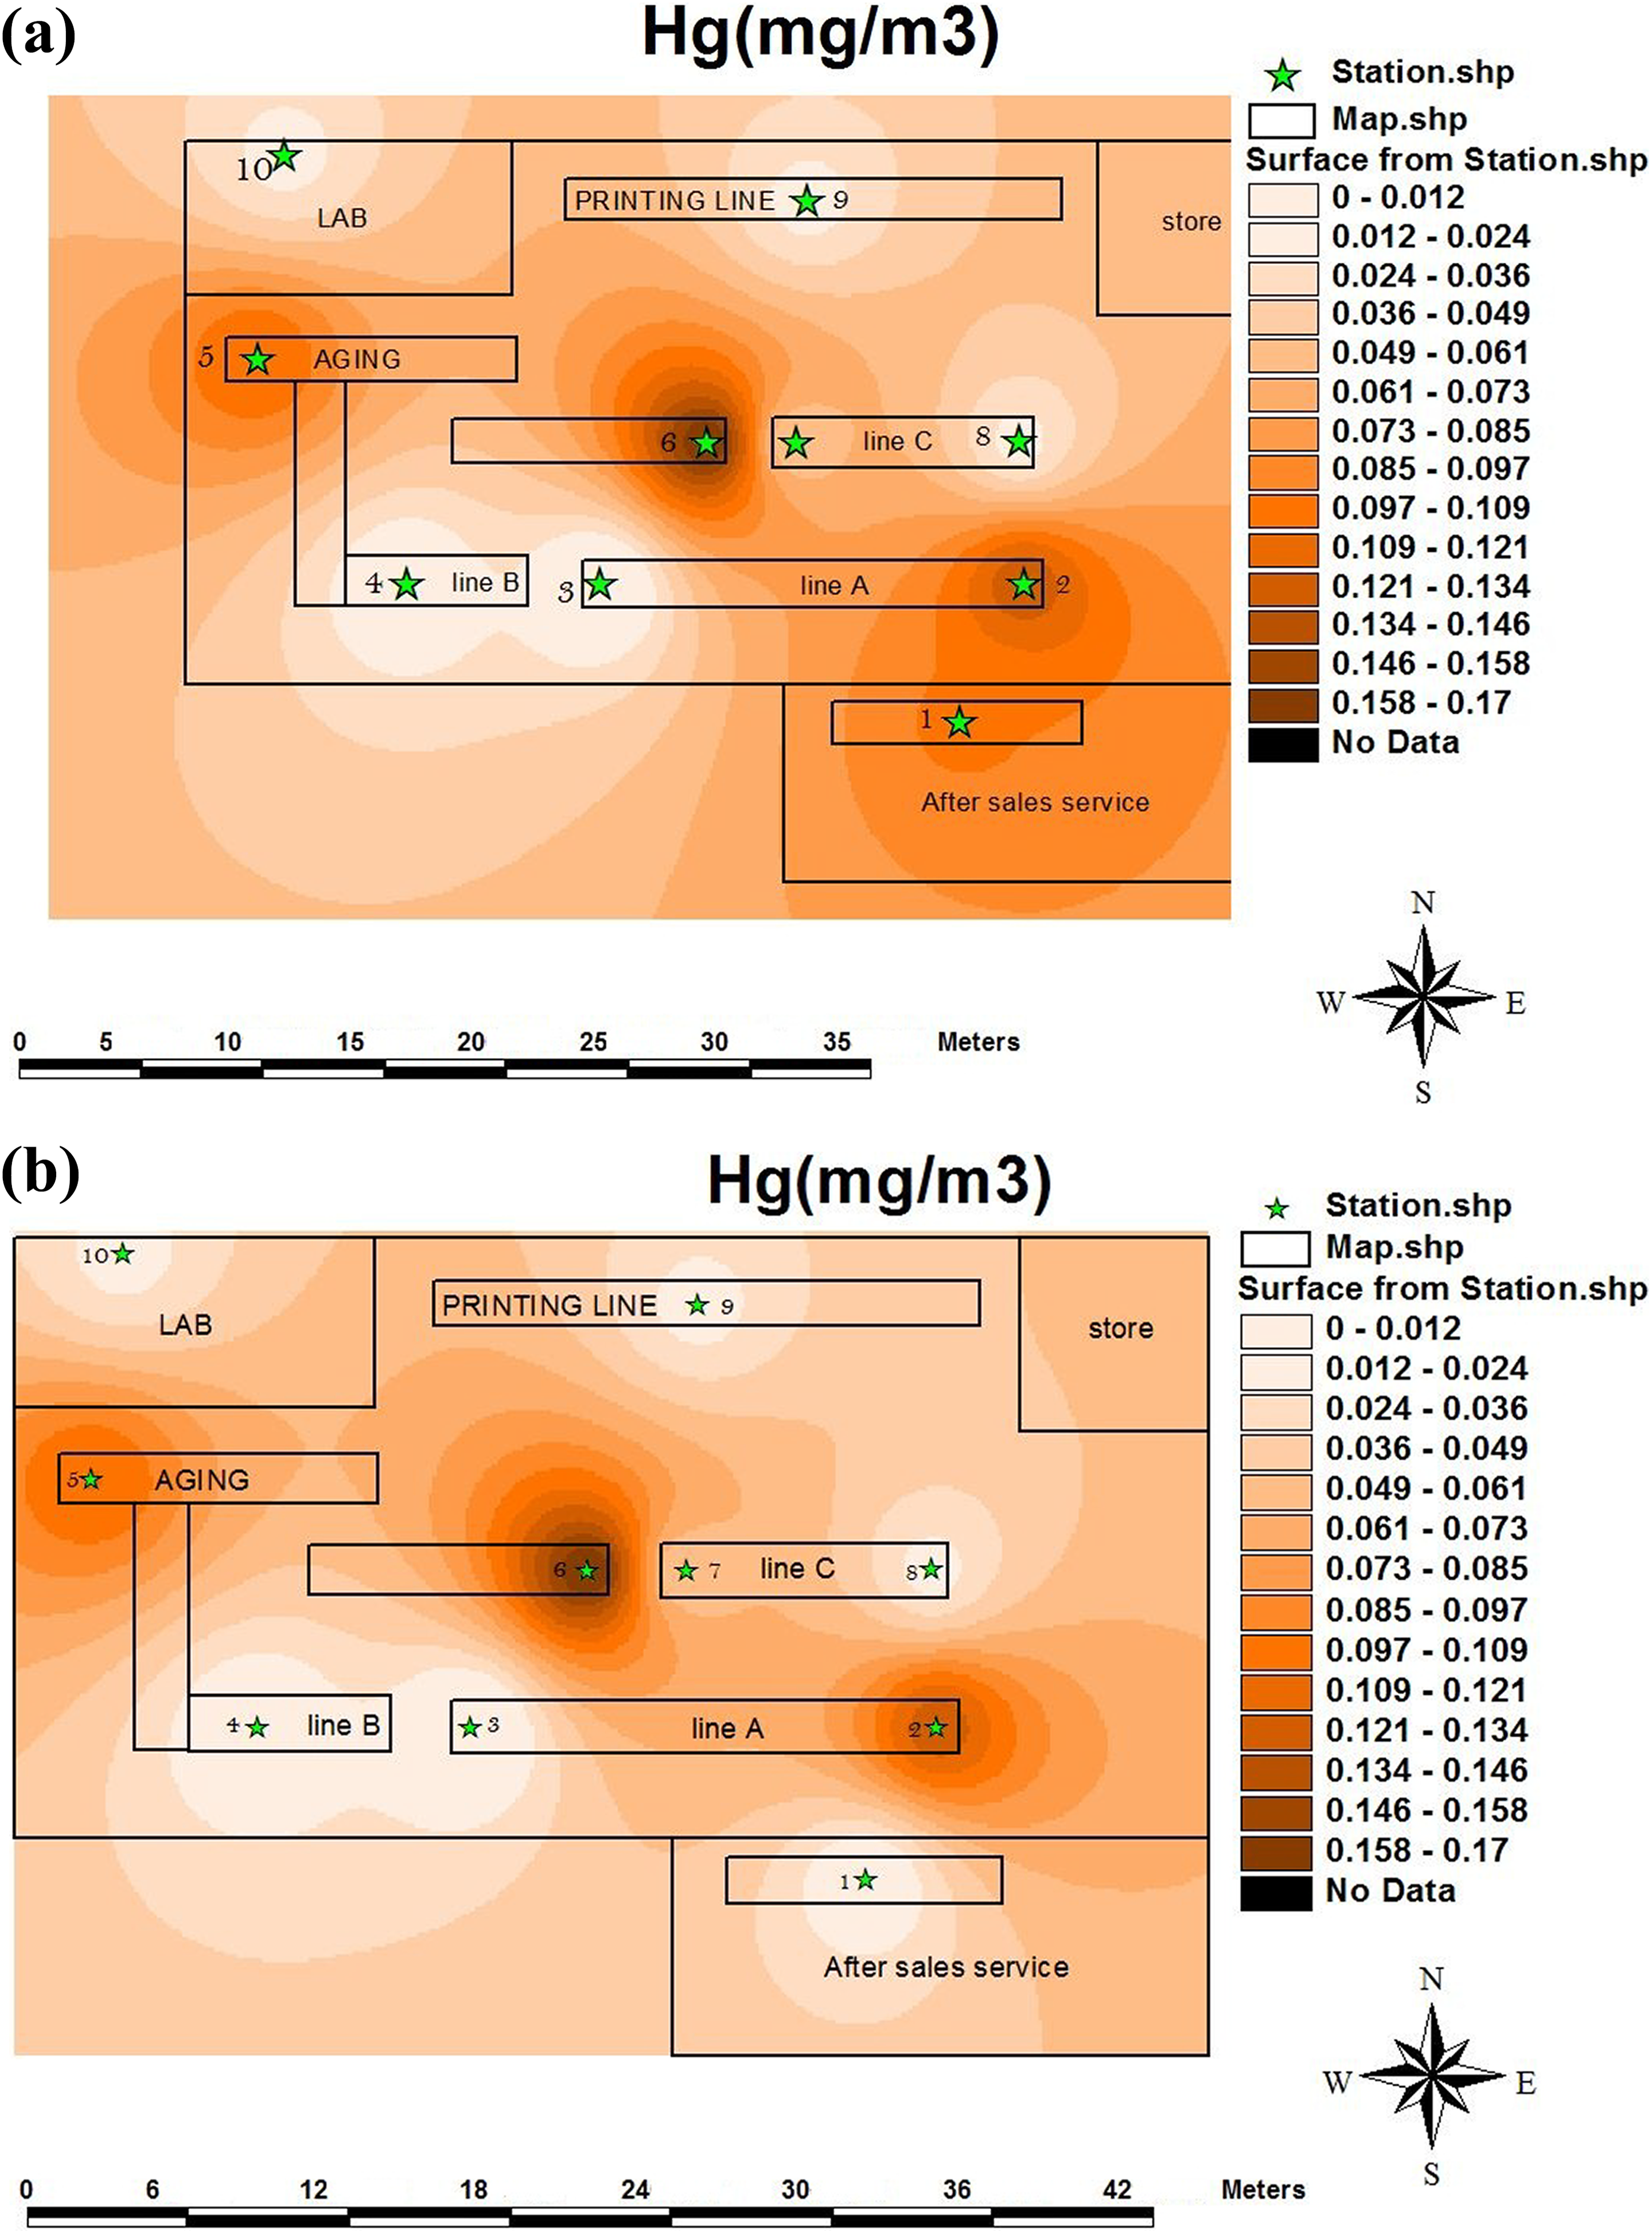
The contours map of mercury vapor levels in ambient air samples in different units. (a) Turn on and (b) turn off positions of the fan in the repairing unit. (1) After-sales service, (2) the beginning of the assembly line A, (3) end of assembly line A, (4) assembly line B, (5) the beginning of the thermal test line, (6) the end of the thermal test line, (7) the beginning of the assembly line C, and (8) end of assembly line C.
Table 1 shows the MVLs in personal and ambient air samples in different area of the factory. The results showed that, there was significant correlation between the MVLs in ambient air and personal samples (r = 0.93, p = 0.0001).
Mercury vapor levels for personal and ambient air samples in different units of the factory.
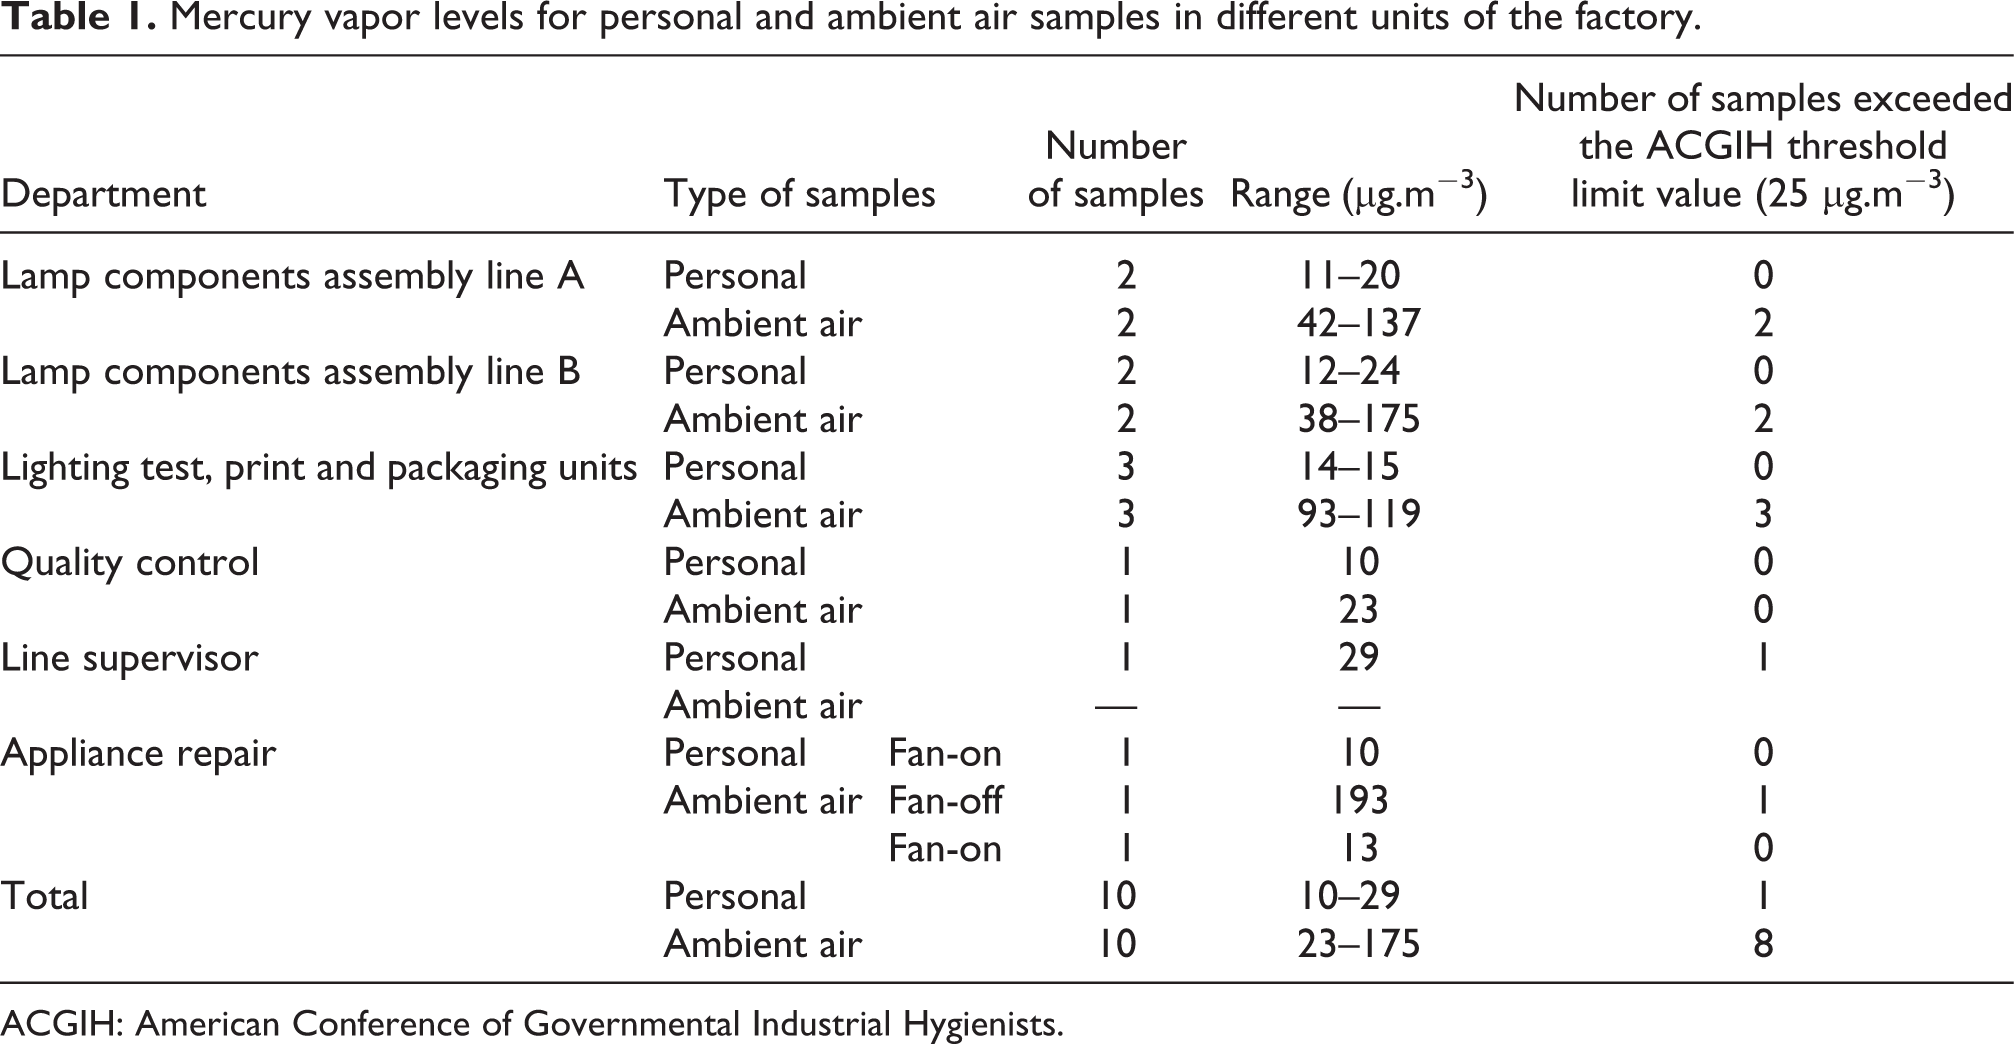
ACGIH: American Conference of Governmental Industrial Hygienists.
Total mercury levels in urine samples
The mean ± SD of urinary mercury levels (UMLs) in workers were 13.85 ± 13.14 µg/g creatinine (range 0.27 - 95.42 g/g creatinine). The UMLs of many subjects (86.4%) were below the 20 µg/g creatinine (biological exposure indices (BEIs) recommended by ACGIH). The highest UMLs was measured for the line supervisor (95.42 µg/g creatinine). Because of the difference with other data and to normalize the data distribution, these data were not inlcuded in mean calculations. The UMLs of subjects is shown in the histogram of Figure 3. Also, Table 2 shows the mean levels of mercury in the urine of workers by area or department (µg/g creatinine).
The mean urinary mercury levels of workers in difference units (µg/g crea.).
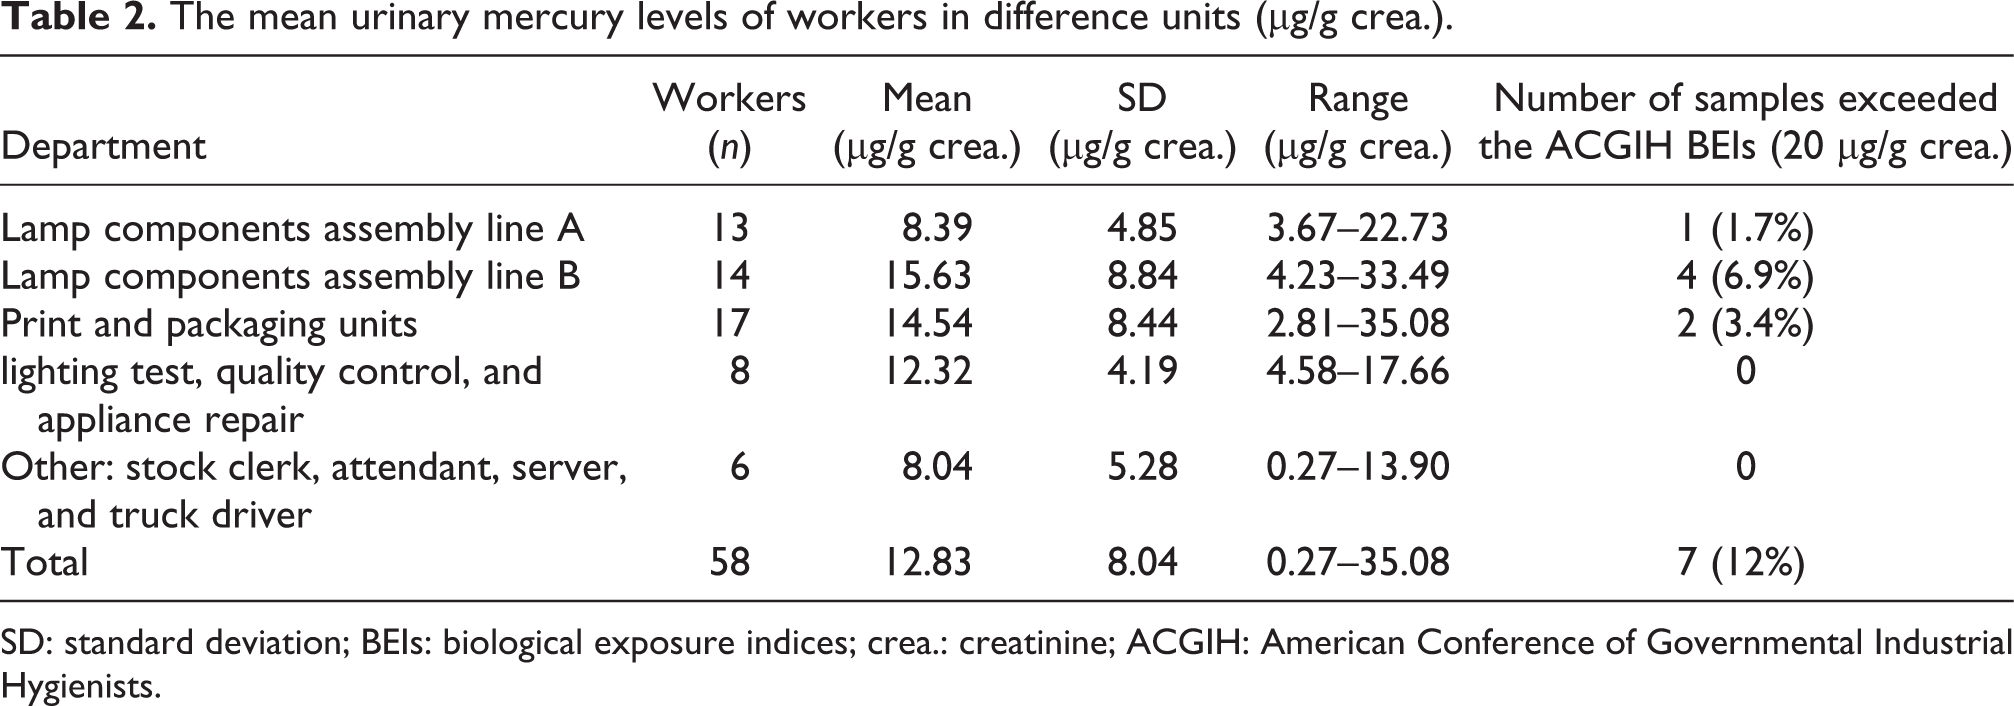
SD: standard deviation; BEIs: biological exposure indices; crea.: creatinine; ACGIH: American Conference of Governmental Industrial Hygienists.
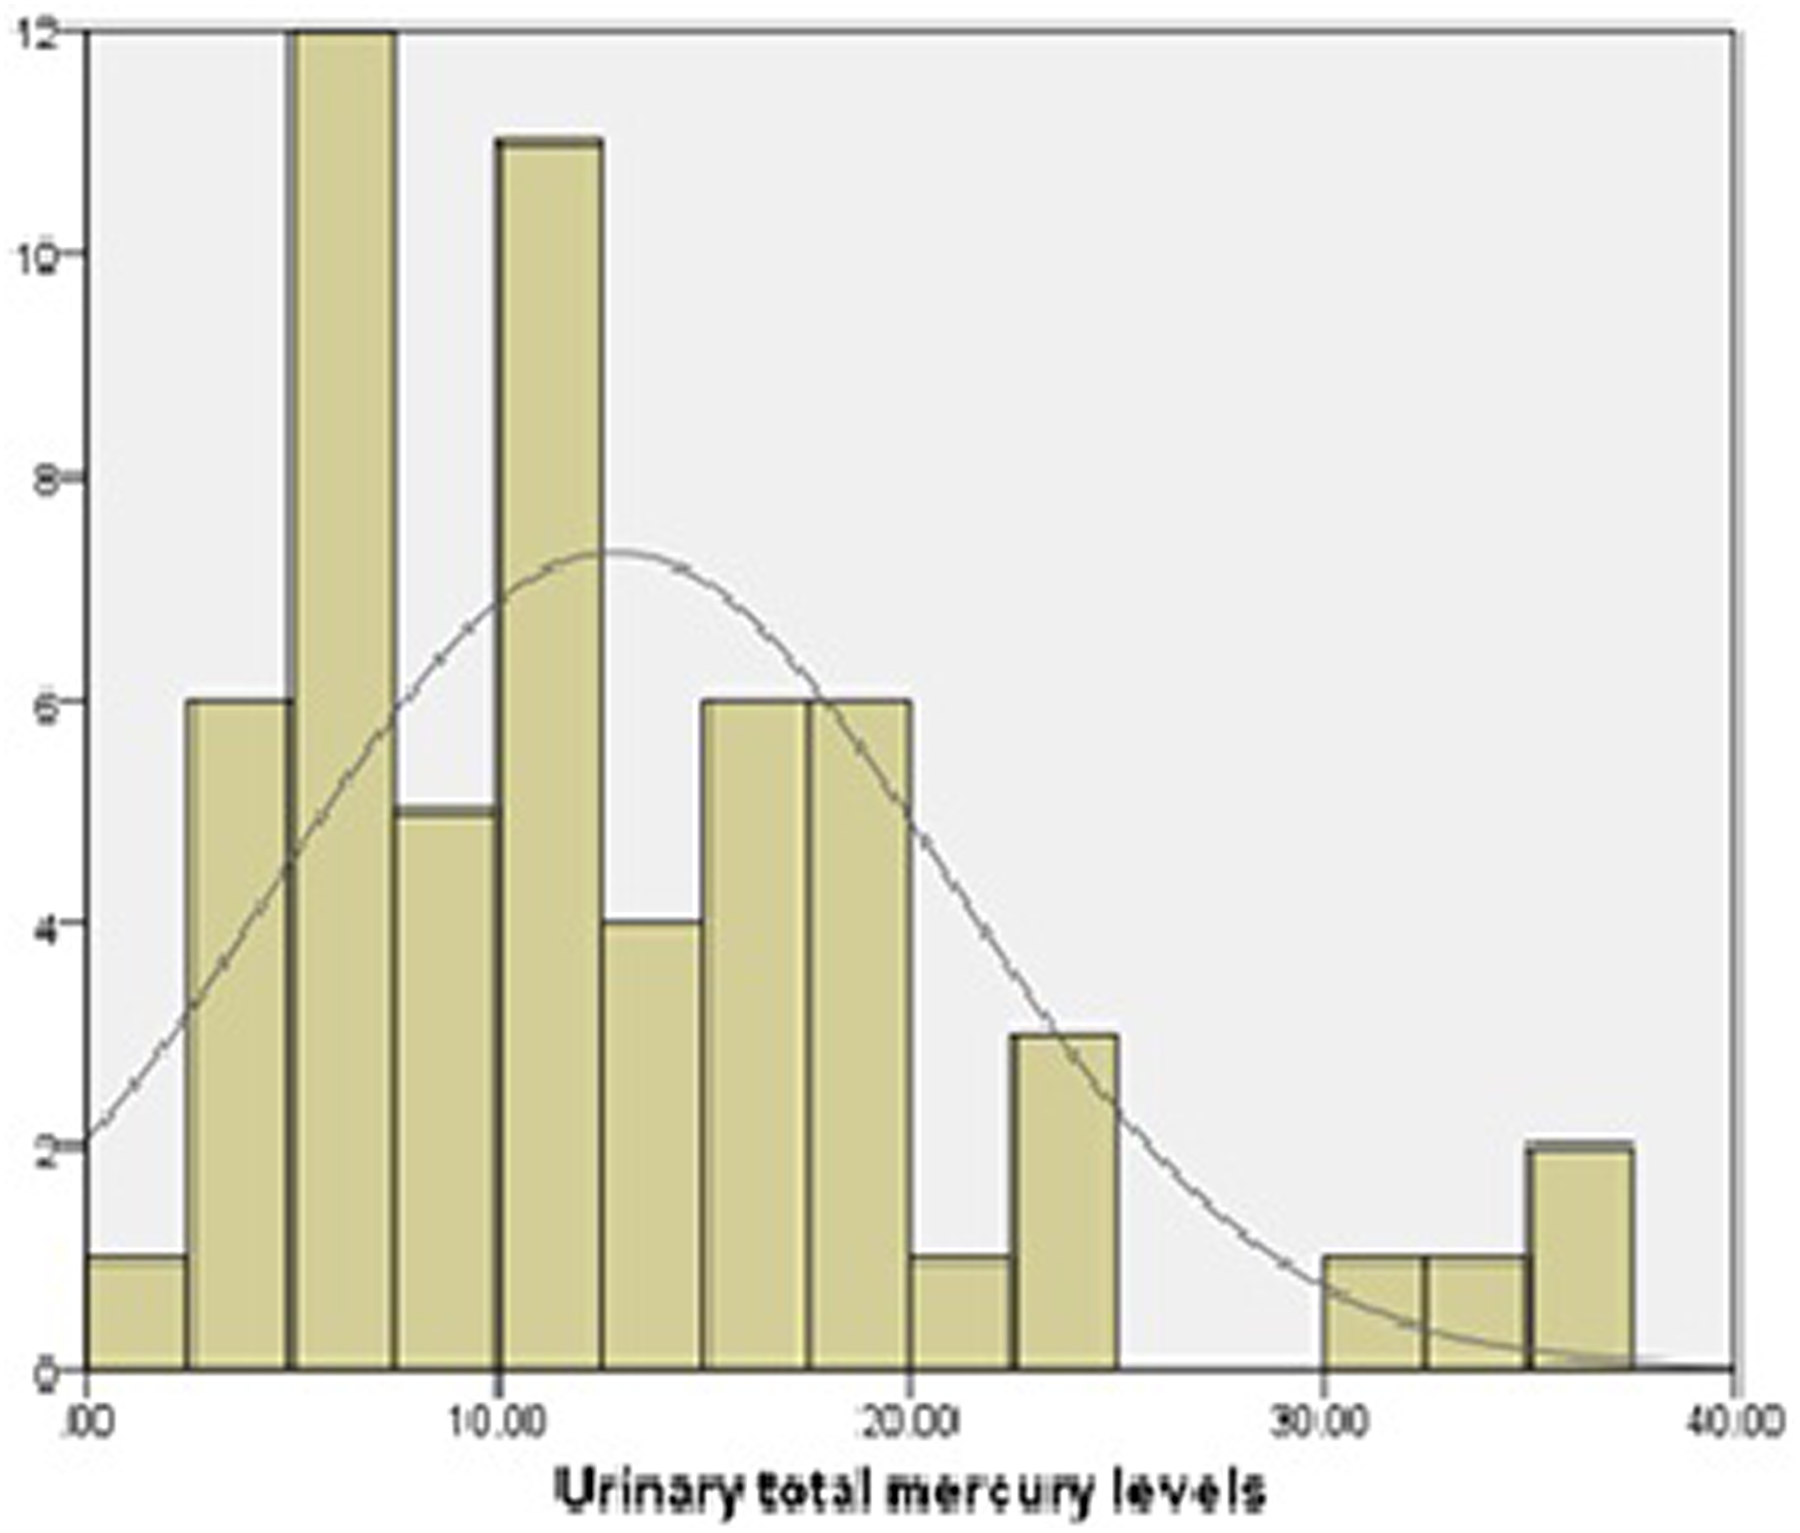
The histogram of urinary mercury levels of the CFL factory workers. CFL: compact fluorescent lamp.
There was a significant difference between the UMLs of workers among different areas of the factory (p = 0.041). The results revealed that the workers who consumed fish and seafood in the last week had a significantly greater UMLs compared to those who did not (p = 0.047). Also, the UMLs of workers who used a mask and/or gloves (9.04 ± 2.06 µg/g creatinine) were lower than those who did not (12.99 ± 7.97 µg/g creatinine). The mercury levels in the urine of workers are presented in Table 3 according to descriptive characteristics of workers (such as fish consumption, Personal protective equipment (PPE) use, gender, and working experience).
The mercury levels in urine of the workers according to descriptive characteristics.
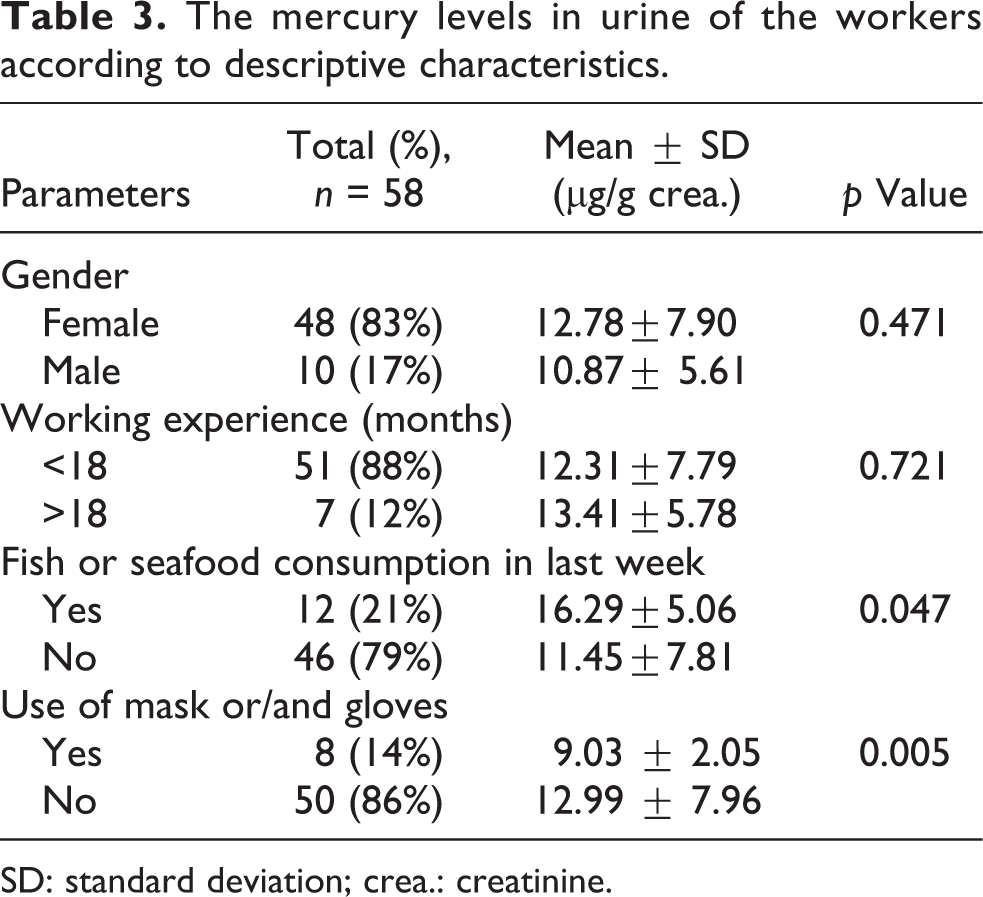
SD: standard deviation; crea.: creatinine.
However, the correlation test showed no significant correlations between the UMLs of the workers and MVLs in the personal (r = 0.168, p = 0.666) and ambient air samples (r = 0.292, p = 0.413). Moreover, statistical analysis showed that the UMLs of workers was not affected by age (p = 0.666), gender, and working experience.
Discussion
Air MVLs
Few studies have evaluated the mercury vapor at both personal and environmental levels simultaneously and also biological monitoring of workers in the CFL factory. In this study, the personal and ambient air evaluation of the mercury vapor in the CFL factory indicated that because of the high risk of breaking lamps and consequently releasing of mercury vapor, the ambient air mercury levels exceeded the threshold limit value of ACGIH (Table 1). In one study of a CFL factory, Al-Batanony et al. (2013) also reported that the mercury levels in different areas (e.g. exhaust machine, mounting machine, sealing machine, and automatic basing machine) were greater than the ACGIH recommended value (Al-Batanony et al., 2013).
In the present study, there was a significant correlation between the MVLs of ambient air and personal samples. However, the MVLs of personal samples in parallel with the ambient air measurements were less than the recommended value. According to the literature, the measurements at fixed locations within a work environment may not reflect personal exposure (Westerlund et al., 2015), because there are some factors that impact the environmental measurements (such as the volume of the room, the quality of general ventilation, and the presence of other sources of the contaminants) (Cherrie, 2004). The difference between personal and ambient air samples seemed to be less during poor ventilation conditions (Cherrie, 2003). However, if ambient air samplers are placed at the source location or emission pathway, they would be similar to the values reported for personal samples (Lange, 1999). The reason for the MVLs in personal samples being less than ambient air samples can be attributed to mercury vapor release after breakage of CFLs. According to toxicological information and several scenarios for exposure to mercury vapor, the critical period of mercury absorption is 4 h after the CFL breaks. Also, the room air temperature significantly affects the absorption rate. Aucott et al. (2003) and Johnson et al. (2008) reported that lamp breakage is accompanied by an initial release of about 5% of the overall mercury amount, while the rest is progressively released over time. Also, the broken lamps continued to release mercury vapor for at least 4 days (Aucott et al., 2003; Johnson et al., 2008). These assumptions also have been supported by Stahler et al. (2008). On the other hand, because the mercury will have been oxidized and/or partitioned to lamp components, older or spent lamps will release less mercury vapor compared to new lamps (Aucott et al., 2003; Stahler et al., 2008). Thus, the release of mercury vapor affects the mercury levels in ambient air samples. Furthermore, many studies have shown that the mercury vapor can remain for at least 23 and 31 hours in the highest and lowest area of the room, respectively, after the breakage of a CFL (Sarigiannis et al., 2012).
Total UMLs
The biological monitoring (mercury levels in urine) of workers also indicated that there was significant difference between the UMLs of workers among different areas of factory. However, the mercury level in urine was less than BEIs recommended by ACGIH. It seems that mercury vapor release following breakage of a CFL was the main source of exposure to mercury. Therefore, the production line supervisor had the highest UMLs, because she was responsible for the removal of broken lamps and was exposed to >29 µg m−3 of mercury vapor for 8 h/day, 6 days/week.
We found no significant correlations between the UMLs and MVLs in personal and ambient air samples. The reason for this discrepancy can be attributed to the small number of air samples compared to the number of urine samples or may be due to a lack of ventilation. In this regard, Sarigiannis et al. (2012) reported that the magnitude and the duration of ventilation are important factors of ambient air decontamination from mercury vapor after a lamp breakage in a CFL factory. Also, the results indicated that workers who used PPE had significantly lower UMLs than those who did not. Decharat et al. (2014) also reported that dental workers handling mercury-containing amalgam who used masks and gloves had significantly lower UMLs than those who did not (Decharat et al., 2014). Also, Hansen and Danscher (1997) reported that non-use of PPE leads to the accumulation of mercury in a worker’s body. In addition, previous studies have indicated that good personal hygiene minimizes exposure to mercury vapor (Eley, 1997). We found no significant relations between the UMLs and age and working experience of workers. This finding was in contrast to the study of Decharat et al. (2014); the reason for this discrepancy can be attributed to the low mean age of workers and the several scenarios of worker’s exposure to mercury vapor after breakage of CFLs.
It should also be noted that seafood consumption and determination of the UMLs is a valid index of recent exposures (Shirkhanloo et al., 2014). In this study, there was significant difference in the UMLs of the workers who consumed fish and seafood in the prior week and who did not. In this regard, Decharat et al. (2014) reported that dentists who consumed fish and seafood ≥3 times/month had significantly greater UMLs than those who consumed fish and seafood <3 times/month (Decharat et al., 2014). Also, Zolfaghari et al. (2007) reported that fish consumption affects mercury levels in hair and nails (Zolfaghari et al., 2007).
Cross-sectional studies do not provide a precision basis for establishing causality. Hence, the relationship between the variables of interest may be influenced by other factors. Another limitation of the study was the number of samples. Because of resource limitations for sampling and analysis, only 10 samples were collected out of the 59 workers who were interviewed. However, because the tasks were similar across the different groups, one worker was selected as a representative sample from each group, and sampling was carried out on that individual.
Conclusion
Lamp breakage is the main source of exposure to mercury vapor in a CFL factory, and the MVLs in personal and ambient air samples can be attributed to the mercury vapor release following breakage of CFLs. Moreover, the UMLs of workers can be affected by work experience, diet, and hygiene behaviors. Therefore, effective safety programs including engineering controls (e.g., designing of ventilation systems, improvements in working conditions), the use of appropriate PPE, and occupational health training are essential to minimize occupational exposure to mercury vapor at CFLs industry.
Footnotes
Acknowledgements
The authors would like to thank all workers to participate in this study and administrators of the factory for allowing them to collect ambient air and urinary samples.
Declaration of Conflicting Interests
The author(s) declared no potential conflicts of interest with respect to the research, authorship, and/or publication of this article.
Funding
The author(s) disclosed receipt of following financial support for the research, authorship, and/or publication of this article: This study is part of a project entitled “Occupational exposure to mercury vapor in a compact fluorescent lamp factory: Evaluation of personal, ambient air, and biological monitoring” granted by the health faculty of Hamadan University of Medical Sciences,” Hamadan, Iran.