
Abstract
Obesogens affect lipid metabolism, and genetic or epigenetic factors may also contribute to the progression of obesity. Endocrine-disrupting chemicals (EDCs) are the most striking among obesogens. Bisphenol A (BPA) is an estrogenic EDC used in food containers, adhesives, dye powders, and dental fillers. We aimed to elucidate molecular mechanisms of BPA’s obesogenic effects focusing on obesogenic pathways in the liver including fibroblast growth factor (FGF) and Dnmt3a which is its epigenetic regulator, oxidant-antioxidant status, and inflammatory cytokines. Zebrafish were divided into three groups as control, low-dose BPA (1 μ
Introduction
Obesity is defined by WHO (World Health Organization) as abnormal or excessive fat accumulation that threatens health in the body (Killgore et al., 2003). Some diseases caused by obesity include insulin resistance, type 2 diabetes (T2DM), cardiovascular disease, infertility, osteoarthritis, and some types of cancer (Melissa and Danielle, 2014; Verma and Hussain, 2017; Van Gaal et al., 2006). Genetic, epigenetic, and non-genetic factors affect the pathogenesis of obesity, and DNA methylation is the most common and best understood epigenetic marker (Handy et al., 2011; Davegårdh et al., 2018). Fibroblast growth factor 21 (FGF21) is an endocrine member of the FGF family that plays an important role in the regulation of metabolism through lowering glucose and lipid levels, increasing insulin sensitivity, and regulating energy homeostasis in diabetes and obesity models (Sa-Nguanmoo et al., 2016). Dnmt3a regulates insulin resistance through the methylation of the specific cis-regulatory elements in the Fgf21 gene and therefore suppressing its expression (You et al., 2017).
Substances that are defined as obesogen can cause the development of obesity by affecting the events that regulate body lipid metabolism through various mechanisms, and genetic or epigenetic factors may also be effective in these mechanisms (Rubin et al., 2019). Environmental endocrine disrupting substances are the most striking among obesogenic substances (Balcı, 2014) Endocrine disruptors are natural or synthetic chemicals that disrupt the normal functioning of the body by mimicking or blocking hormones (Newbold, 2010; Andújar et al., 2019). They act by increasing or inhibiting the metabolism of endogenous peptide or steroid hormones, activating or antagonizing nuclear receptors in the hypothalamus, adipose tissue, liver, and other tissues/organs (DiVall, 2013). Bisphenol A (BPA) has a phenol structure, which is added to the plastic material to harden the plastics. It is an estrogenic endocrine-disrupting chemical used as food containers, baby bottles, adhesives, dye powders, and dental fillers (Andújar et al., 2019). Positive associations were found between urinary BPA levels and parameters related to obesity and metabolic disease (Carwile and Michels 2011). BPA has been shown to cause obesity due to its effect on adipocyte differentiation, fat accumulation, insulin resistance, and adiponectin secretion (Rönn et al., 2014). However, there are conflicting findings regarding the pro-oxidant and antioxidant roles of BPA. The effects of BPA exposure on obesity and the molecular mechanism of BPA’s obesogenic effect are still unclear. The different results reported in these studies may depend on the exposure route and exposure time of BPA in experimental animals (Rubin et al., 2019). The effects of BPA on molecules involved in obesogenic pathways in the liver need to be explained to clarify the contradictory results on the subject.
Zebrafish has become one of the most widely used animal models for pharmacological and toxicological testing of new compounds. Both adult and larval zebrafish are suitable models to evaluate the effects of new compounds on glucose mobility and metabolism (Oka et al., 2010). In zebrafish, the metabolic characteristics of excretory organs, skeletal system, and adipose tissue are similar to those in mammals. Key functions such as satiety regulation, insulin regulation, and lipid storage are well preserved (Zang et al., 2018). In our study, to elucidate the molecular mechanisms of BPA’s obesogenic effects, we focused on the obesogenic pathways in the liver including the fibroblast growth factor (FGF) and Dnmt3a which is its epigenetic regulator, and inflammatory cytokines il1ß, tnfα, and il6 in BPA-exposed zebrafish. Since obesity is related to the generation of reactive oxygen species (ROS) leading to oxidative stress and consequent inflammatory reactions, oxidant–antioxidant status was also evaluated in BPA-exposed zebrafish (Dominiczak, 2003).
Methods
Wild-type AB/AB strain zebrafish were housed in an aquarium rack system (ZebTEC, Tecniplast, Italy) at 27–28 ± 1°C under a 14/10 h light/dark cycle. Animal experiments were carried out in compliance with the European Communities Council Directive of 24 November 1986 (86/609/EEC) (Louhimies, 2002). The Institutional Animal Care and Use Committee of Marmara University approved all the procedures applied in the study (85.2019. mar). Zebrafish (Totally 36) were randomly divided into three groups as the control (vehicle) (C), low-dose BPA group (LD-BPA), and high-dose BPA group (HD-BPA), and each group consisted of 12 fish. The LC50 or EC50 values of BPA have been shown to be between 1.1 and 10 mg/L (Alexander et al., 1988). Weber et al. (2015) aimed to identify sex-based changes in adult zebrafish exposed to 1 μ
At the end of 4 weeks, oral glucose tolerance test (OGTT) was performed and fasting blood glucose was measured. OGTT was performed by the administration of a glucose solution (1.25 mg/g zebrafish weight). This was performed by inserting a micropipette with a small tip into the mouth of the anesthetized zebrafish using ice water for anesthesia (gradually from 17°C to 12°C). After the fish recovered in the water system, blood samples were collected after 30, 60, and 120 min of the administration, and at each time point blood glucose levels were determined (Zang et al., 2017). The blood was collected from zebrafish according to the method described by Zang et al. (2013). Then, the animals were anesthetized and sacrificed to remove the hepatopancreas (liver and pancreas) tissues. The examinations and interpretation of the findings were performed by researchers who were blind to the experimental groups.
Biochemical analyses
For the biochemical analyses, supernatant was used. Total protein levels were measured according to the method of Lowry, and the results were expressed per protein (Lowry et al., 1951). The method of Yagi was used to measure malondialdehyde (MDA) levels as thiobarbituric acid reactive substances as the end product of lipid peroxidation (Yagi, 1984). The method of Miranda was used to measure NO levels (Miranda et al., 2001). SOD activity was measured according to the ability of SOD to increase the effect of riboflavin-sensitized photo-oxidation of o-dianisidine, and the results were expressed in U/mg protein (Mylorie et al., 1986). GST catalyzes the conjugation of GSH, and GST activity was determined using a spectrophotometer at 340 nm (Habig and Jacoby 1974).
RT-PCR Methodology
Rneasy Mini Kit and Qiacube (Qiagen, Germany) were used to isolate RNA from zebrafish. Single-stranded cDNA was synthesized from 1 μg of total RNA using RT2 Profiler PCR Arrays (Qiagen). DNA Master SYBR Green kit (Qiagen, Germany) was used for the PCR analyzes. Quantitative RT-PCR was used for the expression analyzes of genes using the Rotor Gene-Q Light Cycler (Qiagen, Germany). For the housekeeping gene, β-actin was used, and the delta-delta Ct method was used to calculate relative transcription levels by normalizing the values to the housekeeping gene (Livak and Schmittgen 2001). Three independent biological replicates were prepared for each treatment. For each biological replicate, three technical replicates of each RT-PCR reaction were performed.
Histological analysis
For histological investigation, liver samples were fixed in 10% neutral buffered formalin, dehydrated in ascending ethanol series (70%, 90%, 96%, and 100%), cleared in toluene, and embedded in paraffin. Approximately 5-μm-thick sections were stained with hematoxylin and eosin stain for histopathological evaluation. All stained sections were photographed using a digital camera (Olympus DP72, Tokyo, Japan) attached to a photomicroscope (Olympus BX51, Tokyo, Japan).
Data analysis
The required power and sample sizes used in this experiment were defined using statistical power analysis to detect minor effects. Statistical analysis was performed by using GraphPad Prism 9.0 (GraphPad Software, San Diego, USA). The normality of the distribution was verified using the Shapiro–Wilk test. To compare the groups one-way ANOVA test was used which was followed by Tukey’s multiple comparison tests. The data obtained were given as the mean ± standard deviation. p-value less than 0.05 was regarded as significant.
Results
Body weights at day 30 increased significantly in the LD-BPA and HD-BPA groups compared to the control group (p < 0.01, and p < 0.0001, respectively) (Figure 1(a)). Fasting blood glucose (FBG) levels also increased significantly in the LD-BPA and HD-BPA groups compared to the control group (p < 0.0001) (Figure 1(b)). Body weights and FBG values in the HD-BPA group were significantly higher than that of the LD-BPA group (p<0.05) (Figure 1(a) and (b)). According to OGTT results, blood glucose values determined at 30th, 60th, and 120th minutes increased significantly in LD-BPA and HD-BPA groups compared to the control group (p < 0.05). Glucose levels increased significantly at 120 min in the HD-BPA group compared to both LD-BPA and control groups (p < 0.05) (Figure 1(c)).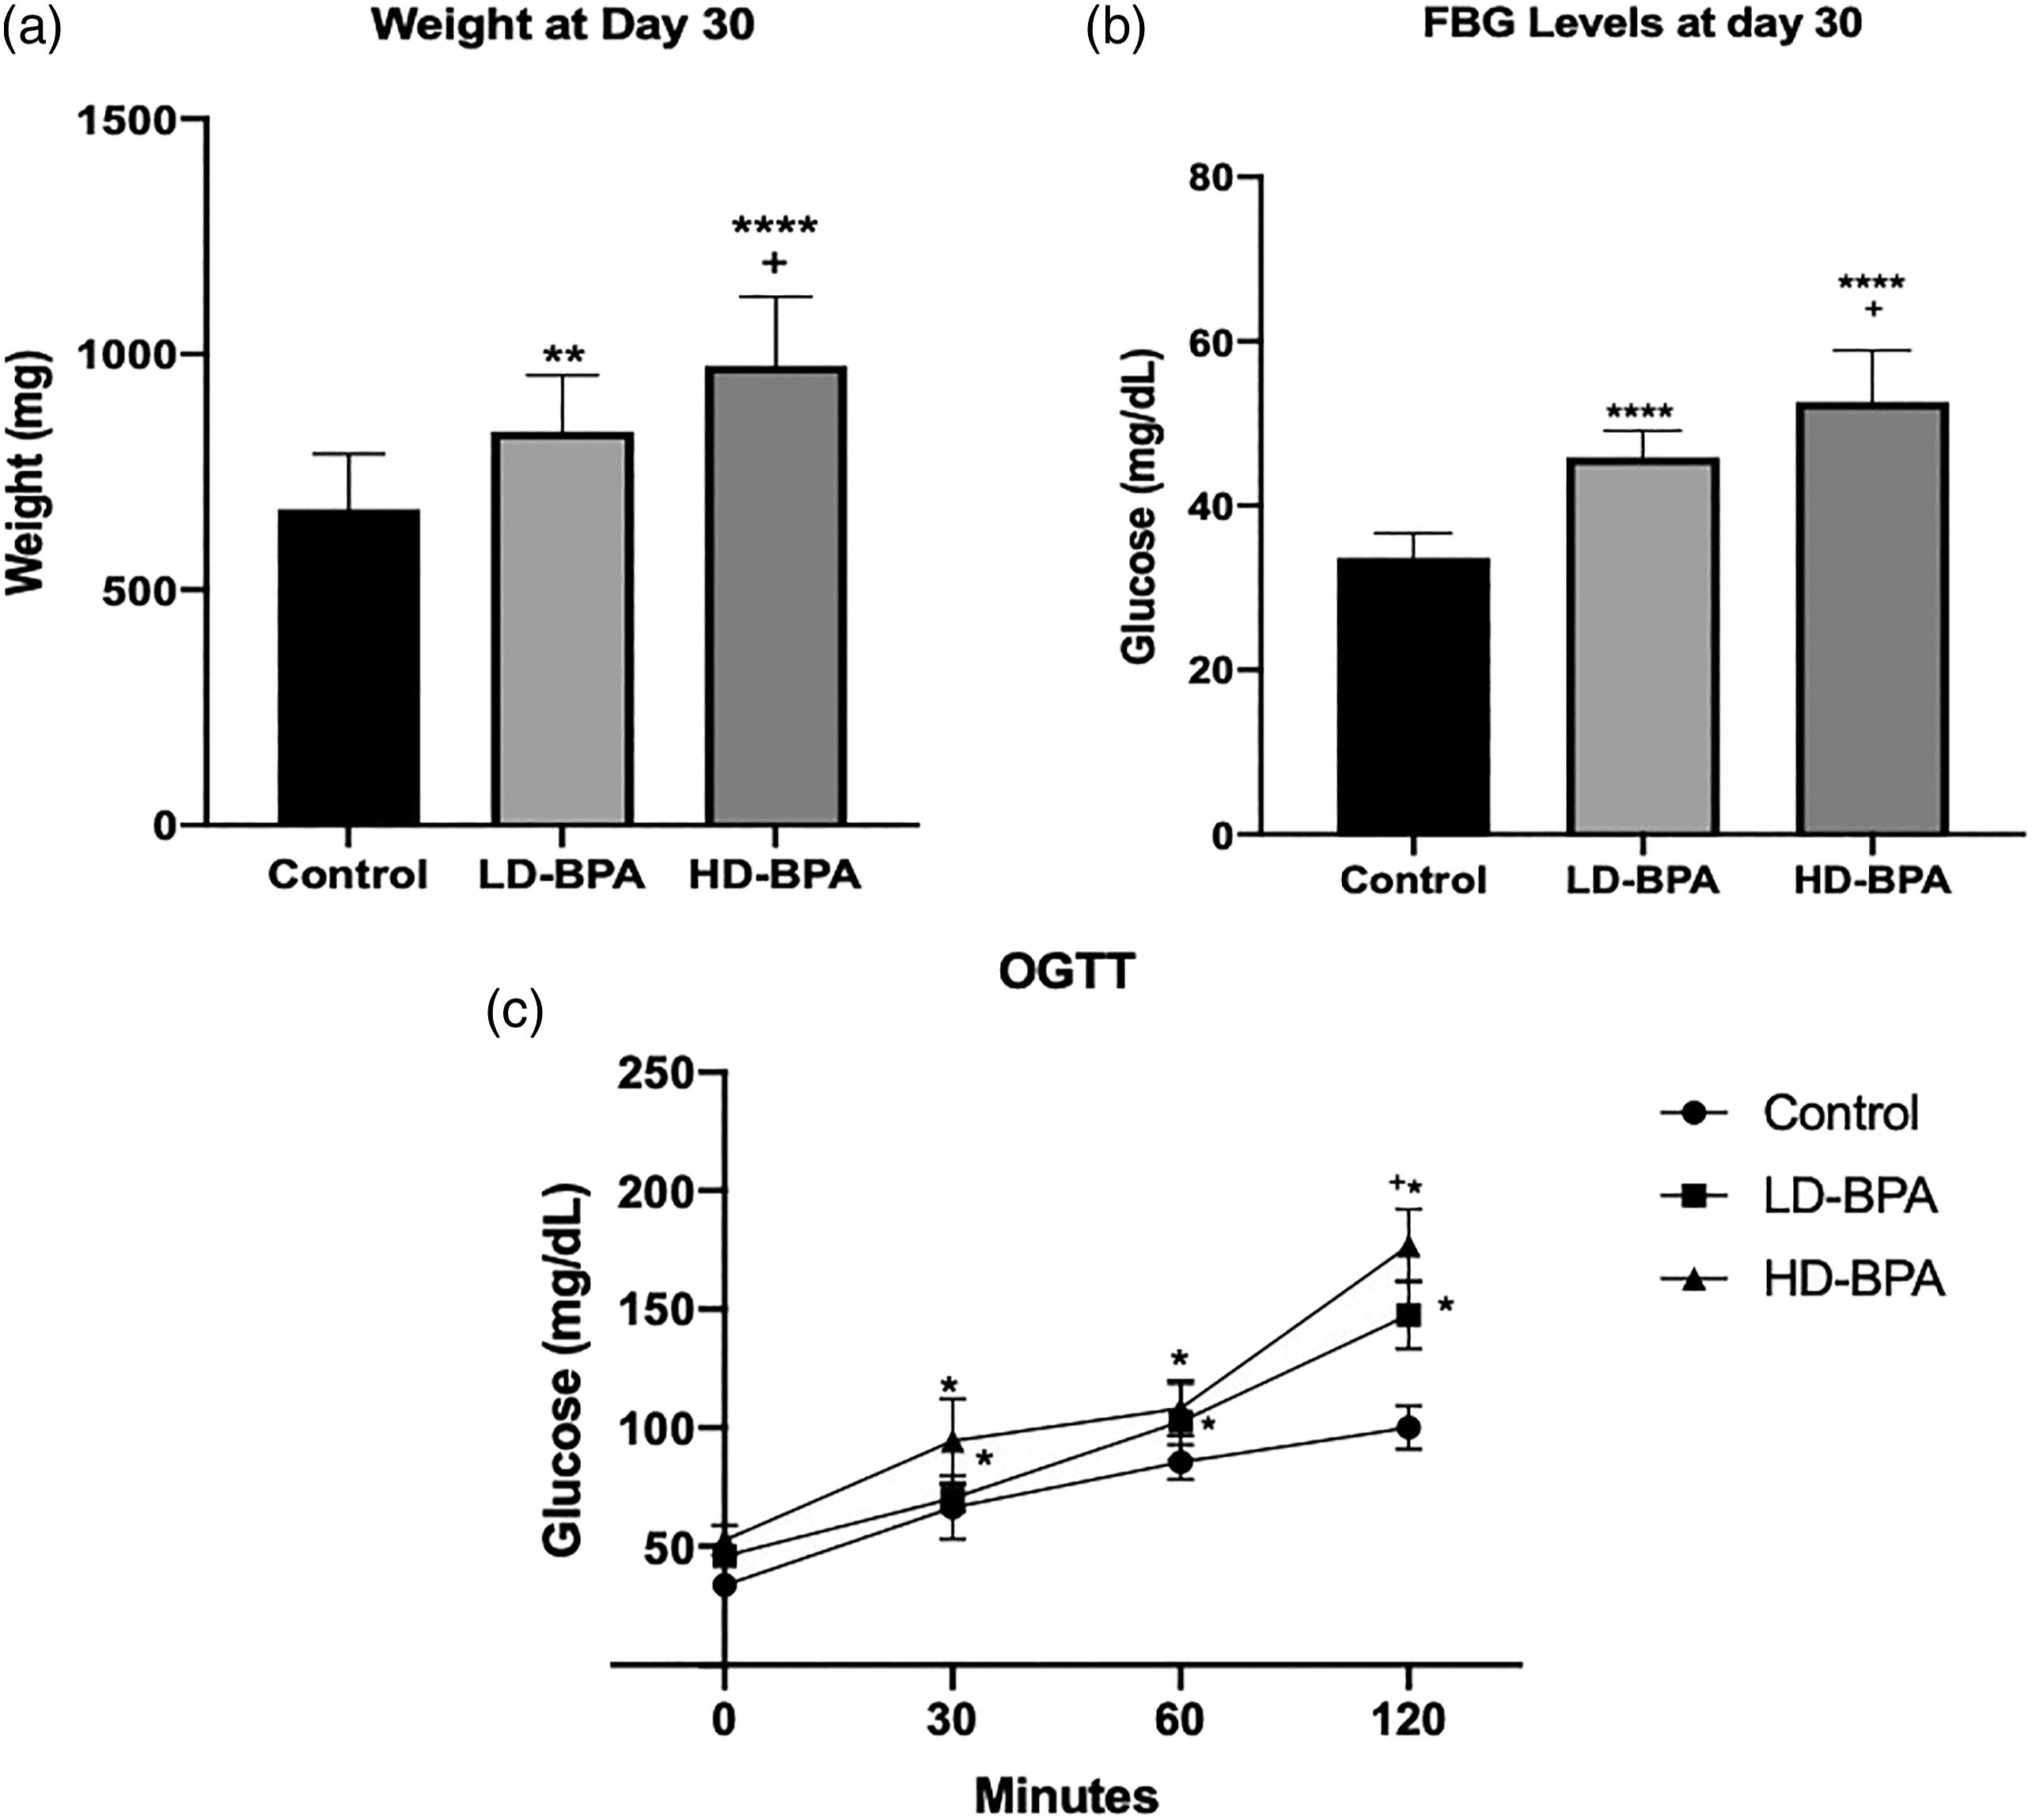
Comparison of weekly fasting blood glucose (FBG) levels of the groups is given in Figure 2. While there was no significant difference in the control group, significant increases were observed at the end of the fourth week both in the LD-BPA and HD-BPA groups when compared with the first week. Fourth week FBG levels of the HD-BPA group were also significantly higher than that of the second week. Weekly fasting blood glucose (FBG) levels of the control group (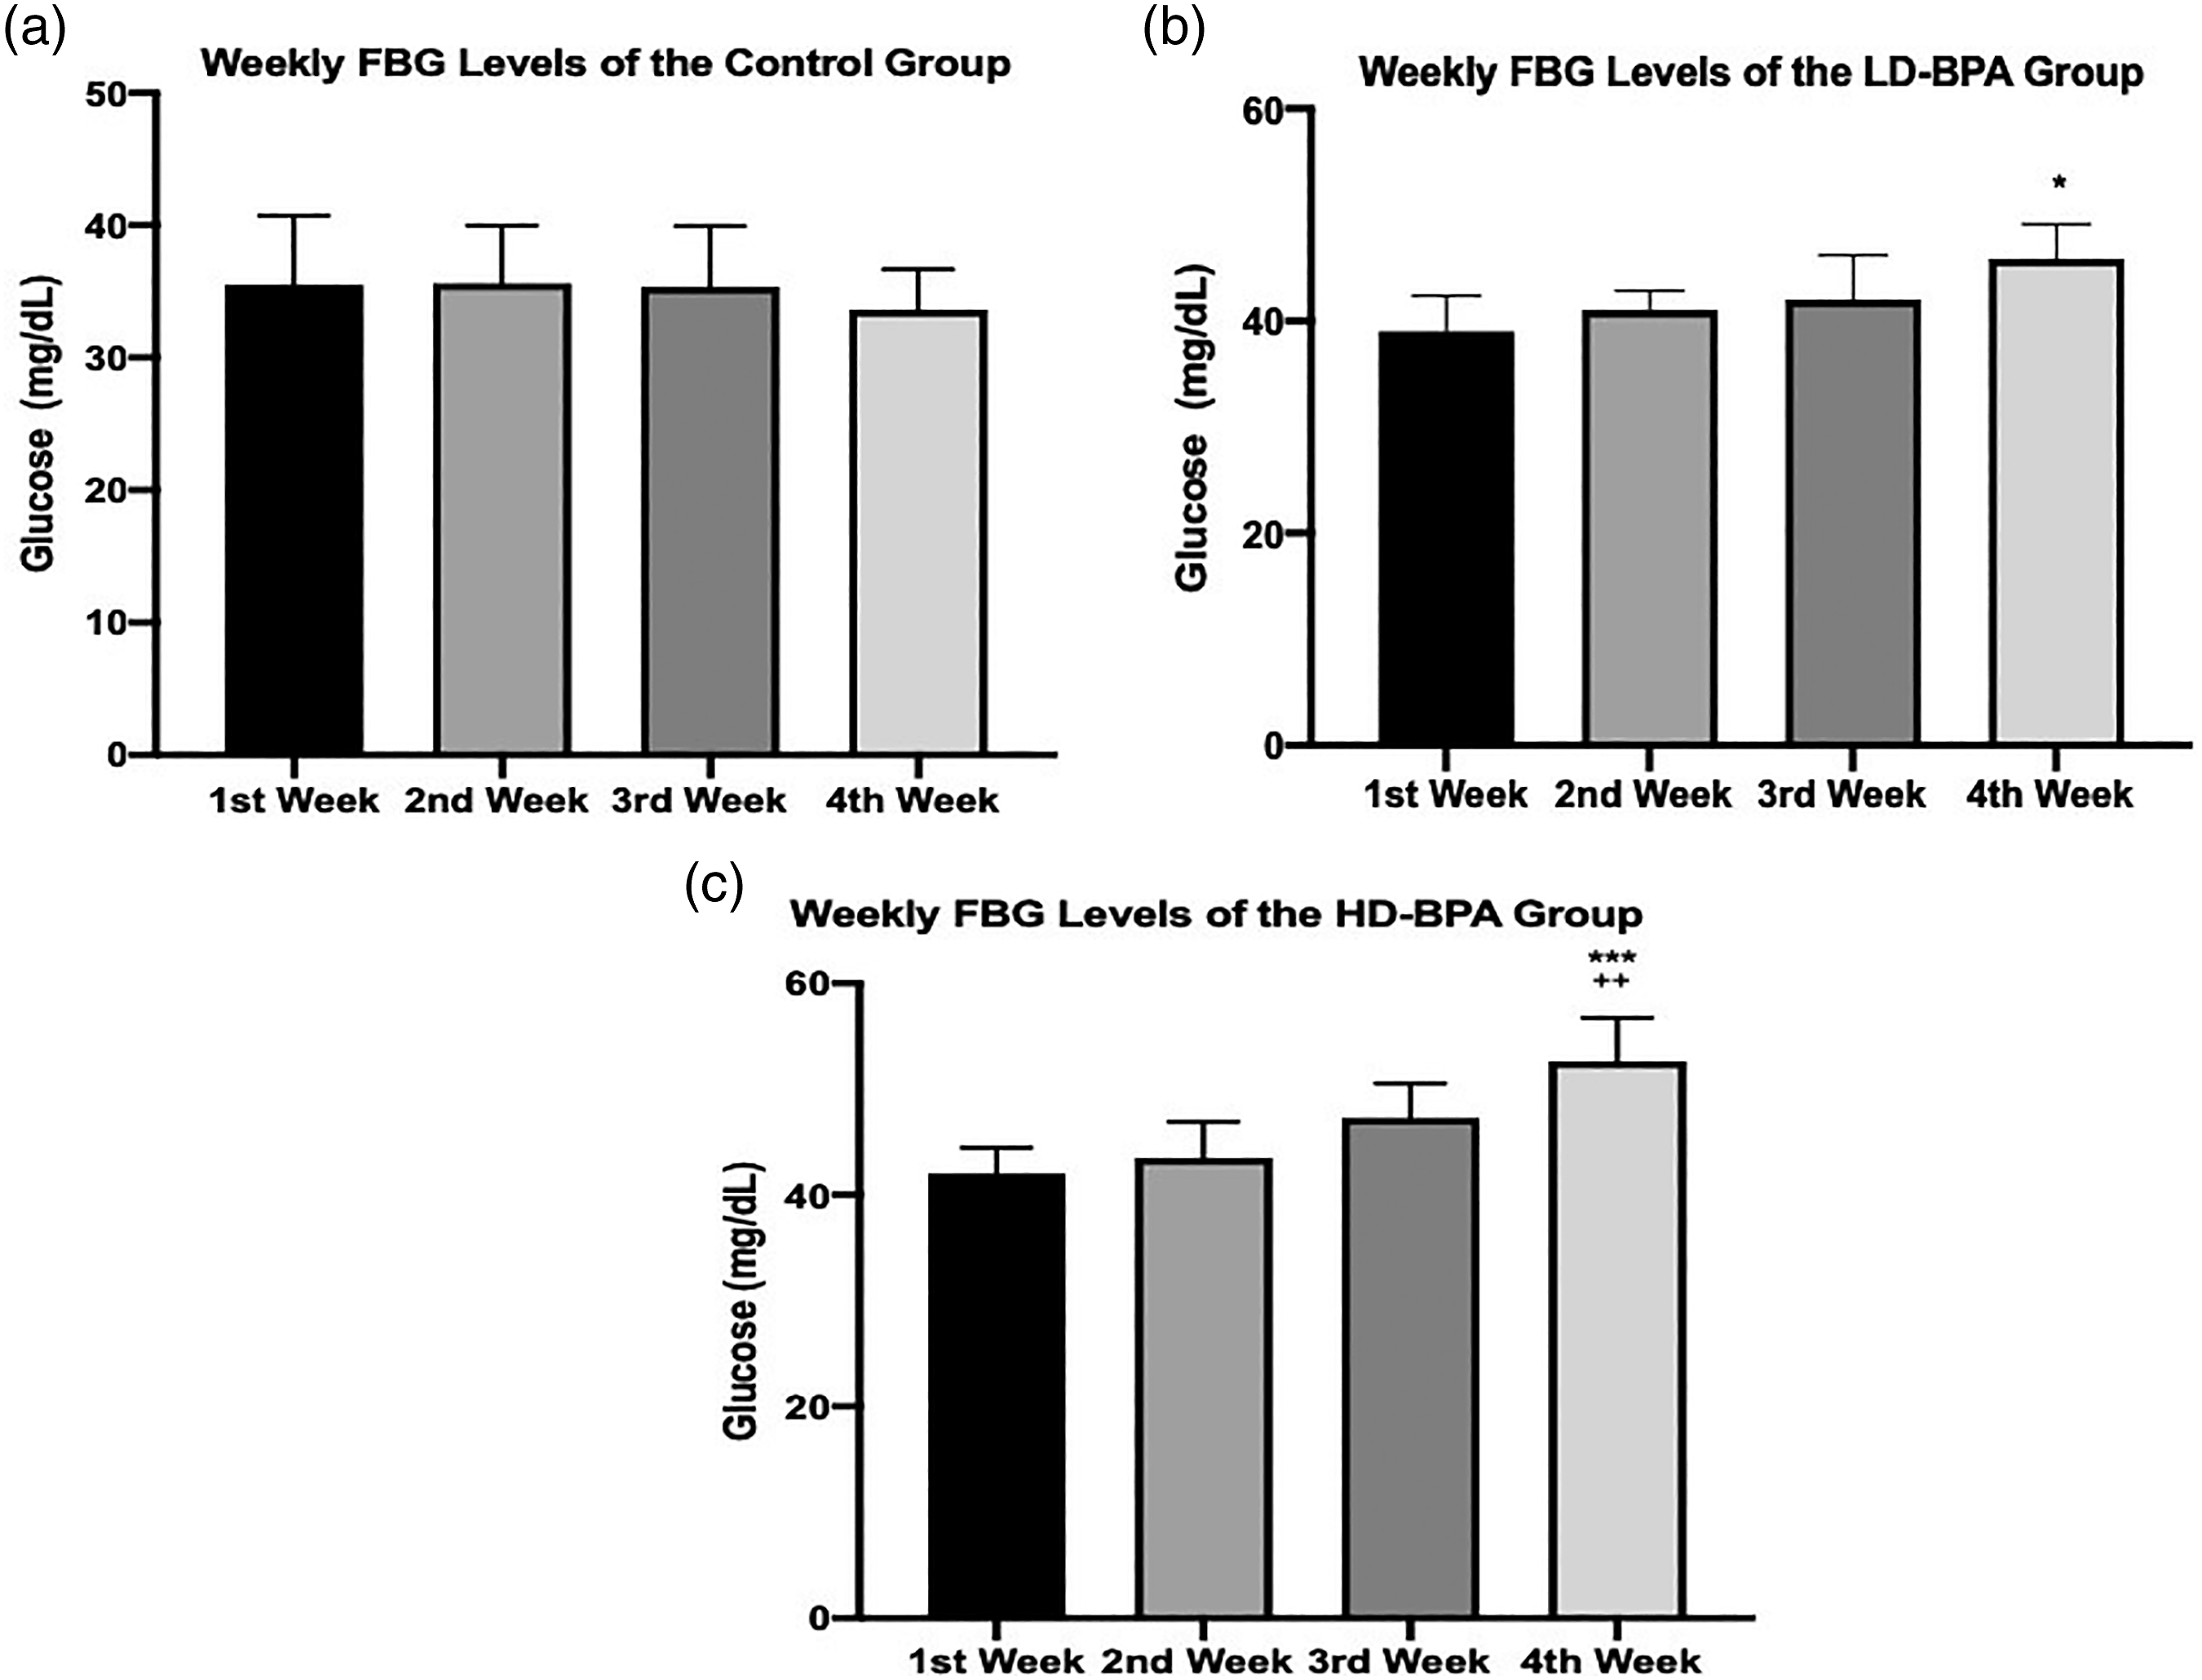
Oxidative stress that is induced by free radicals, oxidative toxic compounds enhances lipid oxidation. Malondialdehyde (MDA) is the end product of lipid peroxidation. MDA levels in the liver increased both in the LD-BPA and HD-BPA groups compared with the control group (p < 0.05, and p < 0.0001, respectively), and there was a significant increase in the MDA levels of the HD-BPA when compared with the LD-BPA group (p < 0.01) (Figure 3(a)).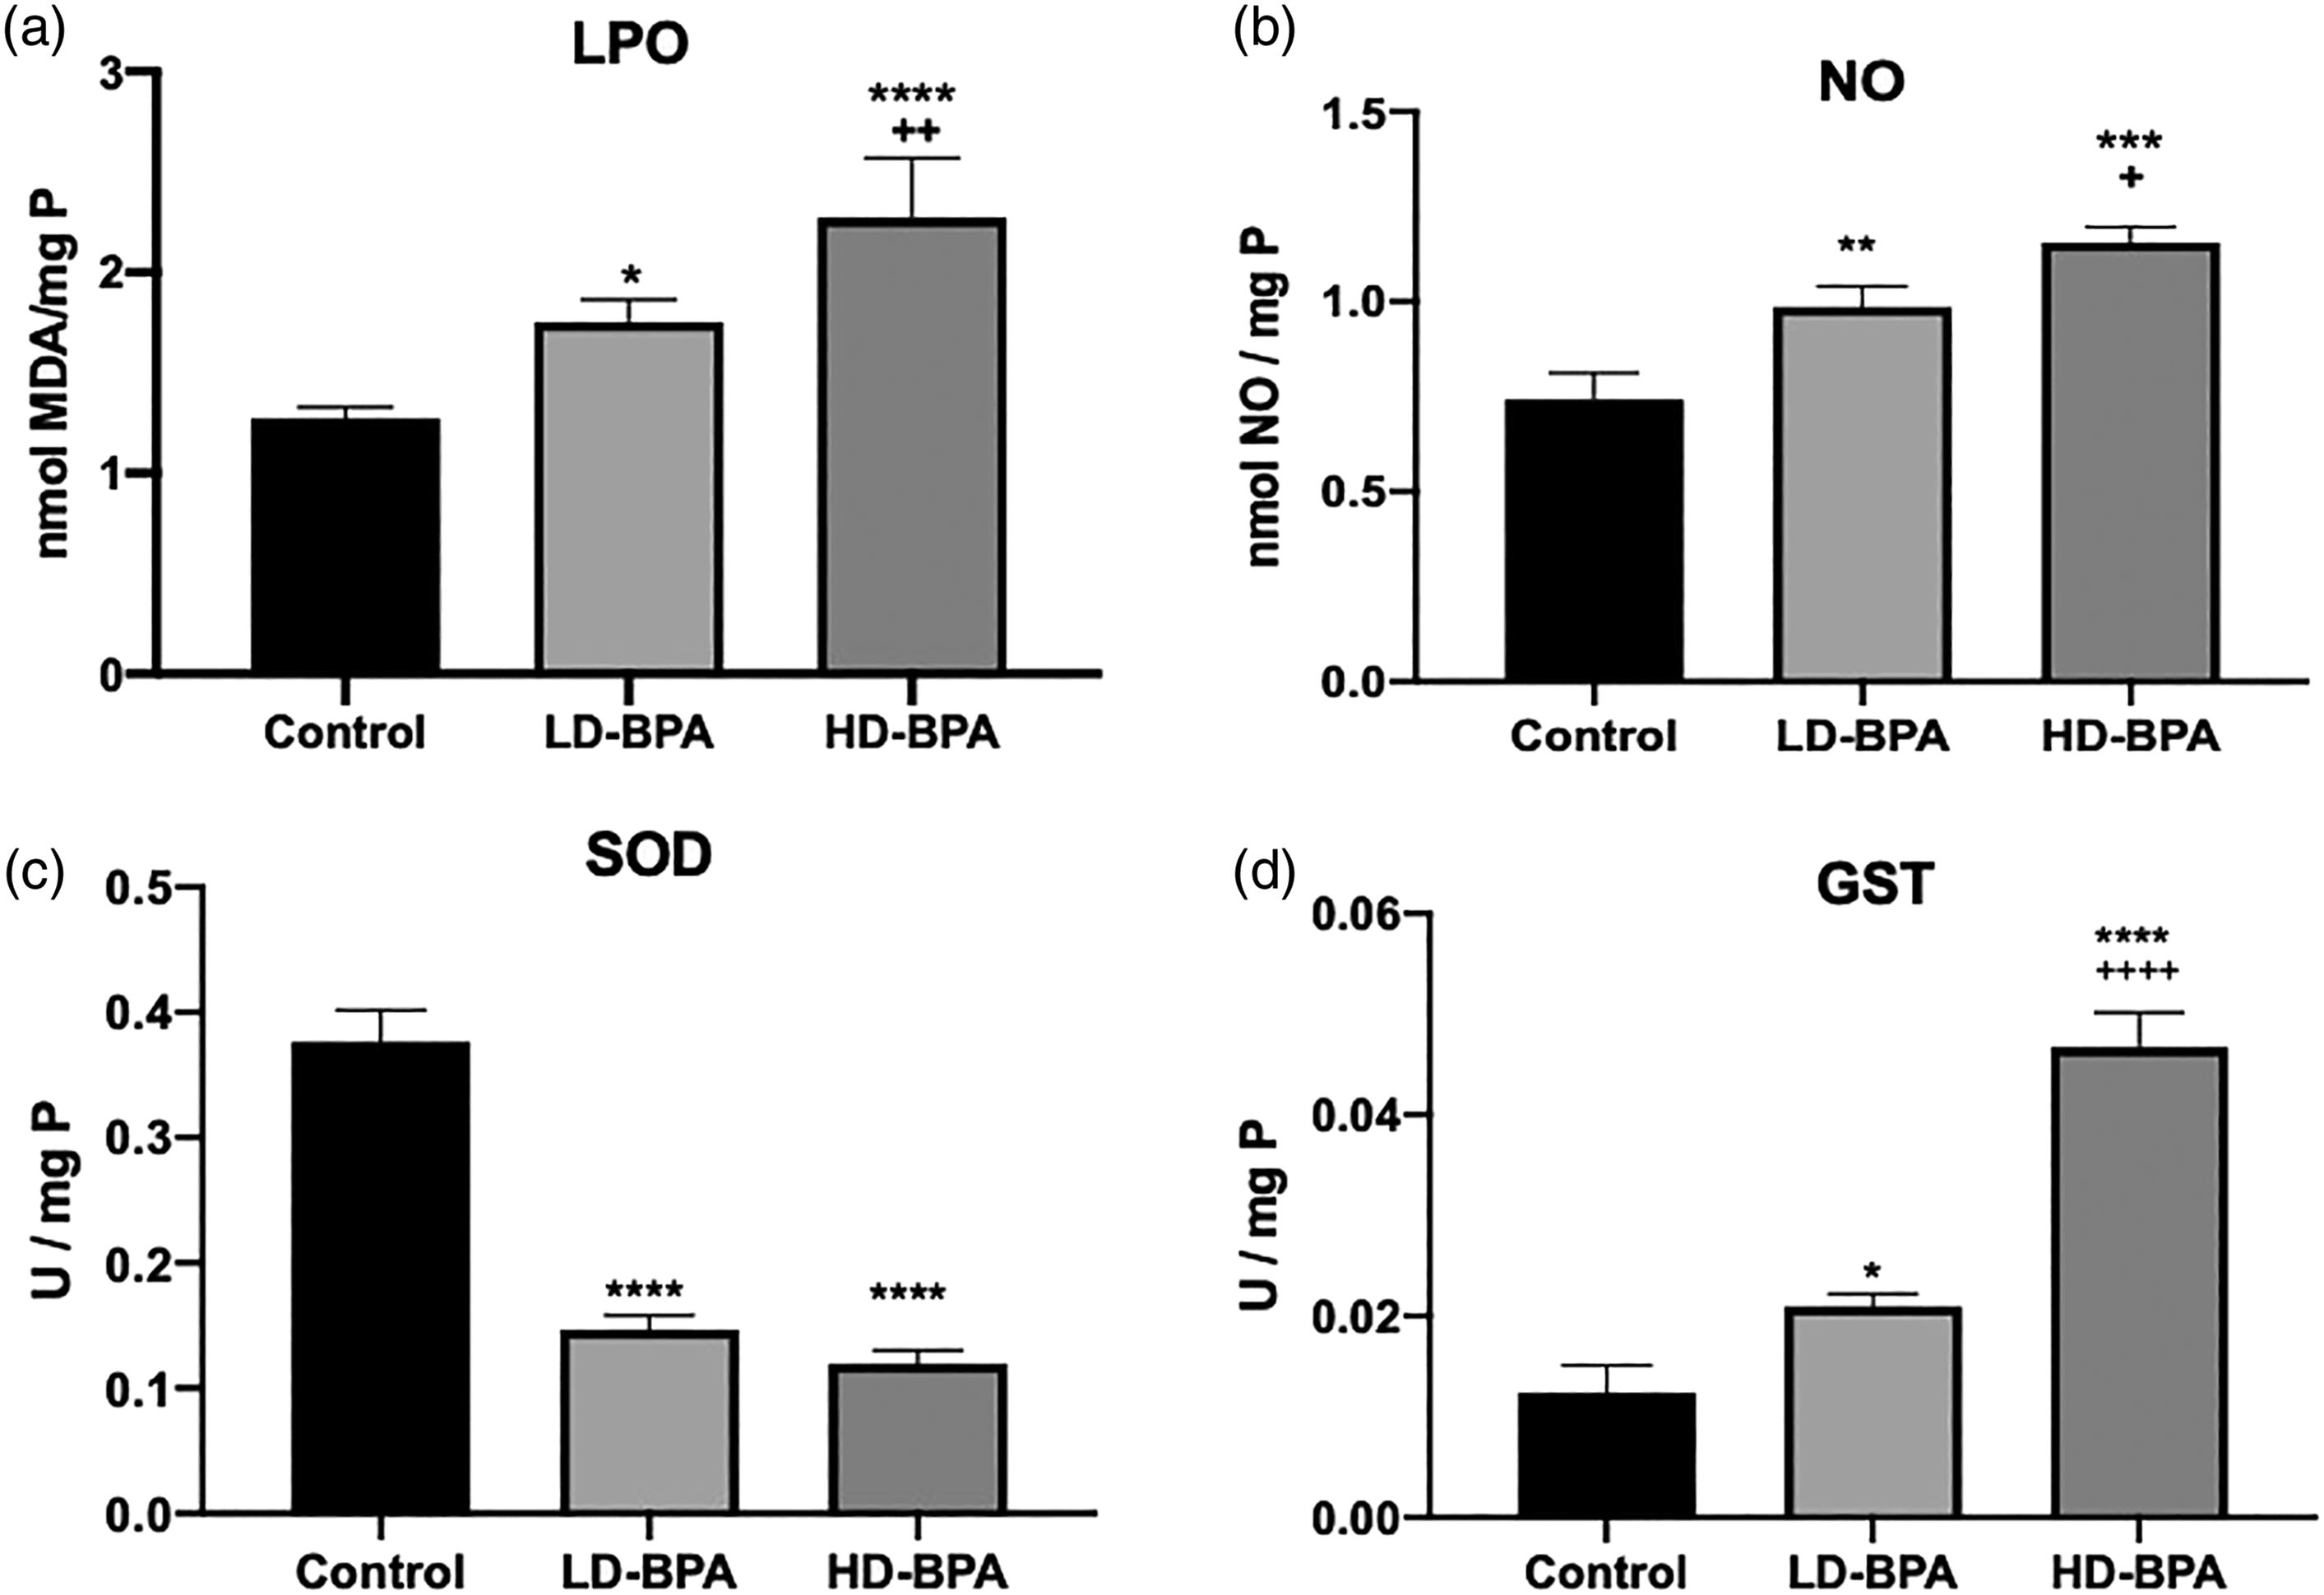
Nitric oxide (NO) is a principal determinant of normal endothelial and vascular function. In case of inflammation in conjunction with other reactive oxygen species (ROS), NO production by the vasculature increases and contributes to oxidative stress. NO levels in the liver increased both in the LD-BPA and HD-BPA groups compared with the control group (p < 0.01 and p < 0.001, respectively), and there was a significant increase in the MDA levels of the HD-BPA when compared with the LD-BPA group (p < 0.05) (Figure 3(b)).
Decreases in antioxidants enhance lipid oxidation, and free radical scavenging antioxidants ameliorate lipid oxidation. Superoxide dismutase (SOD) catalyzes the dismutation of superoxide radicals (O2−) to molecular oxygen (O2) and hydrogen peroxide (H2O2) and provides cellular defense against ROS. SOD activities decreased in both LD-BPA and HD-BPA groups compared with the control group (p < 0.0001) (Figure 3(c)). Glutathione S-transferase (GST) is a detoxification enzyme that catalyzes the conjugation of glutathione to endogenous and exogenous electrophilic compounds and protects cellular macromolecules (Townsend and Tew 2003). When compared with the control group, GST activities increased in both the LD-BPA and HD-BPA groups; however, the increase in the HD-BPA group was much more pronounced (p < 0.05, p < 0.0001, respectively). GST activity of the HD-BPA group was found to be increased significantly when compared with the LD-BPA group (p < 0.0001) (Figure 3(d)).
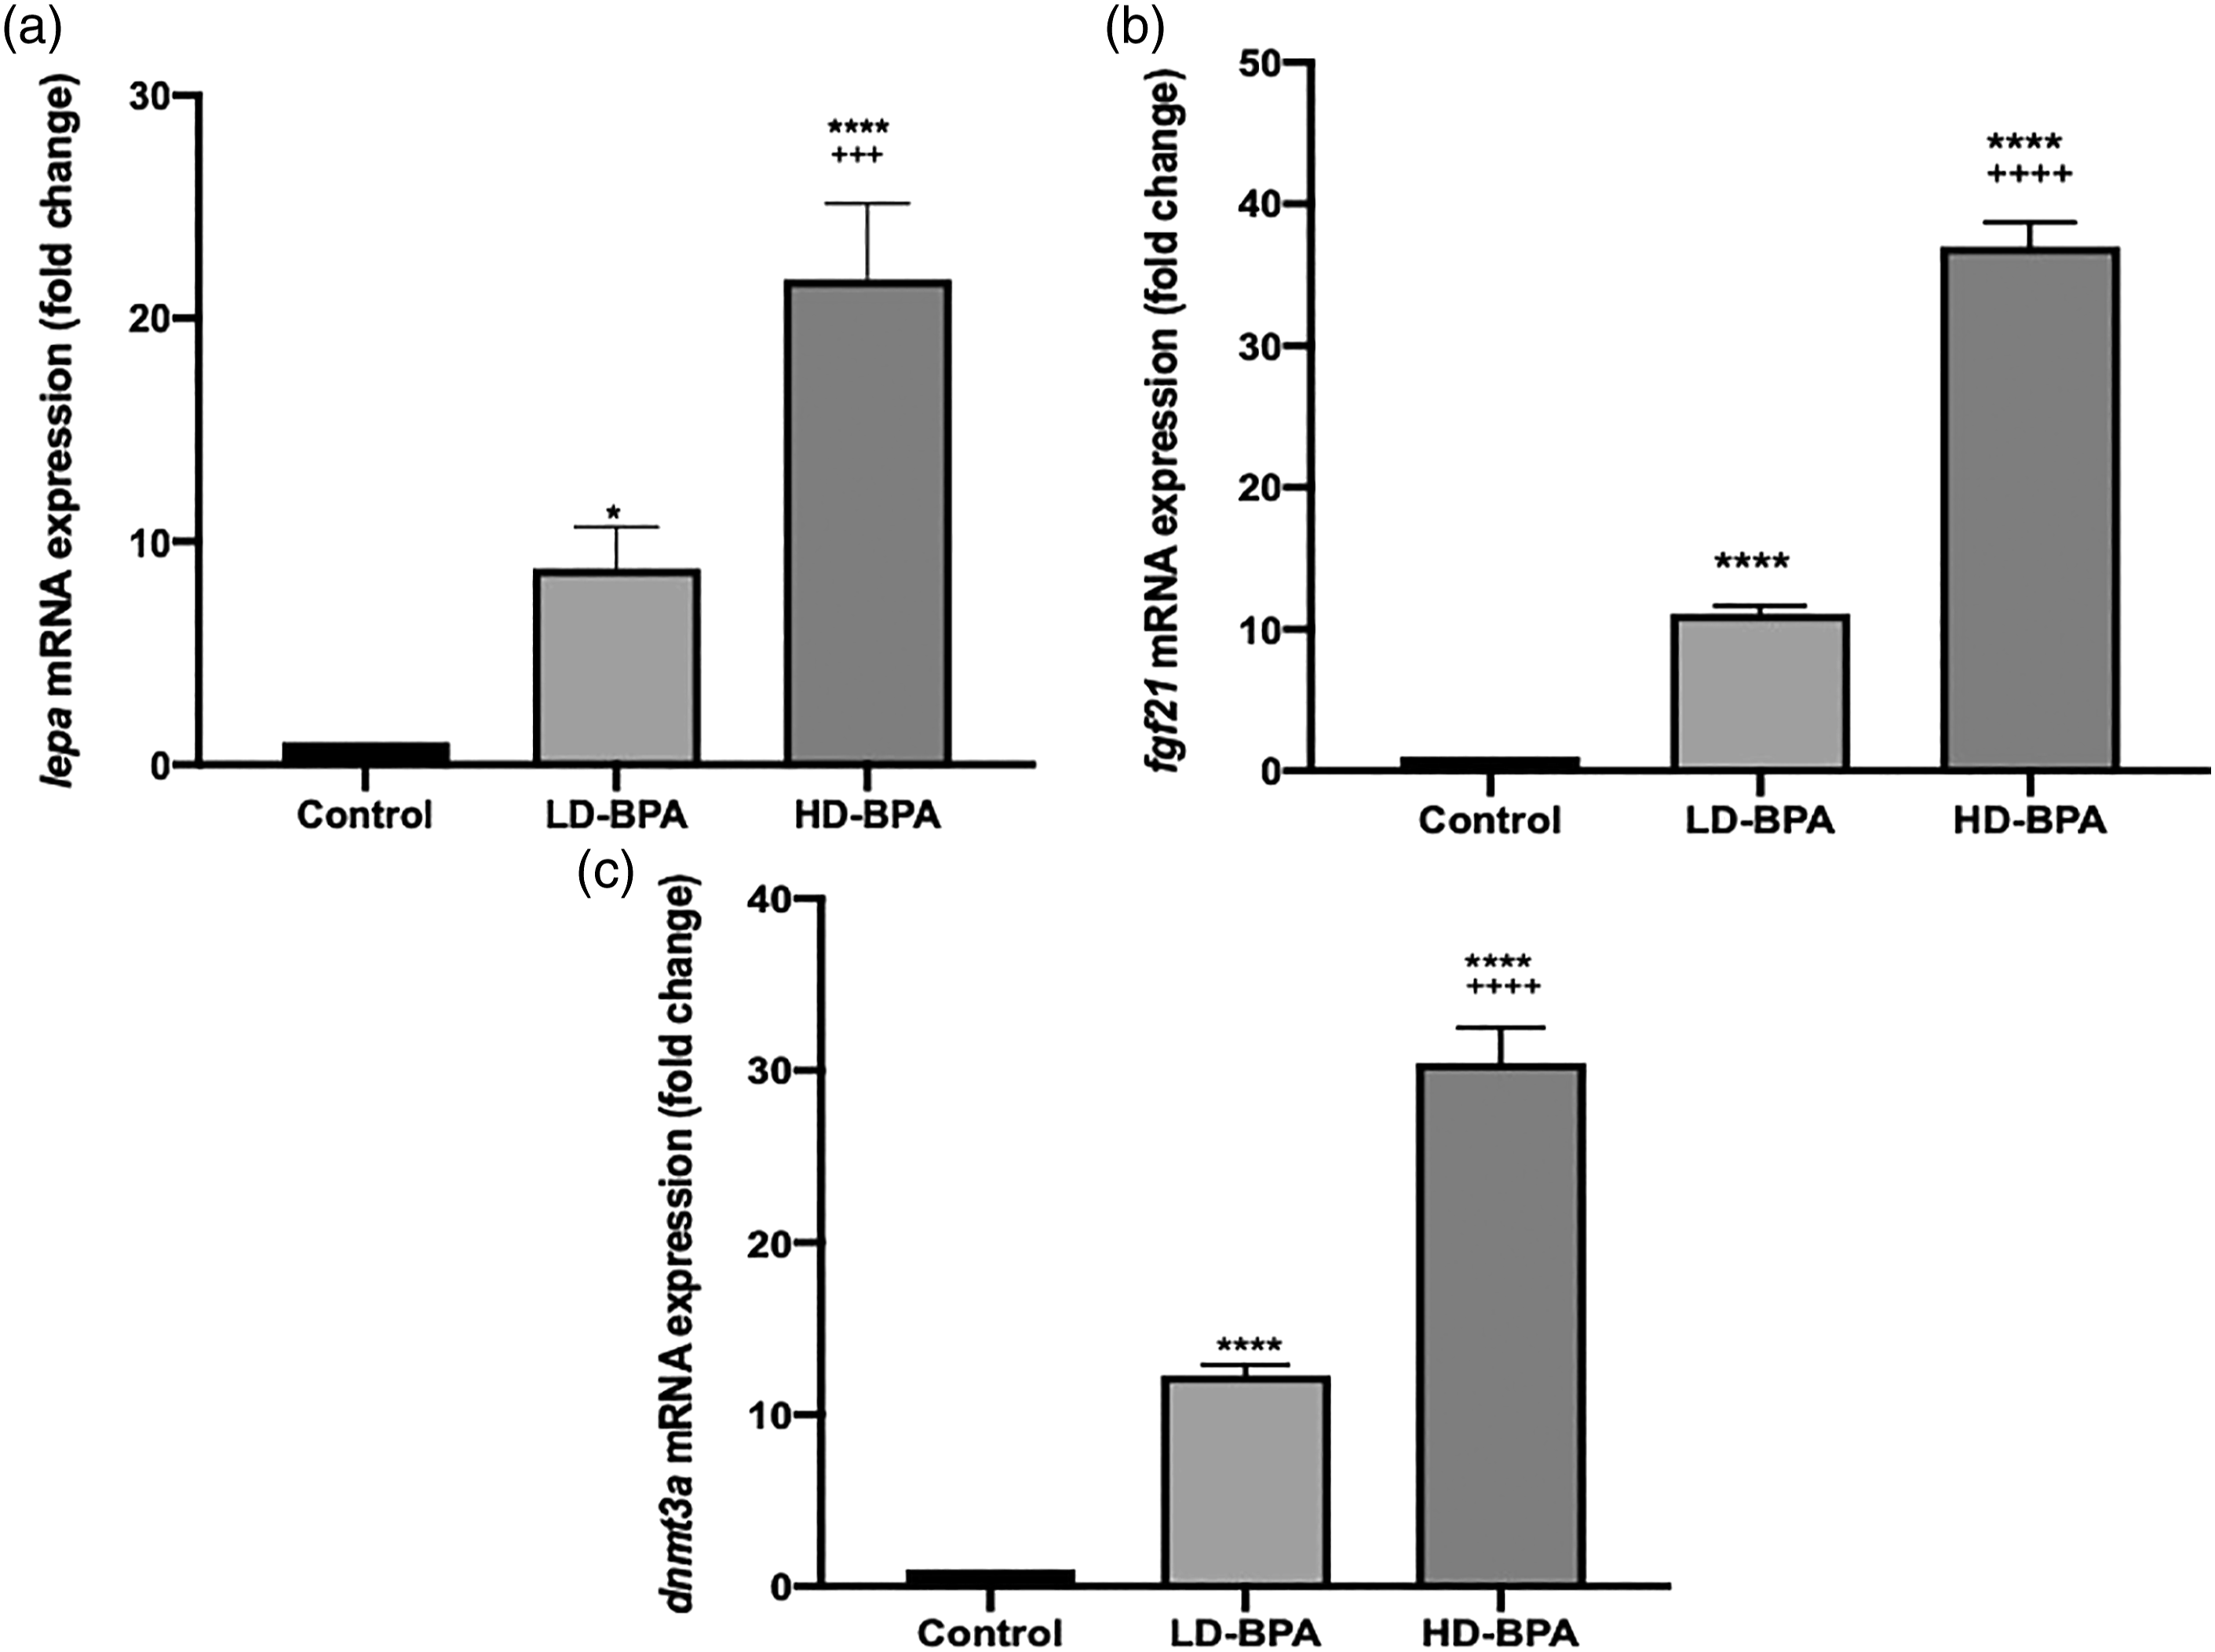
The lepa, fgf21, and dnmt3a expressions of the C, LD-BPA, and HD-BPA groups are given in Figure 4. lepa, fgf21, and dnmt3a expressions of the LD-BPA and HD-BPA groups increased significantly compared to the control group (p < 0.05, p < 0.0001, p < 0.0001; and p < 0.0001, p < 0.0001, p < 0.0001, respectively). In the HD-BPA group lepa, fgf21, and dnmt3a expressions were found to be increased significantly compared to the LD-BPA (p < 0.001, p < 0.0001, and p < 0.0001, respectively). lepa, fgf21, and dnmt3a expressions of the groups (n = 3, three independent biological replicates were prepared for each treatment. For each biological replicate, three technical replicates of each PCR reaction were performed). Values are given as means ± SD. **** p < 0.0001 significantly different from the control group; * p < 0.05 significantly different from the control group;
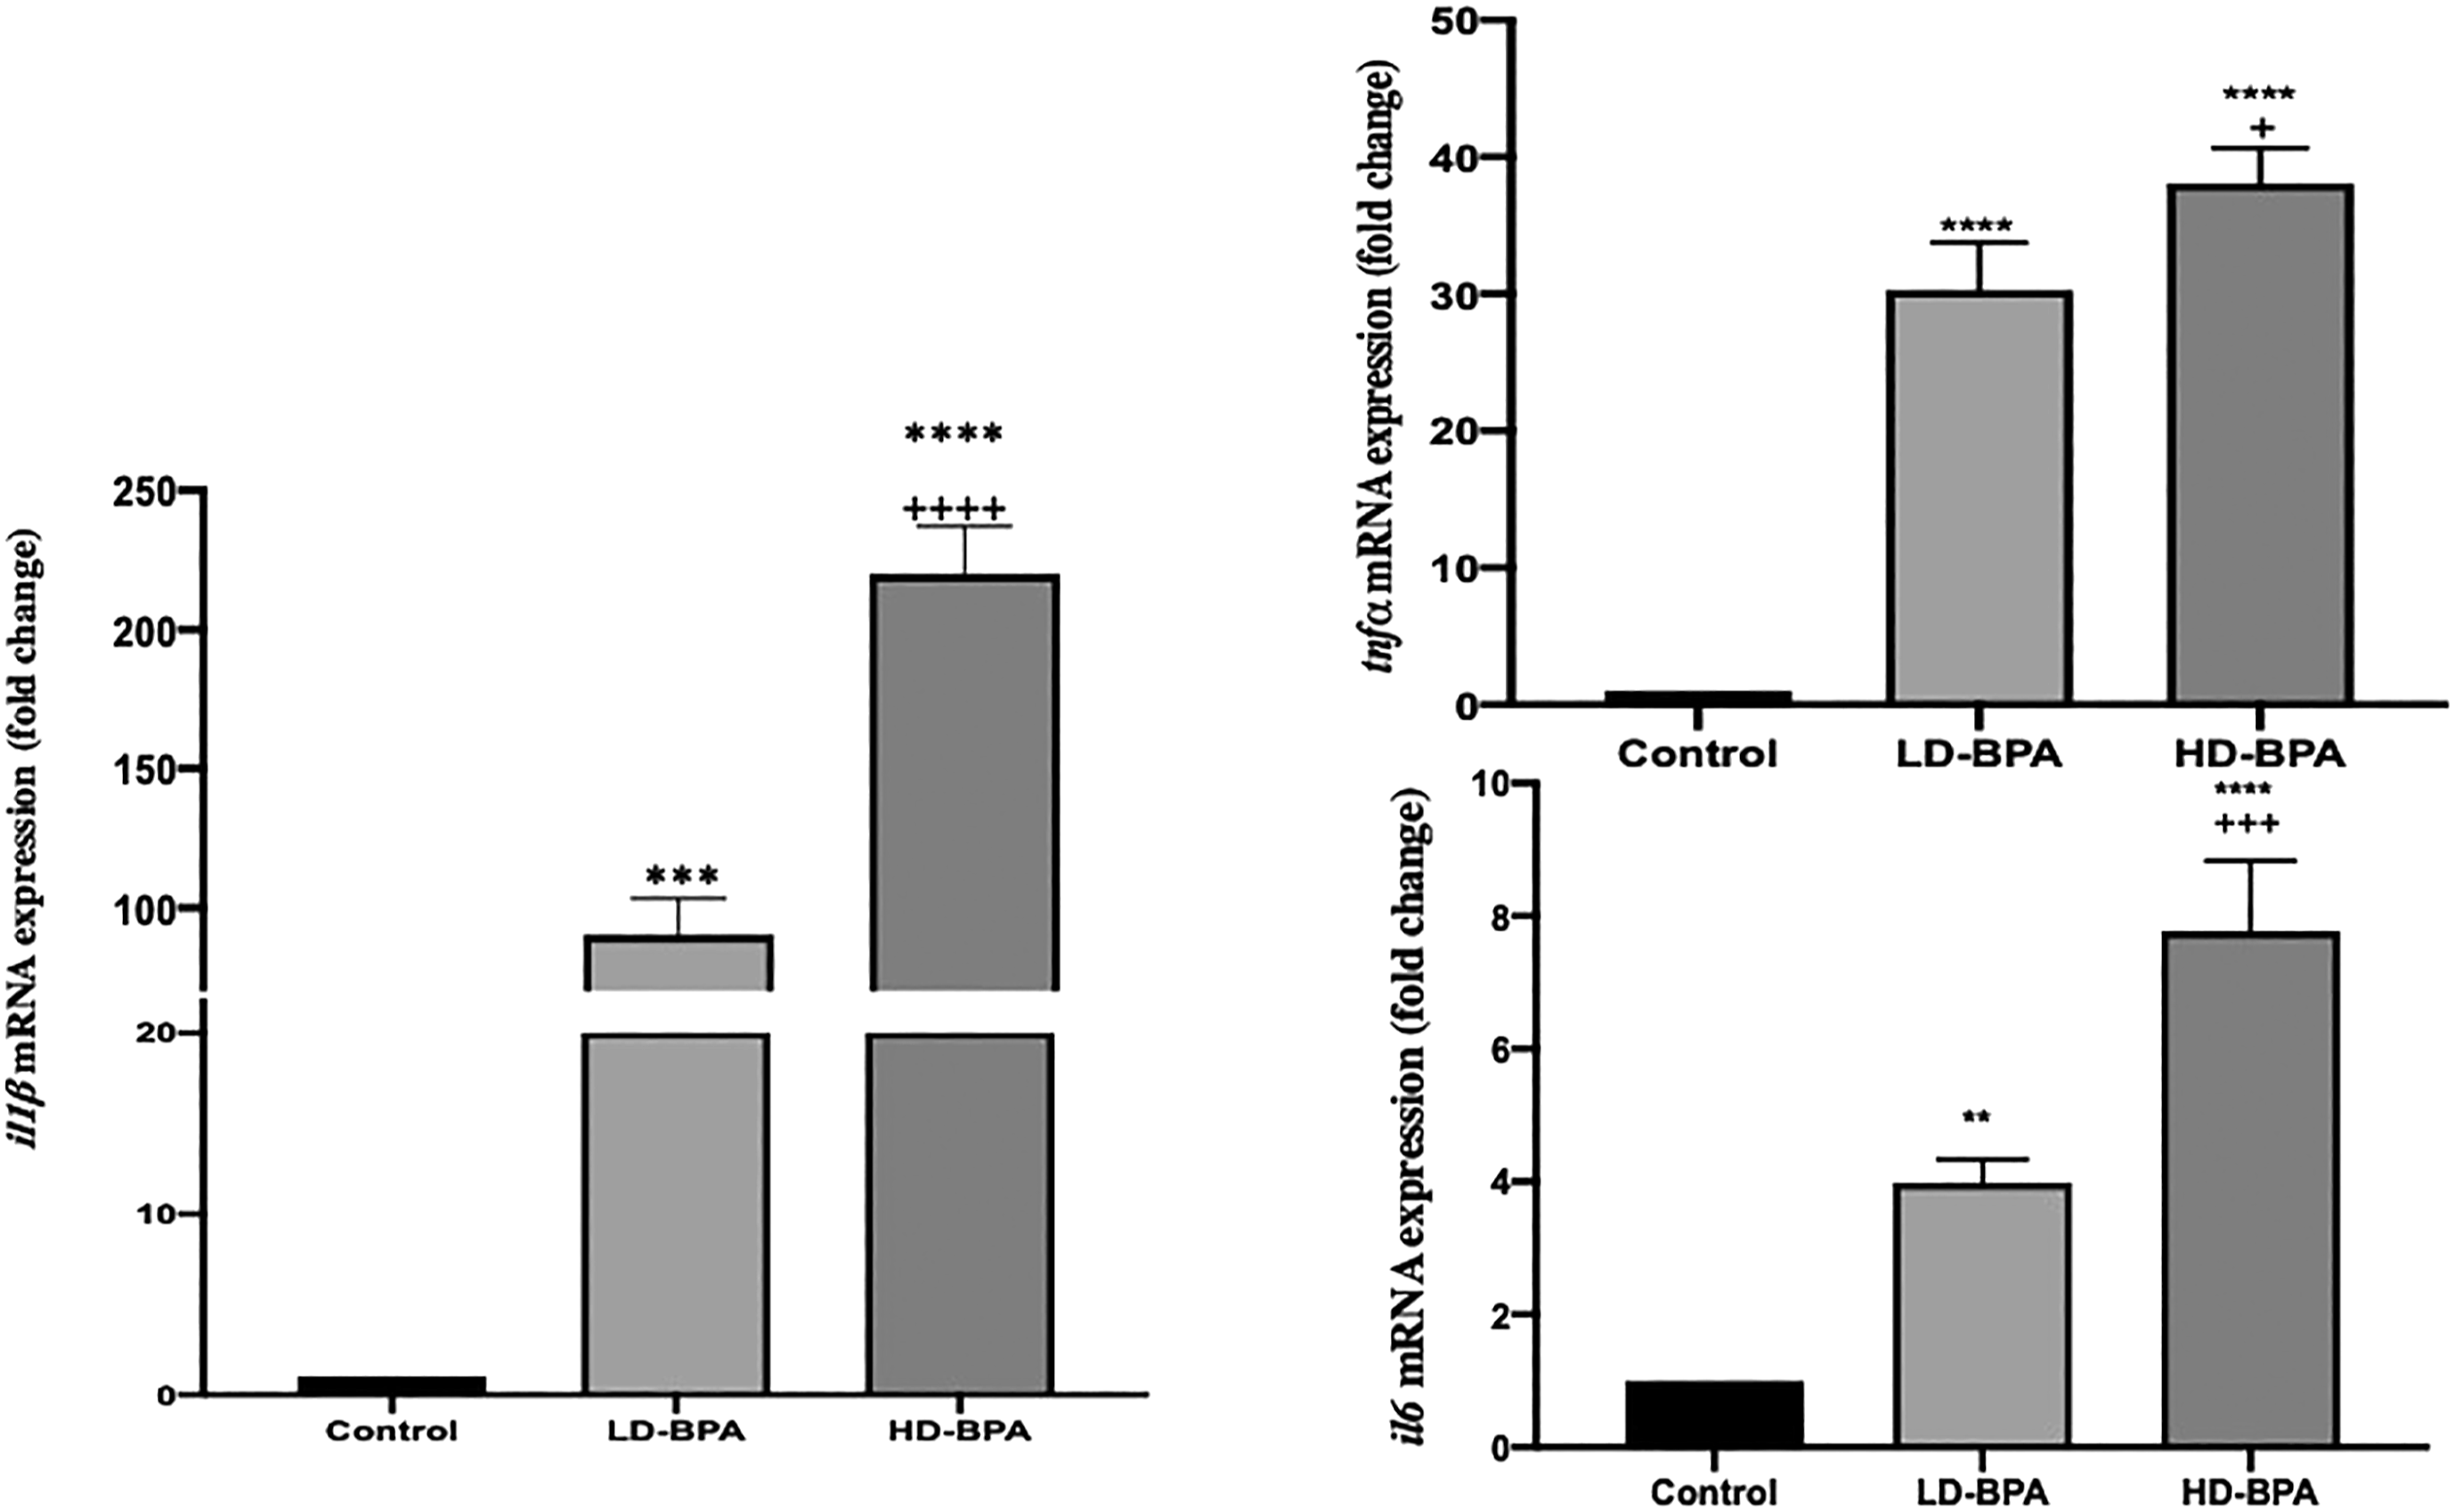
il1ß, tnfα, and il6 expressions of the C, LD-BPA, and HD-BPA groups are given in Figure 5. il1ß, tnfα, and il6 expressions of the LD-BPA and HD-BPA groups increased significantly compared to the control group (p < 0.001, p < 0.0001, p < 0.01, and p < 0.0001, p < 0.0001, p < 0.0001, respectively). In the HD-BPA group il1ß, tnfα, and il6 expressions were found to be increased significantly compared to the LD-BPA (p < 0.0001, p < 0.05, and p < 0.001, respectively). il1ß, tnfα, and il6 expressions of the groups (n = 3, three independent biological replicates were prepared for each treatment. For each biological replicate, three technical replicates of each PCR reaction were performed). Values are given as means ± SD. **** p < 0.0001 significantly different from the control group; *** p < 0.001 significantly different from the control group; ** p < 0.01 significantly different from the control group;
Light microscopic investigation of the control group showed normal liver morphology with hepatocytes and sinusoids. Hepatocytes were arranged regularly with centrally located spherical nuclei and a small number of lipid vacuoles in the cytoplasm (Figure 6(a)). Low-dose BPA exposure caused hepatocyte degeneration with moderate lipid vacuolization and vasocongestion (Figure 6(b)). Hepatocyte degeneration with severe lipid vacuolization was prominent in the high-dose BPA group besides vasocongestion (Figure 6(c)). Representative light micrographs of zebrafish liver in experimental group. Control group (A) Regular hepatocytes with a few amount of small lipid vacuoles (arrows) and sinusoids (arrow heads). LD-BPA (B) Degenerated hepatocytes with moderate lipid vacuolization (arrows) and sinusoids (arrow heads) and vasocongestion (*). HD-BPA (C) Degenerated hepatocytes with severe lipid vacuolization (arrows), vasocongestion (*) and sinusoids (arrow heads). H&E staining. LD-BPA: Low-dose BPA; HD-BPA: High-dose BPA.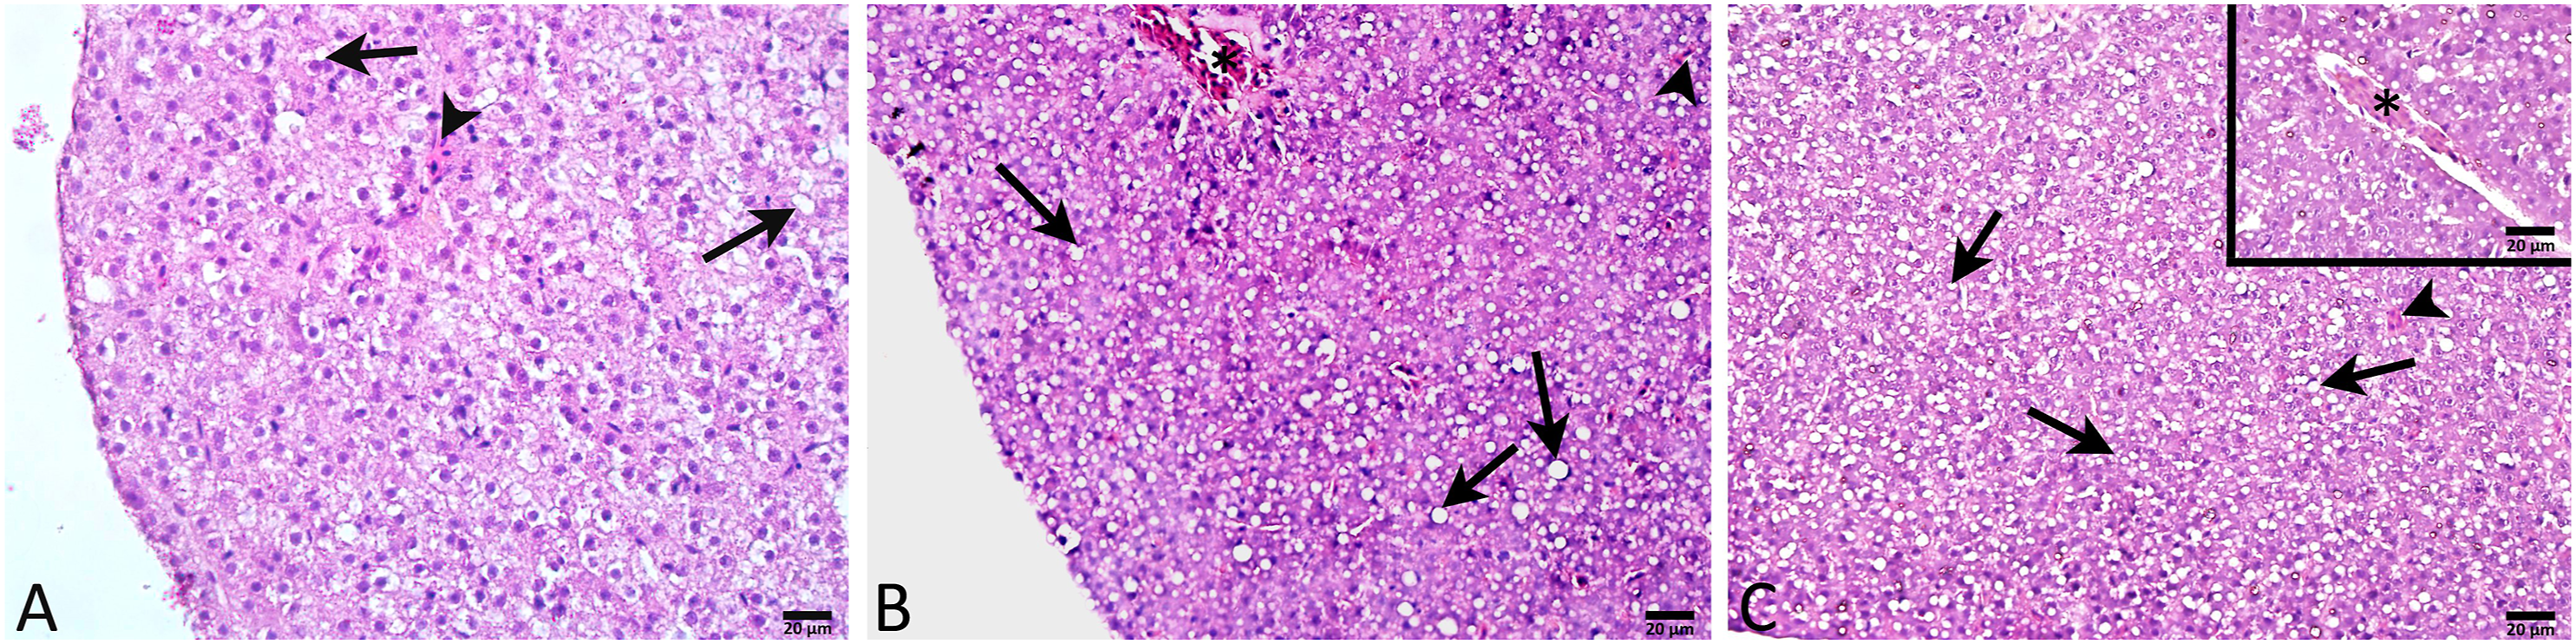
Discussion
According to the results of our study, it was determined that BPA significantly increased fasting blood glucose values and body weights at the end of 30 days when compared to the control group. This increase was observed in both the low- and high-dose BPA groups, being more pronounced at the higher dose. In addition, statistically significant increases in OGTT at 30, 60, and 120 min in the BPA groups indicated impaired glucose tolerance in these groups.
Increased liver fgf21 expressions in the low- and high-dose BPA groups may result from impaired tissue sensitivity and may be suggested as a protective mechanism to overcome the harmful effects of BPA. As a regulator of energy homeostasis, FGF21 causes weight loss by increasing energy expenditure. Paradoxically, obesity in rodents and humans is characterized by high levels of FGF21 in the blood. Some degree of resistance to the effects of FGF21 has been proposed as part of the endocrine changes in obesity (Giralt et al., 2015). Based on experimental studies in rodent models, it has been suggested that FGF21 is an anti-aging hormone. However, circulating levels of FGF21 increased with aging in rodents and humans. Furthermore, despite the metabolic health-promoting effects of FGF21, its elevated levels under conditions such as obesity and diabetes have been attributed to varying tissue sensitivity to FGF21 (Villarroya et al., 2018).
DNA methylation is the main epigenetic modification that regulates gene expression without changing the DNA sequence, and therefore, it has a critical role in many physiological and pathological processes (Robertson and Wolffe, 2000). Reduced DNA methylation was shown to be correlated with increased hepatic Fgf21 expression in mouse liver (Yuan, X. et al., 2018). Adipose Dnmt3a has been shown to be a novel epigenetic mediator of insulin resistance and Fgf21 has been demonstrated to be a key Dnmt3a target gene that is negatively regulated in adipocytes. DNA methylation at the FGF21 location is elevated in people with diabetes (You et al., 2017). We aimed to determine the relation between DNA methylation and FGF21 expression in case of BPA-induced obesity. According to our results, in accordance with increased fgf21 expressions, dnmt3a expressions also increased in both low- and high-dose BPA groups indicating DNA methylation.
Leptin is a polypeptide hormone that circulates in proportion to body fat mass and regulates food intake, energy consumption, and autonomic function. It plays a vital role in regulating energy homeostasis. Leptin deficiency promotes hyperphagia and weight gain, while leptin administration leads to reduced food intake, increased energy expenditure, and weight loss. However, recent evidence implies that leptin is not only necessary for the regulation of energy balance but also for glucose homeostasis (Meek and Morton, 2012). Although the amino acid sequences are different, the basic structural features and intracellular signaling mechanisms of leptin and its receptor are conserved throughout vertebrates. The administration of mammalian leptin in birds and fish caused an anorexigenic effect suggesting preservation of the function of the leptin system (Londraville et al., 2014). However, in mammals, although leptin is expressed predominantly in adipose tissue, leptin expression in fish and birds appears to be negligible in adipose tissue. The expression profile varies greatly with many studies reporting the liver as an expression site in fish (Johnson et al., 2000; Copeland et al., 2011). According to the results of our study, low- and high-dose BPA caused an increase in liver lepa expressions in zebrafish. As leptin decreases food intake and body weight, the coexistence of increased leptin levels with obesity is generally interpreted as evidence of “leptin resistance” (Myers et al., 2010).
Obesity is one of the main factors contributing to the development of insulin resistance and increases the risk of type 2 diabetes. Inflammatory mediators link obesity to insulin resistance. Obesity itself causes a proinflammatory state in metabolic tissues as shown by the increased regulation of proinflammatory cytokines such as Interleukin (IL)-1β and TNFα, which can directly interfere with the insulin signal in adipocytes, hepatocytes, fibroblasts, and myocytes (Gregor and Hotamisligil 2011). Accordingly, increased expressions of il1ß, tnfα, and il6 were found in both BPA given groups, and the expressions in the high-dose BPA given group were higher than the low-dose BPA given group.
It has been shown that BPA can increase placental inflammation and impair oxidative balance and neurodevelopment by promoting IL-1β and IL-6 (Arita et al., 2019). Among the various proinflammatory cytokines, TNFα is the most important proinflammatory mediator that plays a critical role in the development of insulin resistance and the pathogenesis of T2DM. TNFα induces tissue-specific inflammation through ROS formation and activation of various transcription-mediated pathways. Increased TNF-α induces insulin resistance by disrupting the insulin signal through serine phosphorylation leading to the development of T2DM (Akash et al., 2018).
Kim and Jeong. (2003) investigated the effects of BPA on NO, TNF α production and inducible nitric oxide synthase (iNOS) level, and TNF-α gene expression in mouse macrophages. According to their results, they reported that BPA may affect the regulation of immune system function by reducing the production of NO and TNF-α through the inhibition of NF-kappaB transactivation mediated by the estradiol receptor. In our study, while BPA increased LPO, NO level, and GST activity in the liver, SOD activity decreased. ROS production and/or decreased antioxidant defense capacity contribute significantly to BPA organ toxicity by altering the oxidative balance in the mitochondria and in the cell.
As a key component of inflammatory reactions, oxidative stress has been associated with different and not fully understood mechanisms in the development and progression of aging, cardio-metabolic, and immune diseases, neuronal degeneration, and cancer (Lenaz, 2012). Regulation of redox balance is necessary to maintain cellular homeostasis, developmental growth, and survival. Indeed, physiological cellular metabolism produces ROS (i.e., superoxide anions, peroxides, and hydroxyl radicals) involved in the redox equilibrium, which is a well regulated process. ROS includes not only radical and non-radical oxygen derivatives but also nitrogen-containing compounds identified as reactive nitrogen species (i.e., NO and peroxynitrite). BPA can impair oxidative homeostasis by increasing oxidative mediators and reducing antioxidant enzymes, causing mitochondrial dysfunction and apoptosis. BPA was reported to cause oxidative stress by reducing antioxidant enzymes including SOD, catalase, glutathione reductase (GR), and glutathione peroxidase (GSH-Px) and by increasing hydrogen peroxide and LPO in the liver (Bindhumol et al., 2003).
The impaired oxidant–antioxidant balance was in accordance with tissue damage observed by histological evaluation. BPA caused hepatocyte degeneration with moderate lipid vacuolization and vasocongestion in the low-dose BPA group. Vasocongestion, hepatocyte degeneration with severe lipid vacuolization was prominent in the high-dose BPA group. On the other hand, there are conflicting findings regarding the pro-oxidant and antioxidant roles of BPA. Doses, duration, and differences in cellular microenvironments used in different studies may affect the pro-oxidant/antioxidant role of BPA. While many in vivo and in vitro studies support the pro-oxidant effects of BPA, its antioxidant role has only been reported in vitro through the activation of the Nrf1/2-antioxidant response element pathway in HEK 293 cells (Chepelev, 2013). In accordance with the results of our study, Üstündağ et al. showed that BPA increased NO levels and decreased SOD activity in zebrafish embryos (Üstündağ et al., 2017).
As a conclusion, the results of our study show that impaired glucose tolerance, oxidant–antioxidant balance, increased inflammatory response, fgf21 expression, and dnmt3a expressions may be the possible mechanisms for the BPA-induced obesity model in zebrafish. The lack of electron microscopic results and micrographs may be suggested as a limitation of our study and we plan to exhibit the degenerative changes in the organelles of hepatopancreatic tissues of BPA-exposed zebrafish in our future studies.
Footnotes
Declaration of conflicting interests
The author(s) declared no potential conflicts of interest with respect to the research, authorship, and/or publication of this article.
Funding
The author(s) disclosed receipt of the following financial support for the research, authorship, and/or publication of this article: This work was supported by the research grant from Marmara University Scientific Research Projects Commission (Grant number: TYL-2020-10072).
Ethical approval
Institutional Animal Care and Use Committee of Marmara University approved all the procedures applied in the study (85.2019.mar).