
Abstract
Perfluorooctane sulfonate (PFOS) is a man-made chemical widely used in many products and acts as an endocrine-disrupting chemical (EDC). PFOS has spread to the environment through industrial manufacturing processes and disposal of PFOS-containing products. There is growing evidence that environmental pollutants may have promoting effects on cancer cell aggressiveness, rapid growth, and metastasis. Thyroid cancer is an endocrine-related cancer that can respond to EDCs. This study aimed to explore the effect of PFOS on the growth and metastatic potential (invasion capability) of FTC-133 human thyroid cancer cells. PFOS exposure for 72 h (1 pM to 10 µM) did not stimulate growth of FTC-133 cells. However, PFOS exposure at low concentration (1 nM) enhanced invasion capability of the cells, with no correlation to the expression level of estrogen receptors. FTC-133 cells exposed to 1 nM PFOS displayed increasing phosphorylation of multiple invasion-related signaling proteins, including Akt, ERK, and EphA2. Our study revealed that PFOS at low concentration may influence thyroid cancer progression by increasing the metastatic potential of cancer cells.
Introduction
The characteristics of aggressive cancer include rapid tumor growth and rapid spread to other tissues or metastasis. Two-third of patients with solid tumors die from metastases (Dillekås et al., 2019), which remains incurable by current treatment methods (Korentzelos et al., 2020). Metastasis starts when cancer cells invade into the surrounding tissues and blood vessels, and then travels through the blood and lymphatic circulation to establish new tumors in distant organs (Van Zijl et al., 2011). In 2015, a workshop held by the National Institute of Environmental Health Sciences summarized the concern on the potential of chronic low-dose exposure of environmental contaminants in accelerating invasion and metastasis (Ochieng et al., 2015), suggesting that promotion of invasion/metastasis may be considered for assessment of potential carcinogenicity for classifying the hazardous nature of a substance.
Perfluorooctane sulfonate (PFOS) possesses high chemical and thermal stability and is resistant to degradation when released into the environment (Cousins et al., 2020). A survey of PFOS bioaccumulation reported that PFOS could be detected in the blood and liver of coastal fishes and fish-eating birds (Taniyasu et al., 2003). Acute toxicity (LD50) of PFOS in mice was 0.579 g/kg body weight, and long-term administration of PFOS (2.5–10 mg PFOS/kg BW/day for 30 days) reduced the level of antioxidant enzymes and increased apoptotic cells in livers of the mice (Xing et al., 2016).
PFOS concentrations detected in human blood vary depending on occupational and environmental exposure. A large-scale study in the U.S. general population of 2066 women and 1900 men reported that PFOS concentrations in serum were 0.14–406.0 ng/ml (0.3–811.8 nM) for women and 0.3–435.0 ng/ml (0.6-869.8 nM) for men (Melzer et al., 2010). The half-life of PFOS in human blood circulation has been estimated to be 5.4 years (Olsen Geary et al., 2007).
Estrogen (estradiol, E2) and other estrogenic compounds stimulate cell growth by binding to estrogen receptors (ERs) including ERα and GPR30 (Miziak et al., 2023). PFOS has been shown to exhibit estrogenic activity in breast epithelial cells by stimulating cell growth. In MCF-7 BOS human breast cancer cells, a cell growth promoting effect of PFOS was observed at concentrations of 0.01 and 30 μg/ml (20 and 600 nM) (Henry and Fair, 2013). PFOS at 1-10 μM promoted growth and invasion of MCF-10A normal breast epithelial cells, and these effects partially involved ERs (Pierozan and Karlsson, 2018). PFOS at 10 nM could enhance invasion of esophageal squamous cell carcinoma cells by inducing the epithelial-mesenchymal transition (Liu et al., 2022).
Thyroid carcinoma results from cancer cells that develop in the thyroid gland and is an endocrine-related cancer that may respond to estrogenic compounds. Follicular thyroid cancer (FTC) and papillary thyroid cancer (PTC) are the two most common types of thyroid carcinoma. A higher rate of distant metastasis was observed in patients with FTC that has a tendency to spread to lungs and bones when compared to PTC that prefers to metastasize to local lymph nodes (Cabanillas et al., 2016; Kondo et al., 2006). Associations between plasma PFOS concentration and thyroid cancer diagnosis were observed in a case-control study of 88 thyroid cancer cases and 88 healthy controls (Van Gerwen et al., 2023). Moreover, PFOS has been found in surgical thyroid tissue specimens at a level of 3.1 ng/g tissue (Maestri et al., 2006). However, the effect of PFOS on thyroid cancer growth and metastasis is still not known. Since distant metastasis is more serious than local lymph node metastasis, it is therefore interesting to study the influence of PFOS on growth and metastatic potential of FTC cells.
Invasion and metastasis of thyroid cancer cells are driven by activation of multiple invasion-related signaling pathways. The involvement of Akt signaling activation in thyroid invasion and metastasis has been evident (Kim et al., 2005; Vasko et al., 2004). ERK signaling activation enhances invasion capability of thyroid cancer cells (Guan et al., 2017). Erythropoietin-producing hepatocellular receptor A2 (EphA2) is a receptor tyrosine kinase that is overexpressed in a broad range of cancer types, and its phosphorylation at serine897 by a non-canonical pathway contributes to cancer progression and metastasis (Zhou and Sakurai, 2017). EphA2 expression has been reported to be associated with invasion capability of FTC cells (O’Malley et al., 2012).
This study aimed to explore the impact of PFOS on cell growth and invasion capability of FTC-133 follicular thyroid carcinoma cells. We also investigated the effect of PFOS on invasion-related signaling pathways of thyroid cancer cells.
Materials and methods
Chemicals and reagents
PFOS (purity >95%) was obtained from Wako Pure Chemicals Industry, Ltd (Osaka, Japan). Dimethyl sulfoxide (DMSO), 17β-estradiol (E2), 3-(4, 5-dimethyl thiazolyl-2)-2, 5-diphenyltetrazolium bromide (MTT), and charcoal-stripped fetal bovine serum (CSS) were purchased from Sigma-Aldrich (St Louis, MA, USA). E2 was served as a positive control for ER-mediated cell growth stimulation. Ham’s F12 Nutrient Mix, DMEM, phenol red-free DMEM, and fetal bovine serum (FBS) were purchased from Gibco (Life Technologies, Grand Island, NY, USA). Matrigel was obtained from Corning (cat. no. 356234; Bedford, MA, USA). Anti-ERα antibody was purchased from Santa Cruz Biotechnology (cat. no. sc-542; Santa Cruz, CA, USA). Anti-GPR30 antibody was purchased from Abcam (cat. no. ab154069; Cambridge, UK). Primary antibodies specific to β-Actin (cat. no. 3700), total ERK1/2 (cat. no. 9102), phospho-ERK1/2 (T202/Y204; cat. no. 9101), total Akt (cat. no. 9272), phospho-Akt (S473; cat. no. 9271), total EphA2 (cat. no. 6997), and phospho-EphA2 (Ser897; cat. no. 6347) were obtained from Cell Signaling Technology (Danvers, MA, USA).
Cell culture
The FTC-133 human follicular thyroid carcinoma cell line was kindly provided by Prof. Johan Lillehaug, University of Bergen, Norway. The cells were cultured in a 1:1 mixture of DMEM: Ham’s F12 medium supplemented with 2 mM L-glutamine, 10% FBS, and 1% antibiotic-antimycotic. The MCF-7 human mammary carcinoma cell line was obtained from the American Type Culture Collection (ATCC, Rockville, MD, USA), and cultured in DMEM supplemented with 10% FBS, and 1% antibiotic-antimycotic. MCF-7 cells were used as a positive control cell line for ERs expression and E2 response. All cells were maintained at 37°C in a 5% CO2 atmosphere.
Charcoal-stripped fetal bovine serum was used to ensure that steroid hormones in serum were removed by activated carbon. Phenol red is also a weak estrogenic substance, so phenol red-free medium was employed in our experiments. Before exposure to PFOS or E2, cells were maintained under estrogen-free condition for 72 h to induce estrogen responsive, by cultivating in a hormone-deprived (HD) medium using phenol red-free DMEM supplemented with 10% CSS. All subsequent experiments were performed in HD medium. DMSO concentration was kept at 0.2% throughout the experiments including the control group.
Cell growth determination and MTT assay
Hormone-deprived FTC-133 and MCF-7 cells were seeded into 96-well plates (2.5 × 10³ cells/well and 1 × 10⁴ cells/well, respectively) and incubated at 37°C for 24 h. After that, the cells were exposed to PFOS or E2 for another 72 h. Viability of cells after treatment was determined by the MTT assay as an indicator of cell growth. Briefly, the wells were replaced with 100 μl of medium containing 0.5 mg/ml MTT, and further incubated at 37°C for 2 h, and then the medium was replaced with 100 μl DMSO to dissolve formazan crystals. Absorbance was measured at 550 nm and subtracted with absorbance at 650 nm. Data are expressed as percent cell growth compared with control.
Cell invasion assay
Cancer invasion capability was assessed by the Transwell invasion assay using a 24-well Transwell cell culture chamber with an 8 μm pore size (Costar, Cambridge, MA, USA). Briefly, the filters of 24-well Transwell inserts were coated with 100 µl of Matrigel (300 μg/ml), according to the manufacturer’s protocol. Hormone-deprived FTC-133 and MCF-7 cells were seeded into 6-well plates at 5 × 10⁴ cells/well and 1 × 10⁵ cells/well, respectively. After 24 h, the cells were treated with 1 nM PFOS or 1 nM E2 for 72 h. Subsequently, the cells were trypsinized and 200 µl of cell suspensions in HD medium were seeded into the inserts of 24-well Transwell chambers (2 × 10⁴ cells for FTC-133 and 4 × 10⁴ cells for MCF-7), and lower compartment of the 24-well Transwell chambers were filled with 500 µl HD medium. The cells were allowed to invade for 24 h. After that, non-invading cells on the upper surface of filters were removed by wiping using a cotton swab. The filters were then fixed with 25% methanol and stained with 0.5% w/v crystal violet in 25% methanol and extracted with 0.1 N HCl in methanol. The number of invaded cells was determined from absorbance at 550 nm of the extracted dye. Data are expressed as percent invasion compared with control.
Western blot analysis
Hormone-deprived FTC-133 and MCF-7 cells were seeded into 6-well plates at 5 × 10⁴ cells/well and 1 × 10⁵ cells/well, respectively. After 24 h, the cells were treated with 1 nM PFOS or 1 nM E2 for 72 h; then the treated cells were lysed in RIPA lysis buffer containing protease and phosphatase inhibitor cocktail (Cell Signaling Technology). Cell lysates were sonicated and cell debris was removed by centrifugation at 12,000 × g for 5 min, at 4°C. Supernatants were collected and mixed with 5× sample loading buffer and boiled for 5 min. Bradford reagent (Bio-Rad, CA, USA) was used to measure protein concentration of the supernatants. The cell lysates (20 µg protein) were subjected to SDS-PAGE and blotted to PVDF membranes. The membranes were blocked with 3% bovine serum albumin in Tris-buffered saline, pH 7.6, containing 0.1% Tween for 1 h at room temperature. Subsequently, the membranes were incubated with specific primary antibodies overnight at 4°C, followed by incubation with horseradish peroxidase-conjugated secondary antibodies for 1 h at room temperature. Dilution of the primary antibodies were as follows: β-Actin (1:20,000), ERα (1:1000), GRP30 (1:500), total ERK1/2 (1:1000), phospho-ERK1/2 (1:1000), total Akt (1:1000), phospho-Akt (1:1000), total EphA2 (1:1000), and phospho-EphA2 (1:1000). Bands of targeted proteins were detected by using SuperSignal™ ECL substrates (Thermo Fisher Scientific, Waltham, MA, USA) and visualized on X-ray films. Intensity of the bands on scanned films was quantified using ImageJ software (National Institutes of Health), and the band intensity of each protein’s phosphorylation was normalized to that of the total protein.
Statistical analysis
All presented data were obtained from three independent experiments. The statistical significance of differences between two groups was analyzed by Student’s t-test using GraphPad Prism v10 (GraphPad Software, La Jolla, CA, USA). A p-value less than 0.05 was considered to be significant.
Results
PFOS does not increase growth rate of FTC-133 cells
Initially, we determined whether FTC-133 cells expressed the ERs. As shown in Figure 1, ERα protein bands with a molecular weight of 66 kDa were detected in both FTC-133 and MCF-7 cells, while multiple bands of GPR30 protein were detected with sizes ranging from 43 to 50 kDa. The results indicated that FTC-133 cells expressed both ERα and GPR30, but their expression levels were less than those in MCF-7 cells. Expression level of estrogen receptors in FTC-133 cells. β-Actin was used as a loading control. MCF-7 breast cancer cells served as a positive control cell line.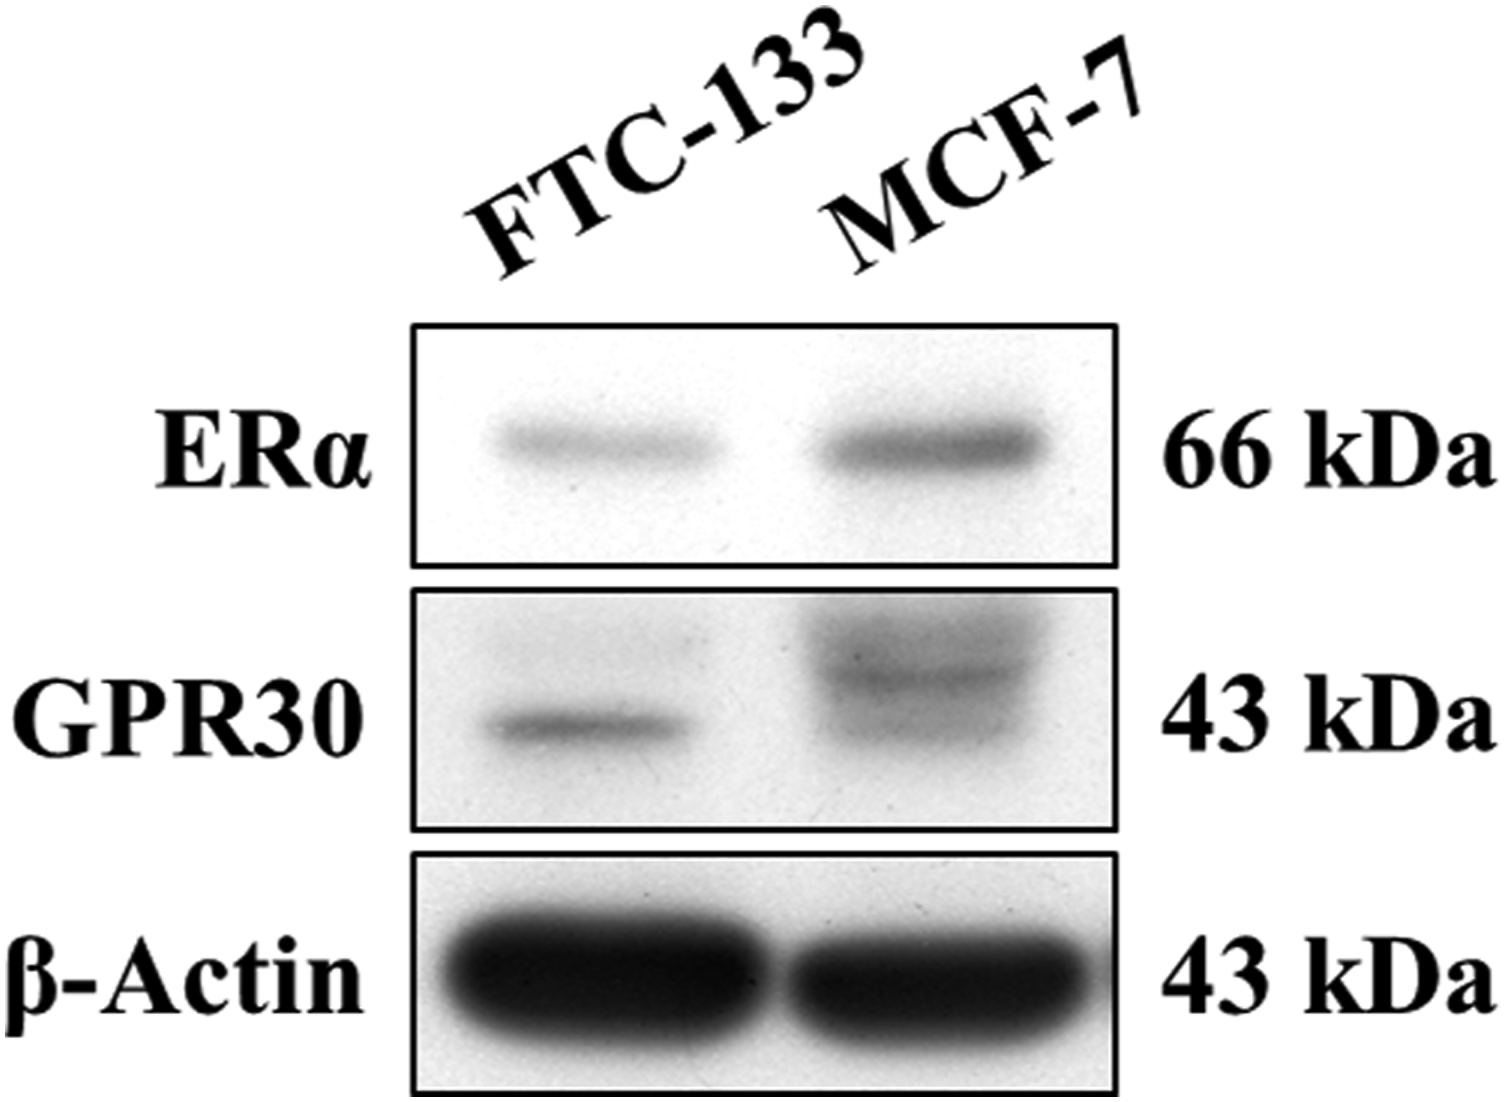
We determined whether PFOS could stimulate FTC-133 cell growth. The cells were exposed to PFOS (0.01 nM to 10 µM) or E2 (1 nM and 1 µM) for 72 h. The results demonstrated that while E2 had a marginal growth stimulatory effect in FTC-133 cells, PFOS did not stimulate growth of the cells (Figure 2), suggesting that FTC-133 was a weak estrogen-responsive thyroid cancer cell line. We also tested the effect of PFOS in a highly estrogen-responsive cell line MCF-7. E2 strongly enhanced MCF-7 cell growth while PFOS did not (Supplemental Figure S1). Collectively, our results indicated that PFOS at concentrations of 10 µM and below did not exhibit classical estrogenic effect, such as cell growth stimulation under hormone-deprived conditions in either thyroid or breast cancer cells. Effect of PFOS on growth of FTC-133 cells. The data are presented as the mean percent ± S.D. from three independent experiments. *p < 0.05 and ***p < 0.001 versus control, and n.s. indicates not significantly different from control. Estrogen (E2) was used as a positive control for estrogenic effect.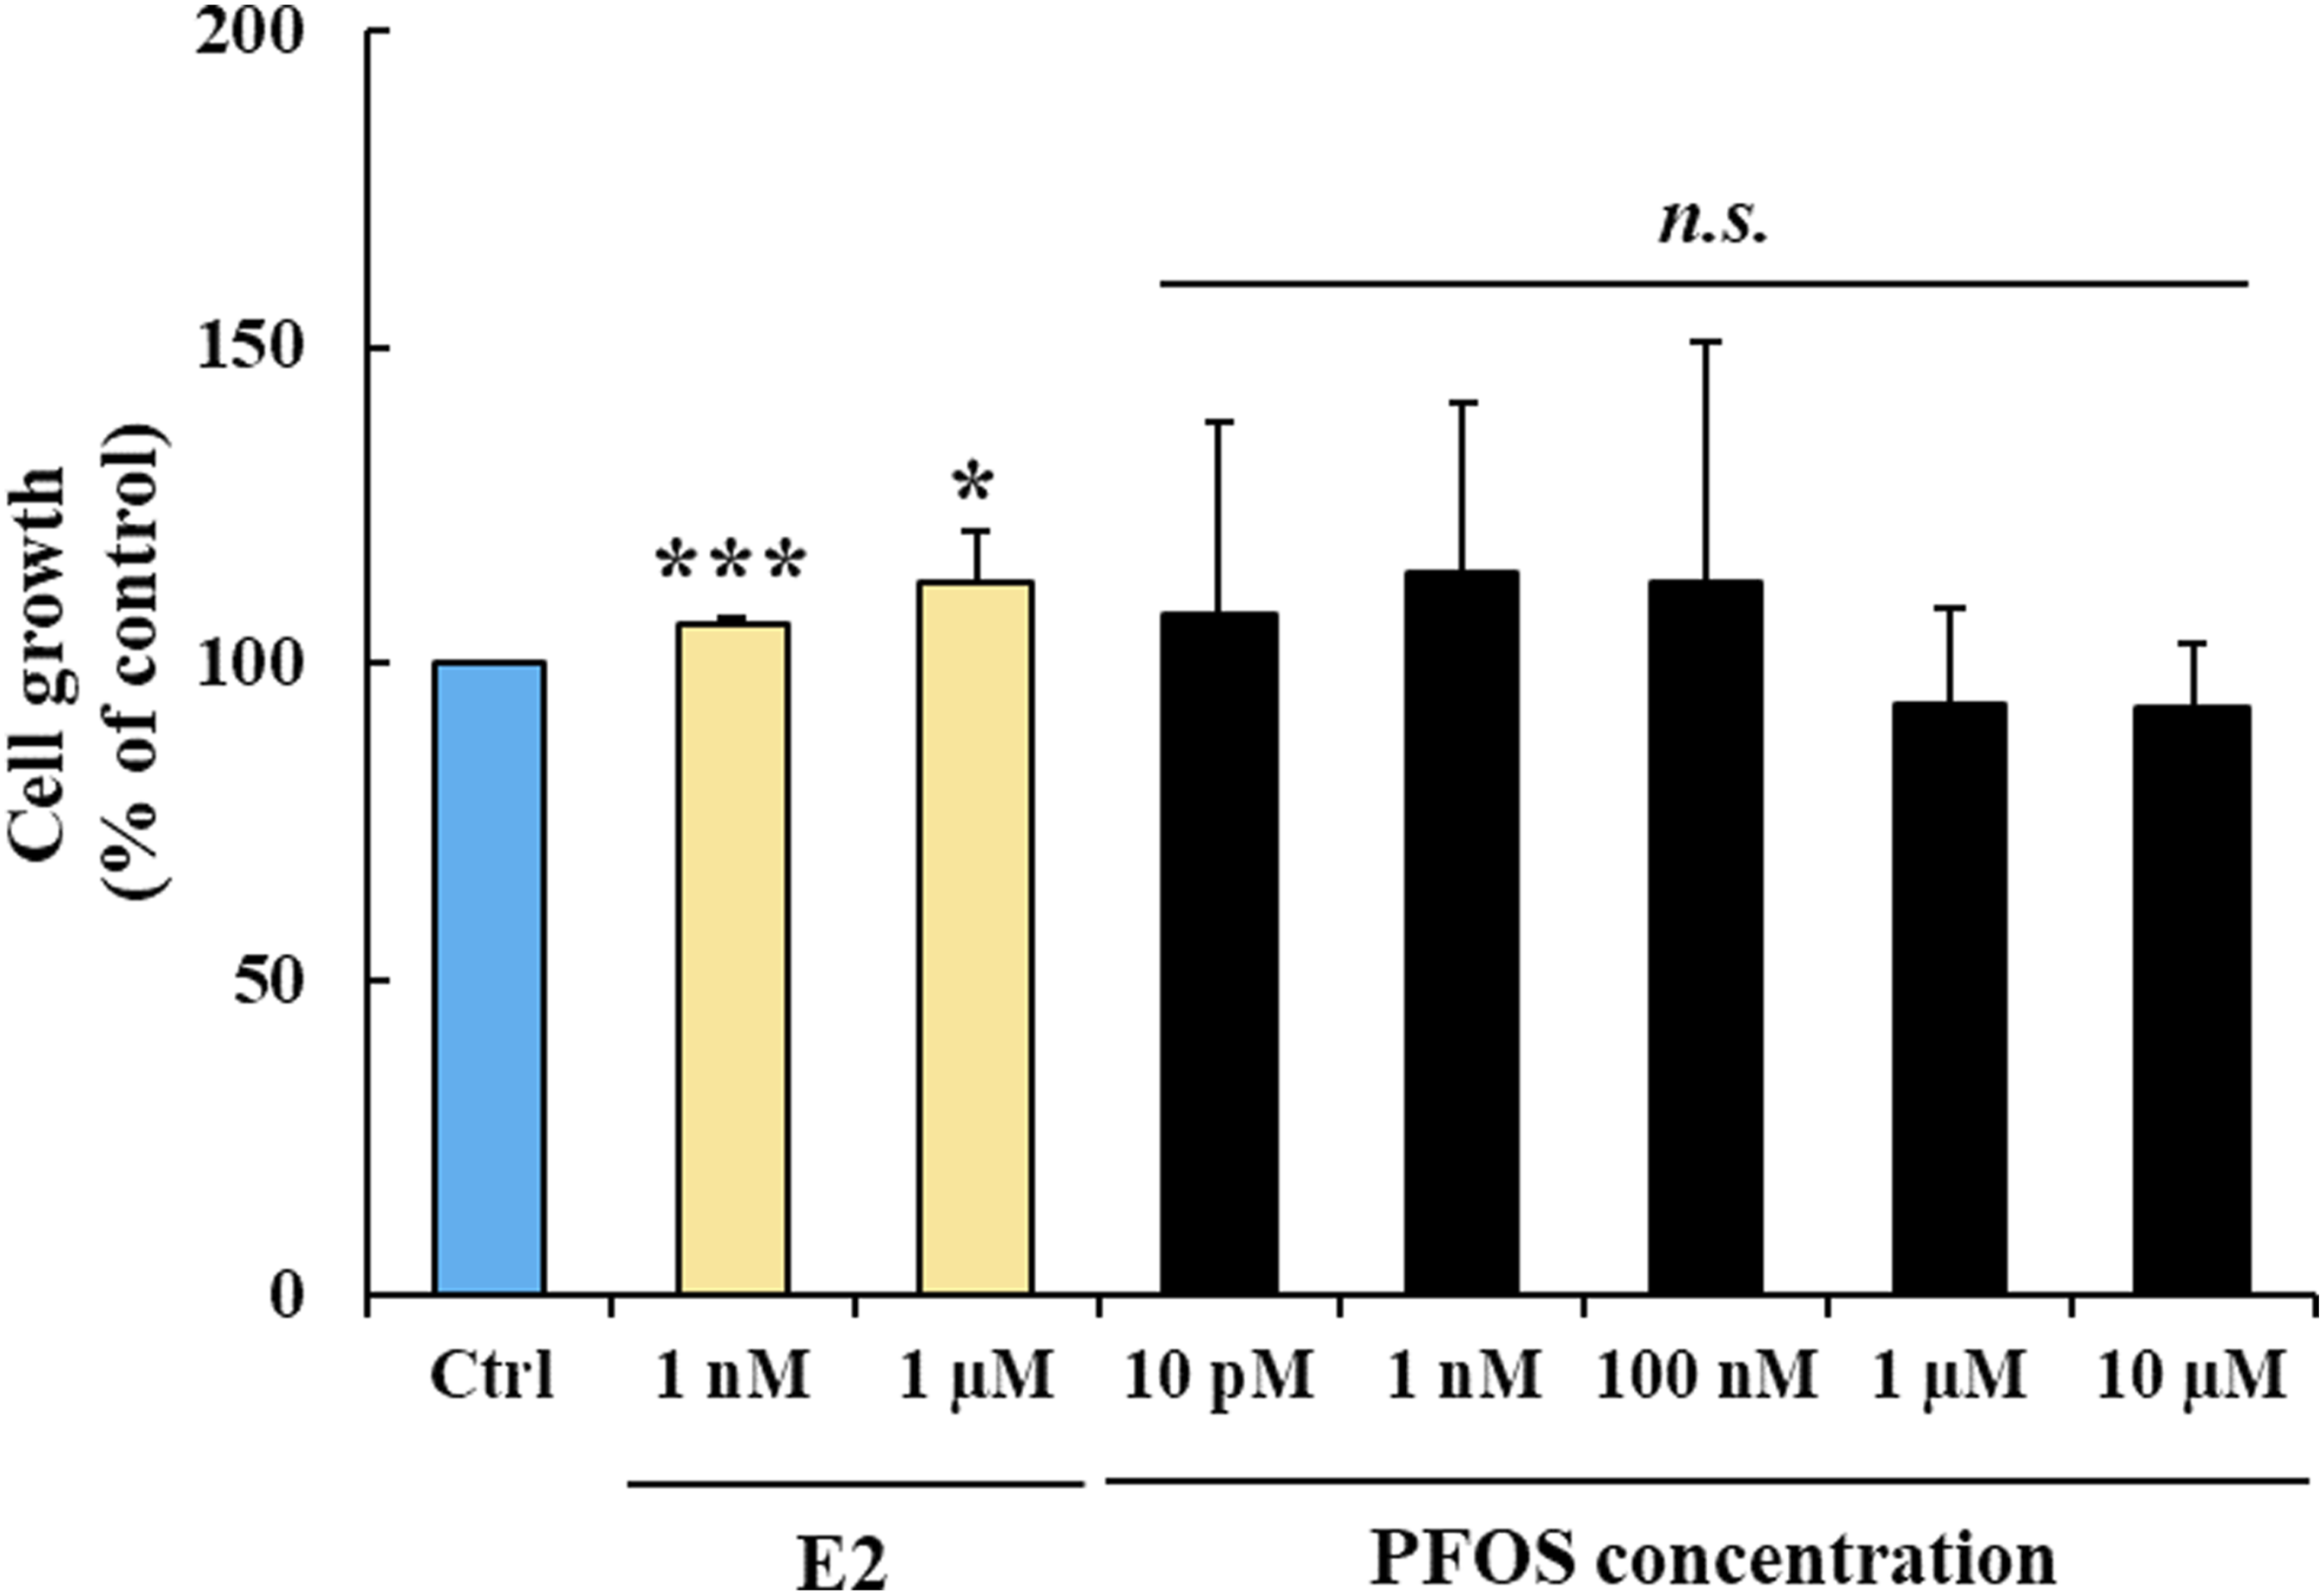
PFOS enhances invasion of FTC-133 cells
A concentration of PFOS at 1 nM (around 0.5 ng/ml) was selected for invasion study because this is a low concentration found in human serum. FTC-133 cells were treated with PFOS or E2 at 1 nM for 72 h before being subjected to the invasion assay. The results showed that PFOS significantly enhanced invasion of FTC-133 cells by 131% compared with control, similar to the effect of E2 that enhanced invasion by 125% (Figure 3). These results demonstrated that PFOS enhanced invasion even in the absence of growth stimulation in thyroid cancer cells. A similar effect was also observed in MCF-7 cells, where PFOS and E2 enhanced cell invasion by 144% and 183%, respectively (Supplemental Figure S2). Effect of PFOS on invasion of FTC-133 cells. (a) Representative images of invading cells on Transwell filters. (b) Percent cell invasion. Data are presented as mean ± S.D. from three independent experiments. *p < 0.05 versus control.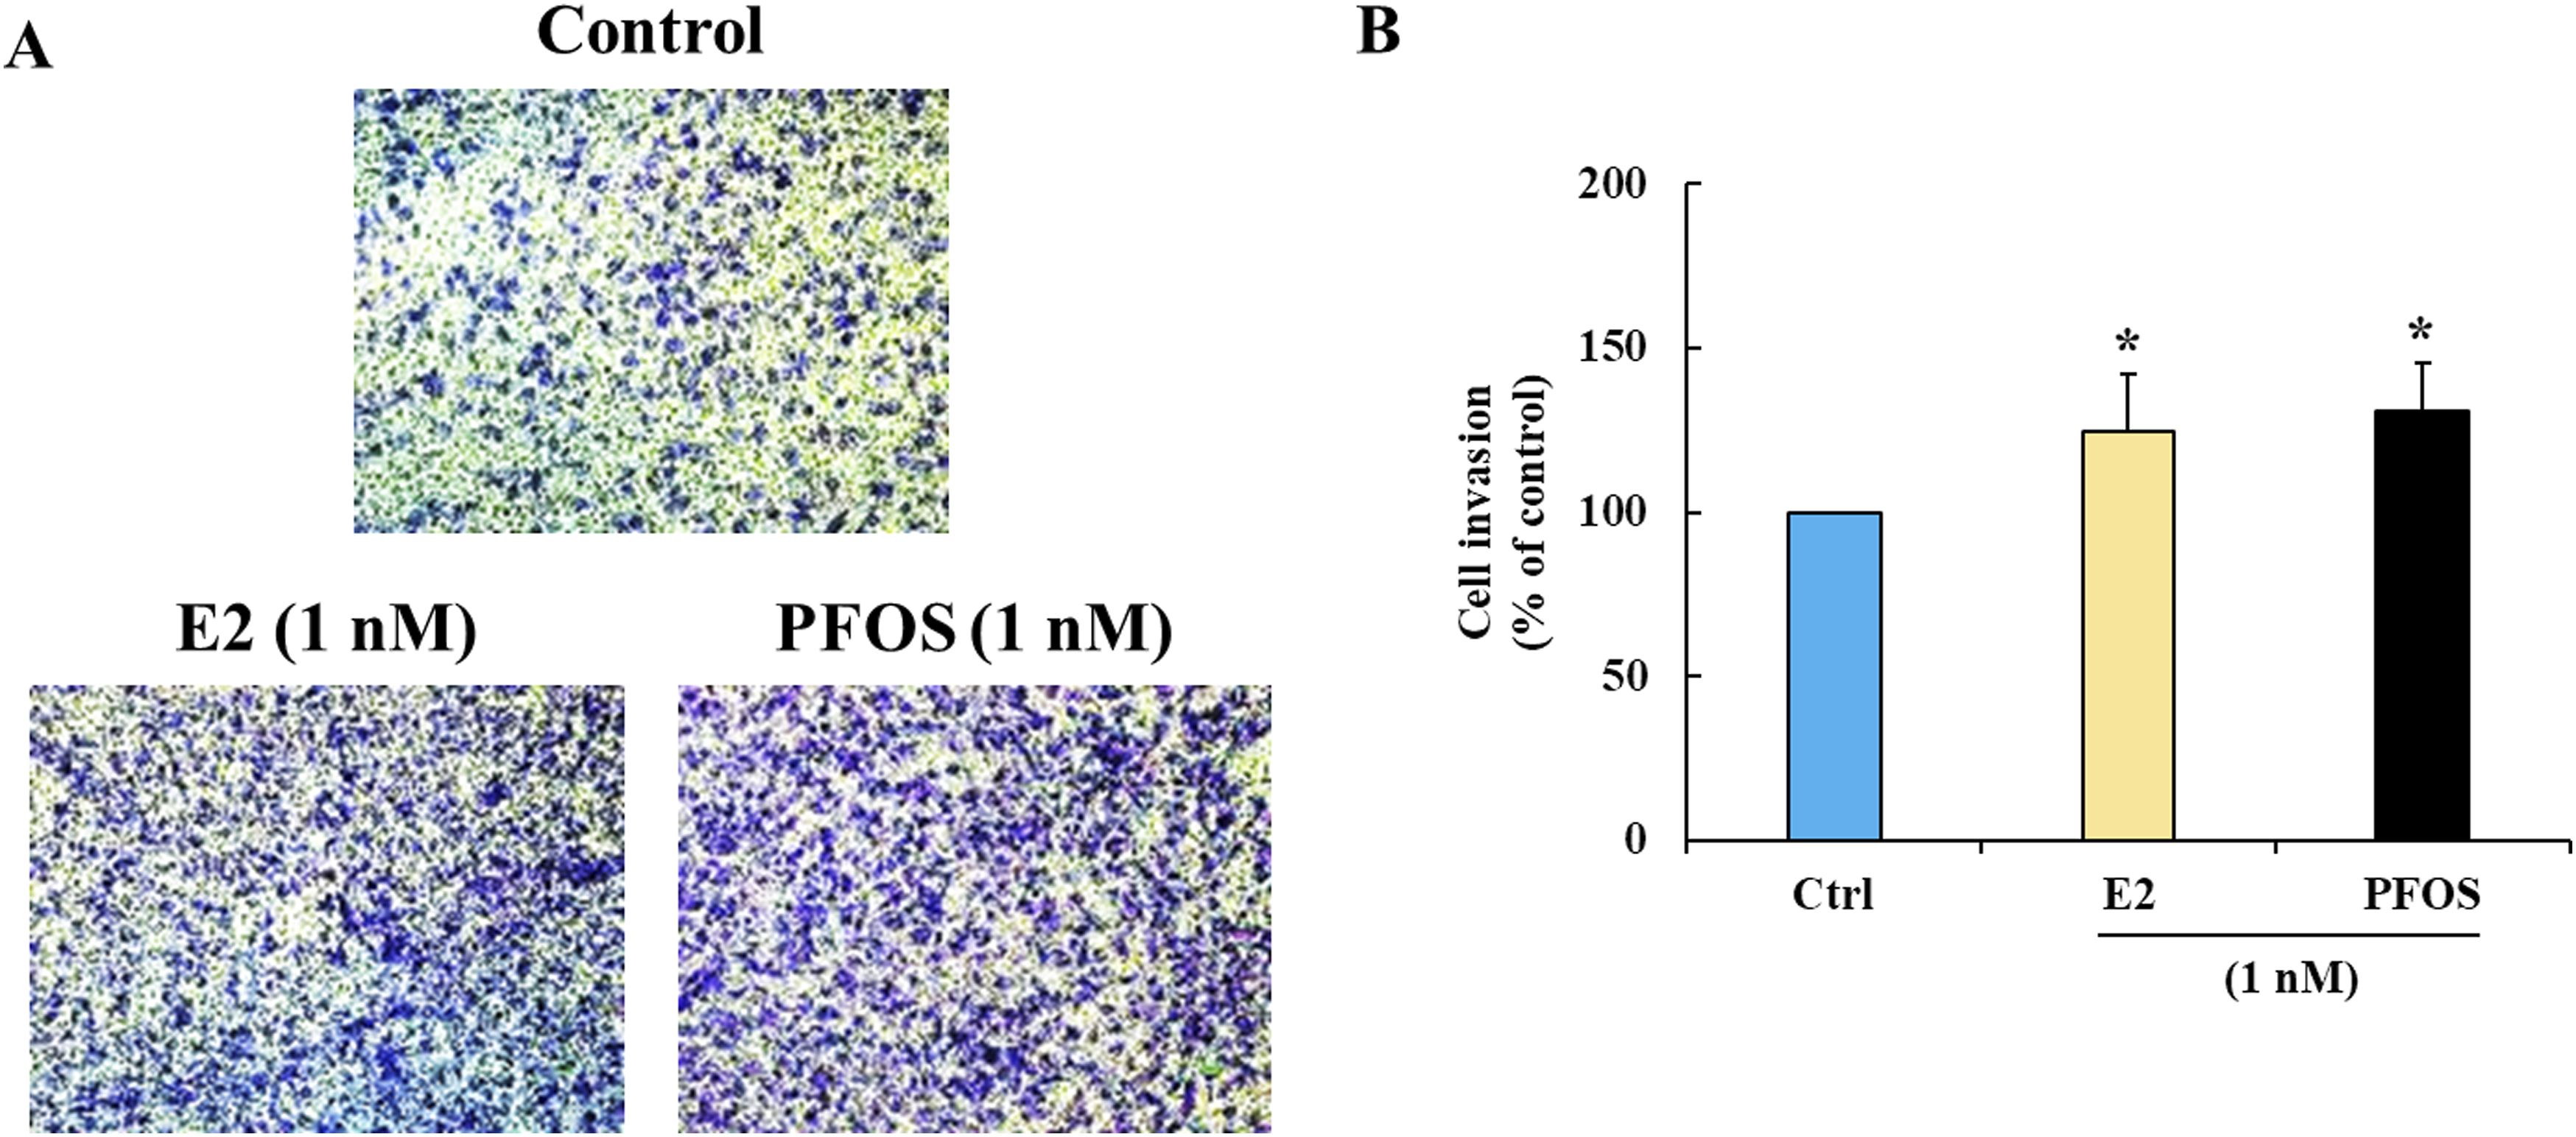
The invasion-promoting effect of PFOS in FTC-133 cells was not correlated with its estrogenic activity and ERs expression, suggesting that ERs may not be mediators of the invasion-promoting effect of PFOS in thyroid cancer cells, but the effect may occur through another mechanism instead of ER signaling.
PFOS increases activation of invasion-related signaling proteins in FTC-133 cells
We further explored the effect of PFOS on invasion-related signaling pathways, including Akt, ERK, and EphA2. FTC-133 cells were exposed to 1 nM of PFOS or E2 for 72 h. Activation of Akt, ERK, and EphA2 signaling proteins was determined by detecting their site-specific phosphorylation, as follows: Akt (Ser473), ERK (Thr202/Tyr204), and EphA2 (Ser897). The results revealed that PFOS increased phosphorylation of all selected signaling proteins, and EphA2 was the most affected signaling protein (Figure 4). PFOS seems to have a greater effect than E2, as phosphorylation of Akt, ERK, and EphA2 in PFOS-treated cells was significantly increased by 1.2-, 1.6-, and 2.3-fold, respectively, compared with control (Figure 4(b)). While E2 did not significantly increase Akt phosphorylation, ERK and EphA2 phosphorylation were increased by 1.3- and 1.9-fold, respectively (Figure 4(b)). Effect of PFOS on invasion-related signaling proteins in FTC-133 cells. (a) Representative blots of phosphorylated and total forms of signaling proteins. β-Actin was used as a loading control. (b) Fold change of normalized band intensities of signaling proteins. Data are presented as mean ± S.D. from three independent experiments. *p < 0.05 and **p < 0.01 versus control.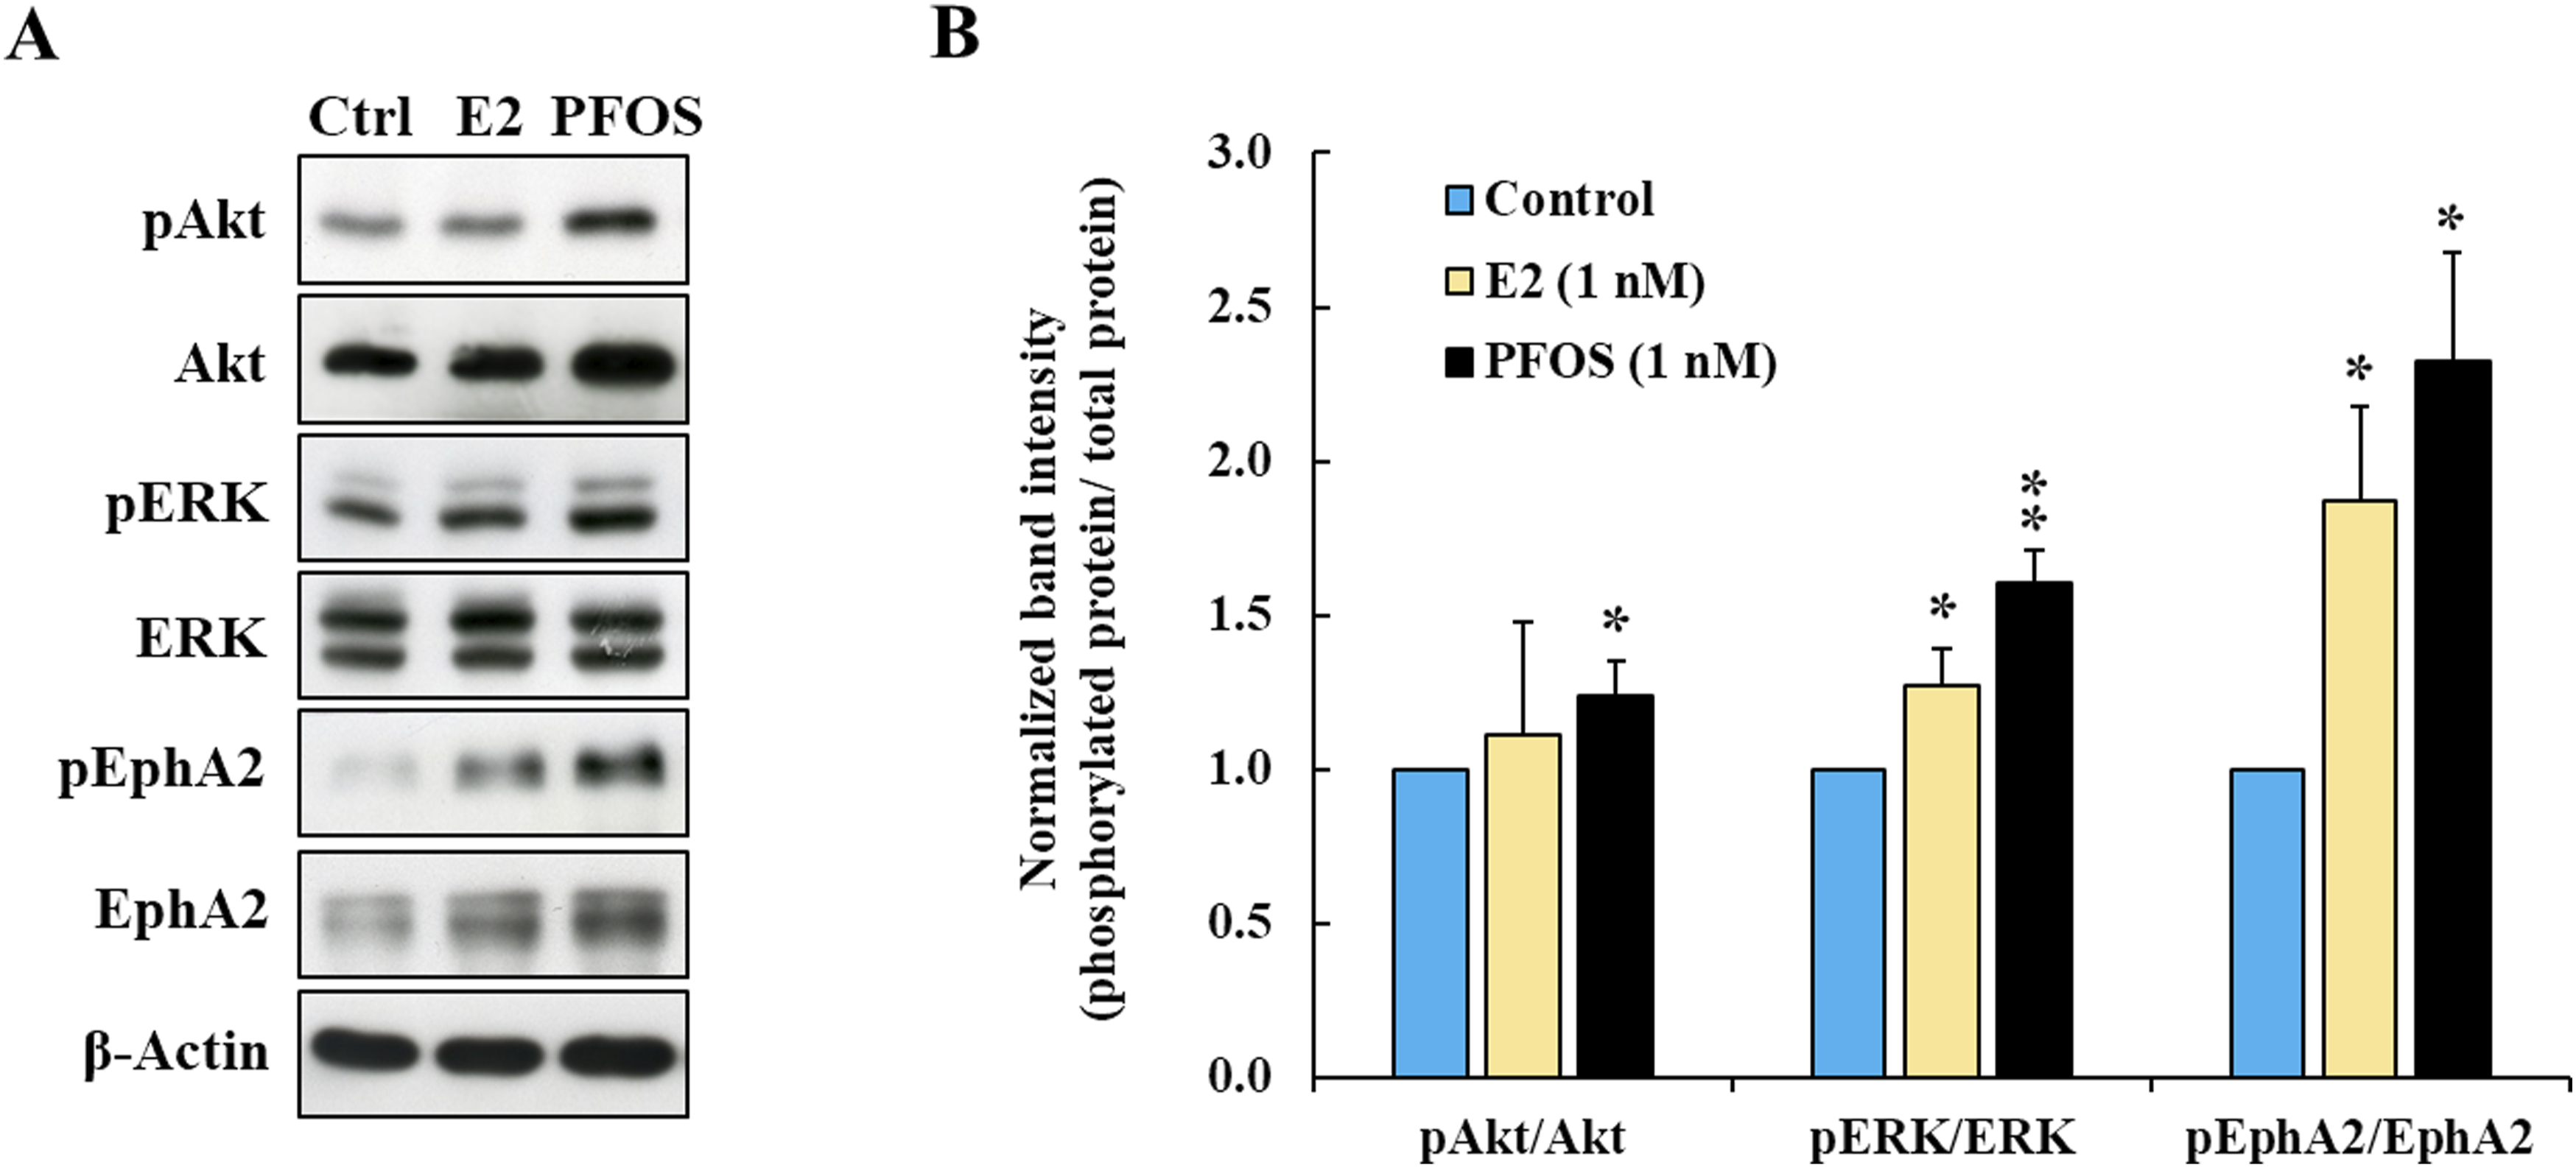
When considering the lack of growth stimulatory effect of PFOS and E2 in FTC-133 cells, we suggest that PFOS might enhance invasion of FTC cells by a mechanism that activates the invasion-related signaling proteins rather than using ERs-dependent mechanism.
Discussion
The concentration range of PFOS (0.01 nM to 10 µM) used in this study was designed to cover the lowest reported PFOS concentrations in serum (Melzer et al., 2010) and the highest reported PFOS concentration that could promote proliferation and invasion of human cells in vitro (Pierozan and Karlsson, 2018).
The estrogenic activity of PFOS is controversial. PFOS (1 nM to 1 mM) did not display estrogenic activity in a yeast two-hybrid assay of human ERα and ERβ (Ishibashi et al., 2007). In human cell studies, PFOS (200 nM to 50 μM) did not enhance MCF-7 cell growth or increase expression of estrogen-responsive genes (Maras et al., 2006). Additionally, PFOS (0.1 nM to 10 μM) did not activate reporter gene nor increase growth in T47-D breast cancer cells carrying an ERE-luciferase reporter (Sonthithai et al., 2016). While the estrogenic activity of PFOS was observed at concentrations greater than 10 μM in MCF-7 cells harboring an ERE-luciferase reporter (MVLN cell line), the estrogenic activity of PFOS was approximately 80,000- to 600,000-fold weaker than that of E2 (Kjeldsen and Bonefeld-Jørgensen, 2013; Li et al., 2020). A study using HEK-239T human embryonic kidney cells also showed the weak estrogenic activity of PFOS (1 nM to 1 μM) when compared with E2, and in addition, PFOS showed weak binding affinity to ERα (Benninghoff et al., 2011).
Collective evidence indicates that estrogenic activity of PFOS is very weak when compared with E2. Furthermore, the concentration of PFOS that exhibited estrogenic activity in MCF-7 cells was greater than 10 μM, which is greater than the concentration range of PFOS (10 pM to 10 µM) used in our study. When considering the stimulatory effect on cell growth, both MCF-7 and T47-D cell lines did not display growth response to PFOS at concentrations less than 50 μM (Maras et al., 2006; Sonthithai et al., 2016). Our results were consistent with a previous report showing that PFOS (0.1 nM to 10 µM) did not induce growth of a hormone-dependent human breast cancer cell line T47D (Sonthithai et al., 2016). In our study, a single band of ERα protein (66 kDa) and multiple bands of GPR30 protein (43-50 kDa) were detected in both FTC-133 and MCF-7 cells. The molecular weight of ERα is 66 kDa, while the estimated size of GPR30 is 42 kDa, but various sizes can be detected due to protein glycosylation (Jala et al., 2012). Notably, FTC-133 cells expressed lower levels of both ERα and GPR30 compared with MCF-7 cells. Therefore, the absence of growth stimulation by PFOS in FTC-133 cells is likely due to the weak estrogenic activity of PFOS and the low ERs expression in this cell line.
The invasion-promoting effect of PFOS has been observed in several cell types. A 24 h exposure to PFOS (10 nM) promoted invasion of esophageal squamous cell carcinoma (ESCC) cell lines, without growth stimulation (Liu et al., 2022). In a recent report, a 48-h treatment of PFOS (5 μM) markedly increased cell migration, which is a part of the cancer invasion process, but only slightly stimulated growth of HCT116 colorectal cancer cells (Li et al., 2024). Taken together, these studies indicated that the invasion-promoting effect of PFOS is not always coupled with growth stimulation, consistent with our results observed in FTC-133 cells. Future studies employing ERE reporter gene assays or co-treatment with ER antagonists would be beneficial to further confirm the ER-independent mechanisms of PFOS-promoted invasion.
The invasion-promoting effect of PFOS in ESCC cells and colorectal cancer cells was associated with induction of the epithelial-mesenchymal transition (EMT) process (Li et al., 2024; Liu et al., 2022). EMT is triggered by several signaling pathways, including receptor tyrosine kinases (RTKs) signaling, transforming growth factor-β (TGF-β) signaling, Notch signaling, and Wnt/β-catenin signaling (Moustakas and Heldin, 2007). In colorectal cancer cells, EMT induction by PFOS was associated with increasing Akt phosphorylation (Li et al., 2024), similar to the increased Akt phosphorylation in FTC-133 cells after PFOS exposure in our study. Increased ERK phosphorylation in PFOS-exposed FTC-133 cells might be a driver of invasion-promoting effect, as supported by evidence of the necessity of ERK activation for invasion enhancement in Trop2 oncogene-overexpressed thyroid cancer cells (Guan et al., 2017). Furthermore, ERK has been shown to be an upstream effect of EphA2 Ser897 phosphorylation in thyroid cancer cell lines harboring oncogenic driver mutations (Allocca et al., 2021). Therefore, the EphA2 phosphorylation in PFOS-treated FTC-133 cells might result from ERK activation. To our knowledge, we are the first group to report the effect of PFOS on EphA2 phosphorylation in cancer cells.
It is possible that PFOS can interact with other proteins that further activate invasion-related signaling proteins. This hypothesis is supported by a recent study revealing that PFOS stimulated growth of granulosa tumor spheroids by activating insulin-like growth factor-1 receptor (IGF-1R), not ERs (Gogola et al., 2019). Akt and ERK activation are downstream of IGF-1R and lead to EMT induction (Cevenini et al., 2018). Additionally, IGF-1R activation in thyroid cancer cells induced EMT and enhanced invasion of the cells through the Akt signaling pathway (Lv et al., 2021). Thus, IGF-1R activation might be a possible mechanism underlying the invasion-promoting effect of PFOS in FTC-133 thyroid cancer cells in our study.
In the present study, the invasion-promoting effect of PFOS was demonstrated at concentration as low as 1 nM, which falls within the concentration ranges of PFOS detected in human sera (0.3-869.8 nM) (Melzer et al., 2010). A recent study reported a positive association between increasing serum PFOS levels and lymph node metastasis in colorectal cancer patients with a median serum PFOS concentration of 7.2 ng/ml (14.4 nM) (Cui et al., 2024). However, there is no evidence linking serum PFOS levels to thyroid cancer metastasis. In further studies, it might be necessary to perform in vivo metastasis experiments to validate the promoting effect of PFOS on thyroid cancer metastatic progression.
Our report reveals mechanistic insights into the invasion-promoting effect of PFOS in thyroid cancer cells. This study is limited to in vitro cellular models that do not fully replicate the complexity of the tumor microenvironment and metastatic process in humans. Therefore, further investigations using animal models and epidemiological studies are essential to evaluate the potential role of PFOS exposure as a contributing factor in thyroid cancer metastatic progression, which might eventually inform future risk assessment and public health regulations.
Supplemental material
Supplemental Material - Perfluorooctane sulfonate (PFOS) increases metastatic potential of thyroid cancer cells in correlation with activation of multiple invasion-related signaling proteins
Supplemental Material for Perfluorooctane sulfonate (PFOS) increases metastatic potential of thyroid cancer cells in correlation with activation of multiple invasion-related signaling proteins by Phichamon Phetchahwang, N. Monique Paricharttanakul, Kriengsak Lirdprapamongkol, and Jisnuson Svasti in Toxicology and Industrial Health
Footnotes
Acknowledgements
The authors would like to thank Dr Tawit Suriyo for valuable suggestions and kindly providing chemicals. Special thanks are given to Dr Pipob Saejia, Dr Kittirat Saharat, Dr Sasivimon Pramual, and Phreeranat Montatip for their technical support.
Funding
The authors disclosed receipt of the following financial support for the research, authorship, and/or publication of this article: This study was support by Thailand Science Research and Innovation (TSRI), Chulabhorn Research Institute (Grant Nos. 2536704/42293 and 53498/4821838), and Center of Excellence on Environmental Health and Toxicology (EHT), OPS, Ministry of Higher Education, Science, Research and Innovation.
Declaration of conflicting interests
The authors declared no potential conflicts of interest with respect to the research, authorship, and/or publication of this article.
Data Availability Statement
Data will be made available upon reasonable request.
Supplemental material
Supplemental material for this article is available online.
References
Supplementary Material
Please find the following supplemental material available below.
For Open Access articles published under a Creative Commons License, all supplemental material carries the same license as the article it is associated with.
For non-Open Access articles published, all supplemental material carries a non-exclusive license, and permission requests for re-use of supplemental material or any part of supplemental material shall be sent directly to the copyright owner as specified in the copyright notice associated with the article.