
Abstract
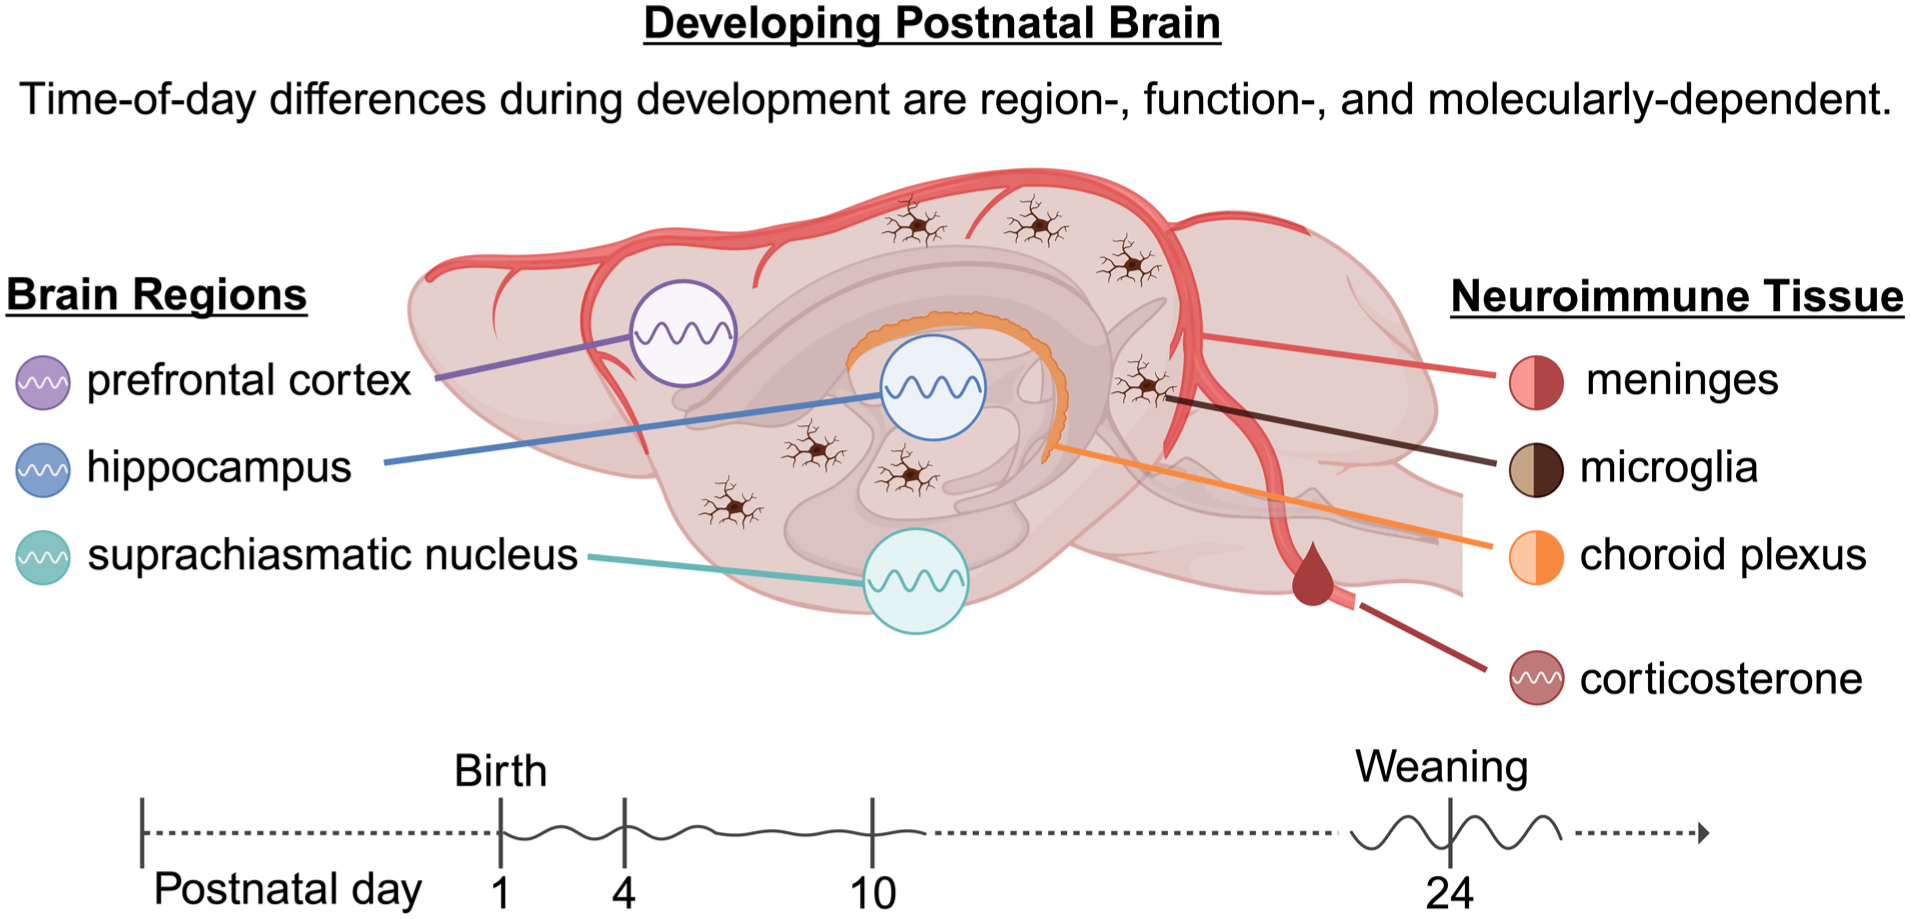
The circadian system coordinates daily physiology across nearly all tissues to temporally organize metabolism and maintain homeostasis. In the brain, circadian timing regulates neural activity, cellular function, and neuroimmune signaling, which is especially important during development. Yet, the ontogeny of circadian regulation during neurodevelopment remains poorly defined. Here, we characterized time-of-day variation in core clock and neuroimmune genes across multiple brain structures during early postnatal development, alongside circulating corticosterone concentrations. Using male and female C57BL mice housed in a standard light-dark cycle [12:12 light (150 lux)/dark (0 lux)], we measured the expression of Per1, Per2, and Rev-erbα in the suprachiasmatic nucleus, hippocampus, and medial prefrontal cortex, as well as in neuroimmune tissues (choroid plexus, meninges, and isolated microglia) across postnatal days (PND) 1-24. Across development, rhythms were seen in corticosterone concentrations and all brain regions, with increased amplitudes and gene-specific phase maturation toward adult-like timing by PND 24. Notably, the choroid plexus and meninges exhibited time-of-day differences in clock gene expression by PND 10-24. In contrast, isolated microglia did not display detectable time-of-day differences in clock gene expression; however, microglial phagocytic activity varied by time of day. Together, these findings demonstrate that circadian regulation of the brain emerges during the neonatal period, and the parameters of time-of-day differences are tissue- and gene-specific during development. In addition, functional rhythms may precede or occur independent of detectable transcriptional differences. This work establishes a developmental framework for circadian-neuroimmune interactions, with important implications for neuroimmune development and vulnerability. Given the neuroimmune system’s role in shaping brain development, disruptions in these temporal processes may contribute to neurodevelopmental or mood disorders.
Keywords
Although the brain’s major developmental milestones (e.g., neural tube formation, neurogenesis, synaptogenesis, neuroimmune development, etc.) are well described on a broad timescale (Reemst et al., 2016; Bilbo and Schwarz, 2012; Chen et al., 2017), far less is known about the finer-tuned timing mechanisms that coordinate and shape the brain. One important contributor to the temporal coordination of neurodevelopment is the circadian system. Across species, circadian rhythms coordinate ~24-h cycles of sleep-wake states, hormonal and metabolic signaling, and immune function (Scheiermann et al., 2013; Fonken and Nelson, 2023). These physiological oscillations provide time-of-day structure to the internal milieu and can influence core neurodevelopmental processes.
At the molecular level, circadian rhythmicity is created by a feedback loop of several core transcriptional factors: Bmal1, Clock, Per, and Cry. Every ~24 h, activator proteins BMAL1 and CLOCK heterodimerize and promote the expression of the repressor genes, Per and Cry. In turn, PER and CRY accumulate in the cytoplasm, heterodimerize, and translocate back to the nucleus to repress their own expression. BMAL1 protein abundance is further regulated by a secondary feedback loop involving the transcriptional repressor REV-ERB and the transcriptional activator ROR, both of which are also regulated by BMAL1. This auxiliary loop further stabilizes rhythms (reviewed by Partch et al., 2014). Furthermore, these circadian transcription factors control the expression of other genes known as clock-controlled genes throughout the body. Therefore, differential expression of core clock genes throughout the day generates rhythmic oscillations in clock-controlled genes, which confer daily rhythmicity in physiological functions in a tissue-specific manner.
In mammals, circadian rhythms are synchronized in the brain by a “primary” circadian pacemaker located in the suprachiasmatic nucleus (SCN) of the hypothalamus. The SCN develops during mid-gestation (Shimada and Nakamura, 1973; Kabrita and Davis, 2008; Shimogori et al., 2010; Reppert et al., 1988; Reppert and Schwartz, 1984a; Swaab et al., 1990) and subsequently matures into a network of oscillator cells that receive direct photic input from the retina (Morin and Allen, 2006). The SCN then synchronizes circadian outputs throughout the brain and periphery (Herzog et al., 2017), enabling daily rhythms even in the absence of external photic cues (Welsh et al., 2010). Evidence suggests that the fetal circadian clock can be entrained by maternal signals (Bates and Herzog, 2020; Deguchi, 1975). After birth, maternal coupling is weakened, and the neonate must begin to establish independent circadian organization (reviewed in Sumova et al., 2012). Indeed, rhythmicity appears more robust in utero than during the early postnatal period (Sladek et al., 2025), likely reflecting progressive maturation of circadian rhythms and entrainment pathways. In humans, the photosensitive retinal cells are thought to be functional at or near birth, indicating that photic input can reach the SCN from the first postnatal day (PND; Rivkees, 2004). In altricial animal models, whose offspring are born with their eyes closed, light responsiveness develops shortly after birth, with the SCN showing its earliest responses to light even before eyelid opening (e.g., PND 4 in mice; Munoz Llamosas et al., 2000). In parallel, the circadian system is influenced by maternal signals, including behavioral entrainment (Ohta et al., 2003; Viswanathan, 1999) and endocrine cues such as glucocorticoids, melatonin, and dopamine (Astiz et al., 2020; Bates and Herzog, 2020; Kinane et al., 2023) through nursing (Aksu and Arslan, 2026). Over development, the relative contribution of maternal cues declines, and environmental cues become more salient (Sumova et al., 2012).
While the adult circadian system is well characterized, how and when circadian rhythms emerge across neurodevelopment remains poorly defined. This knowledge gap is consequential, as circadian disruption has been linked to neuroimmune dysfunction and increased risk for neurodevelopmental and neuropsychiatric disorders, including effects that may originate in early life (Bruni et al., 2025; Delorme et al., 2020; Palagini et al., 2019). One system likely to be especially sensitive to the developmental emergence of circadian regulation is the neuroimmune system, which is essential for supporting brain maturation. Coordinated activity among the brain’s resident innate immune cells (i.e., microglia), immune-active barrier tissues (including meninges, choroid plexus, and blood-brain barrier), and their signaling pathways are critical for neurodevelopment and homeostasis. Importantly, many neuroimmune components are regulated by the circadian system. For example, adult microglia show time-of-day variation in reactivity and phagocytic markers (e.g., Iba1 and CD68; Fonken et al., 2015; Fonken et al., 2016; Griffin et al., 2020), morphology (Barahona et al., 2022; Takayama et al., 2016), and functions (Fonken et al., 2015) such as synaptic pruning (Casano and Peri, 2015; Mosser et al., 2017; Perdiguero and Geissmann, 2016; Reemst et al., 2016; Thion and Garel, 2017). Similarly, choroid plexus epithelial cells exhibit intrinsic oscillations in core clock gene expression (Myung et al., 2018; Quintela et al., 2015, 2018; Yamaguchi et al., 2020) and may contribute to the regulation of neural stem cell behavior and neurogenesis (Redzic et al., 2005) by modulating cerebrospinal fluid dynamics across the day (Hablitz et al., 2020; Boespflug and Iliff, 2018). Although circadian rhythmicity in meningeal tissue remains undefined, leptomeningeal immune surveillance cells show circadian fluctuations (Barr et al., 2025). Together, these findings suggest that circadian signaling may shape early-life brain development. Overall, it remains unknown whether and when neuroimmune genes become rhythmic across brain regions and how rhythmicity in brain immune cells may regulate their functional roles in development.
To further the understanding of the developmental circadian regulation of the neuroimmune system, we characterized the emergence of diurnal oscillation in clock and neuroimmune genes across brain structures. Experiment 1 mapped the developmental emergence of clock gene rhythmicity across the SCN and 2 extra-SCN brain regions, the hippocampus and the medial prefrontal cortex (mPFC). Rhythmic expression of clock genes is detected in the hippocampus and the mPFC of adult animals (Otsuka et al., 2020); however, the early postnatal emergence of circadian rhythmicity remains unknown. Experiment 2 complemented this approach by focusing on neuroimmune and barrier-associated components (microglia, meninges, and choroid plexus), which are not well represented by bulk region punches due to cellular heterogeneity. Together, these experiments provide both a systems-level framework for the emergence of circadian gene expression in the developing brain and tissue-specific evidence that circadian regulation extends to neuroimmune interfaces.
Materials And Methods
Animals
All animal procedures were approved by The University of Texas at Austin Institutional Animal Care and Use Committee (IACUC) and conducted in accordance with local and national guidelines. Male and female C57BL/6J mice were ordered from The Jackson Laboratory and housed as 1:1 breeding pairs. A total of 136 pups from 24 litters were generated for experiment 1; 118 pups from 30 litters were generated for experiment 2. Mice were housed in a temperature-controlled room (21 ± 1 °C) maintained on a 12:12 light-dark cycle in cages containing corncob bedding with ad libitum access to standard laboratory chow and water. Pups were housed with mothers throughout the experiment.
Experimental Design
Experiment 1
To determine the postnatal emergence of rhythmic clock gene expression across the developing brain, pups were euthanized by rapid decapitation at PND 1 (day of birth), 4, 10, and 24 at zeitgeber time (ZT) 0, 6, 12, and 18 (ZT0 = lights on; ZT12 = lights off). The selected ages aimed to capture developmental transitions, including early neurocircuitry formation prior to eye opening (PND 4), emergence of photic responsiveness (PND 10; Landgraf et al., 2014), and relative maturation of circadian organization at the time of weaning (PND 24). These ages are also representative of critical developmental windows in both the stress system (Schmidt et al., 2003) and the brain (Semple et al., 2013), encompassing processes such as neurogenesis/gliogenesis, synaptogenesis, synaptic pruning, and glucocorticoid signaling (Schmidt et al., 2003; Reemst et al., 2016; Chen et al., 2017), all of which can influence circadian rhythmicity. Brain and trunk blood were collected, and blood was obtained within 90 sec of first cage disturbance. Brains were flash-frozen on dry ice. Serum was isolated by centrifugation and stored at −80 °C for corticosterone quantification. Each age × timepoint group included male and female pups from 2 to 4 litters.
Brains were sectioned at 100 μm thickness at −23 °C in a cryostat. Brain regions were identified using a mouse brain atlas (Paxinos and Franklin, 2001) and isolated by micropunch dissection. A 1.00-mm-diameter punching needle was used to collect tissue from the mPFC (anterior cingulate, prelimbic, and infralimbic area) and hippocampus; a 0.52-mm-diameter needle was used for the SCN. Punching needles and the cryostat were decontaminated with 100% ethanol and RNase AWAY (Thermo Scientific) before tissue punching and cleaned with 100% ethanol between each brain region.
Experiment 2
To evaluate clock gene expression in neuroimmune and barrier-associated tissues across developmental timepoints spanning the emergence of rhythmicity, pups at PND 10 and PND 24 were euthanized during the mid-light (ZT6) and the mid-dark (ZT18) phases. Choroid plexus was dissected from the lateral ventricles, and meninges were peeled from the skull cap; tissues were flash-frozen on dry ice. Microglia were isolated from whole brain following removal of the olfactory bulbs and cerebellum, as described in a subsequent section.
Corticosterone Concentration
Serum from trunk blood was isolated by centrifugation and stored at −80 °C until corticosterone quantification using a commercial enzyme-linked immunosorbent assay (ELISA) kit (Arbor Assays, limit of detection = 39.06 pg/mL, mean intra-assay Coefficient of Variability = 5.2%). Serum samples were diluted 1:100 in kit-supplied sample diluent, and corticosterone concentrations were determined in duplicate per manufacturer’s instructions. Corticosterone concentrations were above the limit of detection in all ages. Three outliers in serum samples were identified and excluded using Grubb’s test for outliers (2 from PND 1; 1 from PND 10).
Microglia Isolations
Microglia from whole brain, excluding the olfactory bulbs and cerebellum, were isolated via a Percoll density gradient method as previously described (Frank et al., 2006). Following rapid decapitation, brain tissue was homogenized in 3-mL 1X DPBS (Gibco, Life Technologies, Waltham, MA) using a sterile glass homogenizer. Homogenates were strained through a 40-μm filter (Falcon, Sigma) into a 50-mL tube and rinsed with an additional 2 mL of 1X DPBS. The resulting cell suspension was transferred to a sterile 5-mL tube and centrifuged at 1000 g for 10 min at 22 °C. Supernatant was poured off, and the pellet was resuspended in 5 mL of 70% isotonic Percoll (GE Healthcare, Lafayette, CO; isotonic Percoll is 10:1 Percoll with 10X PBS; 100% isotonic Percoll is then diluted with 1X DPBS), followed by a layer of 5 mL of 40% Percoll, and topped with 2 mL of DPBS, creating a Percoll density gradient. The gradient was centrifuged at 1200 g for 30 min at 22 °C with no acceleration or brake. Myelin debris was removed from the DPBS/70% interface. Microglia were then extracted from the 40/70% interface, washed with DPBS, and resuspended in filtered media [sterile low glucose Dulbecco’s Modified Eagle Medium (DMEM) (Gibco, 11885–084) with 10% FBS (Thermo Fisher Scientific, A5670701)]. Microglia concentration and viability were determined by trypan blue exclusion. Fifty thousand microglia cells were used for phagocytosis assay; remaining microglia were used for RNA extraction.
Microglia Phagocytosis
Microglial phagocytosis assay was adapted from Fonken et al. (2018). Microglia were plated at 50,000 cells per well in 8-well chambered culture slides (Falcon 354108) and incubated for 24 h at 37 °C and 5% CO2. Latex beads-rabbit IgG-FITC complex (1:100; Cayman Chemicals, 400291) were then added to each well and returned to the cell incubator for 30 min. Beads were removed by washing with the manufacturer’s phagocytosis buffer. Cells were fixed with 4% paraformaldehyde for 30 min at room temperature. For immunocytochemistry, slides were washed twice with PBS containing 0.2% Triton X-100 and incubated with rabbit anti-Iba1 (1:1000; Wako 019-19741) overnight at room temperature. The following day, slides were washed 3 times with PBS containing 0.2% Triton X-100 and then incubated with Alexa Fluor 568 goat anti-rabbit secondary antibody (1:500; ThermoFisher A11011) for 2 h at room temperature. Slides were washed 2 more times with PBS containing 0.2% Triton X-100, coverslipped with VECTASHIELD HardSet mounting medium containing DAPI (4’,6-diamidino-2-phenylindole, Vector Laboratories, H-1500-10), and imaged the following day at 20X using an Olympus FV3000 confocal microscope. For image capture and analysis, 20 fields per well were randomly selected. Phagocytosis was quantified as the percentage of Iba1 + cells containing FITC-leveled beads by a scorer blinded to experimental conditions.
RNA Extraction and cDNA Synthesis
RNA was extracted from isolated microglia cells and brain tissues (choroid plexus, meninges, mPFC, hippocampus, and SCN) using the TRIzol-chloroform method. Brain tissues were homogenized using a Tissue-Tearor homogenizer (BioSpec Product, Inc. Model 985370). Isolated microglia cells were homogenized using a Branson SFX150 Sonifier (Marshall Scientific). Depending on the size of the brain, region, and tissue, 0.3-2 μg of mRNA (normalized for each tissue) was reverse-transcribed into cDNA with SuperScript IV reverse transcriptase.
Gene expression was quantified using real-time quantitative polymerase chain reaction (RT-qPCR). Inventoried primers for TaqMan gene expression assays were purchased from Invitrogen Life Technologies. Relative expression of clock genes Per1 (Mm00501813_m1), Per2 (Mm00478099_m1), and Rev-erbα (Mm00520708_m1) and microglia markers Iba1 (Mm00479862_g1) and Cd68 (Mm03047343_m1) was calculated relative to the expression of the housekeeping gene β-Actin (Actb; Mm02619580_g1) using the ΔΔCt method as previously described (Chen et al., 2021). All the aforementioned genes were expressed before 34 cycles in all collected brain tissue. No time-of-day variation was detected in Actb expression, and it was used as the housekeeping gene in all analyses. (18s (Mm04277571_s1) was also assessed but exhibited time-of-day differences in expression, so it was not selected for normalization.) Relative expression of clock and neuroimmune genes was normalized to ZT0 within each age group when 4 times of day were taken. Otherwise, relative gene expression was normalized to the earliest time when lights were on ZT6. Each sample was run in duplicate reactions.
Statistics
Data were analyzed using GraphPad Prism 9, with statistical significance set at p < 0.05. To assess rhythmicity, each dataset was fit using a nonlinear least-squares regression (cosinor fitting) and a linear regression model, and model fits were compared to determine whether normalized expression levels exhibited significant rhythmicity (Cornelissen, 2014; Halberg et al., 1967). Rhythms were calculated using the cosinor fitting analysis according to the following equation:

where Y = relative gene expression level at a given ZT, μ = MESOR (rhythm adjusted mean, an estimate of central tendency), A = amplitude (half of the difference between the minimum and maximum), ZT = time in hours, φ = acrophase (the time at which the peak of a rhythm occurs), and period (the duration of time to complete 1 cycle) = 24 h.
To validate rhythmicity findings obtained using the cosinor analysis, we additionally applied a nonparametric rhythmicity-detection approach using the “meta2d()” function from the R package “MetaCycle” (Wu et al., 2015, 2016), as well as a one-way analysis of variance (ANOVA) as recommended by the package authors for complementary assessment of time-dependent variation (Wu et al., 2026). Because MetaCycle recommends 6-8 time points, and because animals were not all collected within a single continuous 24-h sampling window, animals were pseudo-randomly assigned across 2 consecutive 24-h cycles for analysis (e.g., ZT0 or ZT24; ZT6 or ZT30; ZT12 or ZT36; ZT18 or ZT42) to increase temporal coverage without any duplication. Significance was determined using Benjamini-Hochberg corrected q-values (q < 0.05). Results from one-way ANOVA, MetaCycle, and Cosinor-derived rhythmicity were compared (Supplemental Table 1). Compared with Cosinor analysis, MetaCycle detected an overall greater number of rhythmic features across all endpoints assessed, reflecting differences in methodological sensitivity and underlying model assumptions. To minimize potential inflation of rhythmic findings in the context of limited temporal sampling, we prioritized interpretation of the more conservative Cosinor-based results.
When only 2 times of day were compared, group differences were assessed using an unpaired Student’s t test, Welch’s t-test, or Mann-Whitney U test, as appropriate based on normality and homogeneity of variance. Data are presented as mean ± SEM. Outliers were identified and excluded using Grubb’s test for outliers.
Results
Experiment 1
Clock and Neuroimmune Gene Oscillations in the Postnatal SCN
We evaluated the expression of core circadian clock genes at 4 different time points in the SCN (Figure 1a and 1b; Table 1). At PND 1, mRNA expression of Per1 displayed low amplitude but detectable 24-h oscillation (F(1, 32) = 4.37, p = 0.046; A = 0.12). Per1 rhythm at PND 4 had a similarly low amplitude rhythm (F(1, 26) = 4.80, p = 0.038; A = 0.20) but was phase-delayed (φ = 18.5) compared to PND 1 (φ = 11.7; Figure 4). The amplitude of the Per1 rhythm increased by PND 24 (F(1, 28) = 6.86, p = 0.014; A = 0.37) while the acrophase (φ = 12.54) remained similar to PND 1. Rhythmic expression in Rev-erbα and Per2 mRNA in the SCN was detectable only at PND 24.
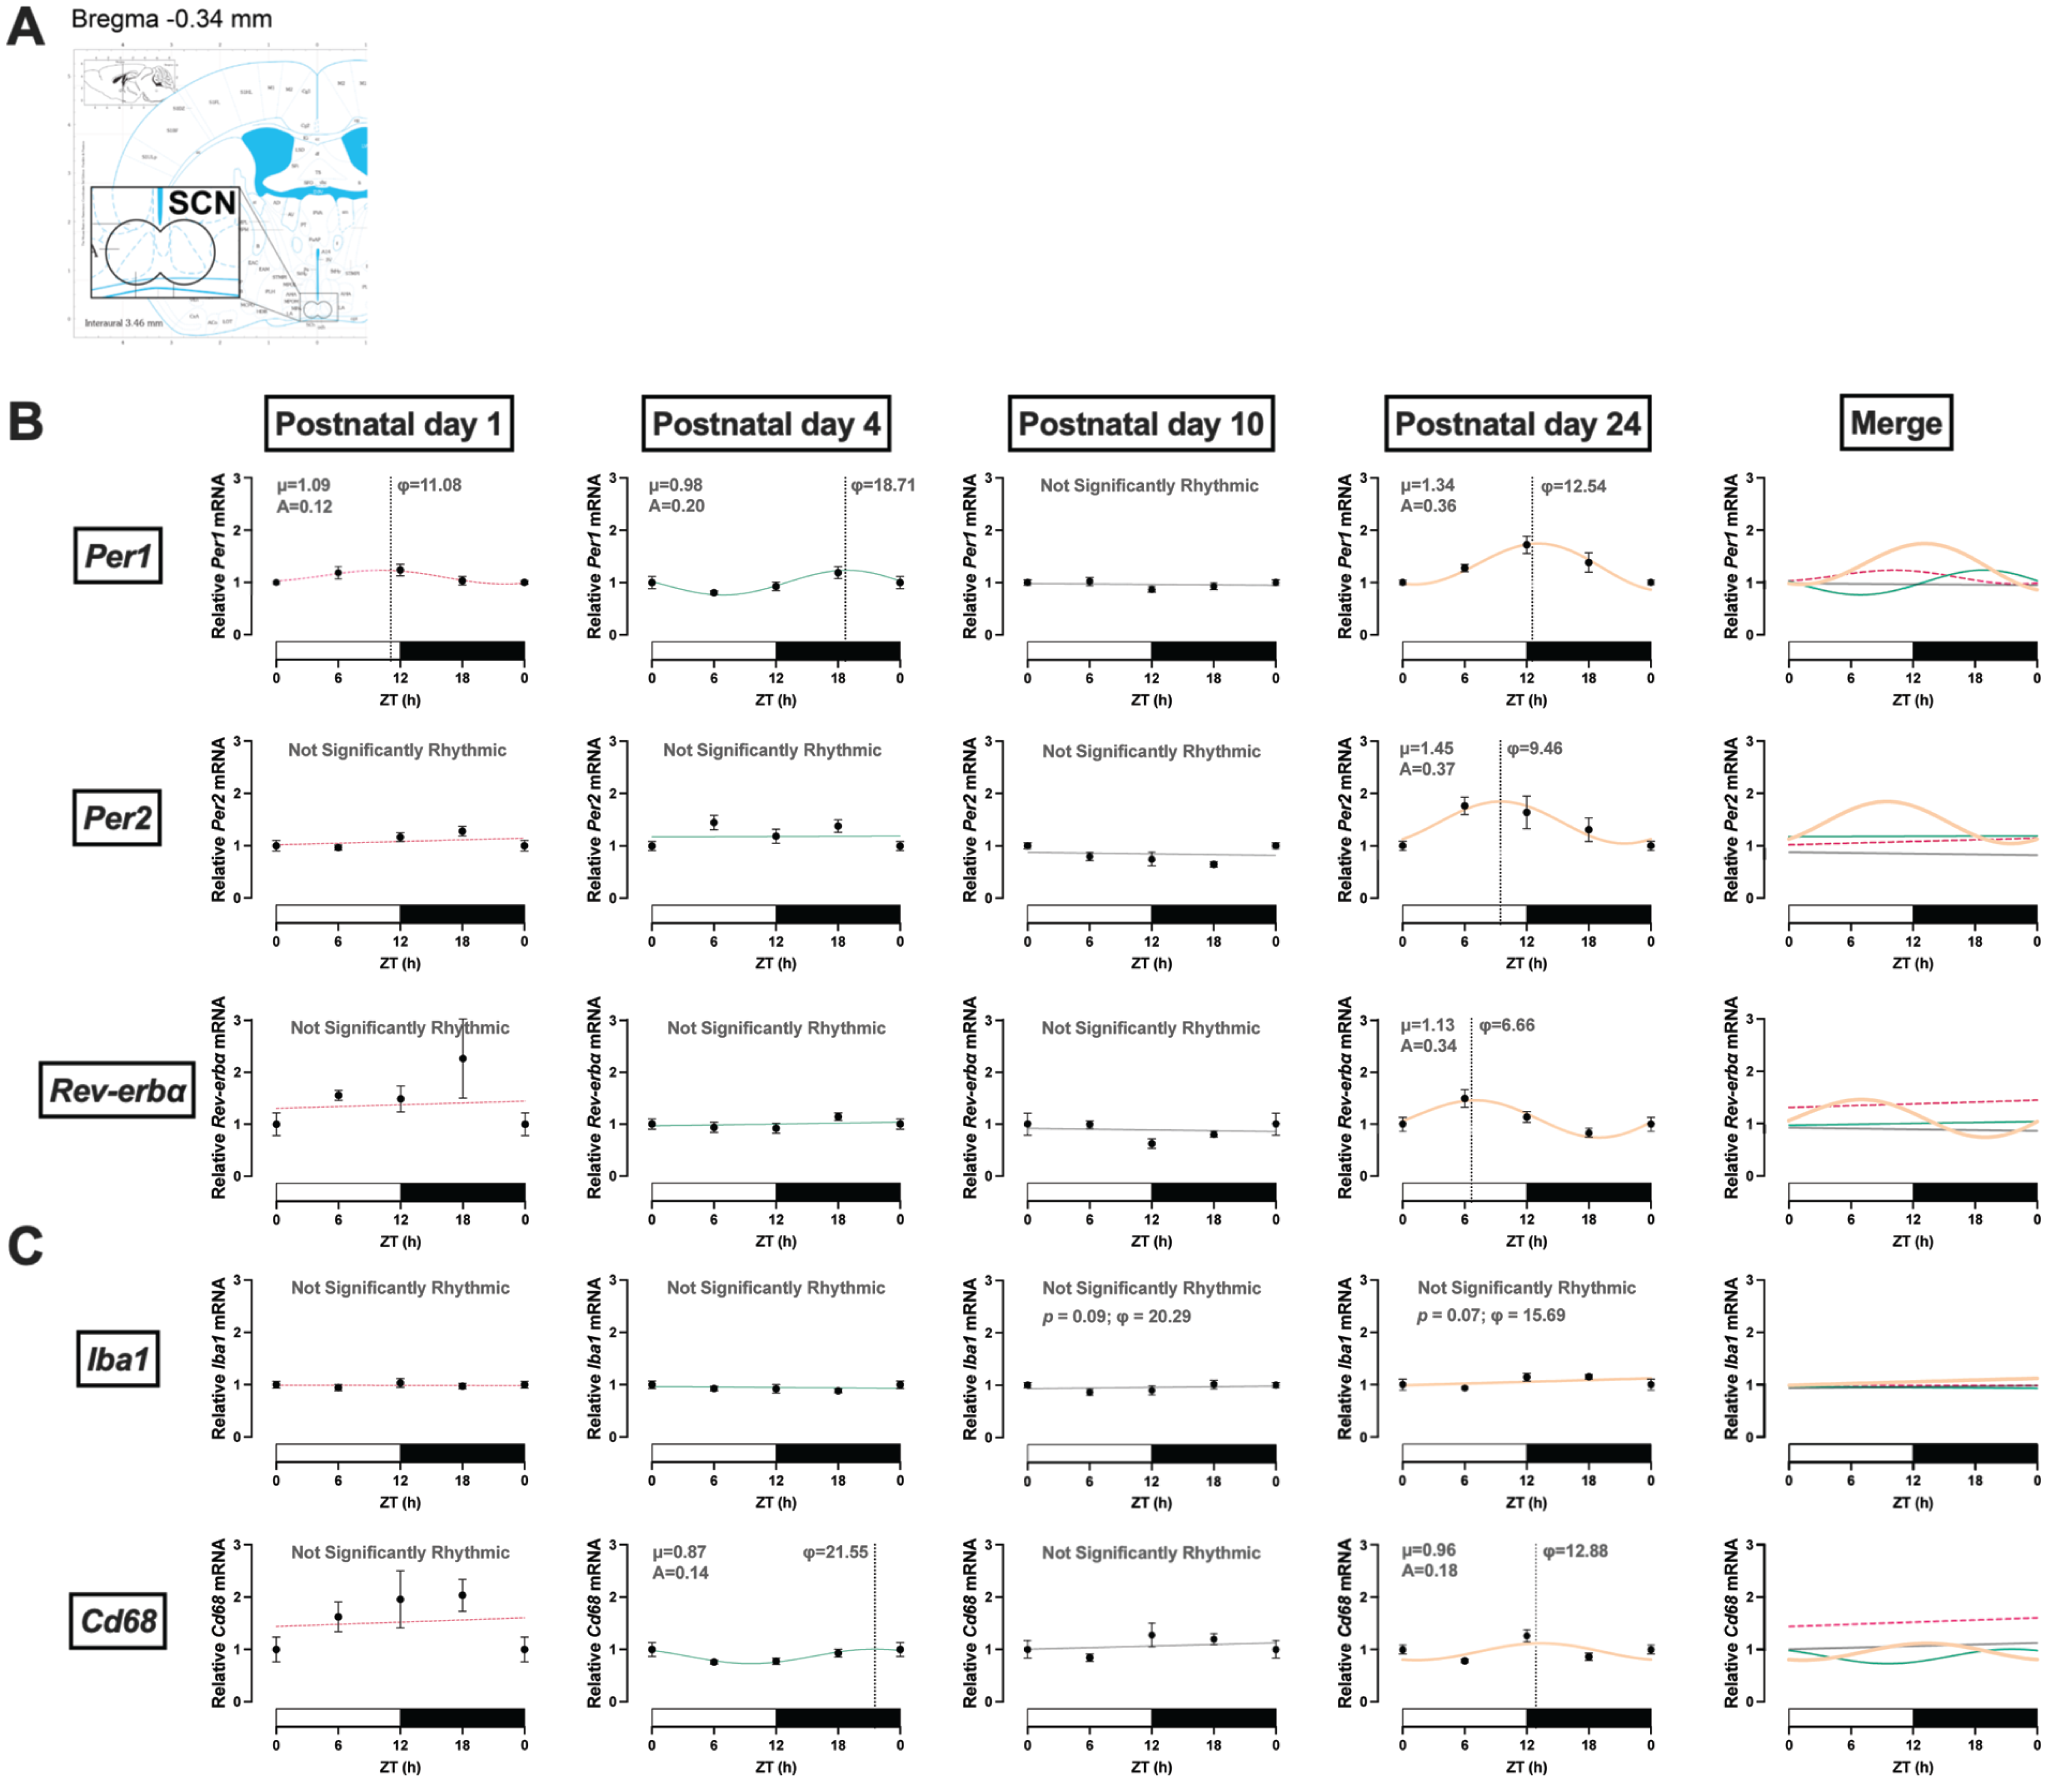
Rhythmic expression in clock genes in the suprachiasmatic nucleus (SCN). (a) Coordinates of SCN in mouse brain atlas. (b) Clock genes. Per1 mRNA displayed rhythmic expression starting at PND 1, while Per2 and Rev-erbα mRNA did not appear rhythmic until PND 24. (c) Microglia genes. Iba1 mRNA expression did not appear rhythmic. Cd68 mRNA displayed rhythmic expression at PND 4. ZT: zeitgeber time in hours; φ: acrophase, time of peak expression (dotted line); μ: MESOR, central tendency; A: amplitude of a rhythm. PND 1 is dotted pink, PND 4 is teal, PND 10 is gray, and PND 24 is orange. White and black bars on the x-axis represent the light and dark phases, respectively. Significance level was set at p < 0.05; p > 0.05 line fitting preferred. Data presented as mean ± SEM. ZT24 is repeated ZT0 data for better graphic display.
Statistical cosinor analysis of the rhythmic expresion of clock gene and microglial markers in the suprachiasmatic nucleus.
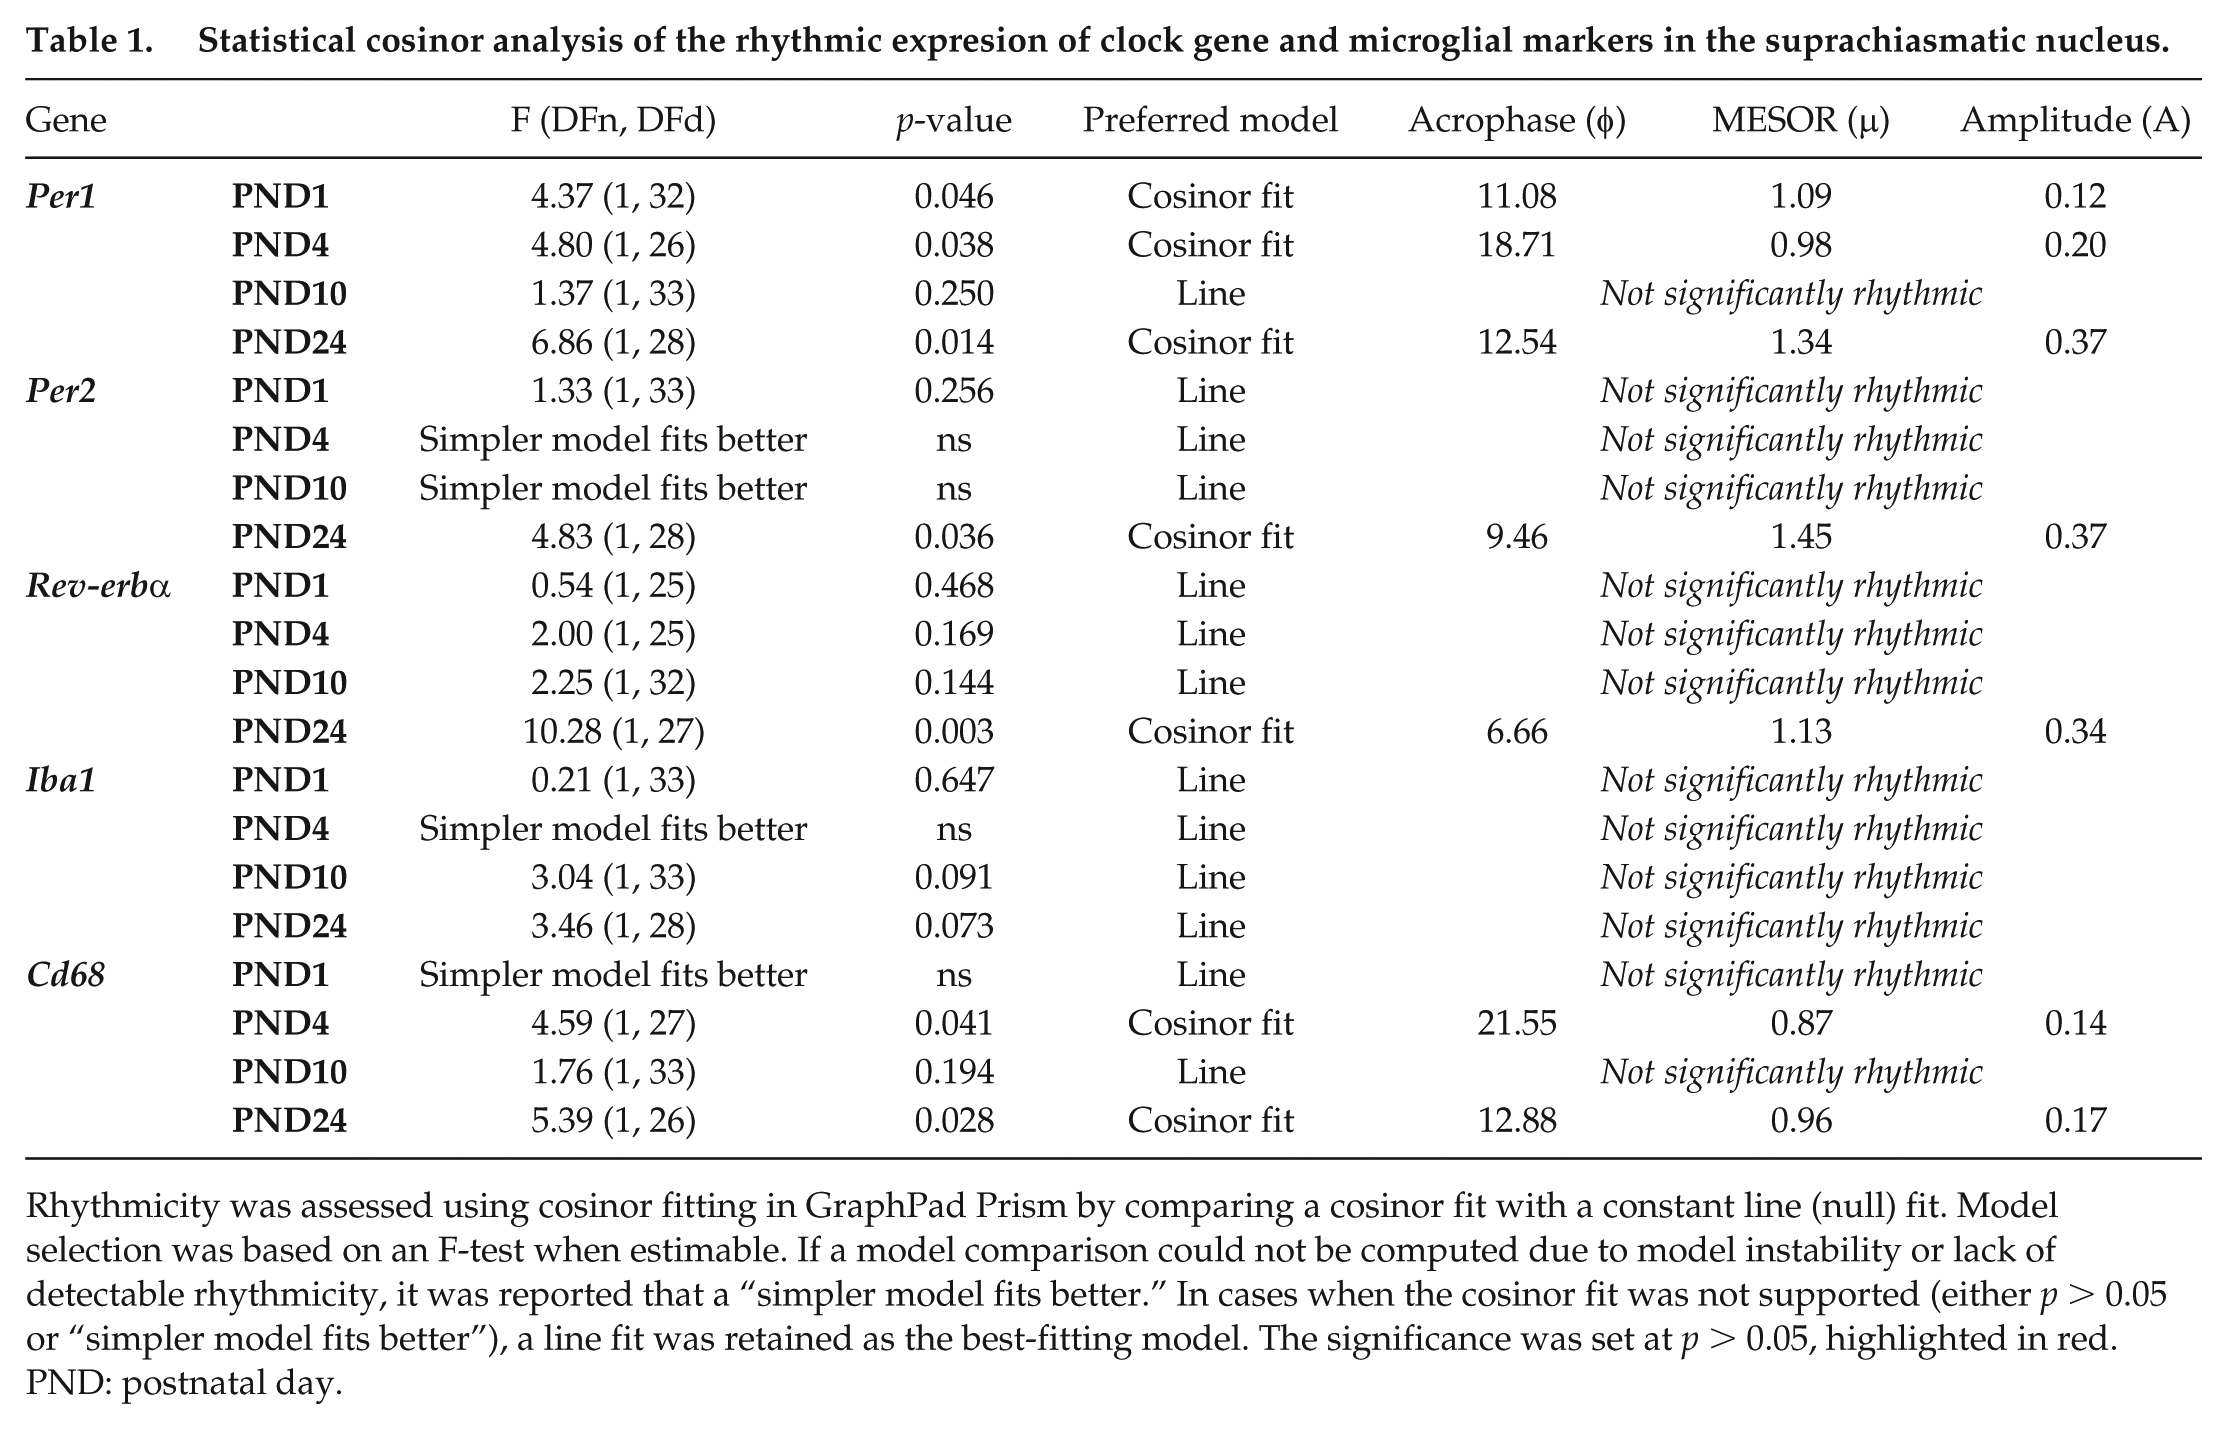
Rhythmicity was assessed using cosinor fitting in GraphPad Prism by comparing a cosinor fit with a constant line (null) fit. Model selection was based on an F-test when estimable. If a model comparison could not be computed due to model instability or lack of detectable rhythmicity, it was reported that a “simpler model fits better.” In cases when the cosinor fit was not supported (either p > 0.05 or “simpler model fits better”), a line fit was retained as the best-fitting model. The significance was set at p > 0.05, highlighted in red. PND: postnatal day.
Expression of microglia markers Iba1 and Cd68 was also assessed around the clock in the SCN (Figure 1c and Table 1). The microglial reactivity marker Iba1 did not display rhythmic expression at the ages assessed, although there was a trend toward rhythmicity at PND 24 (F(1, 28) = 3.46, p = 0.07). The microglial phagocytic marker Cd68 displayed a slight but detectable 24-h oscillation at PND 4 (F(1, 27) = 4.59, p = 0.041; A = 0.14). Cd68 rhythms at PND 4 (φ = 21.55) were phase-delayed compared to PND 24 (φ = 12.88; Figure 4).
Clock and neuroimmune gene oscillation in extra-SCN regions of the postnatal brain
Clock and neuroimmune genes were characterized in 2 extra-SCN brain regions with abundant microglia: the hippocampus (Figure 2a and Table 2) and the mPFC (Figure 3a and Table 3). In the hippocampus, Per1 mRNA displayed rhythmic expression by PND 4 (Figure 2b; F(1, 26) = 25.21, p < 0.0001; A = 0.23, φ = 19.82). A phase advance in Per1 rhythm with higher amplitude was observed at PND 24 (F(1, 23) = 74.50, p < 0.0001; A = 1.15, φ = 13.03; Figure 4). Rhythmicity in Per2 expression was also observed by PND 4 (F(1, 26) = 6.91, p = 0.014; A = 0.15, φ = 17.34), with a similar phase shift as Per1 at PND 24 (F(1, 25) = 26.43, p < 0.0001; A = 0.80, φ = 14.29, Figure 4). Diurnal oscillations of Rev-erbα expression were detected at PND 1 (F(1, 32) = 8.812, p = 0.006; A = 0.36, φ = 13.69), PND 4 (F(1, 26) = 33.81, p < 0.0001; A = 0.36, φ = 19.71), and PND 24 (F(1, 26) = 43.09, p < 0.0001; A = 1.12, φ = 10.65). Similar to Per1, the acrophase of Rev-erbα advanced from PND 4 (φ = 19.71) to PND 24 (φ = 10.65), raising the possibility that circadian rhythms are entrained by distinct input signals across development (e.g., maternal cues, feeding behavior, light input).
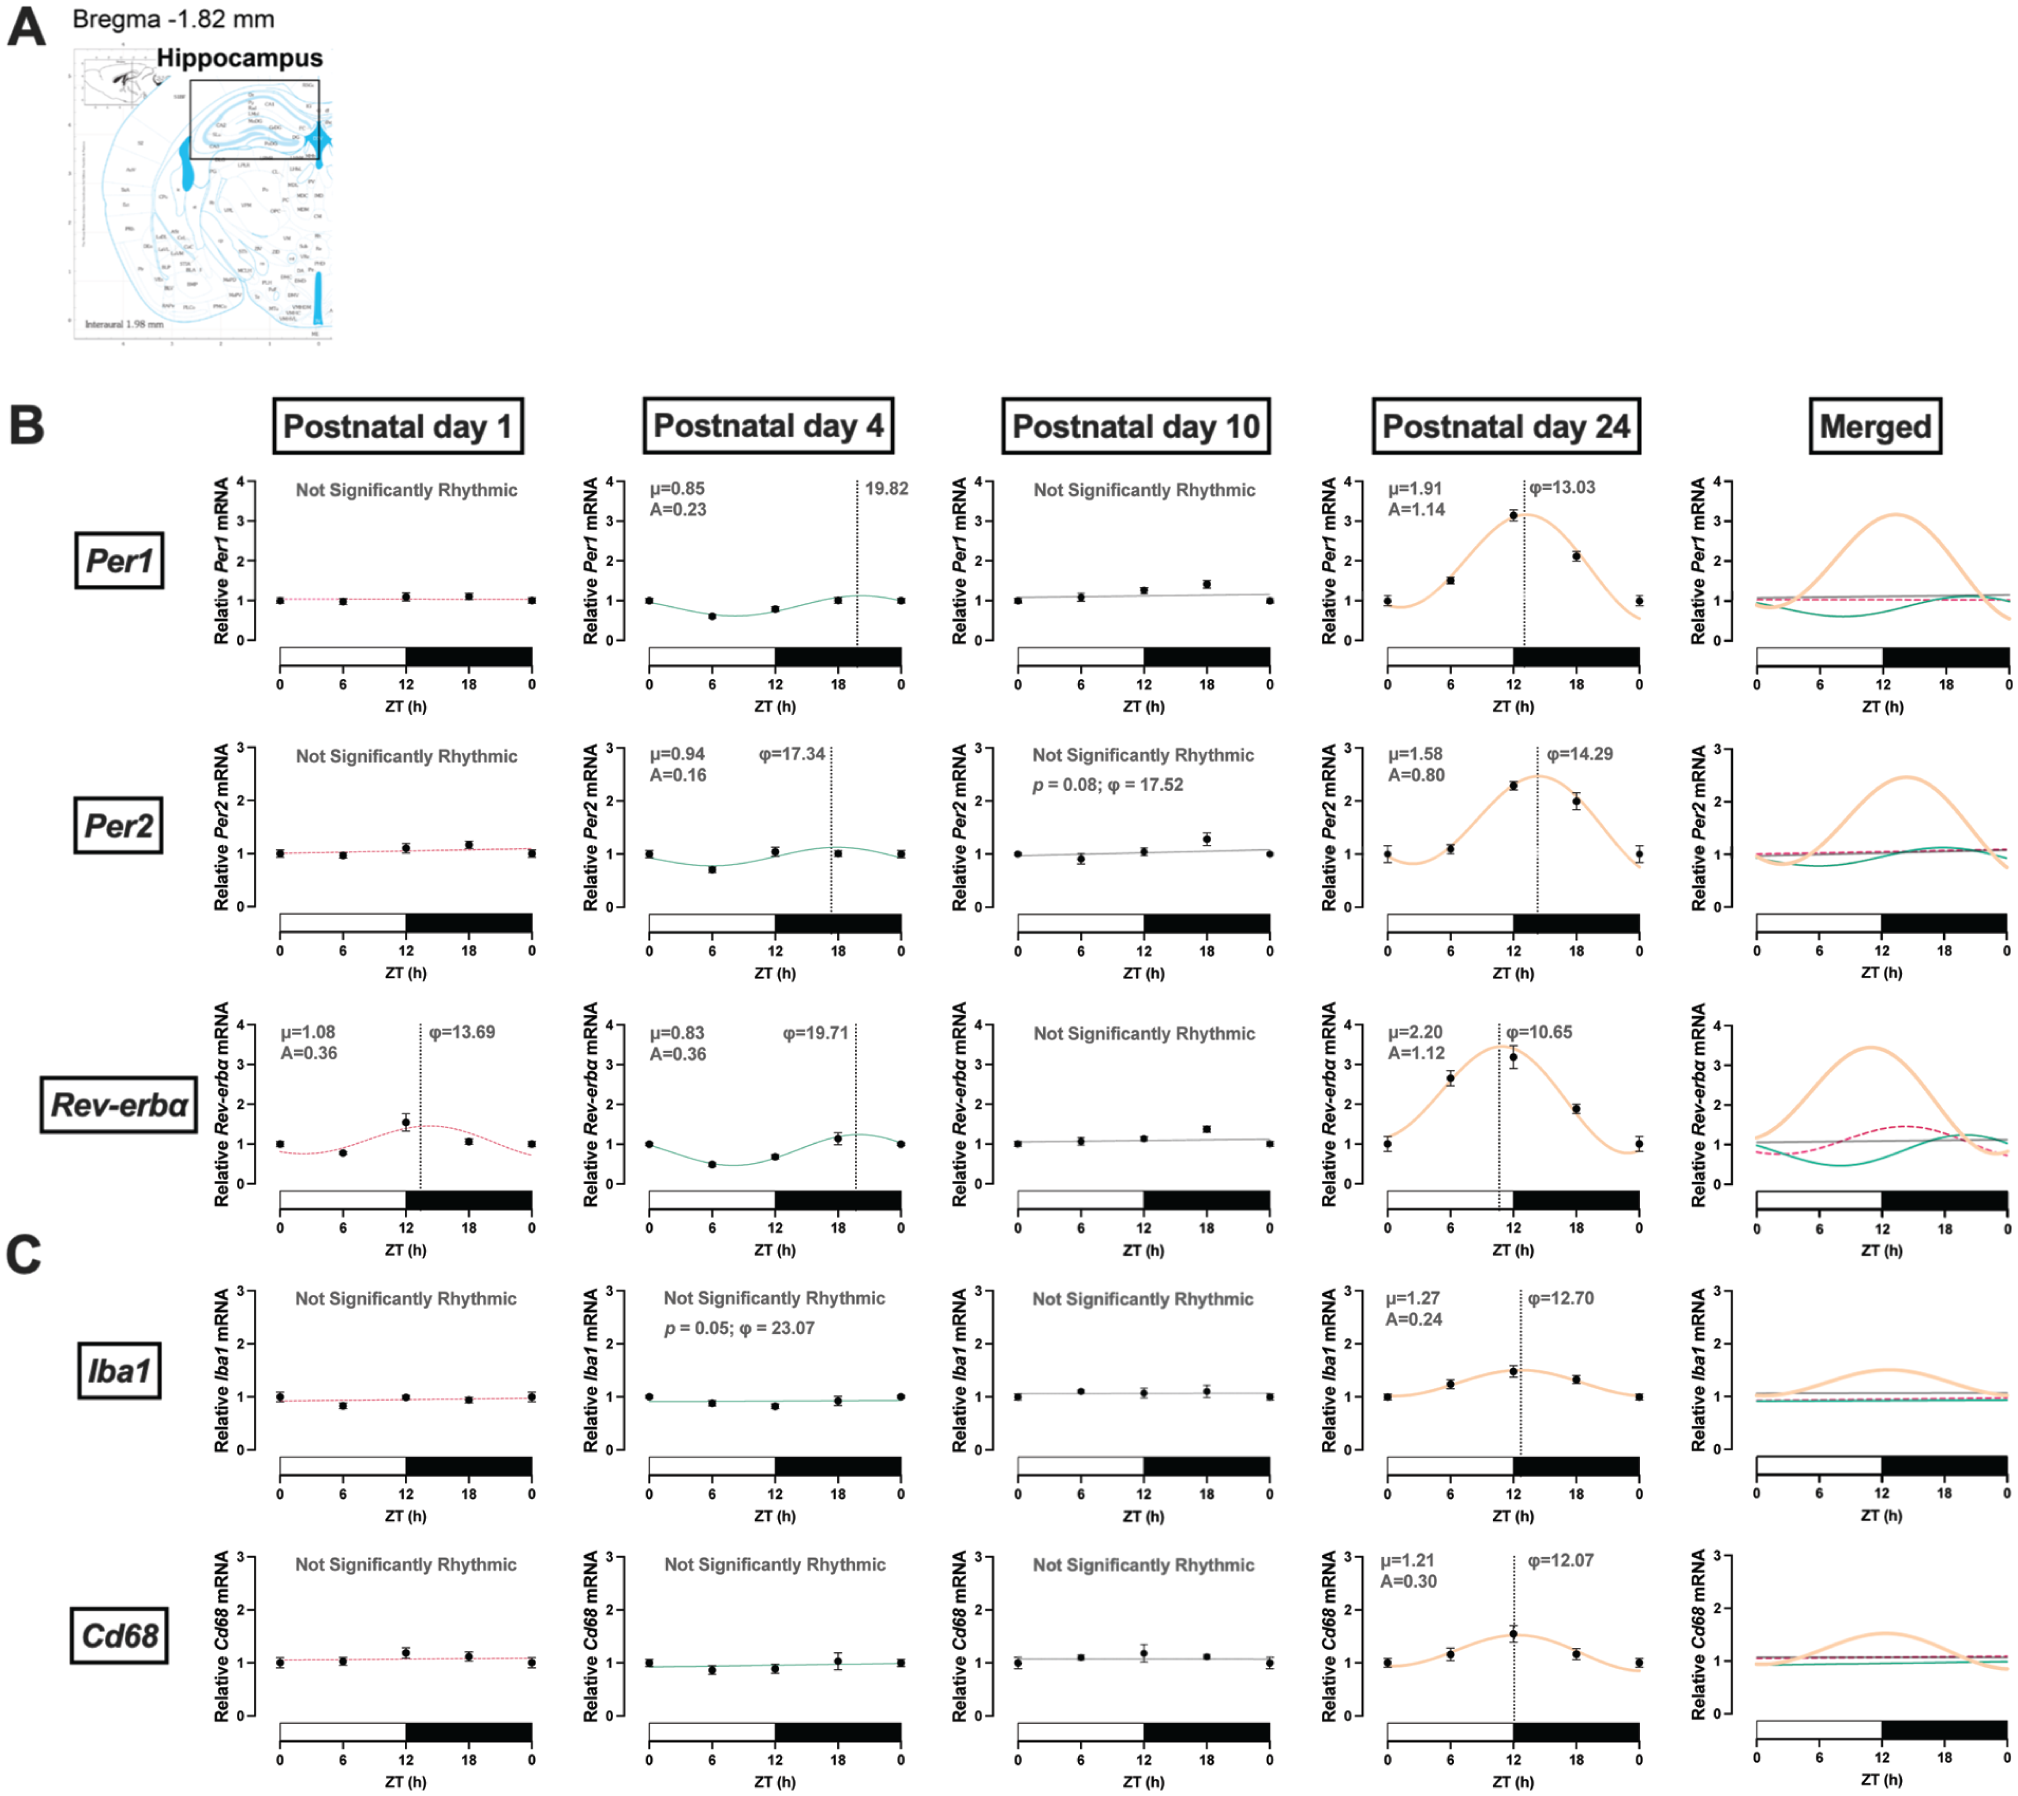
Rhythmic expression in clock genes in the hippocampus. (a) Coordinates of dorsal hippocampus in mouse brain atlas. (b) Clock genes. Rhythmic expression of Per1 and Per2 mRNA occurred by PND 4. Rev-erbα mRNA displayed rhythmic expression starting at PND 1. (c) Microglia genes. Iba1 and Cd68 displayed rhythmic expression by PND 24. ZT: zeitgeber time in hours; φ: acrophase, time of peak expression (dotted line); μ: MESOR, central tendency; A: amplitude of a rhythm. PND 1 is dotted pink, PND 4 is teal, PND 10 is gray, and PND 24 is orange. White and black bars on the x-axis represent the light and dark phases, respectively. Significance level was set at p < 0.05; p > 0.05 line fitting preferred. Data presented as mean ± SEM. ZT 24 is repeated ZT 0 data for better graphic display.
Statistical cosinor analysis of the rhythmic expression of clock gene and microglial markers in the hippocampus.
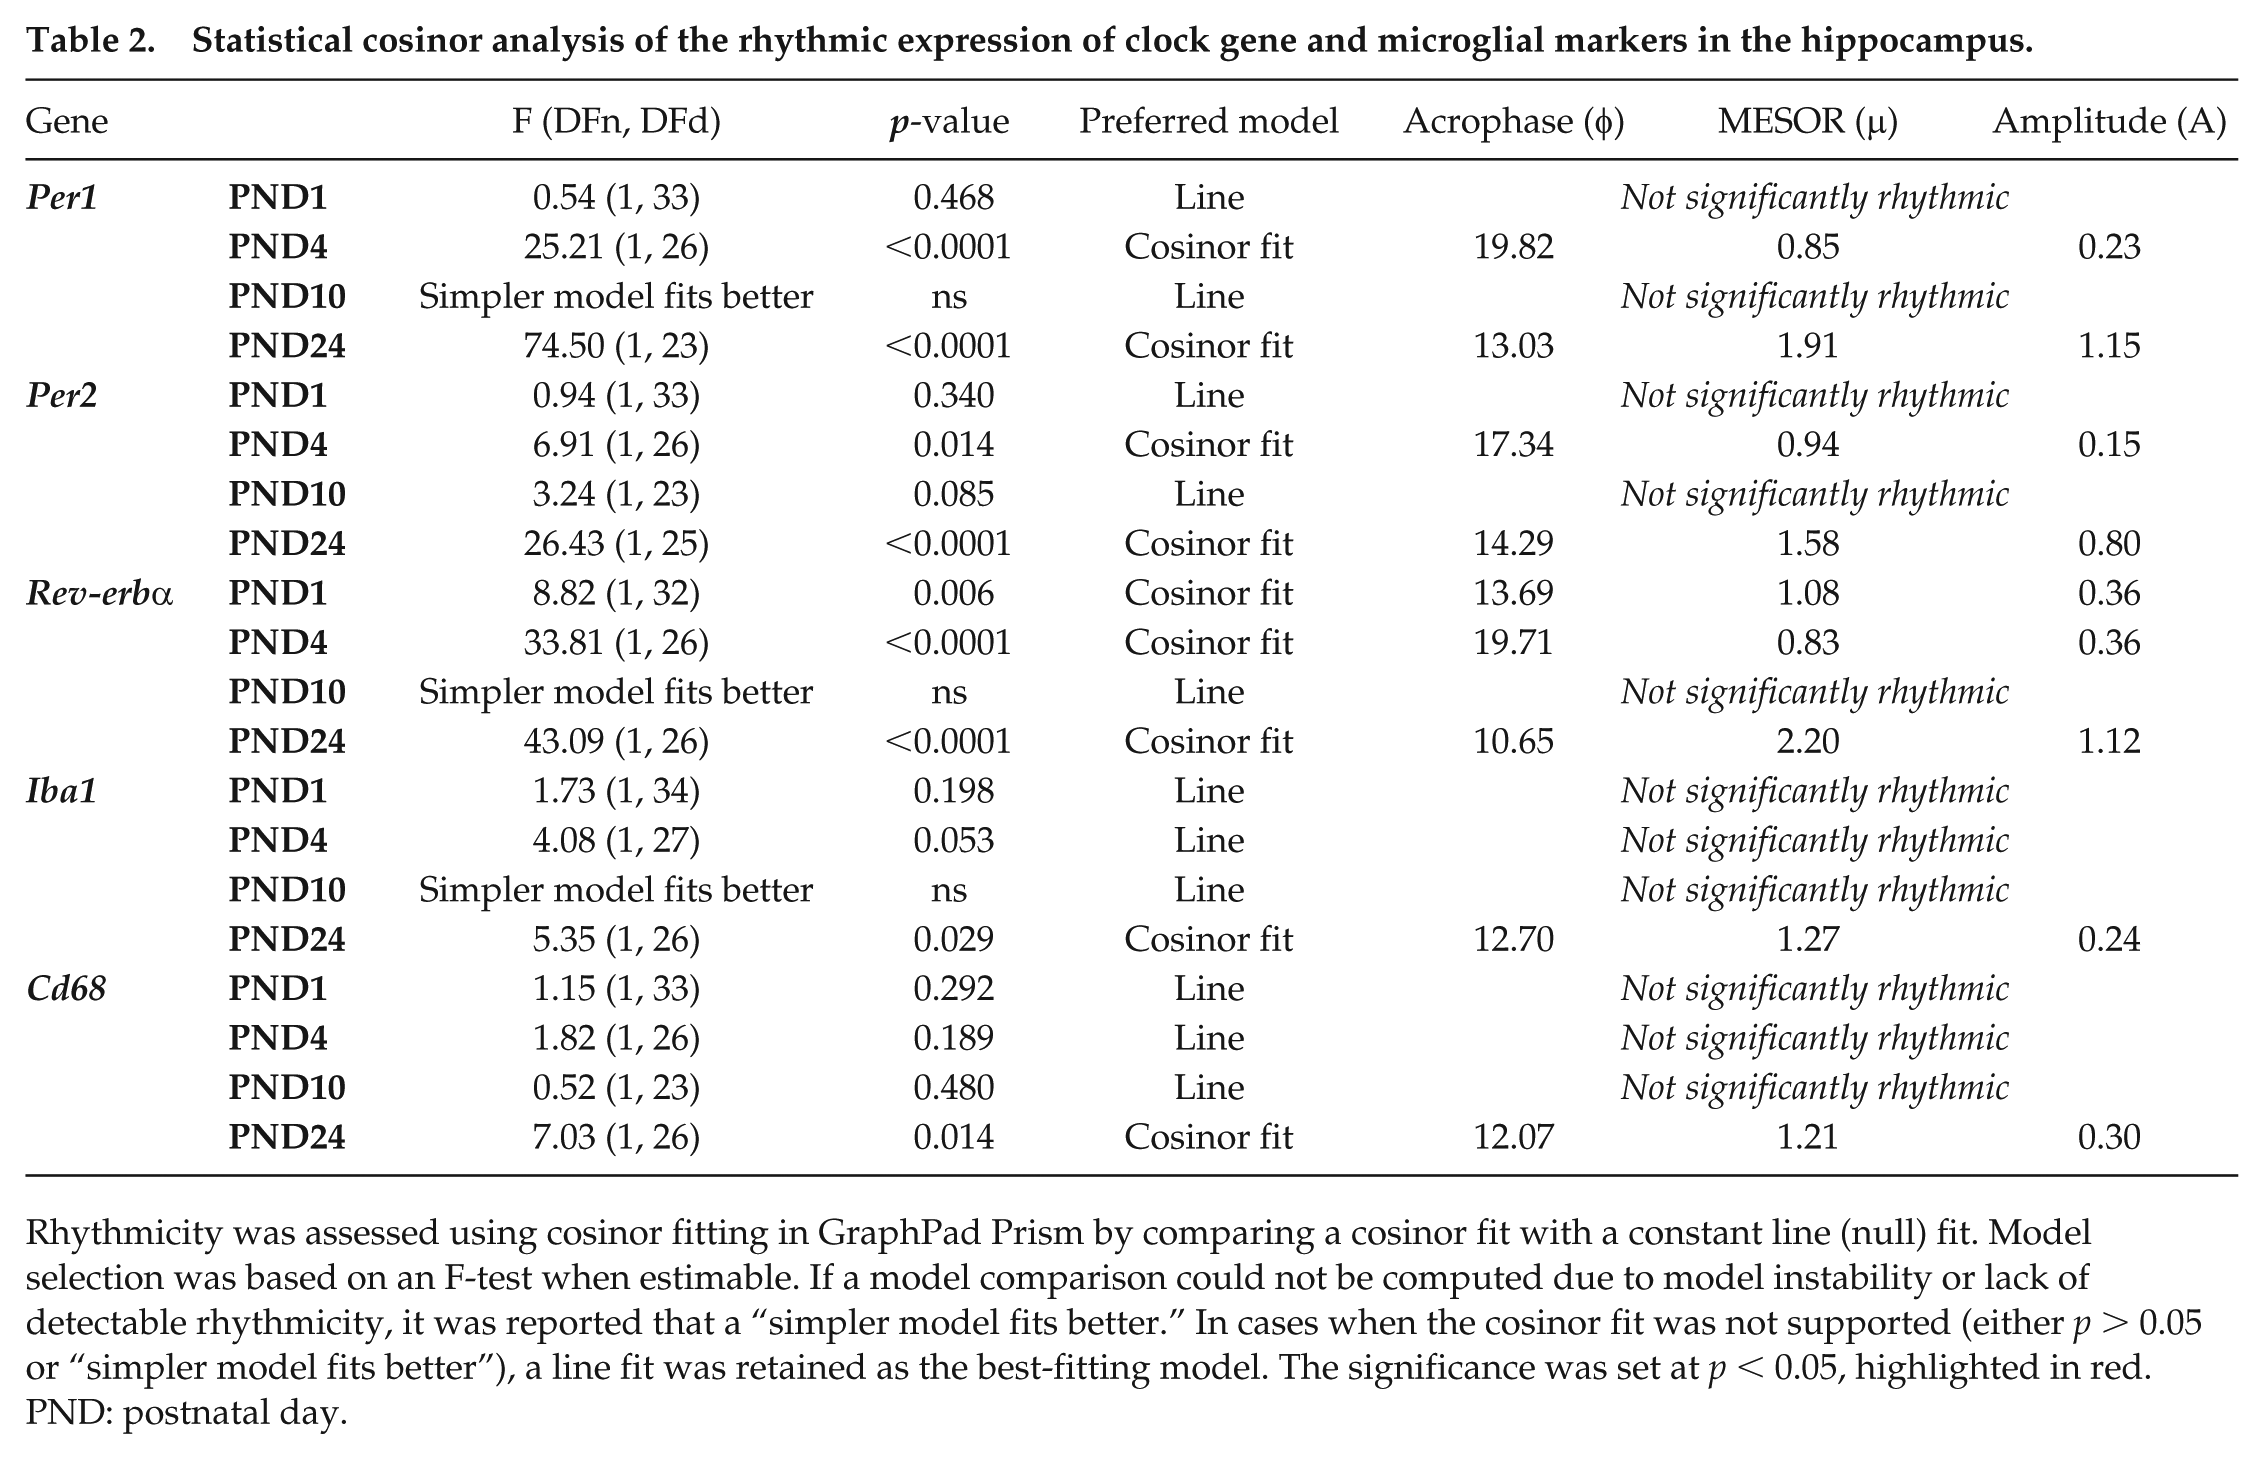
Rhythmicity was assessed using cosinor fitting in GraphPad Prism by comparing a cosinor fit with a constant line (null) fit. Model selection was based on an F-test when estimable. If a model comparison could not be computed due to model instability or lack of detectable rhythmicity, it was reported that a “simpler model fits better.” In cases when the cosinor fit was not supported (either p > 0.05 or “simpler model fits better”), a line fit was retained as the best-fitting model. The significance was set at p < 0.05, highlighted in red. PND: postnatal day.
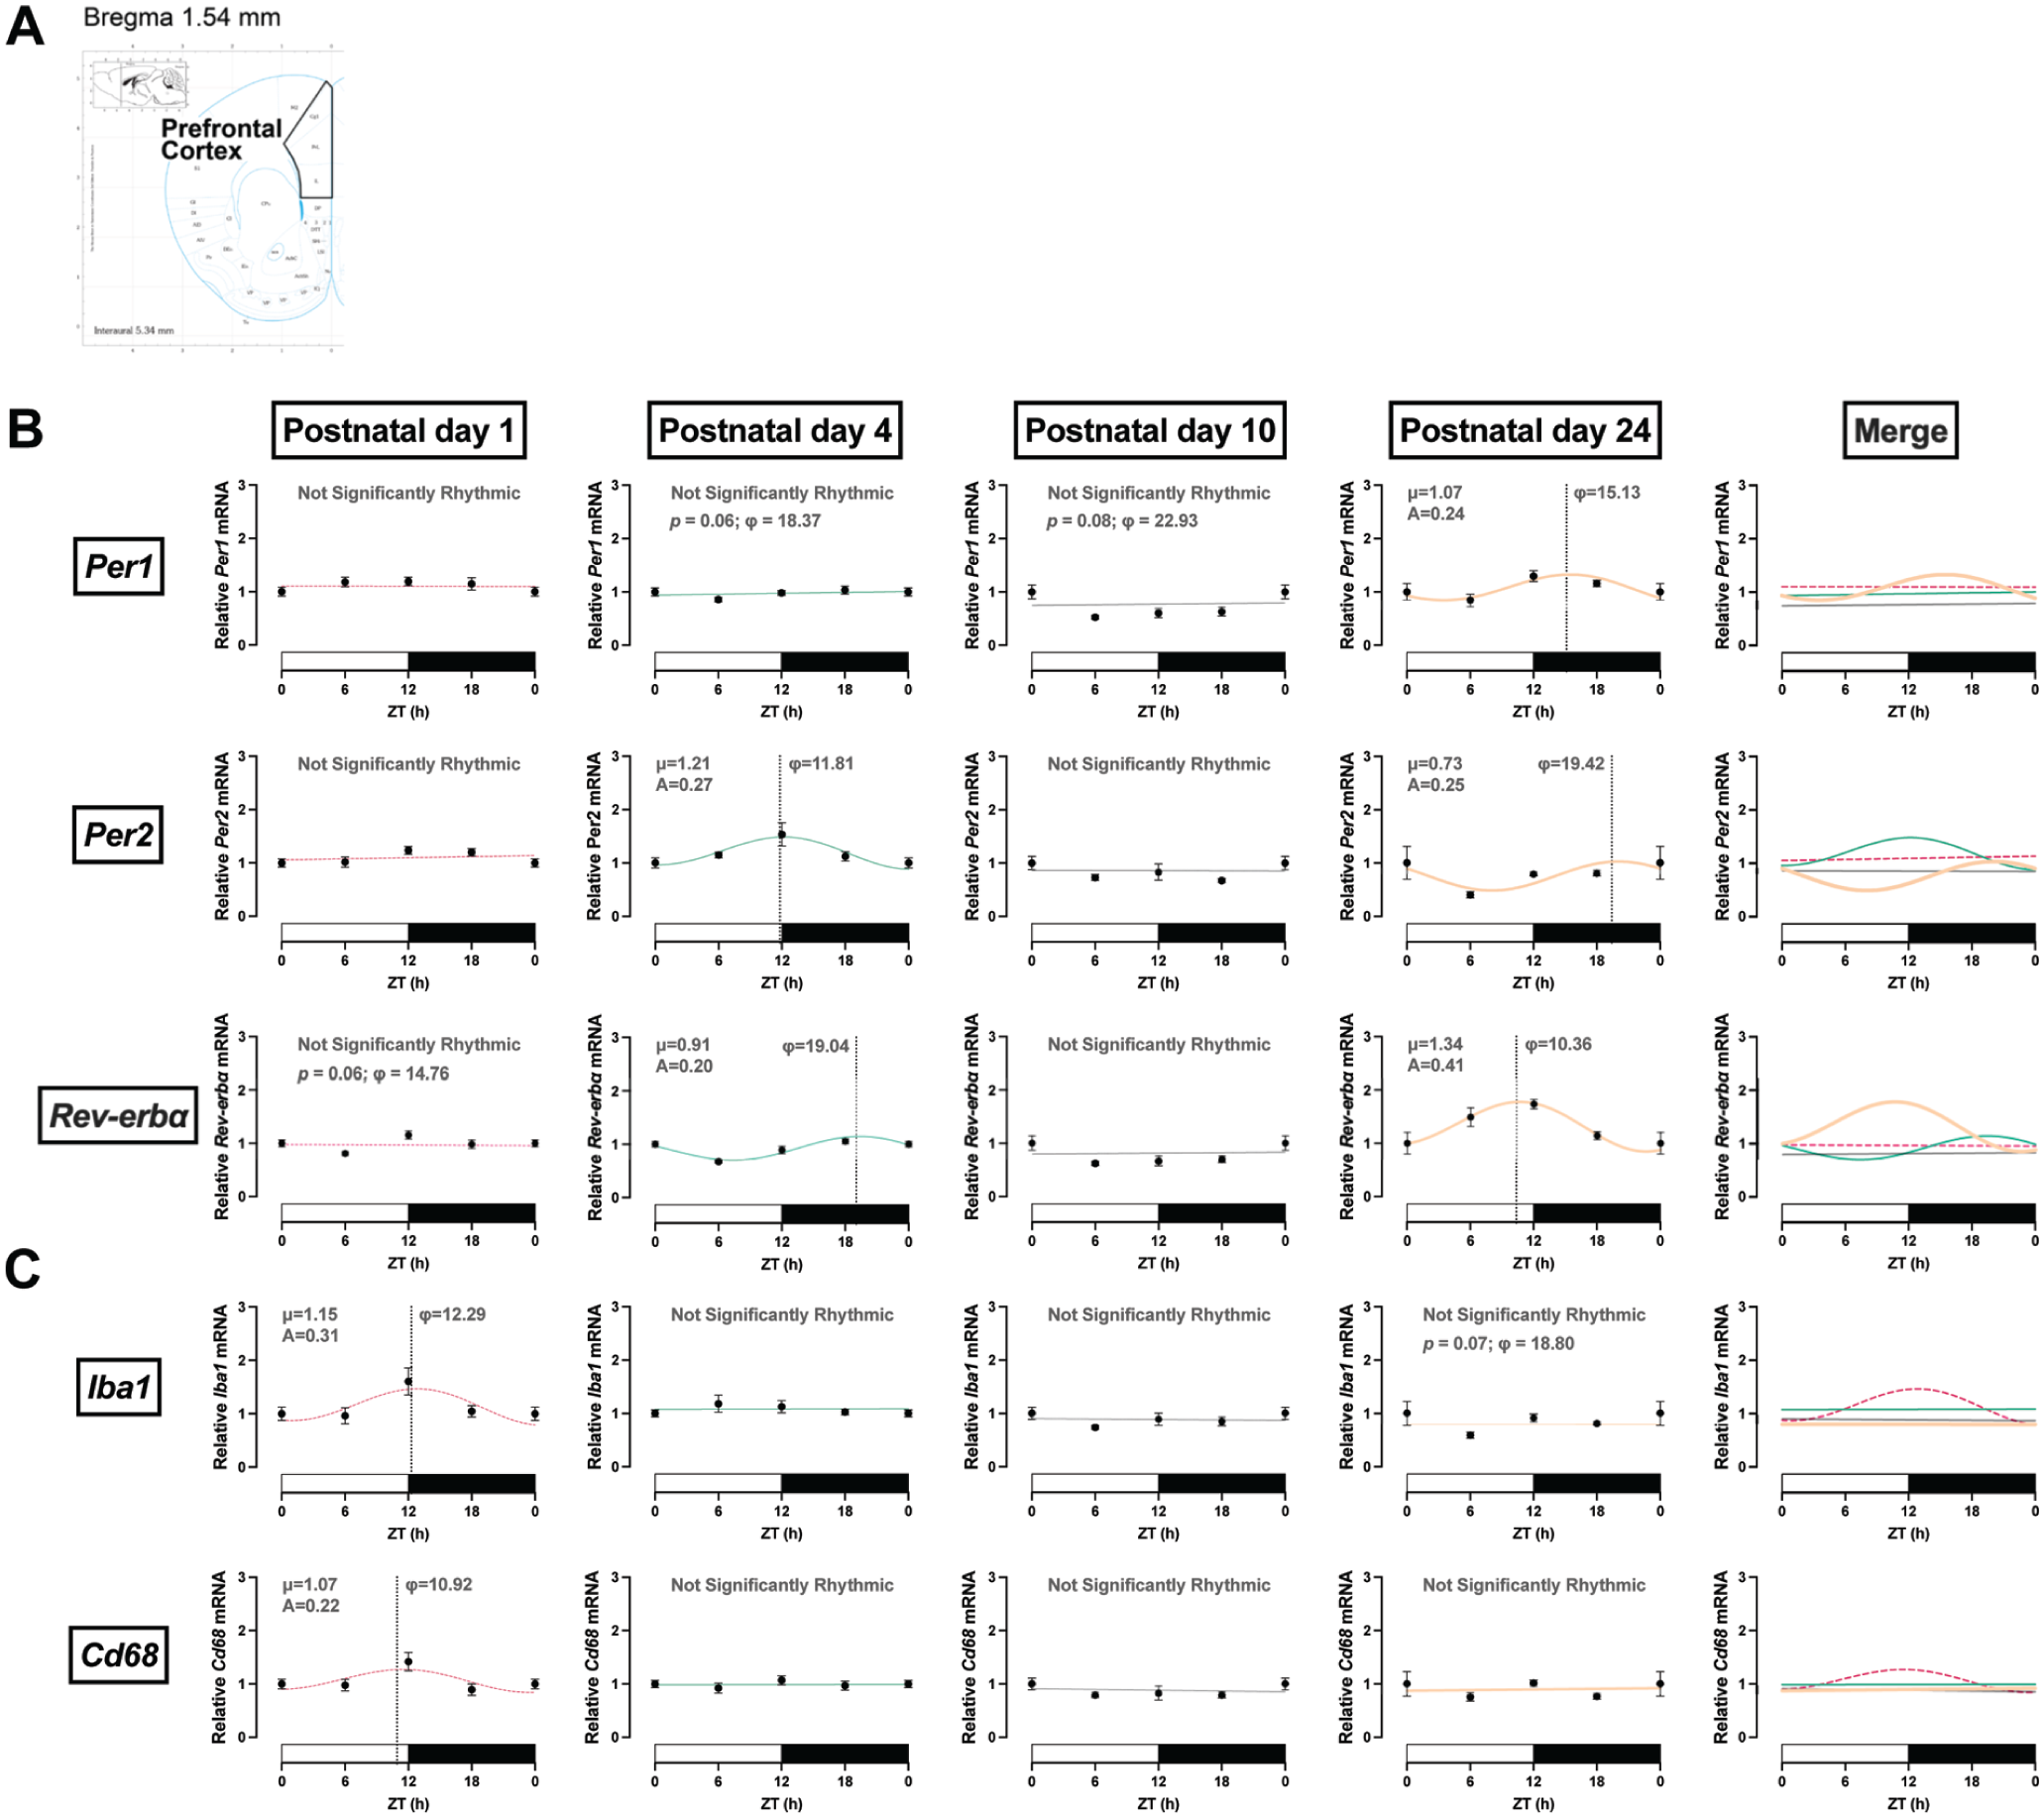
Rhythmic expression in clock genes in the medial prefrontal cortex (mPFC). (a) Coordinates of the mPFC in the mouse brain atlas. (b) Clock genes. Rhythmic expression of Per1 mRNA occurred at PND 24, although a trend was observed at PND 4 with a peak expression around ZT18. Rhythmic expression of Per2 and Rev-erbα mRNA occurred at PND 4. (c) Microglia genes. Iba1 and Cd68 only had rhythmic mRNA expression at PND 1. ZT: zeitgeber time in hours; φ: acrophase, time of peak expression (dotted line); μ: MESOR, central tendency; A: amplitude of a rhythm. PND 1 is dotted pink, PND 4 is teal, PND 10 is gray, and PND 24 is orange. White and black bars on the x-axis represent the light and dark phases, respectively. Significance level was set at p < 0.05; p > 0.05 line fitting preferred. Data presented as mean ± SEM. ZT24 is repeated ZT0 data for better graphic display.
Statistical cosinor analysis of the rhythmic expression of clock gene and microglial markers in the medial prefrontal cortex.
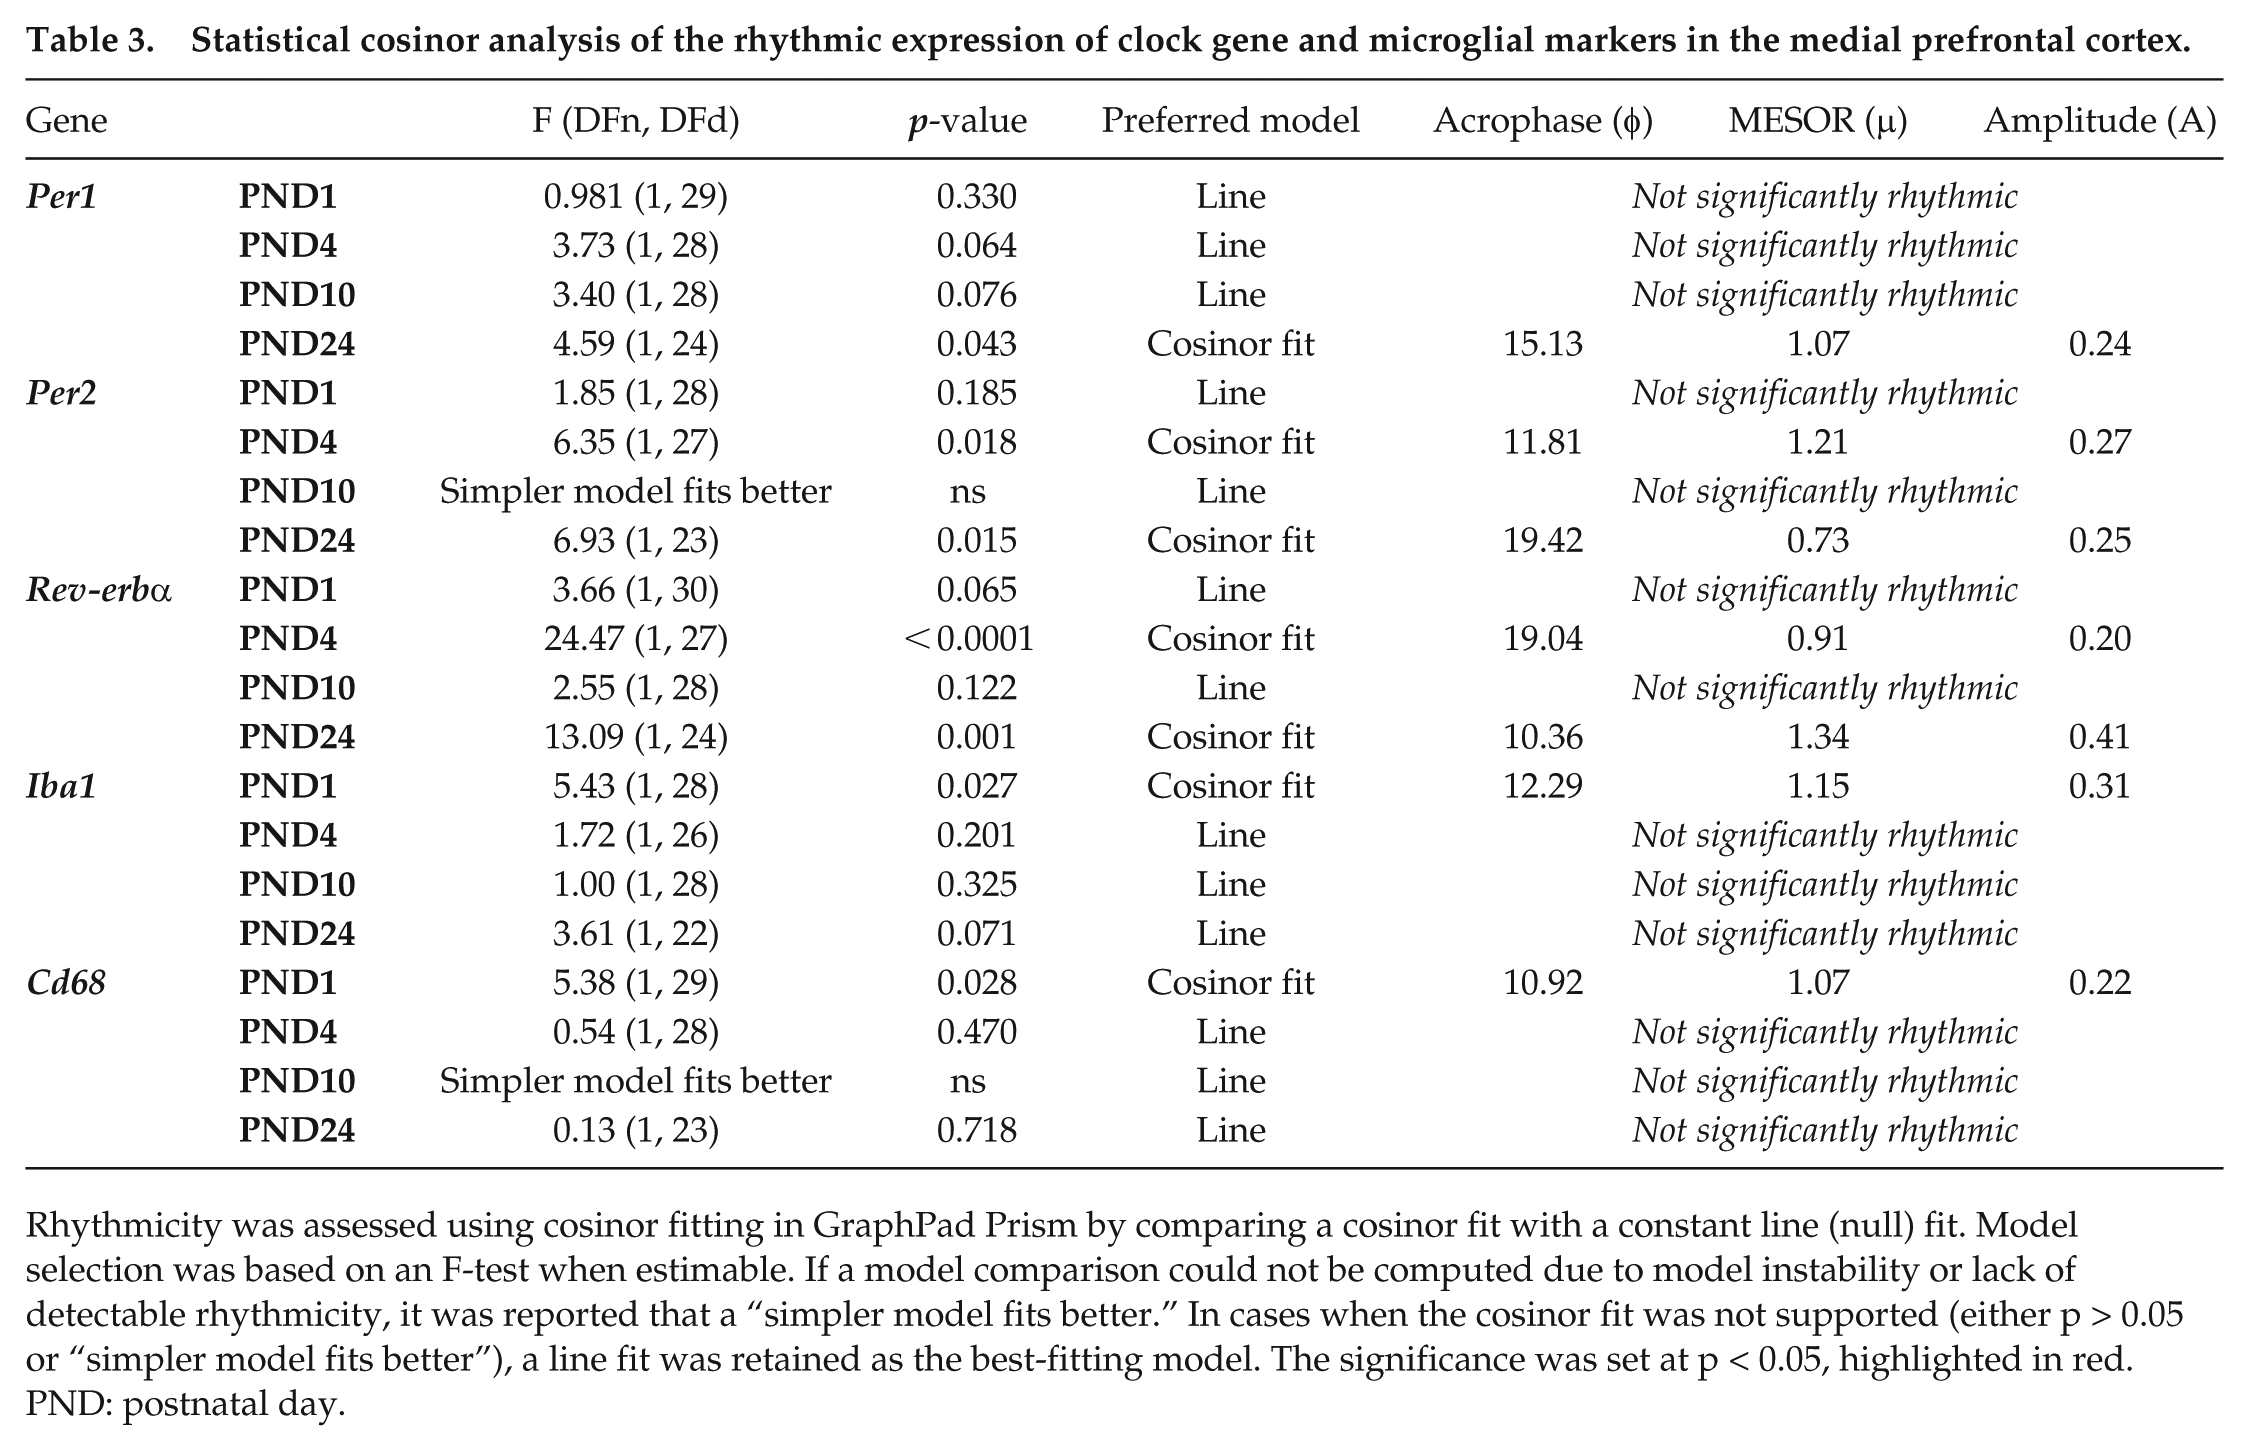
Rhythmicity was assessed using cosinor fitting in GraphPad Prism by comparing a cosinor fit with a constant line (null) fit. Model selection was based on an F-test when estimable. If a model comparison could not be computed due to model instability or lack of detectable rhythmicity, it was reported that a “simpler model fits better.” In cases when the cosinor fit was not supported (either p > 0.05 or “simpler model fits better”), a line fit was retained as the best-fitting model. The significance was set at p < 0.05, highlighted in red. PND: postnatal day.
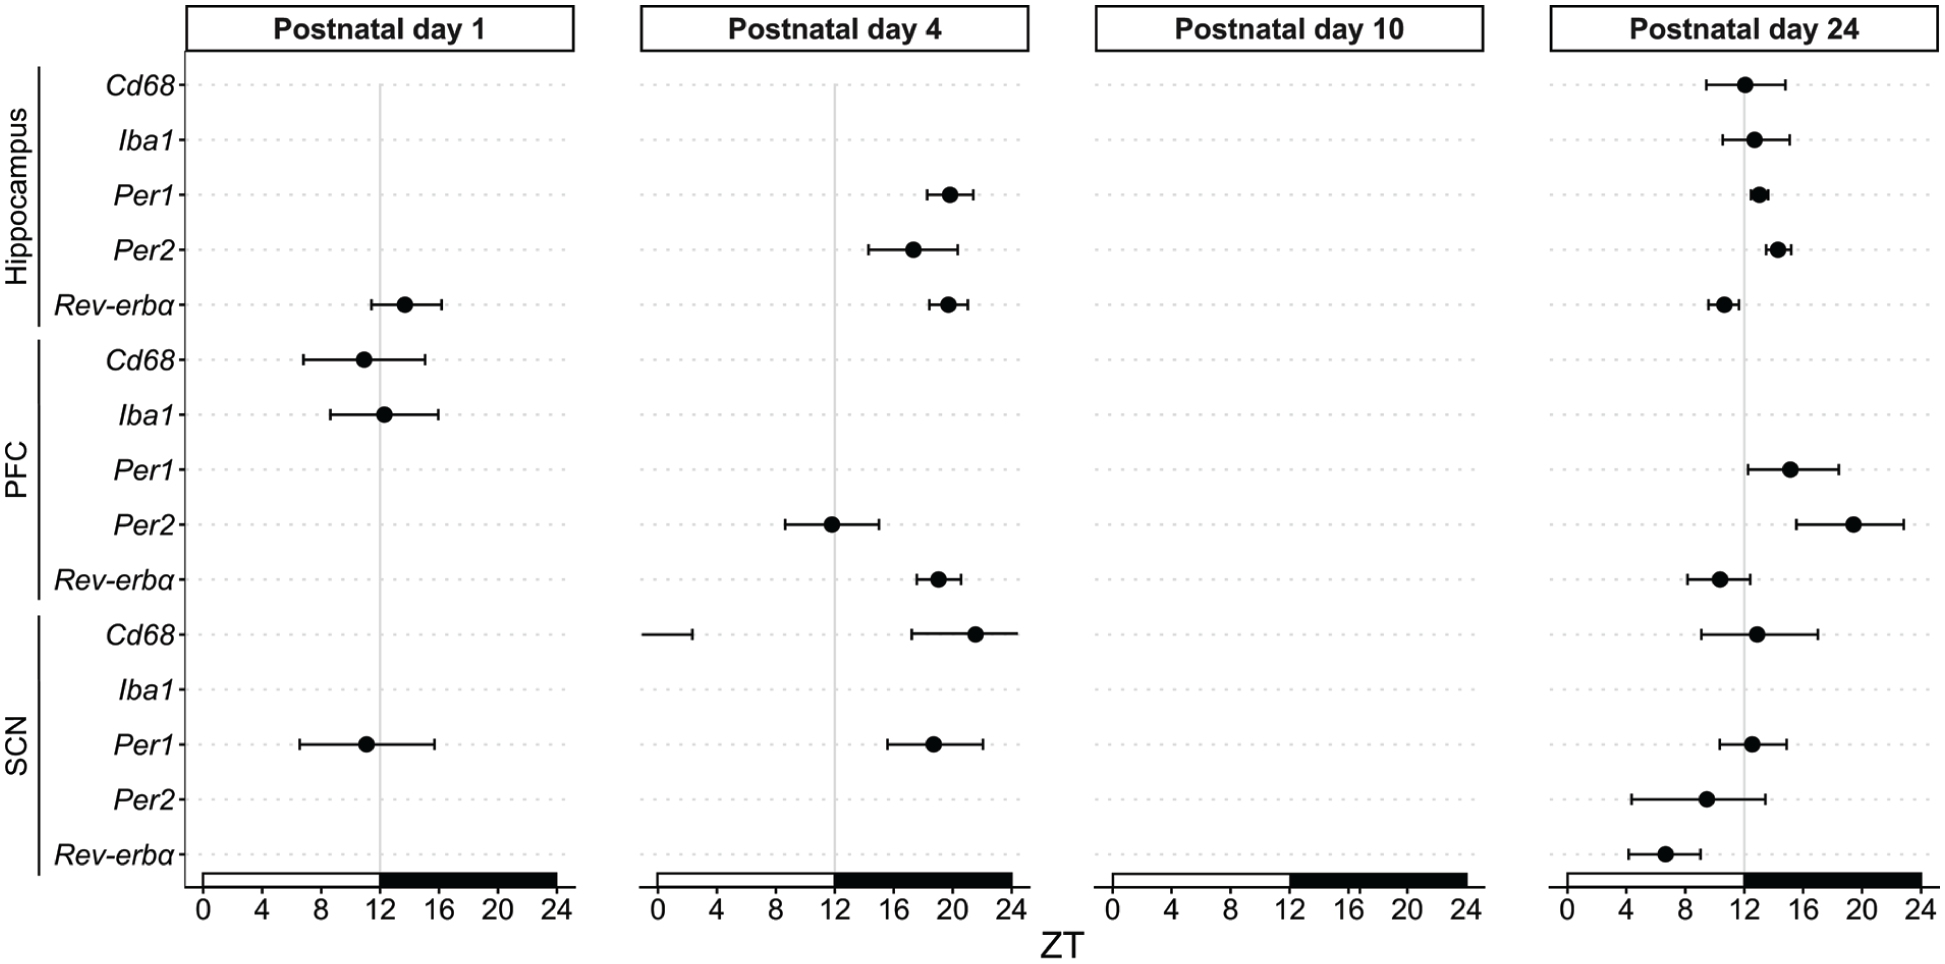
Developmental phase shifts across brain regions and genes. Plot of acrophases (±95% confidence interval) for Cd68, Iba1, Per1, Per2, and Rev-erbα are shown across the hippocampus, prefrontal cortex (PFC), and suprachiasmatic nucleus (SCN) at postnatal day 1, 4, 10, and 24. Females and males combined. Black dots with confidence interval are shown for rhythms with a significant 24 h period, p < 0.05. Phase estimates were obtained using cosinor analyses.
Both the microglia marker, Iba1, (F(1, 26) = 5.35, p = 0.029; A = 0.24, φ = 12.70) and Cd68 mRNA (F(1, 26) = 7.03, p = 0.014; A = 0.30, φ = 12.07) displayed rhythmic expression by PND 24 (Figure 2c and Table 2), with similar acrophase and amplitude as in the SCN (Figure 4). The presence of rhythmic Cd68 expression in both SCN and hippocampus at PND 24 suggests that rhythmic microglia phagocytic activity may emerge around the time of weaning.
Similarly, in the mPFC, rhythmic expression of clock genes was observed in neonatal brains (Figure 3b and Table 3). Rhythmic expression of Per1 appeared at PND 24 (F(1, 24) = 4.59, p = 0.043; A = 0.24, φ = 15.13), although there was a trend toward rhythmicity at PND 4 and PND 10. Rhythmic expression of Per2 emerged at PND 4 (F(1, 27) = 6.35, p = 0.018; A = 0.27, φ = 11.81). Per2 expression was also rhythmic at PND 24 (F(1, 23) = 6.93, p = 0.015; A = 0.25, φ = 19.42); however, there was a phase delay in the rhythm (Figure 4). Rhythmic expression of Rev-erbα mRNA appeared at PND 4 (F(1, 27) = 24.47, p < 0.0001; A = 0.20, φ = 19.04) and oscillated at a higher amplitude by PND 24 (F(1, 24) = 13.09, p = 0.001; A = 0.41, φ = 10.36) with a phase shift in expression.
Diurnal oscillation in Iba1 mRNA expression was detected at PND 1 (F(1, 28) = 5.43, p = 0.027; A = 0.31, φ = 12.29), and although not statistically significant, a trend toward rhythmicity was observed at PND 24 (Figure 3c and Table 3). Diurnal oscillation in Cd68 mRNA expression was only detected at PND 1 (F(1, 29) = 5.38, p = 0.028; A = 0.22, φ = 10.92).
Oscillations in Corticosterone in Postnatal Serum
Given that corticosterone can serve as an entrainment factor for extra-SCN circadian rhythms (Fonken et al., 2015), we next evaluated serum corticosterone concentrations. Rhythmicity in serum corticosterone concentrations appeared at PND 4 (F(1, 33) = 15.13, p = 0.001; A = 2.43, φ = 22.47) and oscillated at a higher amplitude at PND 10 (F(1, 32) = 17.03, p = 0.0002; A = 5.16, φ = 19.96) with a similar acrophase between the two ages (Figure 5). By PND 24, there was a clear sex difference: serum corticosterone oscillation in PND 24 males (F(1, 12) = 17.44, p = 0.001; A = 97.27, φ = 20.73) was similar to that observed at PND 10, whereas PND 24 females (F(1, 14) = 5.108, p = 0.04; A = 61.56, φ = 12.17) oscillated similarly to adults (Son et al., 2008). Overall, corticosterone oscillation amplitude at PND 24 exceeded that at PND 4 and PND 10.
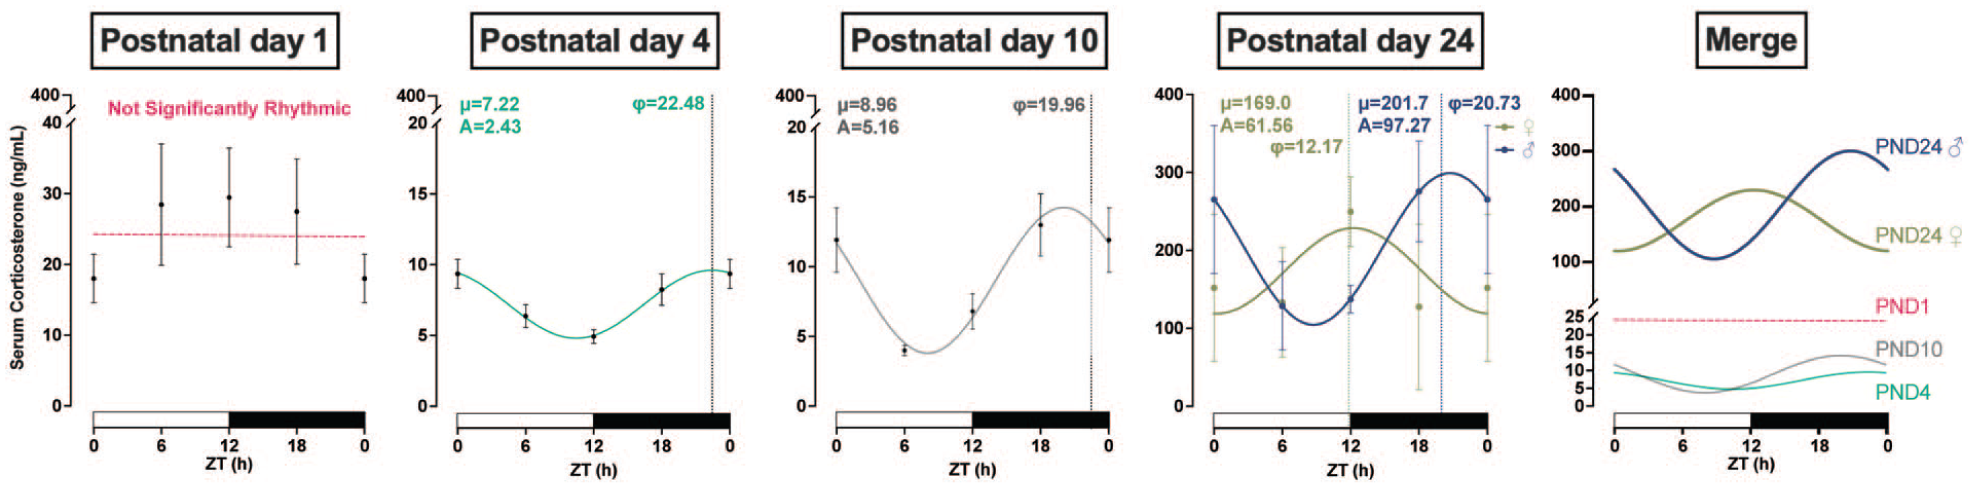
Rhythmic fluctuations in corticosterone concentration. Serum corticosterone from trunk blood displayed significant rhythmic expression beginning at postnatal day (PND) 4. No sex differences were detected until PND 24 (females, green; males, blue). Final panel overlays all ages overlaid to facilitate direct comparison (PND 1, raspberry; PND 4, teal; PND 10 gray). ZT: zeitgeber time in hours; φ: acrophase, time of peak expression (dotted line); μ: MESOR, central tendency; A: amplitude of a rhythm. White and black bars on the x-axis represent the light and dark phases, respectively. Significance level was set at p < 0.05; p > 0.05 line fitting preferred. Data presented as mean ± SEM. ZT 24 is repeated ZT 0 data for better graphic display.
Experiment 2
Clock and Neuroimmune Gene Time-of-Day Differences in the Postnatal Neuroimmune Tissue
Based on the differences that were detected between rhythms at PND 10 and PND 24, these ages were selected for further analysis in experiment 2. Clock and neuroimmune genes were characterized in 3 neuroimmune tissues: choroid plexus, microglia, and meninges, during mid-light (ZT6) and mid-dark (ZT18) phases.
In the choroid plexus, time-of-day differences in the expression of Per1 were not detected at PND 10 or PND 24 (Figure 6a and 6b). At PND 24, the expression of Rev-erbα was significantly lower at ZT18 than at ZT6 (Figure 6b; t(16.48) = 25.19, p < 0.0001).
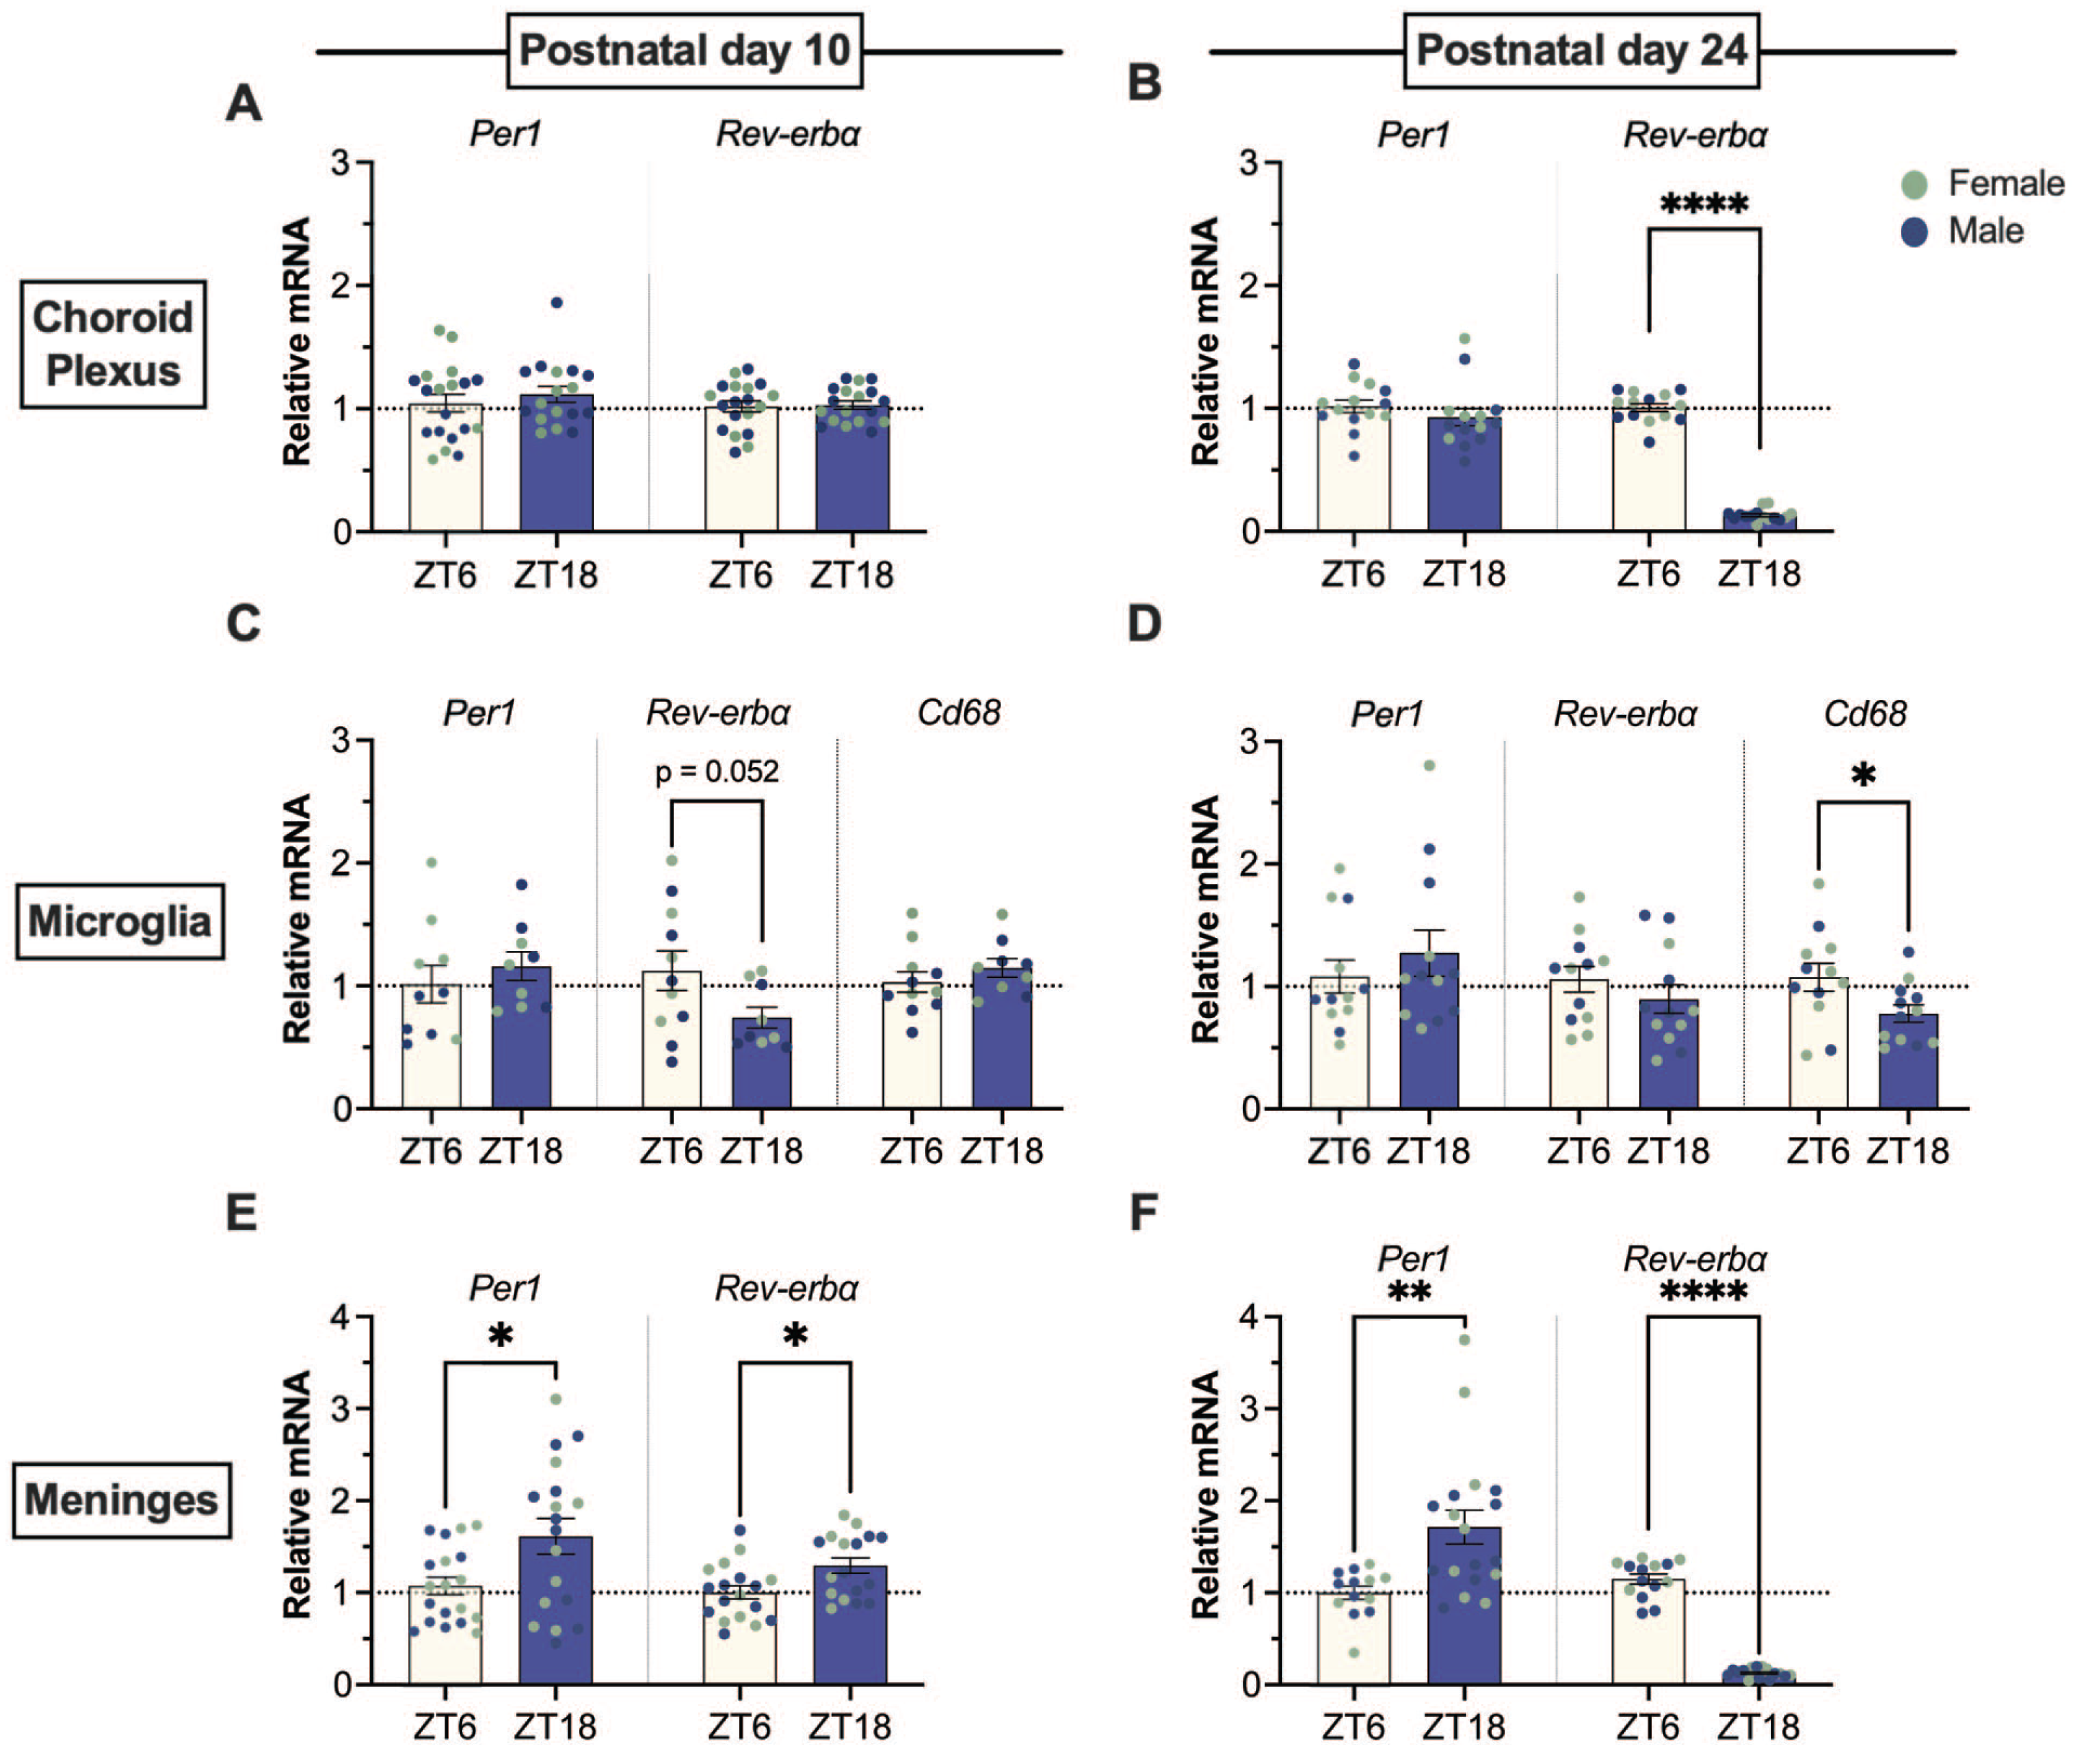
Time-of-day differences in clock gene expression across neuroimmune tissues. (a-b) The choroid plexus did not have differential expression of Per1 or Rev-erbα clock genes at PND 10, but Rev-erbα had a time-of-day difference at PND 24. (c-d) Microglia isolated at PND 10 showed a trend toward a time-of-day difference in the expression of Rev-erbα mRNA, which was not observed at PND 24. At PND 24, Cd68 was expressed less at ZT18. (e-f) The meninges had a time-of-day difference in the expression of Per1 and Reverbα at PND 10 and PND 24. No sex differences were detected (females, green; males, blue). Data presented as mean ± SEM. *p < 0.05, **p < 0.01, ****p < 0.0001.
In isolated microglia, no significant time-of-day differences were detected in either Per1 or Rev-erbα at either age (Figure 6c and 6d), although at PND 10, there was a trend toward a lower expression of Rev-erbα at ZT18 than at ZT6 (Figure 6c; t(14.98) = 2.11, p = 0.0525). At PND 24, the expression of CD68 was lower at ZT18 than at ZT6 (t(22) = 2.206, p = 0.0382).
In the meninges, time-of-day differences were detected in Per1 and Rev-erbα at both PND 10 and PND 24 (Figure 6e and 6f). Expression of Per1 was higher at ZT18 than at ZT6 at both PND 10 (t(24.84) = 2.508, p = 0.019) and PND 24 (Mann-Whitney U = 40, p = 0.001 2-tailed). Expression of Rev-erbα was higher at ZT18 than at ZT6 at PND 10 (t(33) = 2.664, p = 0.012) and lower at PND 24 (Mann-Whitney U = 0, p < 0.0001 2-tailed).
Together, these data indicate that time-of-day variation occurs earlier in meningeal tissue than in choroid plexus or microglia, suggesting differential maturation of circadian regulation across neuroimmune tissues. Alternatively, the parameters of gene expression rhythms in neuroimmune tissues may be tissue-specific, with the choroid plexus and microglia exhibiting phase shifts such that the 2 sampled time points (mid-light and mid-dark) do not capture peak and nadir expression.
Diurnal Variation of Microglia Phagocytic Activity
Given that low-amplitude or desynchronized oscillations in clock gene expression may be insufficiently detected at the transcription level, we additionally assessed microglial phagocytosis as a functional readout. Ex vivo microglia isolated from whole brain, excluding the olfactory bulbs and cerebellum, showed time-of-day differences in phagocytosis (Figure 7). Isolated cells were >99% Iba1+. After 24 h in culture, the microglia isolated at ZT18 phagocytosed fewer latex beads than those isolated at ZT6 at both PND 10 (t(20) = 2.565, p = 0.0185) and PND 24 (t(29) = 2.073, p = 0.047). These findings suggest that microglia phagocytic function exhibits time-of-day variation during development, even in the absence of detectable gene expression differences between the sampled time points.
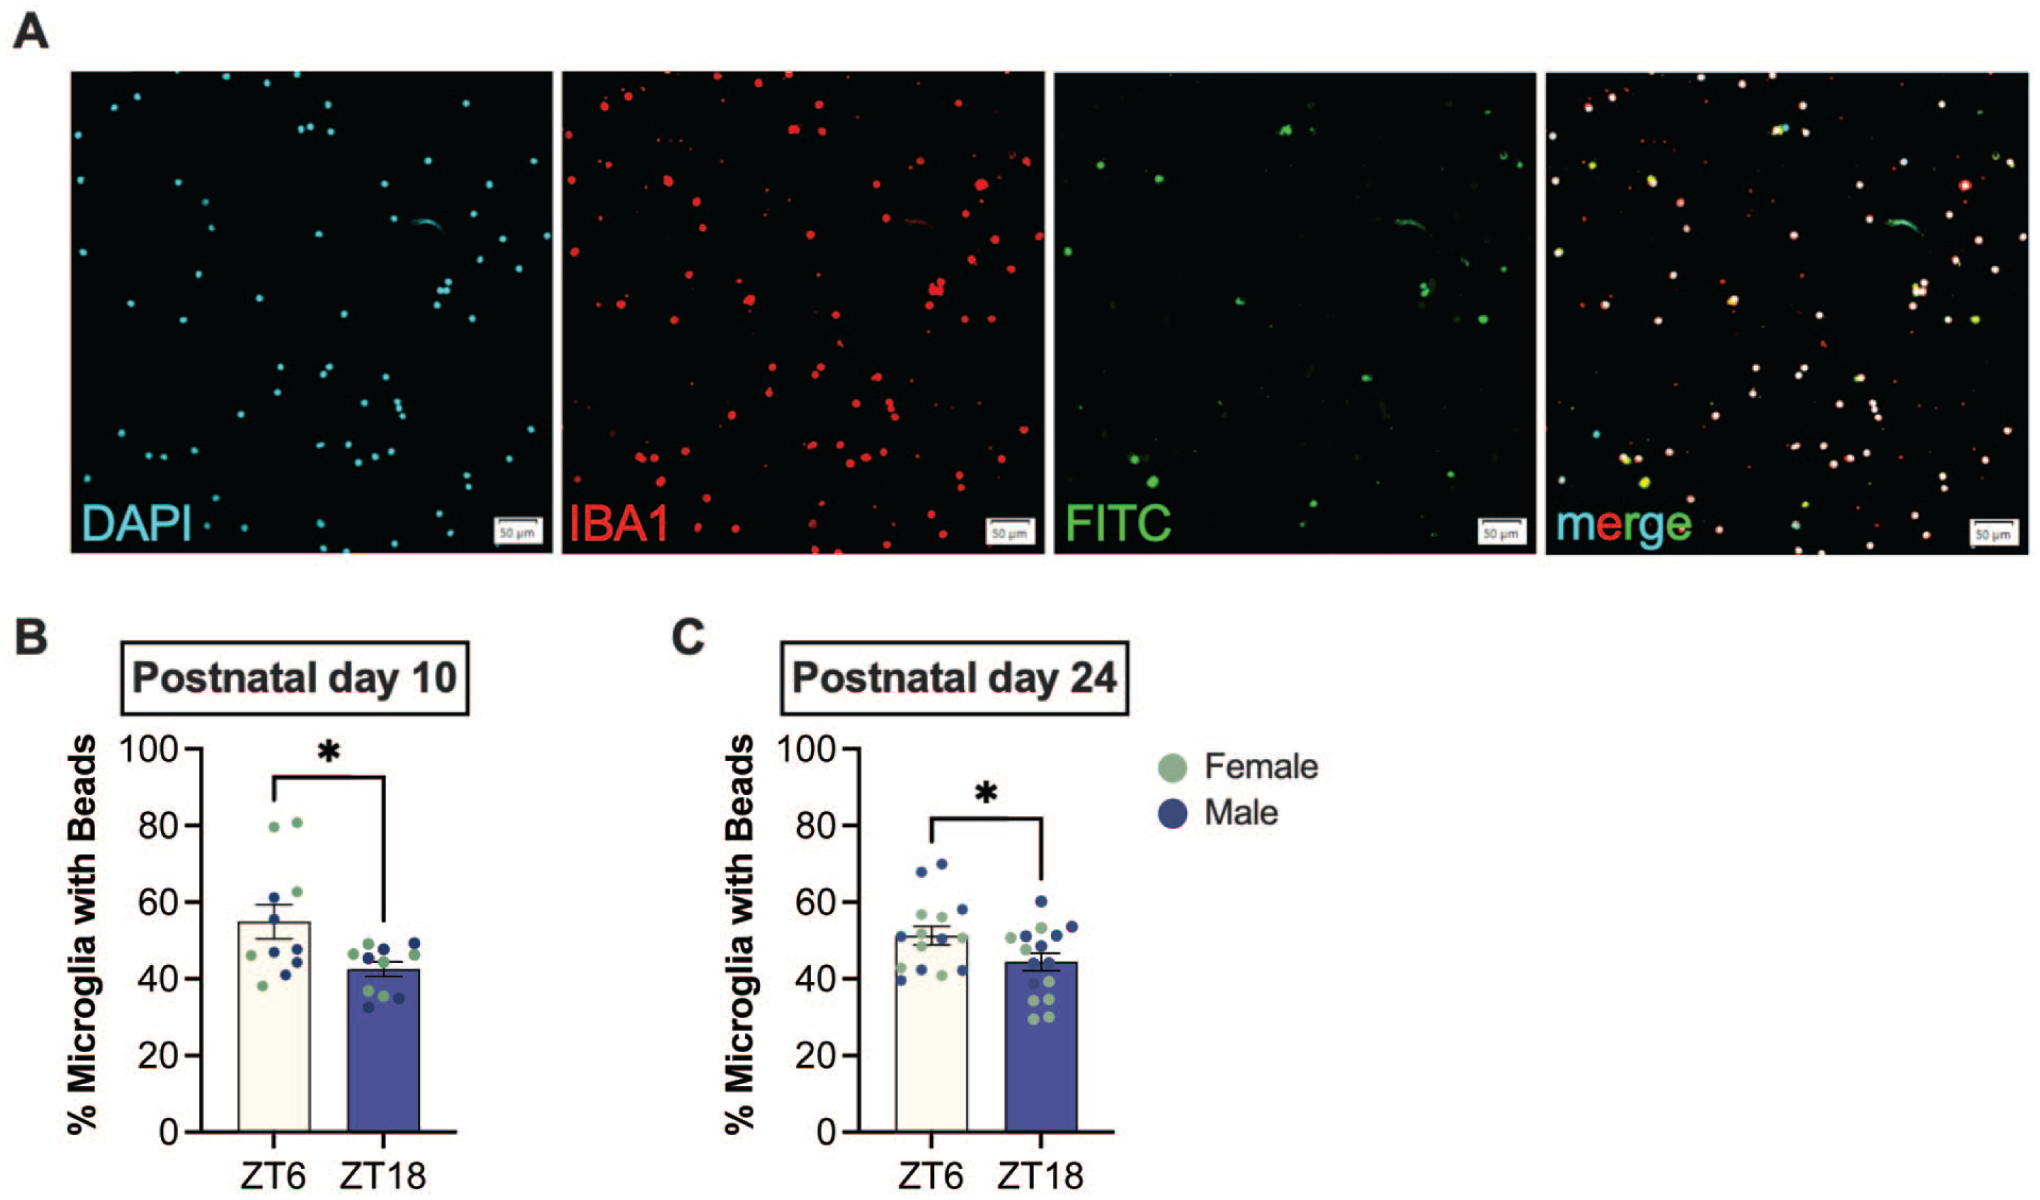
Ex vivo microglia phagocytose more during light phase compared to dark phase during postnatal development. (a) Representative 20X images of Iba1-labeled microglia (>99% Iba1+) were isolated from whole brain (excluding olfactory bulb and cerebellum) at ZT6 and ZT18. Cells were cultured for 24 h and incubated with FITC-labeled latex beads for 30 min prior to fixation. (b-c) Phagocytosis was quantified as the percent of microglia containing beads. Microglia isolated at ZT18 exhibited reduced phagocytosis compared to ZT6 at both (b) PND 10 and (c) PND 24. No sex differences were detected (females, green; males, blue). Data presented as mean ± SEM, *p < 0.05.
Discussion
This study investigated the developmental emergence of multi-level diurnal rhythmicity, from tissue-specific clock gene oscillations to systemic corticosterone rhythms and microglial functional rhythms. Results revealed that at least 1 clock gene was rhythmically expressed starting at PND 1 in the SCN and hippocampus, and by PND 4 in the prefrontal cortex. Diurnal rhythms in serum corticosterone were evident by PND 4. There was also evidence of early-life rhythmic activity in neuroimmune tissue, but the developmental timing varied by tissue.
Circadian Gene Oscillations Are Detectable Across the Developing Brain
In altricial species like mice and rats, whose pups are highly immature at birth, overt diurnal physiological rhythms typically emerge after birth. However, at the cellular and tissue levels, some components of the circadian system are established prenatally. Circadian rhythms begin to develop in utero, shortly after SCN neurogenesis. In C57BL mice, SCN cytogenesis occurs between embryonic days (E) 12 and 15 (vaginal plug considered to be E 1; Shimogori et al., 2010; Kabrita and Davis, 2008), and mRNA expression of core molecular clock genes Per1 and Per2 is detectable as early as E 17 (Shearman et al., 1997; Shimomura et al., 2001). However, the developmental stage at which the SCN first gains the capacity to generate circadian oscillations has not been well established and is currently under debate (Sumova and Cecmanova, 2020).
Functional day-night patterning in the fetal rat SCN appears in the final days of gestation, as indicated by daily variation in metabolic activity (Reppert and Schwartz, 1984b) and neuronal firing (Shibata and Moore, 1987). At the level of the molecular clock, hypothalamic explants from mice isolated near the end of SCN neurogenesis exhibit consistent circadian oscillations as measured by PER2::LUC bioluminescence (Landgraf et al., 2015; Carmona-Alcocer et al., 2018). In contrast, transcription-based studies have produced mixed results. In mice, some report that Per2 mRNA rhythmicity does not emerge until the postnatal period (PND 6; Shimomura et al., 2001). In rats, rhythmic expression of Per1 (Ohta et al., 2003) and Per2 (Ohta et al., 2003; Houdek and Sumova, 2014) mRNA was detected just before birth, whereas others observed rhythmicity in Per1 but not in Per2 (Kovacikova et al., 2006). Still others have not detected rhythmic expression at the whole SCN tissue level until after birth in both mice and rats (Ansari et al., 2009; Greiner et al., 2022; Sladek et al., 2004; Li and Davis, 2005).
Divergent findings between the bioluminescent reporter-based explant studies and transcriptional measurements might be due to these methodologies detecting translation versus transcription, respectively. Alternatively, variation in tissue preparation and culture conditions (e.g., environment, nutrients, serum, temperature, etc.) may influence cellular synchrony or phasing (Landgraf et al., 2015), thereby amplifying rhythmic signals ex vivo. Finally, heterogeneity in the developmental ages examined across studies likely further contributes to uncertainty regarding the precise timing of rhythm emergence (compare Kovacikova et al., 2006 and Sladek et al., 2004).
In this study, rhythmic expression of Per1 mRNA was detected in the SCN as early as PND 1 in C57BL mice, consistent with prior in situ hybridization and immunohistochemistry evidence supporting subtle but measurable time-of-day variation in clock genes within the murine neonatal SCN (Ansari et al., 2009; Greiner et al., 2022; Li and Davis, 2005). We further observed early-life rhythmicity in clock genes within extra-SCN brain tissues.
In the hippocampus, we observed rhythmic expression of Per1 and Per2 mRNA at PND 4, and Rev-erbα as early as PND 1. In contrast, Pramong et al. (2015) reported no rhythmicity in Per1 or Per2 mRNA or protein in rat hippocampus during the early postnatal period (PND 4-PND 16) (Pramong et al. 2015). Similarly, autoradiographic analysis failed to detect hippocampal Per1 and Per2 rhythms at PND 6 unless rat pups were separated from their dams for the entire light period (Ohta et al., 2003). These discrepancies may reflect species-specific differences in hippocampal clock maturation, variation in analytical approaches, or limited sensitivity to detect low-amplitude rhythms, such as those observed in our study.
Consistent with the low-amplitude rhythms observed in the hippocampus, Per1 mRNA in the mPFC did not reach significance at PND 4 but displayed a trend toward rhythmicity that became significant at a later developmental stage. Per2 and Rev-erbα displayed diurnal oscillations as early as PND 4. Overall, the neonatal brain rhythmically expresses 1 or more clock genes in every brain region examined, indicating that circadian mechanisms may begin shaping the brain during early postnatal development.
Notably, none of the selected genes exhibited significant rhythmicity by cosinor analysis in any brain region examined at PND 10, in contrast to other reports in rats (Sladek et al., 2025; Sladek et al., 2004) and C3H mice (Ansari et al., 2009), where expression for several core clock genes (e.g., Bmal1, Per2, Rev-erbα) is comparable between PND 10 and other postnatal ages investigated (e.g., PND 2, PND 20) in the SCN. Although our complementary rhythmicity analyses (i.e., MetaCycle) did detect rhythms at PND 10, amplitudes were generally reduced relative to other developmental ages, and acrophase shifts were not directionally consistent (Supplemental Figure 1). This may be due to inbred mouse strains like C57BL being functionally melatonin-deficient. While melatonin is not necessary for rhythmicity, it may help coordinate or synchronize gene expression in extra-SCN structures (Stehle, von Gall, and Korf, 2002; Bellavia et al., 2006). Thus, melatonin-deficient mouse strains may exhibit slower consolidation of rhythmicity when exposed to multiple environmental cues during development, and PND 10 may represent a unique transitional period in circadian organization in these mice.
From gestation (Reppert and Schwartz, 1983; Torres-Farfan et al., 2006; Honma et al., 1984) until around the time of weaning, pup clocks are highly influenced by maternal-derived signals, including hormonal (Weaver and Reppert, 1995, Bellavia et al., 2006), as well as maternal care (Honma et al., 1987; Ohta et al., 2003), feeding schedules (Ohta et al., 2003; Honma et al., 1987; Sladek et al., 2025), and activity rhythms (Olejnikova et al., 2018). Concurrent with maternal signals, photic input to the circadian system is beginning to emerge. Although complete eye opening does not occur until approximately PND 12 in mice (Teraishi and Yoshioka, 2001), light information can reach the SCN earlier (Munoz Llamosas et al., 2000, Schmidt et al., 2008) via melanopsin-containing intrinsically photosensitive retinal ganglion cells (ipRGCs). During the early neonatal period (PND 0-7) in mice, ipRGCs show slow, low-amplitude depolarization to light; however, around the time of eye opening (PND 11-14), many ipRGCs acquire fast, large-amplitude depolarizations, reflecting the maturation of retinal synaptic input (Schmidt et al., 2008). Thus, at PND 10, developing circadian rhythmicity may be simultaneously influenced by maternal cues and emerging photic signals that are not yet optimally configured to support coherent molecular rhythmicity. The convergence of these cues may dampen or desynchronize molecular oscillations, providing a plausible explanation for the absence of detectable rhythmic clock gene expressions across brain regions at this age. In addition, rapid neural development around PND 10, including synaptogenesis and gliogenesis (Semple et al., 2013; Reemst et al., 2016), may also influence the robustness of circadian rhythmicity. Future studies under constant dark conditions will be especially important at PND 10, where the apparent reduction in rhythmic amplitude may reflect a transitional period in which multiple entrainment cues (e.g., maternal signals, feeding, and the light-dark cycle) are not yet fully aligned, and neural circuits are undergoing substantial maturation.
Developmental changes in circadian gene expression revealed region-specific shifts in acrophase across postnatal maturation. In the hippocampus, Per1, Per2, and Rev-erbα exhibited similar acrophases near the middle of the dark phase in neonates (PND 4). By weaning (PND 24), all 3 circadian genes were phase advanced; however, Rev-erbα now peaked several hours earlier than Per1 and Per2, which remained more closely aligned with each other. In contrast, the PFC displayed a distinct developmental trajectory. At PND 4, Per2 peaked approximately 6 h before Rev-erbα, whereas by PND 24, this relationship reversed, with Per2 peaking approximately 7 h after Rev-erbα. Per1, while not significantly rhythmic at PND 4, had an estimated acrophase similar to Rev-erbα, but by PND 24, its peak expression was more comparable to that of Per2. Circadian gene comparisons in the SCN were limited, as only Per1 had detectable rhythms at both PND 4 and PND 24. Overall, rhythms at PND 24 were phase shifted compared with mature adults (Chun et al., 2015), and the developmental shift from PND 4 to PND 24 generally occurred in the direction of the adult acrophase. This suggests that circadian timing continues to mature beyond weaning. In addition, the rhythm amplitudes were increased at PND 24 compared to younger ages, consistent with previous reports of increasing oscillatory robustness across development (Nishide et al., 2014; Yamazaki et al., 2009; Stanton et al., 2025). These developmental changes in phase and amplitude likely reflect shifting entrainment cues across early life. As pups transition from reliance on maternal-derived timing signals to increasing dependence on environmental and behavioral zeitgebers, shifts in the timing of peak clock gene expression are likely to occur. In addition, between approximately PND 14 and weaning, pups shift from suckling to consuming solid food. These changes in feeding schedules/metabolic state have been proposed as a potential driver for post-weaning phase shifts (Nishide et al., 2014).
Diurnal Rhythmicity in Corticosterone Is Present Throughout Development
Glucocorticoid signaling provides a primary pathway to entrain cells outside the SCN (Crosby, 2025), including microglia (Fonken et al., 2015). Here, we identified diurnal rhythms in serum corticosterone starting at PND 4, and rhythmic amplitude increased with age. Although one previous study did not detect corticosterone rhythms until approximately 3 weeks of age (Hiroshige et al., 1982), our findings are consistent with other reports demonstrating earlier rhythmicity (Roa et al., 2017; Ramaley, 1978). At early postnatal ages, the peak corticosterone concentration occurred during the dark phase, which may reflect the influence of nursing. In addition, corticosterone rhythms were evident at PND 10, unlike the clock gene expression throughout the brain regions we evaluated. While it is accepted that the SCN coordinates circadian glucocorticoid output, feeding behavior and metabolic signals can also influence corticosterone secretion (reviewed in Chung et al., 2011). In addition, the adrenal gland contains an intrinsic peripheral clock that contributes to the circadian glucocorticoid regulation independent of the SCN (Son et al., 2008), and neonatal adrenals rhythmically express clock gene expression (Yamazaki et al., 2009; Nishide et al., 2014; Roa et al., 2017). Therefore, the presence of glucocorticoid rhythmicity prior to robust clock gene oscillations in some brain regions suggests that endocrine rhythms may emerge independently of fully mature central clock gene expression. This may reflect earlier maturation of peripheral oscillators, such as the adrenal gland, and/or the influence of maternal, feeding-related, or SCN-independent cues during early development. Alternatively, there may be rhythmic gene expression in the SCN that was not detected by our limited sampling of 4 time points. Finally, we identified a sex difference at PND 24, such that males exhibited a pattern resembling the PND 10 rhythm, whereas females displayed a rhythm comparable to adults (Son et al., 2008). This is in line with female mice reaching sexual maturity (puberty) faster than males (Chester et al., 2022, Cross et al., 2020), suggesting that females may be developmentally more advanced at PND 24 despite being the same chronological age as males. Interestingly, a similar finding has been reported in humans, where more advanced pubertal maturation in females relative to males is associated with adult-like cortisol patterns (van Keulen et al., 2020). Collectively, early endocrine rhythmicity is already present during a developmental window in which clock gene rhythms are still emerging in a subset of brain regions.
Time-of-Day Fluctuations Are Detectable in the Neuroimmune System During Development
Because the immune system is regulated by circadian mechanisms and the neuroimmune system (e.g., microglia, meninges, choroid plexus) is essential for normal brain development (reviewed in Chen et al., 2023), we next evaluated whether circadian regulation is established within these tissues during early life.
Microglia are the resident innate immune cells of the brain, serving essential roles in immune surveillance, phagocytosis, cytokine signaling, and synaptic pruning (Chen et al., 2023). In adult animals, microglia are under circadian control: they rhythmically express molecular clock components (Fonken et al., 2016; Fonken et al., 2015; Hayashi et al., 2013) and display diurnal variations in morphology and function. More specifically, time-of-day differences in microglial phagocytosis (Fonken et al., 2016; Griffin et al., 2020) and synaptic pruning (Hayashi et al., 2013; Nakanishi et al., 2021) occur in adult animals; these processes are critical for neurodevelopmental refining of synaptic circuits (Schafer et al., 2012).
Our results demonstrate microglial markers Iba1 and Cd68 exhibit time-of-day variation in both SCN and extra-SCN brain regions, suggesting that microglial activity is temporally regulated during development. At PND 24, the emergence of rhythmic Cd68 and Iba1 expression coincided with the increased amplitude of the Rev-erbα rhythms. REV-ERBα regulates innate immune activities (Gibbs et al., 2012), and recent studies indicate that it modulates microglia-mediated synaptic phagocytosis (Griffin et al., 2020; Kou et al., 2022; Wolff et al., 2020). Consistent with this, we observed time-of-day variation in microglial phagocytic activity across development. Together, these findings support a potential role for circadian mechanisms in shaping microglial activity in the developing brain.
The time-of-day variation in microglial phagocytic activity was observed despite the absence of detectable gene expression differences. Although clock genes are present in microglia isolated from neonatal mouse brains (Nakazato et al., 2011), microglia from PND 10 and PND 24 did not show time-of-day differences in Per1 or Rev-erbα expression. Nevertheless, microglia isolated at ZT6 had greater phagocytic activity than those isolated at ZT18. While some studies report greater microglial phagocytic activity during the dark phase based on immunohistochemistry (Griffin et al., 2020) or elevated expression of phagocytosis-associated genes (Mattei et al., 2024), our findings align with reports showing that isolated macrophages, including microglia (Choudhury et al., 2020) and peritoneal macrophages (Hayashi et al., 2007), exhibit greatest phagocytic activity during the light phase. Other evidence further supports greater microglial phagocytosis during the light phase. This includes elevated Cd68 expression in the hippocampus at ZT6 relative to ZT18 (Fonken et al., 2016), time-of-day dependent changes in microglial morphology (Fonken et al., 2016) characterized by retraction of processes (consistent with enhanced phagocytic activity) commonly reported in the light phase (Ince et al., 2026; Takayama et al., 2016), and lower mean neuronal spine density during the rat’s active (dark) phase, consistent with increased microglia-mediated phagocytic elimination of synaptic elements occurring during the light (rest) phase (Nakanishi et al., 2021). Limited sampling across ZTs may contribute to inconsistencies between studies, highlighting the need for future work to incorporate more comprehensive within-day sampling.
The choroid plexus is increasingly recognized for its importance during development, as well as its potential role in circadian rhythm regulation (Saunders et al., 2023; Myung et al., 2018). Indeed, the adult choroid plexus exhibits oscillatory expression of molecular clock genes (Quintela et al., 2021). Consistent with this, we observed a robust time-of-day difference in the expression of Rev-erbα at PND 24; however, this was not present at PND 10. It should be noted that the absence of detectable time-of-day differences at PND 10 does not preclude the presence of oscillations, as sampling times (ZT 6 and ZT 18) may not have captured the peak and nadir of gene expression.
In addition to the choroid plexus, the meninges represent another key neuroimmune interface that is under circadian regulation. Interestingly, time-of-day differences in Per1 and Rev-erbα were present at both PND 10 and PND 24. To our knowledge, this is the first report characterizing circadian gene expression in the (developing) meninges. This finding is notable given the unique role of the meninges as an immune hub for resident and peripheral immune cells (Marin and Kipnis, 2017; Barr et al., 2025) and their location within a cerebrospinal fluid-rich compartment that may convey circadian signals (Vizcarra et al., 2024; Steffensen et al., 2023).
While our findings demonstrate time-of-day differences across different ages, we were unable to evaluate the expression of other canonical core clock genes (Arntl, Casein kinase 1ε, Rorα, Cry1, Cry2, etc.), which restricts mechanistic interpretation. Future studies incorporating a broader set of circadian-related genes would provide a more holistic view of the molecular clock dynamics and strengthen our current understanding of the ontogeny of circadian rhythms. In addition, an important limitation of the present study is the temporal sampling (Hughes et al., 2017). Reduced sampling frequency (e.g., ≥4 h intervals over 24-48 h) can limit statistical power and decrease sensitivity for detecting low-amplitude rhythms. It may also limit the precision of acrophase estimate. As a result, some weak oscillations may not meet statistical thresholds for rhythmicity despite the underlying biological structure.
In conclusion, our findings indicate that clock and neuroimmune genes exhibit rhythmicity across multiple brain structures during postnatal development, albeit with distinct timing and organization. Across brain regions, rhythmic mRNA expression of clock genes emerged at PND 1 depending on the gene, and peak expression advanced between PND 4 and PND 24. Microglia markers Iba1 and Cd68 exhibited diurnal oscillations by PND 24. Across neuroimmune tissue, time-of-day differences in clock gene expression appeared in the choroid plexus and meninges by at least PND 24, while microglia exhibited time-of-day differences in functional activity despite minimal molecular differences. These results suggest that circadian rhythmicity during development is spatially and temporally heterogeneous. Understanding when circadian rhythms emerge is particularly important because early-life circadian disruption has been linked to later mood-related behavioral alterations (Delorme et al., 2023), highlighting circadian timing as a potential target for early intervention. This early, multilevel organization may provide a critical framework for coordinating immune signaling, barrier function, and neurodevelopment and may represent a window of vulnerability during which circadian disruption could exert long-lasting effects on brain health.
Supplemental Material
sj-docx-1-jbr-10.1177_07487304261449282 – Supplemental material for The Ontogeny of Rhythms in Circadian Clock Gene Expression in Mouse Brain and Neuroimmune Tissues
Supplemental material, sj-docx-1-jbr-10.1177_07487304261449282 for The Ontogeny of Rhythms in Circadian Clock Gene Expression in Mouse Brain and Neuroimmune Tissues by Kiersten S. Bell, Ruizhuo Chen, Aidan S. Weitzner and Laura K. Fonken in Journal of Biological Rhythms
Footnotes
Acknowledgements
We would like to thank The University of Texas at Austin, College of Pharmacy Animal Research Care staff for helping with our animal care and Dr. Louise Ince for helpful discussions and comments regarding the experimental protocol and analysis. This work was supported by NIH grants R01AG078758 to L.K.F. and 1F31MH138131 to K.S.B. Graphical abstract created in BioRender.com.
Author Contributions
Kiersten S. Bell contributed to writing (original draft preparation, review, and editing), visualization, methodology, investigation, formal analysis, data curation, and funding acquisition. Ruizhuo Chen contributed to writing (original draft preparation, review, and editing), visualization, methodology, investigation, formal analysis, and data curation. Aiden S. Weitzner contributed to investigation and writing (review and editing). Laura K. Fonken contributed to conceptualization, methodology, investigation, validation, supervision, resources, project administration, funding acquisition, and writing (review and editing).
Conflict of Interest Statement
The authors have no potential conflicts of interest with respect to the research, authorship, and/or publication of this article.
Ethical Considerations
All animal protocols were approved by The University of Texas at Austin Institutional Animal Care and Use Committee (IACUC) and conducted in accordance with local and national guidelines.
Consent to Participate
Not applicable.
Consent for Publication
Not applicable.
Notes
References
Supplementary Material
Please find the following supplemental material available below.
For Open Access articles published under a Creative Commons License, all supplemental material carries the same license as the article it is associated with.
For non-Open Access articles published, all supplemental material carries a non-exclusive license, and permission requests for re-use of supplemental material or any part of supplemental material shall be sent directly to the copyright owner as specified in the copyright notice associated with the article.