
Abstract
Night shift work is linked to more severe coronavirus pneumonia, suggesting that host resilience to these pathogens may depend on the timing of exposure. Here, we examined how the time of day influences the severity of coronavirus pneumonia in mice, using mouse hepatitis virus-1 (MHV-1) as a natural infection model. We found that the timing of infection influenced MHV-1 severity, with the highest mortality, peak viral load, and lung inflammation occurring with midday infection, which corresponds to the mid-rest phase in mice and is comparable with nighttime in humans. The time-of-day dependence in disease severity occurred prominently in males and was sensitive to global disruption of the clock gene Bmal1. Midday infection correlated with increased MHV-1 binding to and replication within alveolar macrophages (AM). Depleting AMs with clodronate or loading them with neutral liposomes before MHV-1 infection eliminated differences in pneumonia survival and peak viral load related to the timing of infection. These data suggest an immunologic rhythm underlying coronavirus outcomes, in which oscillations in “first contact” interactions between AMs and the virus shape subsequent pneumonia severity.
Respiratory viruses contribute to about 2 million deaths each year (Troeger et al., 2018). This statistic reflects the impact of endemic viruses, but another concern is the emergence of new pneumonia viruses that lead to epidemics. In the 21st century, there have been three such outbreaks from the coronavirus family: Severe Acute Respiratory Syndrome (SARS) in 2002, caused by SARS-CoV-1; Middle Eastern Respiratory Syndrome (MERS) in 2012, caused by MERS-CoV; and Coronavirus Disease 2019 (COVID-19), caused by SARS-CoV-2 (Gorbalenya et al., 2020). The SARS and MERS outbreaks proved self-limiting, whereas the COVID-19 pandemic necessitated a costly, worldwide vaccination and infection control program. While most patients experience mild symptoms, some continue to develop severe disease that stems from an early, uncontrolled inflammatory response resulting in respiratory failure. The high mutation rate typical of coronaviruses suggests that novel, medically significant viruses are likely to emerge from this family in the future. Understanding how host characteristics influence the clinical trajectory of coronavirus pneumonia could be useful. One potential factor is biological rhythms, especially circadian rhythms.
Circadian rhythms are daily fluctuations in biological function that originate from a cell-intrinsic transcription factor network known as the molecular “clock” (Nosal et al., 2020; Mok et al., 2024). Through transcriptional and post-transcriptional regulation, the clock generates 24-h cycles in cellular physiology specific to each cell type (Zhang et al., 2014; Mure et al., 2018). Cellular circadian rhythms are believed to be kept in alignment across the organism by pulsatile neurohumoral cues emanating from a light-sensitive “central pacemaker” in the suprachiasmatic nucleus (SCN). Coherent cellular circadian rhythms enable the emergence of rhythms in organ systems, including the immune system (Scheiermann et al., 2018).
Broadly speaking, host susceptibility to infectious agents, including viruses, depends on the time of day exposure occurs, suggesting involvement of circadian or diurnal rhythms (Rijo-Ferreira and Takahashi, 2022). Conversely, weak or disrupted behavioral circadian rhythms are associated with worse pneumonia outcomes (Fatima et al., 2021; Brooks et al., 2023). Specific to coronaviruses, the existing clinical and pre-clinical circadian literature originates from the recent COVID-19 pandemic. Studies found that circadian rhythm misalignment, via night shift work or social jet lag, is a risk factor for COVID-19 pneumonia (Fatima et al., 2021; Maidstone et al., 2021; Coelho et al., 2022; Loef et al., 2022). In infected individuals, SAR-CoV-2 positivity rates varied with the time of day samples were collected, suggesting rhythms in coronavirus replication, viral clearance, or test sensitivity (McNaughton et al., 2021; Viloria Winnett et al., 2022; Hazan et al., 2023). Preclinically, one study observed rhythms in SARS-CoV-2 viral entry into epithelial cells attributed to oscillations in angiotensin converting enzyme 2 (ACE2), its receptor (Zhuang et al., 2021). Another report found that the accessory clock protein CIART regulated SARS-CoV-2 replication in epithelial cells by modulating fatty acid synthesis (Tang et al., 2023). However, these studies relied on reductive epithelial cell models devoid of an immune system, and which could not recapitulate pneumonia. Most coronaviruses do not use ACE2 as a receptor, so rhythms in this protein may not apply to future coronavirus outbreaks.
Here, we took an in vivo approach to examine how the time of day influences the development of coronavirus pneumonia in mice. The experiments employed mouse hepatitis virus-1 (MHV-1) as a natural infection model of coronaviral pneumonia. MHV-1 is a beta-coronavirus native to rodents that, when given intranasally to A/J mice, produces a dose-dependent pneumonia. While it is genetically most similar to human coronavirus HKU1, MHV-1 induces histologic features shared by all coronaviral pneumonias, including SARS, MERS, and COVID-19 (De Albuquerque et al., 2006; Körner et al., 2020; Zhou et al., 2020; Andrade et al., 2021; Paidas et al., 2021; Pathak et al., 2021; Tian et al., 2021). Our data show that multiple aspects of MHV-1 pneumonia vary based on the time of day exposure occurs, including survival, viral kinetics, and lung inflammation. Importantly, the rhythm in MHV-1 survival correlates with oscillations in viral permissiveness in alveolar macrophages (AMs), the lungs’ primary sentinel immune cells.
Methods
Mice
A/J mice were sourced from Jackson Labs. Bmal1-iKO and Bmal1 conditional mice were backcrossed for at least five generations onto the A/J genetic background and confirmed to be at least 95% backcrossed using a commercial RFLP assay (Charles River). Supplementary Table S1 lists the genotypes of all mouse lines used, and their empirically determined LD50 dose of MHV-1. Mice were sourced at 6-8 weeks of age for experiments and were 8-11 weeks old at the time of viral infection (allowing 2-3 weeks for acclimation to custom photoperiods as detailed below). Mice were housed in shoebox-sized cages in a 12-h light-dark cycle with food available ad libitum. To induce Bmal1 recombination in Bmal1-iKO and Bmal1-cc10ERTCre mice, they received i.p. injections of 100 mg/kg tamoxifen in 100 μL corn oil daily for 5 days. Recombination was quantified by qPCR as described (Ehlers et al., 2018) and, in the case of Bmal1-iKO mice, confirmed by actigraphy under constant dark conditions (Suppl. Fig. S1). In experiments to test the role of estrogen in MHV-1 diurnal rhythms (Suppl. Fig. S2), mice were fed tamoxifen-laden chow for 30 days and then rested on 7 days of regular chow before infection. To adjust the circadian phases of mice, they were acclimated in custom light-tight enclosures (Gorilla Grow Tent) for 2 weeks with the light cycle controlled by a programmable timer (Figure 1a). This enabled us to model infections at different points of the circadian cycle with a single bout of virus exposure (done by convention at 12:00, see below). After viral infection, mice were housed in constant dark conditions until the end of the experiment. Littermate controls were employed for all experiments. Male and female mice were assayed in parallel, and the data were disaggregated to analyze sex contributions per NIH guidance (available at https://orwh.od.nih.gov/sites/orwh/files/docs/NOT-OD-15-102_Guidance_508.pdf). The Washington University School of Medicine Institutional Review Board approved all experiments. Mouse actigraphy was recorded in individually housed mice using passive IR monitors, and data were analyzed using ClockLab software (Actimetrics).
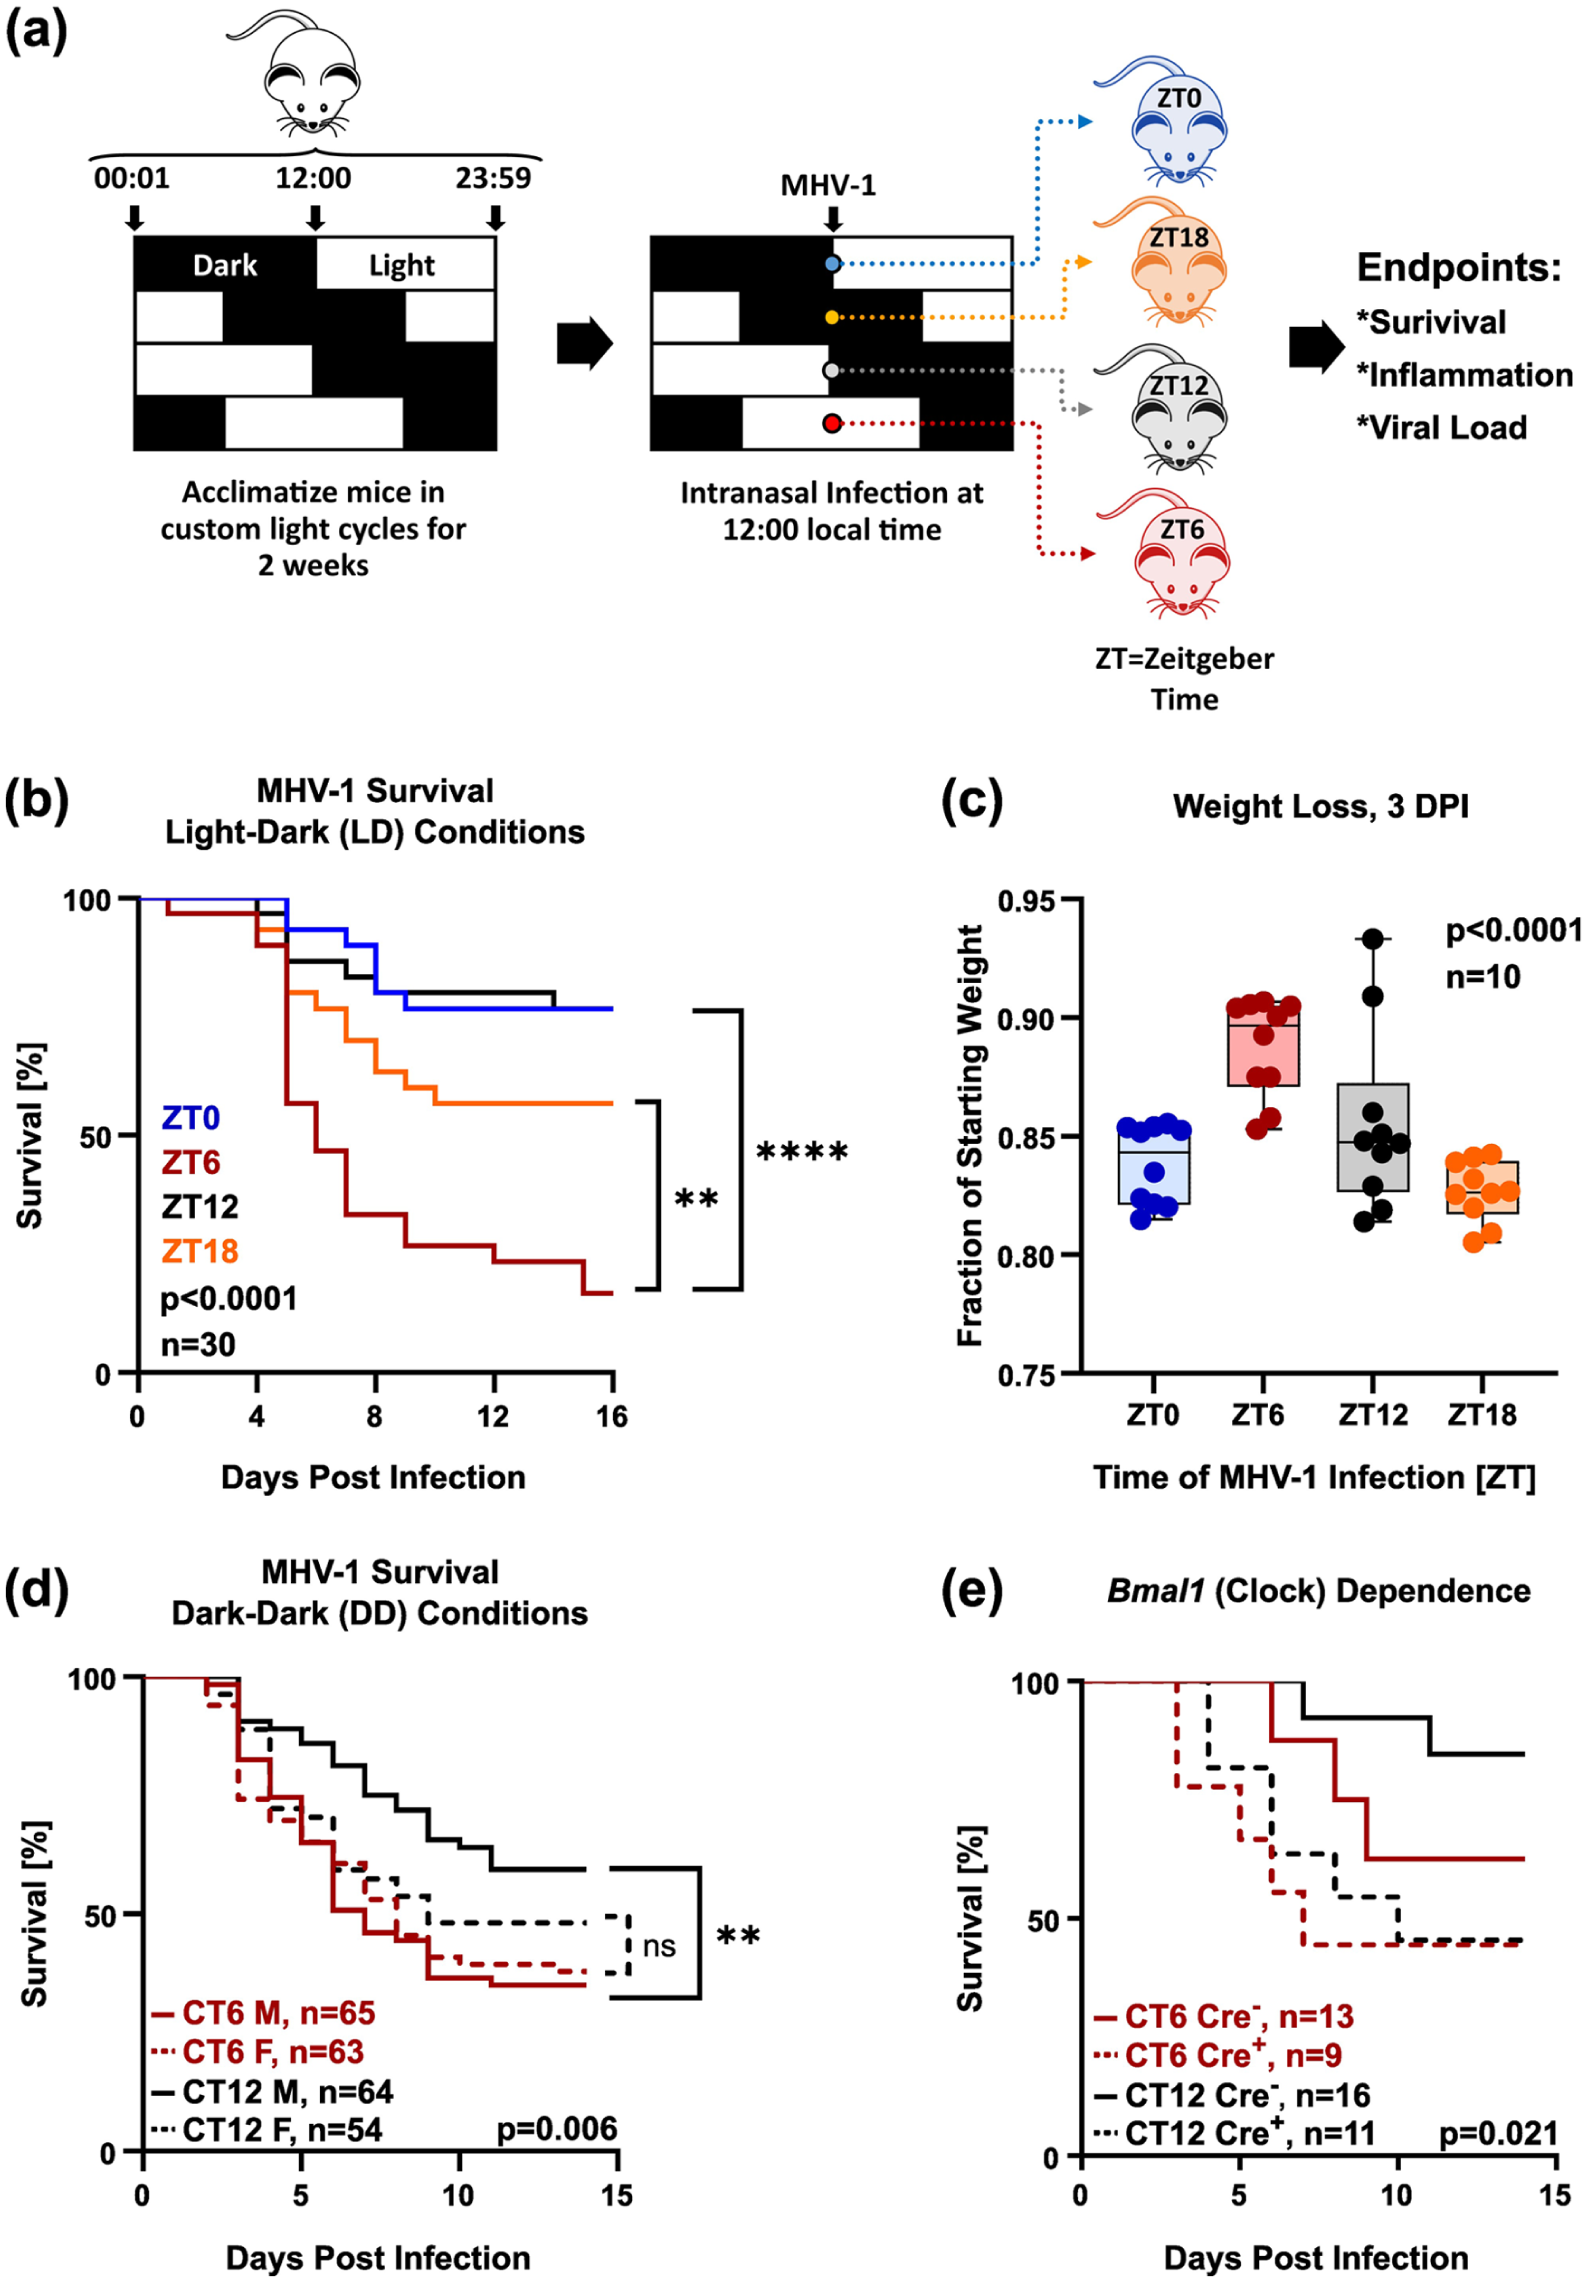
Time of day influences survival in MHV-1 pneumonia. Panel (a) depicts the protocol schematic. Note that zeitgeber time 0 (ZT0) denotes light onset and ZT12 dark onset. Panel (b) depicts the survival of 6- to 8-week-old male A/J mice that were intranasally infected with MHV-1 (20,000 pfu of crude viral S1, n = 30/group). Data are pooled from three independent experiments. Panel (c) is a box plot depicting weight loss 3 days post-MHV-1 infection with 20,000 crude viral S1 (n = 10/group). Bars represent 25%-75% confidence intervals; horizontal lines denote the median. Panel (c) shows survival in male and female mice placed into constant darkness (DD) 1 day prior to infection with MHV-1 (500 pfu PEG precipitated virus), and maintained under DD conditions thereafter. Mice were infected at circadian time 6 (CT6) or CT12, corresponding to subjective midday and midnight. Data are pooled from five independent experiments in which males and females were tested in parallel (n = 54-63/group). Panel (d) shows MHV-1 survival (500 pfu PEG precipitated virus/mouse) in tamoxifen-treated male Bmal1-iKO mice (Cre+, yielding global post-natal deletion) versus wt (Cre−) littermates. Data are pooled from two independent experiments (n = 9-16/group). Log-rank test p-values for trend are depicted. *< 0.05; **< 0.005, ****< 0.00005, log rank test.
Virus
We sourced MHV-1 virus from ATCC. To ensure pneumovirulence, the virus was serially passaged nine times in A/J mouse lungs, using homogenates obtained at 3 DPI to inoculate each subsequent passage. Working MHV-1 stock for experiments was then generated by inoculating J774.a1 cells grown in DMEM, 10% FBS, and penicillin-streptomycin (Compton et al., 1995). In initial experiments (Figure 1a), we adhered to established protocols for MHV-1 infection that called for inoculating mice with virus-containing cultured supernatants (S1) (De Albuquerque et al., 2006; Masciarella et al., 2023). We empirically determined the LD50 to be 20,000 pfu using this virus preparation, while 1500 pfu produced a sublethal pneumonia. However, while standard, the use of crude viral S1s left open the possibility that our observations of a biological rhythm in MHV-1 severity might be due to a media contaminant. Therefore, we altered our protocol to use MHV-1 virus partially purified and concentrated via PEG precipitation (Torii et al., 2022). Briefly, MHV-1 containing cultured S1 was precipitated with 50 mM Tris pH7.5, 100 mM MgSO4, and 5.5% PEG-6000. After a 2-h incubation at 4 °C, the virus was pelleted by spinning at 3250 g for 20 min at 4 °C. The pellet was resuspended in NT buffer (150 mM NaCl, 50 mM Tris, pH 7.5). Viral titer was determined by TCID50 assay, using a conversion factor of 0.7 to convert from TCID50 units to plaque-forming units (pfu) (Shuipys and Montazeri, 2022). Regardless of the viral preparation method, we empirically determined LD50 doses for each mouse strain used in the experiments (Suppl. Table S1) and verified the LD50 dose for each new lot of virus. We determined the LD50 dose of PEG-precipitated MHV-1 virus was 500-1500 pfu in our model (Suppl. Table S1). In addition, 100 pfu of PEG-precipitated virus produced sublethal infection equivalent to that of 1500 pfu of crude viral S1, as indicated by similar weight loss and peak lung viral RNA expression. We obtained similar results across viral preparations and aggregated the data to arrive at robust conclusions.
MHV-1 Infection
Mice were anesthetized with 3% isoflurane and then intranasally treated with 30 μL of virus diluted in phosphate-buffered saline (PBS). Intranasal instillations were performed under low-intensity red-spectrum light to avoid disrupting the animals’ circadian phase. As a rule, all mouse infections occurred at 12:00 local time. For endpoint analyses in sub-lethally infected mice, animals were also sacrificed at 12:00 local time, ensuring that the circadian phase of all in vivo observations always matched the phase of the MHV-1 exposure. For in vitro infections, cells were washed with PBS, then incubated with virus-containing media for 1 h at 37 °C. Cells were then washed, re-plated with fresh media, and returned to the incubator.
AM Depletion
Mice were intranasally treated with clodronate liposomes as described (Gibbings et al., 2015; Hazan et al., 2022). Briefly, isoflurane-anesthetized mice were intranasally administered 40 μL high-potency clodronate liposomes (20 mg/mL) or neutral liposomes (FormuMax) 4 and 2 days before MHV-1 infection. Depletion of AMs was confirmed by flow cytometry.
Flow Cytometry
Lungs were minced and resuspended in dissociation media with RPMI, DNase, Liberase, and hyaluronidase (Ehlers et al., 2018). They were then mechanically dissociated using a GentleMACs Octo tissue homogenizer using the program 37C_m_LDK_1 (Miltenyi Biotec). The resultant cell suspension was passed through a 70-μM filter. RBCs were lysed, and cells were counted using a Cellometer instrument (Nexcelom Biosciences). Surface flow cytometry was performed on an Attune NxT instrument (Thermo Fisher) using standard techniques. See Supplementary Table S2 for a list of antibodies and Supplementary Figure S3 for representative gating.
Bronchoalveolar Lavage (BAL) Studies
To obtain BALs, mice were euthanized and their trachea cannulated with a 20G flexible catheter, 1-2 mm distal to the larynx. The lungs were then slowly lavaged in two passes with a total of 1 ml sterile PBS. To microscopically examine BAL cells, 50 μL of BAL suspension was adsorbed to frosted glass slides using a Cytospin 4 centrifuge (Thermo Fischer) and treated with Diff-Kwik stain (Thermo Fischer). BAL cell counts and cell differentials were measured as described (Hazan et al., 2022). For RNA, BAL cells were centrifuged at 3000 × g for 5 min at 4 °C, the pellet was washed twice in PBS, and then resuspended in RLT buffer (Qiagen). We used the BCA assay to determine BAL protein concentration (Thermo Fisher). BAL cytokine analysis employed the V-PLEX Mouse Cytokine 19-plex kit (Meso Scale) via a Meso Scale Discovery QuickPlex-120 instrument available at the Washington University Immuno-monitoring Lab. In other experiments, AMs obtained from BALs were cultured as described (Subramanian et al., 2022).
Respiratory System Mechanics Measurement
Respiratory system mechanics were measured using a Buxco Elan RC mouse volume-controlled ventilator, as described (Hazan et al., 2022). Briefly, mice were anesthetized with an i.p. injection of a ketamine/xylazine cocktail, and then a tracheostomy was performed using a 20G flexible catheter. Mice were then connected to the ventilator, and 30 μL of PBS was administered using an in-line nebulizer. Dynamic respiratory system compliance (Cdyn) was then measured over a 5-min epoch, and the average value was recorded.
Detection of Virus Adsorption
Mice were intranasally infected with 100 pfu MHV-1 as outlined above. At 3-h and 24-h post-infection, mice were euthanized and serially lavaged five times with fresh PBS. BAL cells obtained from the first lavage were centrifuged and washed five times with cold PBS to remove any unbound virus. Total RNA was isolated using RNeasy Mini Kits (Qiagen). MHV-1 RNA was quantified with the ABI 7500 Fast Real-Time PCR system.
RNAseq
Bulk RNAseq was performed at the Washington University Genome Technology Access Center (GTAC) using their standard pipeline for differential gene expression analysis. Briefly, RNA from whole lung homogenates or BAL cell pellets was converted to cDNA libraries for sequencing using the SMARTer kit (Clontech). Sequencing was performed on a NovaSeq 6000 instrument (Illumina). RNA-seq reads were aligned to the Ensembl release 76 assembly and the MHV-1 genome assembly (ASM397178v1) with STAR version 2.0.4b. Gene counts were derived from the number of uniquely aligned unambiguous reads by Subread:featureCount version 1.4.5. Transcript counts were produced by Sailfish version 0.6.3. Sequencing performance was assessed for the total number of aligned reads, the total number of uniquely aligned reads, genes and transcripts detected, ribosomal fraction-known junction saturation, and read distribution over known gene models using RSeQC version 2.3. Gene-level and transcript counts were then imported into the R/Bioconductor EdgeR package, and TMM normalization size factors were calculated to adjust for differences in library size across samples. Genes or transcripts not expressed in any sample were excluded from further analysis. The TMM size factors and the matrix of counts were imported into the R/Bioconductor package Limma (Ritchie et al., 2015), and weighted likelihoods based on the observed mean-variance relationship for each gene/transcript were then calculated for all samples using the Voom function (Law et al., 2014). The performance of the samples was assessed using a Spearman correlation matrix and multidimensional scaling plots. Gene/transcript performance was assessed using plots of the residual standard deviation for each gene relative to its average log-count, with a fitted trend line for the residuals. Generalized linear models with dispersion estimates were then fit to test for gene- and transcript-level differential expression. Differentially expressed genes and transcripts were then filtered for FDR-adjusted p-values < 0.05. We performed functional enrichment analysis using ENRICHR (Xie et al., 2021). To quantify the magnitude of time-of-day effects, we analyzed the absolute values of CT6: CT12 expression ratios for each differentially expressed gene (DEG), comparing male and female results. RNA-seq data are available in the NIH GEO (GSE301278) and are presented as limma-voom-moderated Log2CPM in Supplementary Data 1 and 2.
Quantitative PCR (qPCR)
RNA extraction and qPCR were done according to standard protocols (Ehlers et al., 2018). For in vivo experiments, lungs were manually excised and immersed in RNAlater solution (Applied Biosystems). Total RNA was isolated from lung homogenates using RNeasy Mini Kits (Qiagen) or TRIzol (Thermo Fisher) according to standard protocols. Reverse transcription was carried out using the Applied Biosystems High-Capacity cDNA Reverse Transcription Kit. Real-time qPCR was performed on the ABI 7500 Fast Real-Time PCR System. To measure viral copy number in BAL or cultured S1, we used the Qiagen Viral RNA kit according to the manufacturer’s protocol, extrapolating from a standard curve of known pfu. Primers used for qPCR are listed in Supplementary Table S3.
Histology and Immunostaining
Lungs were fixed by inflation with 10% buffered formalin at 20 cmH2O, paraffin-embedded, and stained with H&E or subjected to immunofluorescence (IF) staining using standard techniques (Ehlers et al., 2018). For histological quantification of lung cellularity, H&E-stained slides were digitally scanned with a PANORAMIC 250 Flash III (3DHistech) and analyzed with VIS image analysis software (Visopharm) at the Washington University Alafi Neuroimaging Core. Immunostained slides were digitally scanned on a Zeiss Axioscan instrument and quantified using Zen Blue software (Zeiss). Double blinding was employed during quantification.
Real-Time Circadian Reporter Assay
Real-time luciferase activity was captured using a Kronos Dio instrument (ATTO), essentially as described (Yoo et al., 2004). Briefly, primary AMs derived from Per2-Luciferase knock-in mice (Jackson Labs) were incubated in phenol red-free media containing 150 μg/mL Luciferin (Thermo Fisher). Cells were synchronized with serum shock (50% Horse serum for 2 h) before recording.
Statistics
Survival analyses employed the log-rank test. For other comparisons, we used the Student two-tailed t test of log-transformed data, analysis of variance (ANOVA) of log-transformed data, or the Mann-Whitney U test, as indicated. Blinding was used throughout the analysis. All results were pooled from at least two experiments. Statistical tests were performed using Microsoft Excel and GraphPad Prism.
Results
MHV-1 Pneumonia Survival Varies With the Timing of Viral Infection
Published methods for the MHV-1 pneumonia model called for infecting male A/J mice kept under standard 12-h light-dark (LD) conditions with crude viral supernatant (S1) (De Albuquerque et al., 2006; Körner et al., 2020; Zhou et al., 2020; Andrade et al., 2021; Paidas et al., 2021; Pathak et al., 2021; Tian et al., 2021). To incorporate the timing of viral exposure into this established model, we acclimated groups of mice to four 12-h photoperiods, each separated by 6 h (Figure 1a). This enabled us to simultaneously model infections at different points in the circadian cycle following a single MHV-1 exposure at an empirically determined 50% lethal (LD50) dose (20,000 pfu). The virus was administered intranasally at 12:00 local time, corresponding to biological zeitgeber times (ZT) 0, 6, 12, and 18 (ZT0 representing lights-on and ZT12 representing lights-off). We found that survival after MHV-1 infection varied widely in male mice depending on the time of infection (Figure 1b). The association between MHV-1 survival and time of day showed a bimodal pattern, with higher mortality at the midpoints of the rest and activity cycles in mice (ZT6 and ZT18, respectively). Lower mortality occurred with ZT0 and Z12 infections, corresponding to simulated dawn and dusk. Weight loss assessed before the onset of mouse deaths (at 3 days post-infection or DPI) also varied with infection timing. Still, it did not predict survival probability and, interestingly, was least severe in the highest-mortality exposure (ZT6 infection; Figure 1c). For further characterization, we focused on MHV-1 infections at ZT6 and ZT12, corresponding to the times of highest and lowest mortality, respectively.
To assess the robustness of our observations, we investigated how specific details of the established MHV-1 protocol may have influenced results. First, we repeated infection time-of-day experiments using PEG-precipitated MHV-1 preparations at an empirically determined LD50 dose (500 pfu) to exclude non-viral components that could have contributed to our observations. Second, we placed mice under constant dark (DD) conditions starting 24 h before infection, thereby addressing whether ongoing light exposure was critical for time-of-day effects (expressed in circadian time (CT) nomenclature, where CT0 is equivalent to ZT0 and CT12 to ZT12). Third, we infected both female and male mice to examine the contribution of sex to our findings. Survival differences based on infection time of day were maintained with PEG-precipitated MHV-1 virus and under DD lighting conditions, with CT6 exposure producing higher mortality than CT12 (Figure 1d). In contrast, the time-sensitivity of MHV-1 survival proved sex-specific: robust in males but apparent only as a non-significant trend in females (Figure 1e and Suppl. Fig. S4). Estrogen antagonism with tamoxifen did not unmask a biological rhythm in female MHV-1 survival, nor did it suppress the phenomenon in males (Suppl. Fig. S2).
To assess whether a functional circadian clock is needed for these observations, we used Bmal1-iKO mice backcrossed onto the A/J background (see Methods). This inducible strain globally deletes the DNA-binding domain of the core clock gene Bmal1, making mice behaviorally arrhythmic (Suppl. Fig. S1) (Ehlers et al., 2018). Global Bmal1 deletion eliminated differences in survival between CT6- and CT12-infected mice (Figure 1d). However, the timing effect remained in mice with selective Bmal1 deletions in myeloid cells (LysMCre-Bmal1) or airway epithelial cells (Scgb1a1-CreER-Bmal1) (Suppl. Fig. S5).
To summarize, survival after MHV-1 pneumonia varied with the timing of virus exposure and exhibited characteristics of an inherent biological rhythm, including persistence under constant dark conditions and a genetic dependence on clock gene Bmal1. Notable aspects of this rhythm include that (1) it is more evident in males than females; (2) it does not require Bmal1 function in myeloid or airway epithelial cells; (3) it has a different acrophase than observed for other respiratory viruses (CT6 versus CT11 for influenza or ZT18 for Sendai virus) (Ehlers et al., 2018; Sengupta et al., 2019; Naik et al., 2023); and (4) it fit an ultradian(12-h) pattern rather than a conventional circadian (24 h) periodicity.
Time of Day Influences an Early Stage of MHV-1 Pneumonia
We used sublethal MHV-1 exposure to compare physiological, infectious, immunological, and transcriptomic endpoints in mice inoculated at CT6 versus CT12. Experiments employed both PEG-precipitated and crude MHV-1 preparations, which were titrated to achieve equivalent levels of weight loss and viral load (Figure 2a and 2b). To keep the duration of infection constant across comparison groups, MHV-1 infections and sample collections were performed at 12:00 local time, keeping the circadian phase of MHV-1 exposure and subsequent observations consistent. In this sublethal pneumonia model, mice progressively lost weight from 3-8 days post-MHV-1 infection (DPI) and began regaining weight by 10 DPI (Figure 2a). Lung viral RNA expression peaked at 2-3 DPI and then declined (Figure 2b). Sickness behavior, as indicated by decreased locomotor activity, began as early as 2 DPI and continued until 10 DPI (Figure 2c). Gene expression markers of inflammation and Type I interferon signaling were evident as early as 2 DPI, as indicated by Il6 and Ifit2 induction, respectively (Figure 2d). Sublethal MHV-1 infection tended to reduce the amplitude of certain clock genes and clock-controlled genes (Bmal1, Nr1d1, and Dbp), while leaving others (Per2) unaffected (Suppl. Fig. S6a-S6d). The onset of amplitude damping differed between clock genes, with Nr1d1 showing transient suppression between 3-5 DPI, while Bmal1 amplitude damped later (5 DPI, Suppl. Fig. S6e and S6f). In studies of other inflammatory models, clock gene expression changes of this kind were associated with circadian transcriptome reprogramming (Eckel-Mahan et al., 2013; Haspel et al., 2014; Sheehan et al., 2025). With the sublethal MHV-1 infection model thus established, we compared responses to CT6-timed infection with those to CT12.
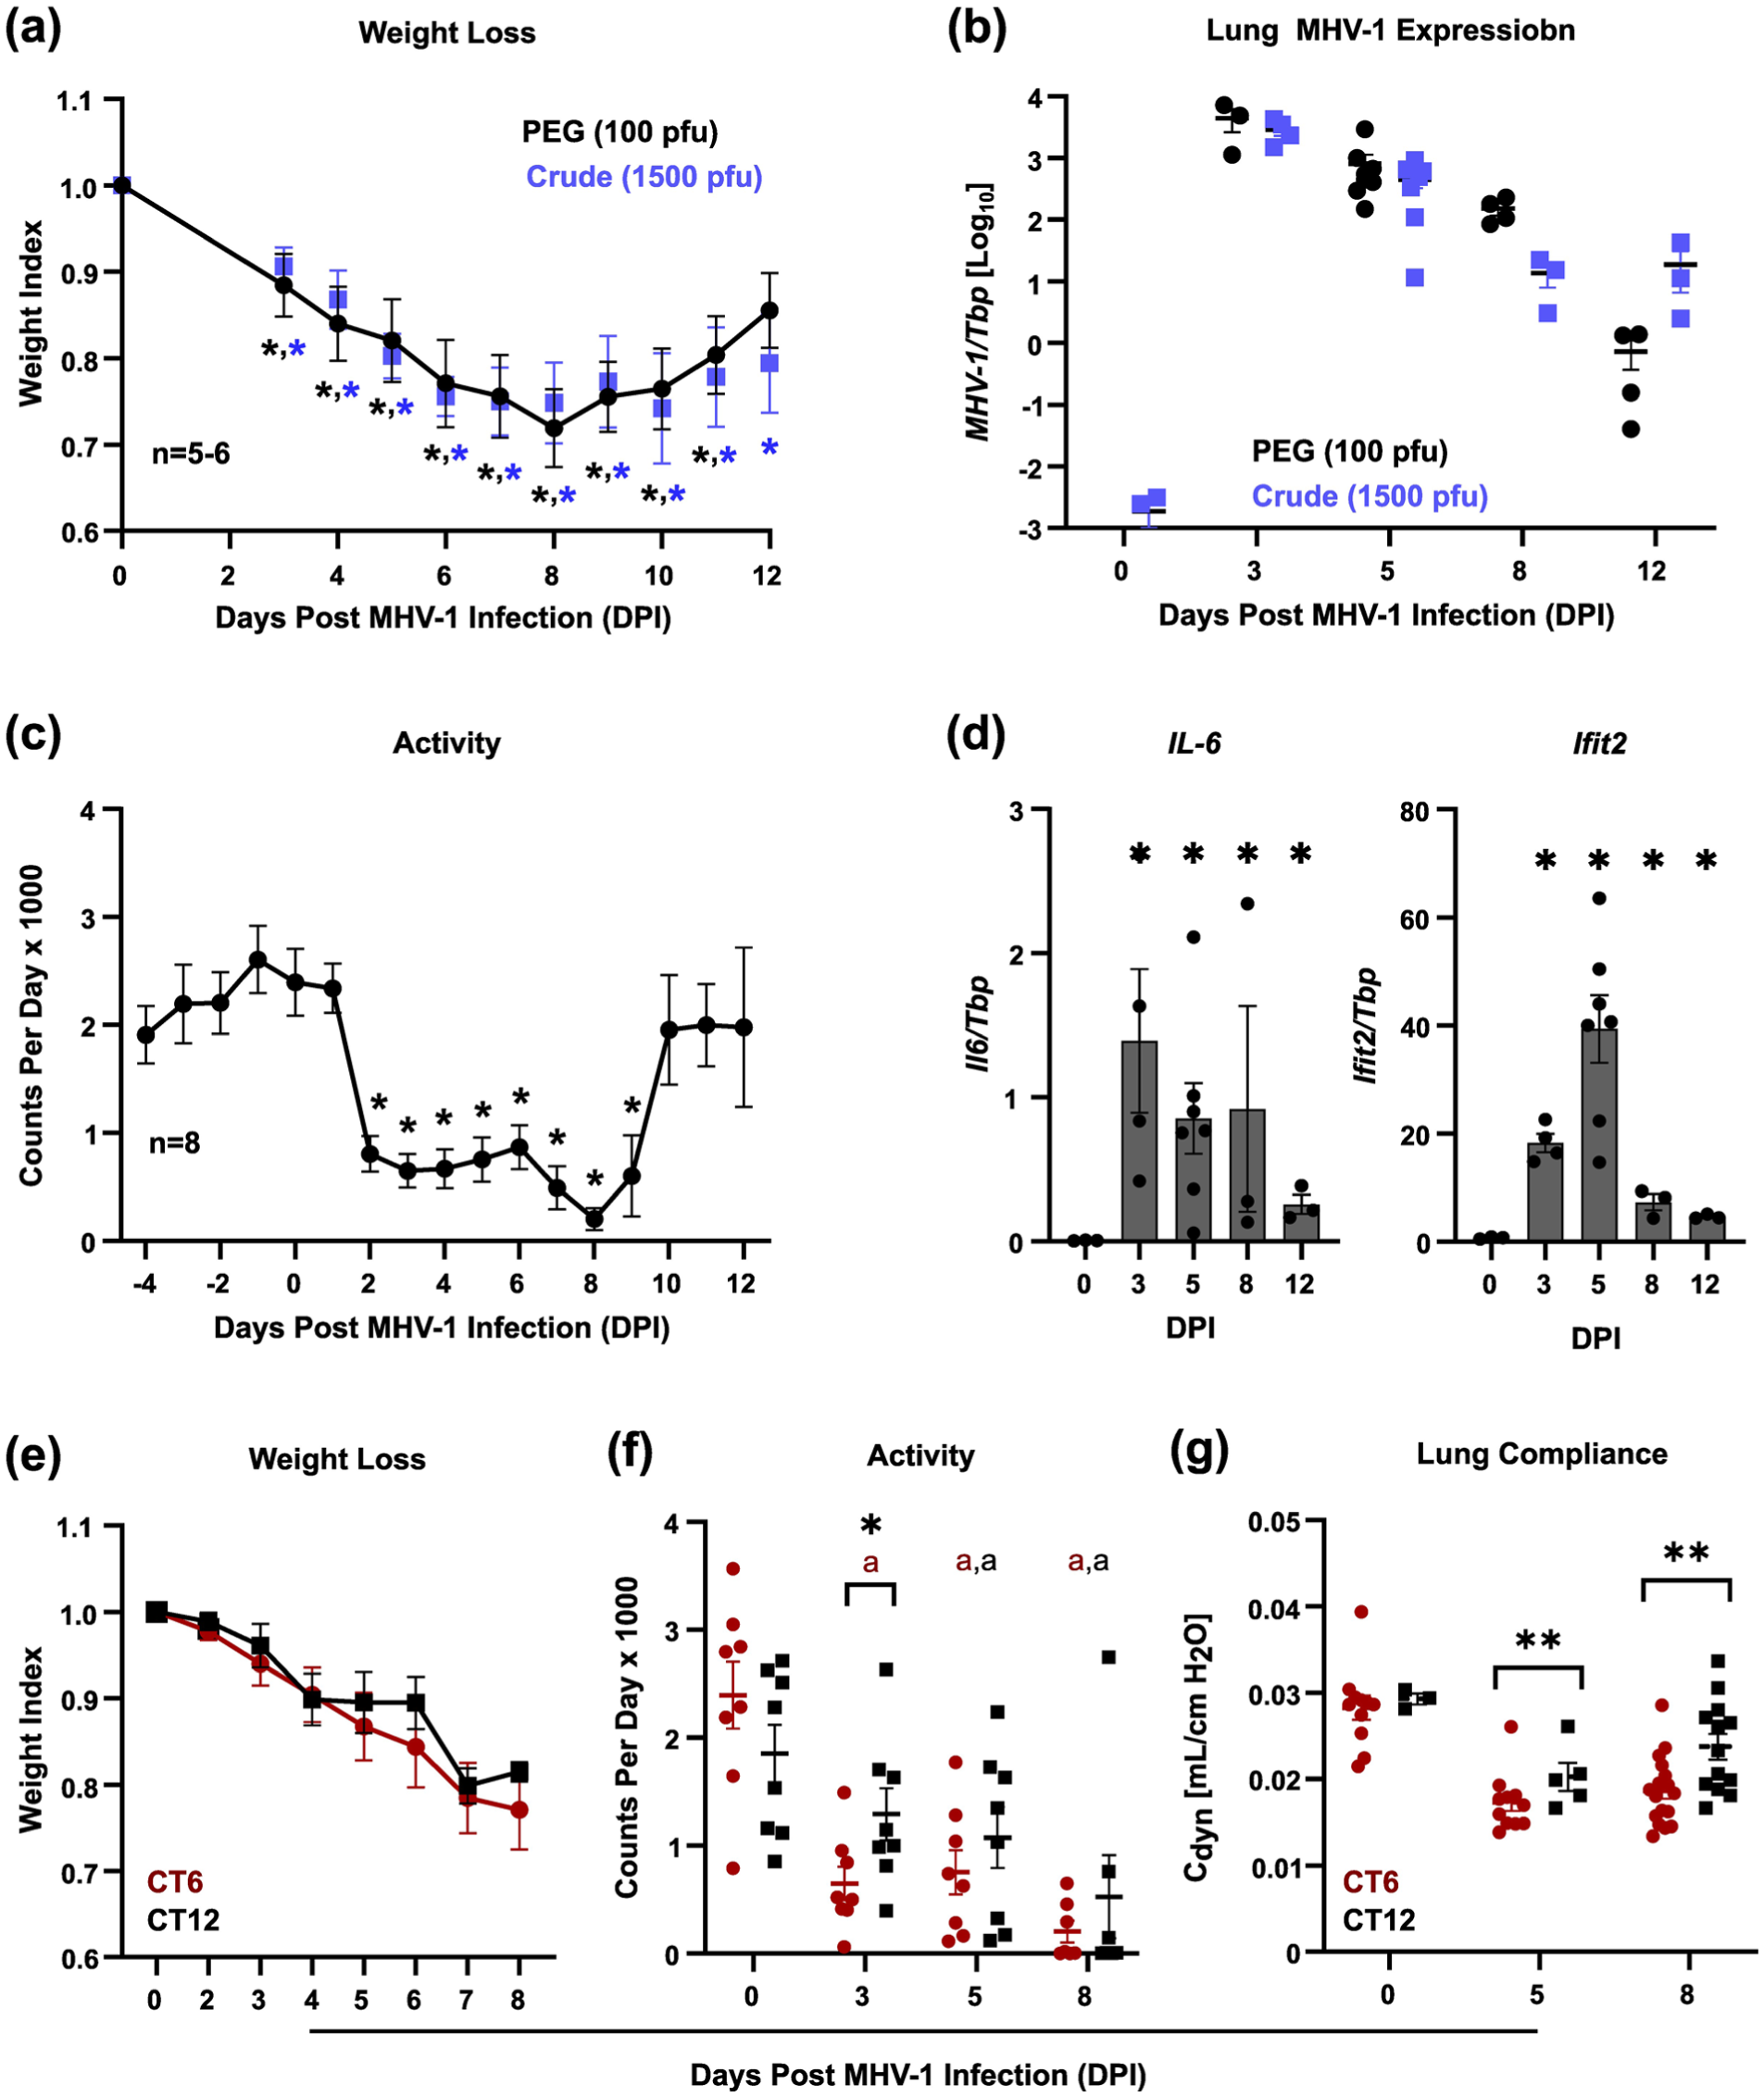
Sublethal MHV-1 pneumonia model. Data were obtained from male mice throughout. Panel (a) shows weight loss after sublethal MHV-1 at infection at CT6 (mean ± SE, n = 5-6/group). Black symbols, infection with 100 pfu of a PEG-precipitated MHV-1preparation. Blue symbols infection with 1500 pfu of crude viral S1. Note that both preparations produced equivalent weight loss at the indicated doses. *p < 0.05 versus pre-infection weight via Student two-tailed t test. Panel (b) shows qPCR analysis of MHV-1 gene expression in lungs sublethally infected at CT6 (mean ± SE, n = 3-6/group). Black symbols, infection with 100 pfu of a PEG-precipitated MHV-1preparation. Blue symbols, infection with 1500 pfu of crude viral S1. Panel (c) shows mouse activity after sublethal MHV-1 infection at CT6 (mean ± SE, n = 8 with equal numbers of mice receiving 100 pfu PEG-precipitated MHV-1 or 1500 pfu viral S1). *p < 0.05 versus activity on 0 DPI via Student two-tailed t test. Panel (d) depicts lung expression of IL-6 (left panel) and Ifit2 (right panel) after sublethal MHV-1 inoculation at CT6 (100 pfu PEG-precipitated virus, mean ± SE, n = 3-7/group). *p < 0.05 versus sham-infected mice, Student two-tailed t test. Panels (e-g) show weight loss (e), mouse activity (f), and respiratory system dynamic compliance (g) in mice infected with MHV-1 (1500 pfu, crude S1) at CT6 (red symbols) versus CT12 (black symbols). Bars depict the mean ± SE, n = 5-11/group, pooled from two independent experiments. *p < 0.05, **p < 0.005 comparing CT6 to CT12 via Student two-tailed t test on log-normalized data. ap < 0.05 versus 0 DPI via Student two-tailed t test on log-normalized data.
Male mice sub-lethally infected with MHV-1 at CT6 and CT12 did not differ in weight loss (Figure 2e). However, CT6-infected mice showed a faster onset of sickness behavior, as indicated by suppressed locomotor activity levels (Figure 2f). In addition, CT6 infection produced a greater decline in dynamic respiratory system compliance than CT12 infection (Figure 2e), indicating mechanically stiffer lungs and a more severe pneumonia. In terms of lung infectious burden, CT6 yielded a faster rise and a higher peak in MHV-1 level as measured by IF, viral titer, and viral gene expression (Figure 3a-3c, and Suppl. Fig. S7a). However, extrapulmonary spread of virus to the liver and brain did not differ by infection time of day (Suppl. Fig. S7b and S7c). Interestingly, the difference in lung MHV-1 burden between CT6- and CT12-infected mice was appreciable at a specific early stage of infection (2-3 DPI) but not at later time points. Regarding lung inflammation, CT6-infected mice showed accelerated onset of pneumonitis and higher peak BAL protein levels than CT12-infected animals, with these effects evident by 2 DPI (Figure 3d-3f). Peak BAL cell counts were also higher in CT6-infected mice, primarily due to excess neutrophil accumulation (Figure 3g). Multiplex cytokine analysis of BALs collected from males at 2 DPI showed generally increased cytokine levels in CT6 compared to CT12 infected lungs, with statistically significant differences noted for CXCL10, IL-15, IL-17, IL-33, IL-9, and ILp27/30, and borderline significance for TNFα (Table 1). Lung flow cytometry showed that CT6- and CT12-infected male mice recruited similar leukocyte subsets to the lung after MHV-1 exposure (Figure 4 and Suppl. Fig. S8). However, CT6-infected lungs showed higher percentages of neutrophils and NK cells than CT12-infected lungs, consistent with a stronger early innate immune response (Figure 4a and 4b). While baseline circadian rhythms in lung leukocyte trafficking are well documented (He et al., 2018), we only observed significant resting differences in AM abundance between CT6 and CT12 (Figure 4d). In contrast to males, female mice did not show statistically significant time effects for MHV-1 IF, viral load, pneumonitis, BAL protein levels, or BAL cytokines (Suppl. Fig. S9 and Table 1). Moreover, two-way ANOVA analysis of cytokines did not demonstrate a sex effect independent of time of day (Table 1). In summary, multiple lines of evidence demonstrate that time of day becomes a factor early in the pathogenesis of MHV-1 pneumonia, when the virus is rapidly spreading within the lung (2 DPI). CT6 infection in males is associated with a more rapid onset of symptoms, higher viral load, greater lung injury, a more robust innate immune response, and a higher fatality rate.
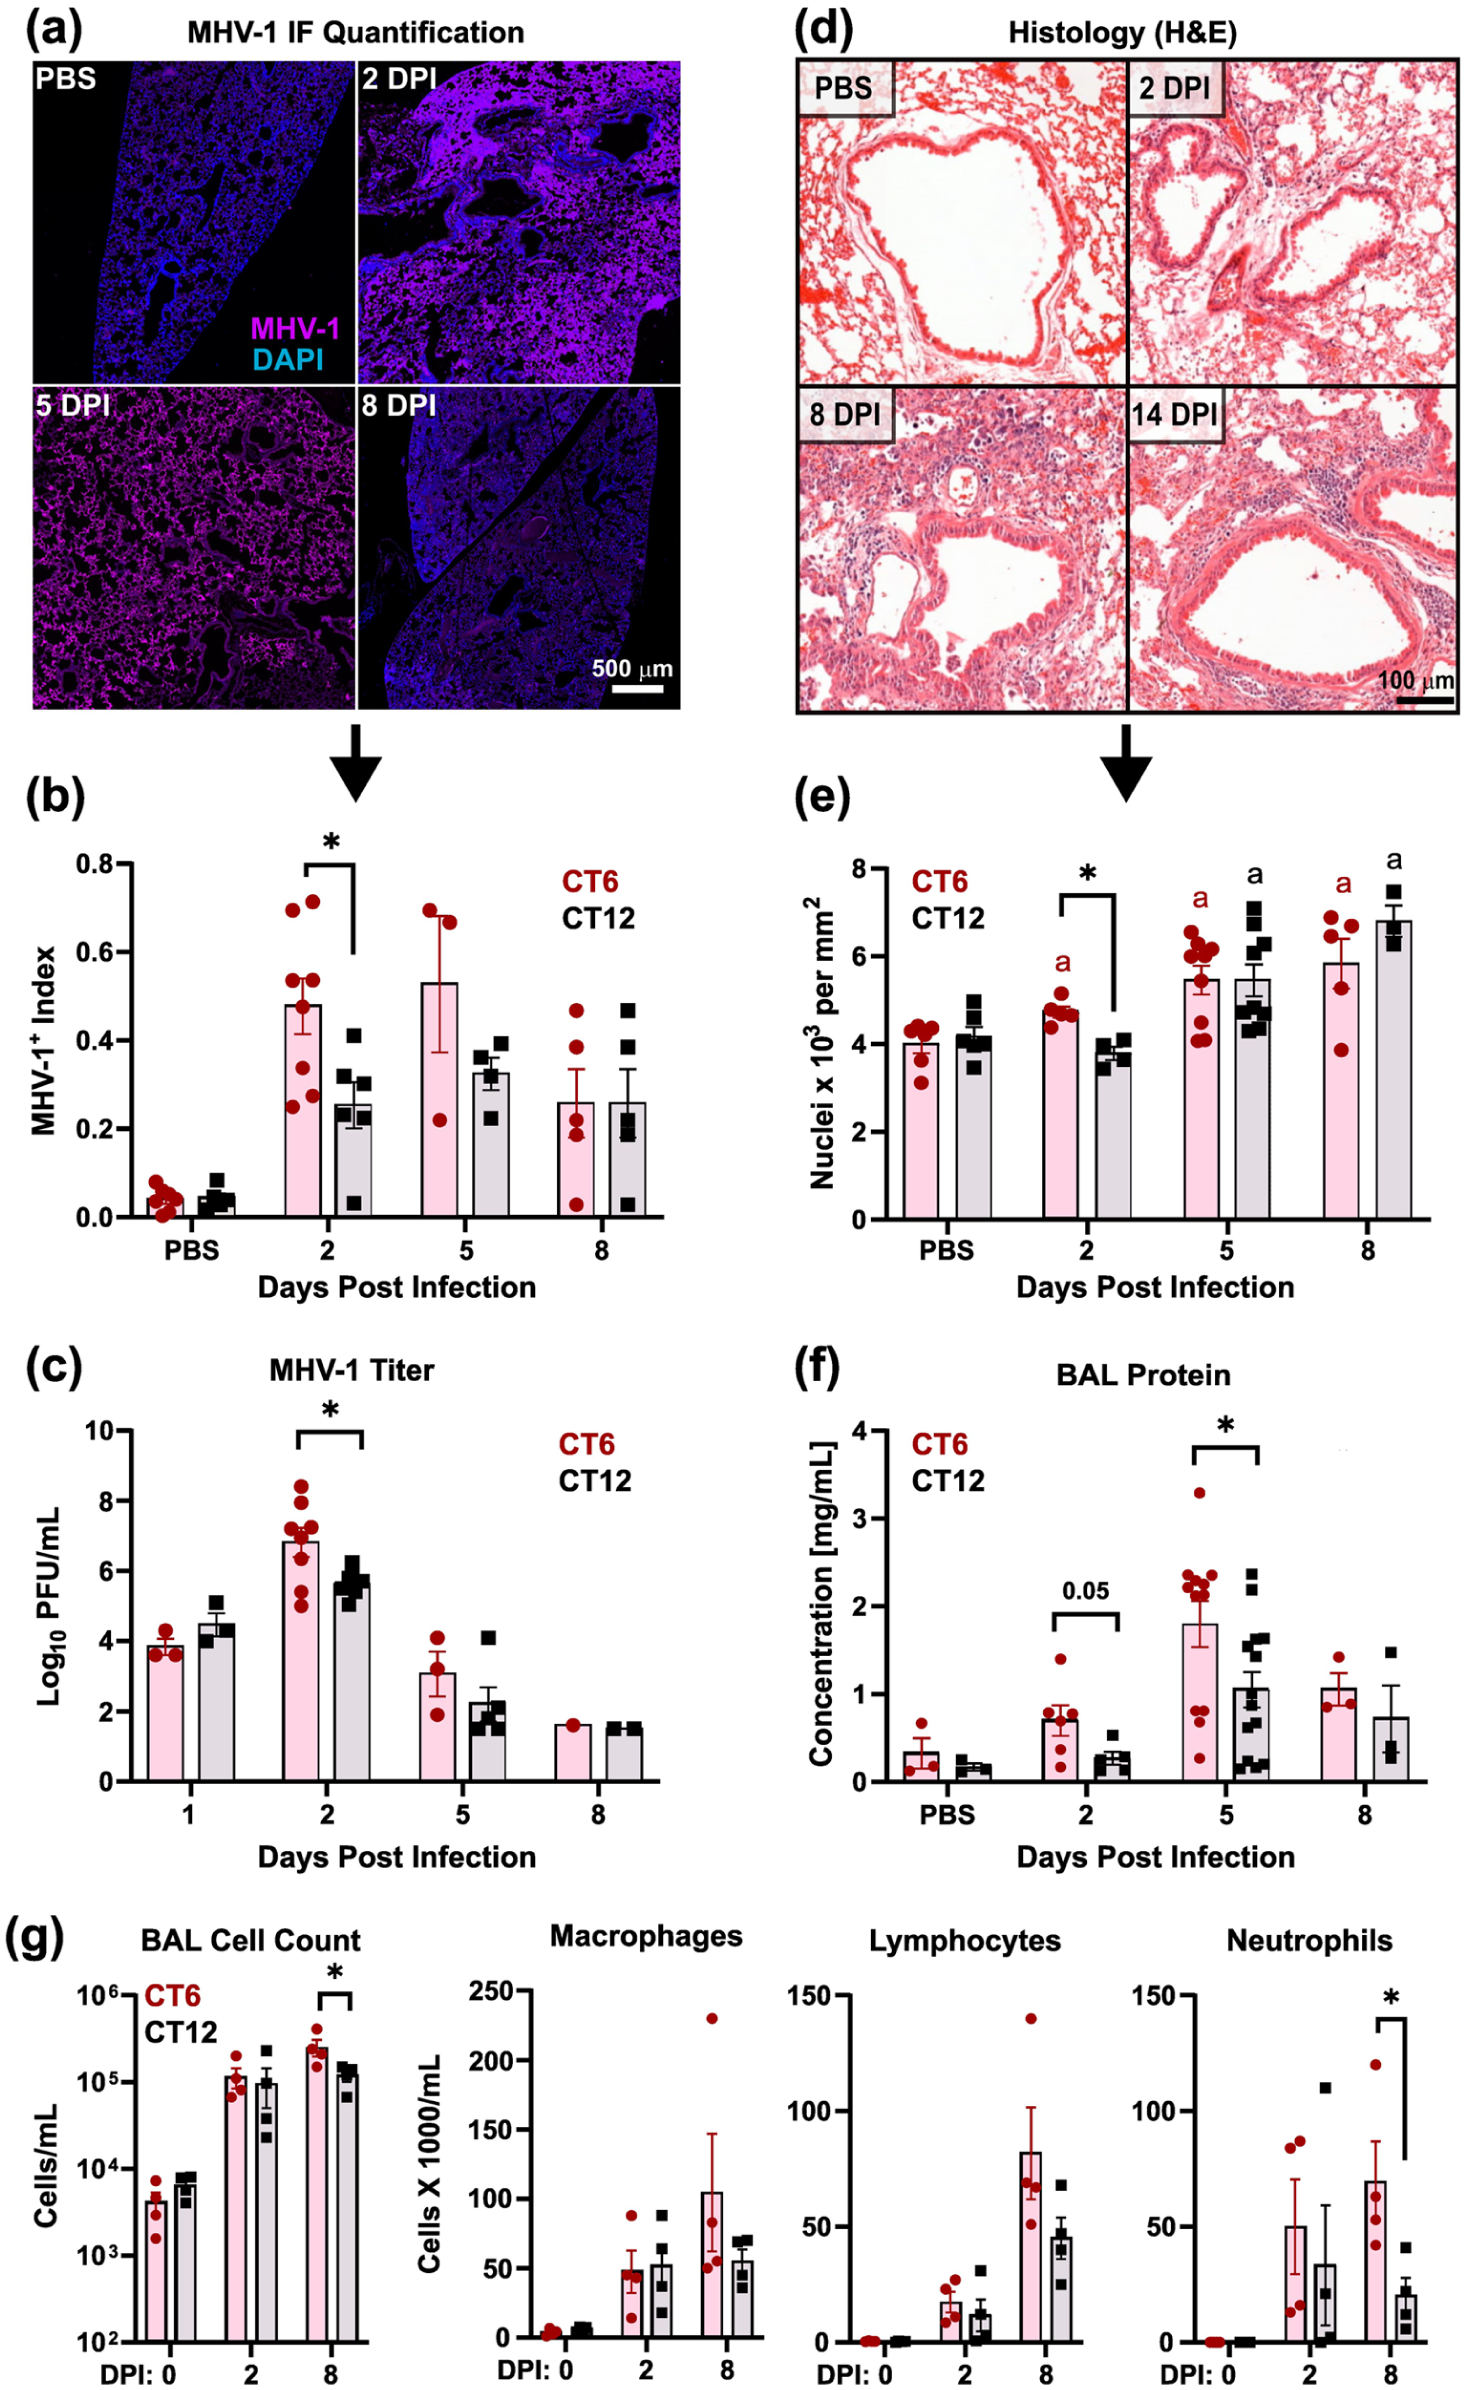
Infection time of day modulates early stages of MHV-1 pneumonia pathogenesis in male mice. Data were obtained from male mice after sublethal MHV-1 infection (100 pfu of PEG precipitated virus) at CT6 (red symbols) versus CT12 (black symbols). Results were pooled from two independent experiments. Panel (a) shows representative immunostained lung sections at various points after MHV-1 infection. Purple, MHV-1; blue, DAPI. Bar = 500 μm. Panel (b) shows quantification of MHV-1-stained lung sections based on the percentage of image pixels that are MHV-1 + (mean ± SE, n = 3-8). Panel (c) depicts BAL viral titers at various days post MHV-1 infection (mean ± SE, n = 3-8). Panel (d) shows representative H&E-stained lung sections at various days post-MHV-1 infection. Panel (e) shows morphometric quantification of leukocyte infiltration into the lungs after MHV-1 infection (n = 4-9). Panel (f) shows BAL protein concentration after MHV-1 infection. Panel (g) shows BAL total, macrophage, lymphocyte, and neutrophil cell counts. *p < 0.05; **p < 0.005, CT6 versus CT12 infection, Student two-tailed t test on log normalized data (n = 3-8). ap < 0.05 versus control (0 DPI) lungs, Student two-tailed t test on log-normalized data. For comparisons in female mice, see Supplementary Figure S9.
BAL cytokine levels in MHV-1 infected mice on 2 DPI binned by time of infection and sex (100 pfu/mouse).
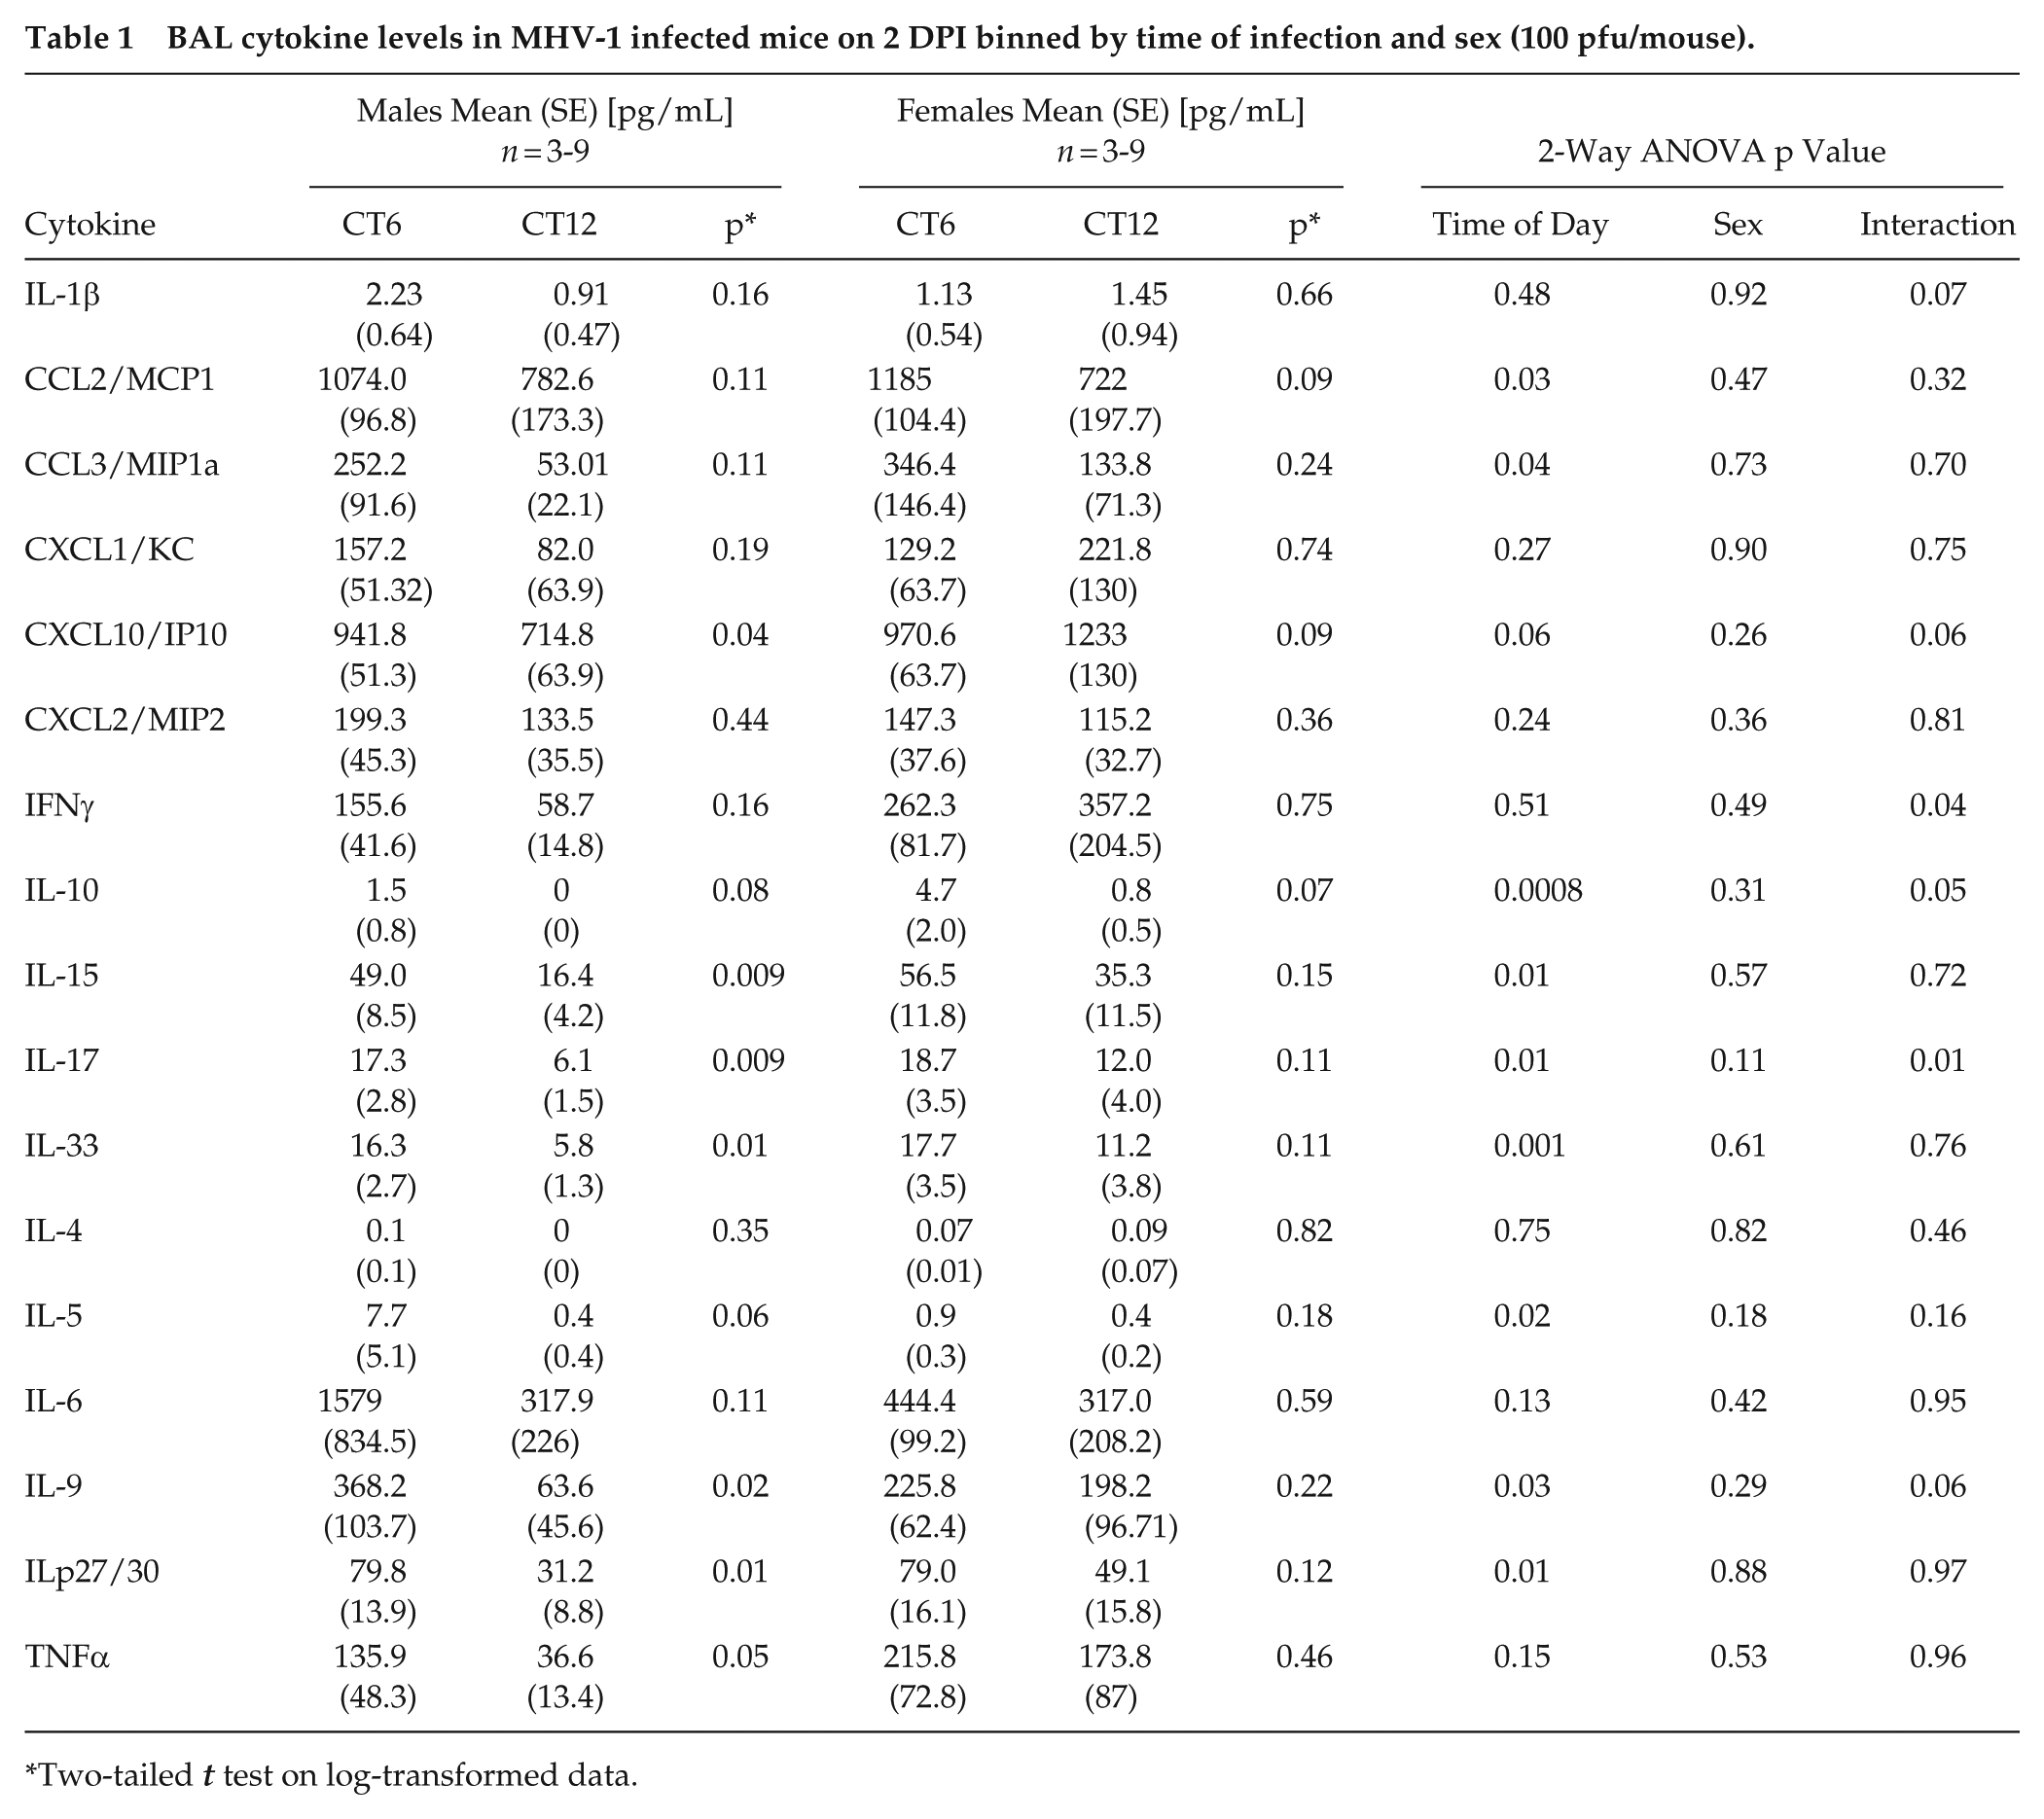
Two-tailed t test on log-transformed data.
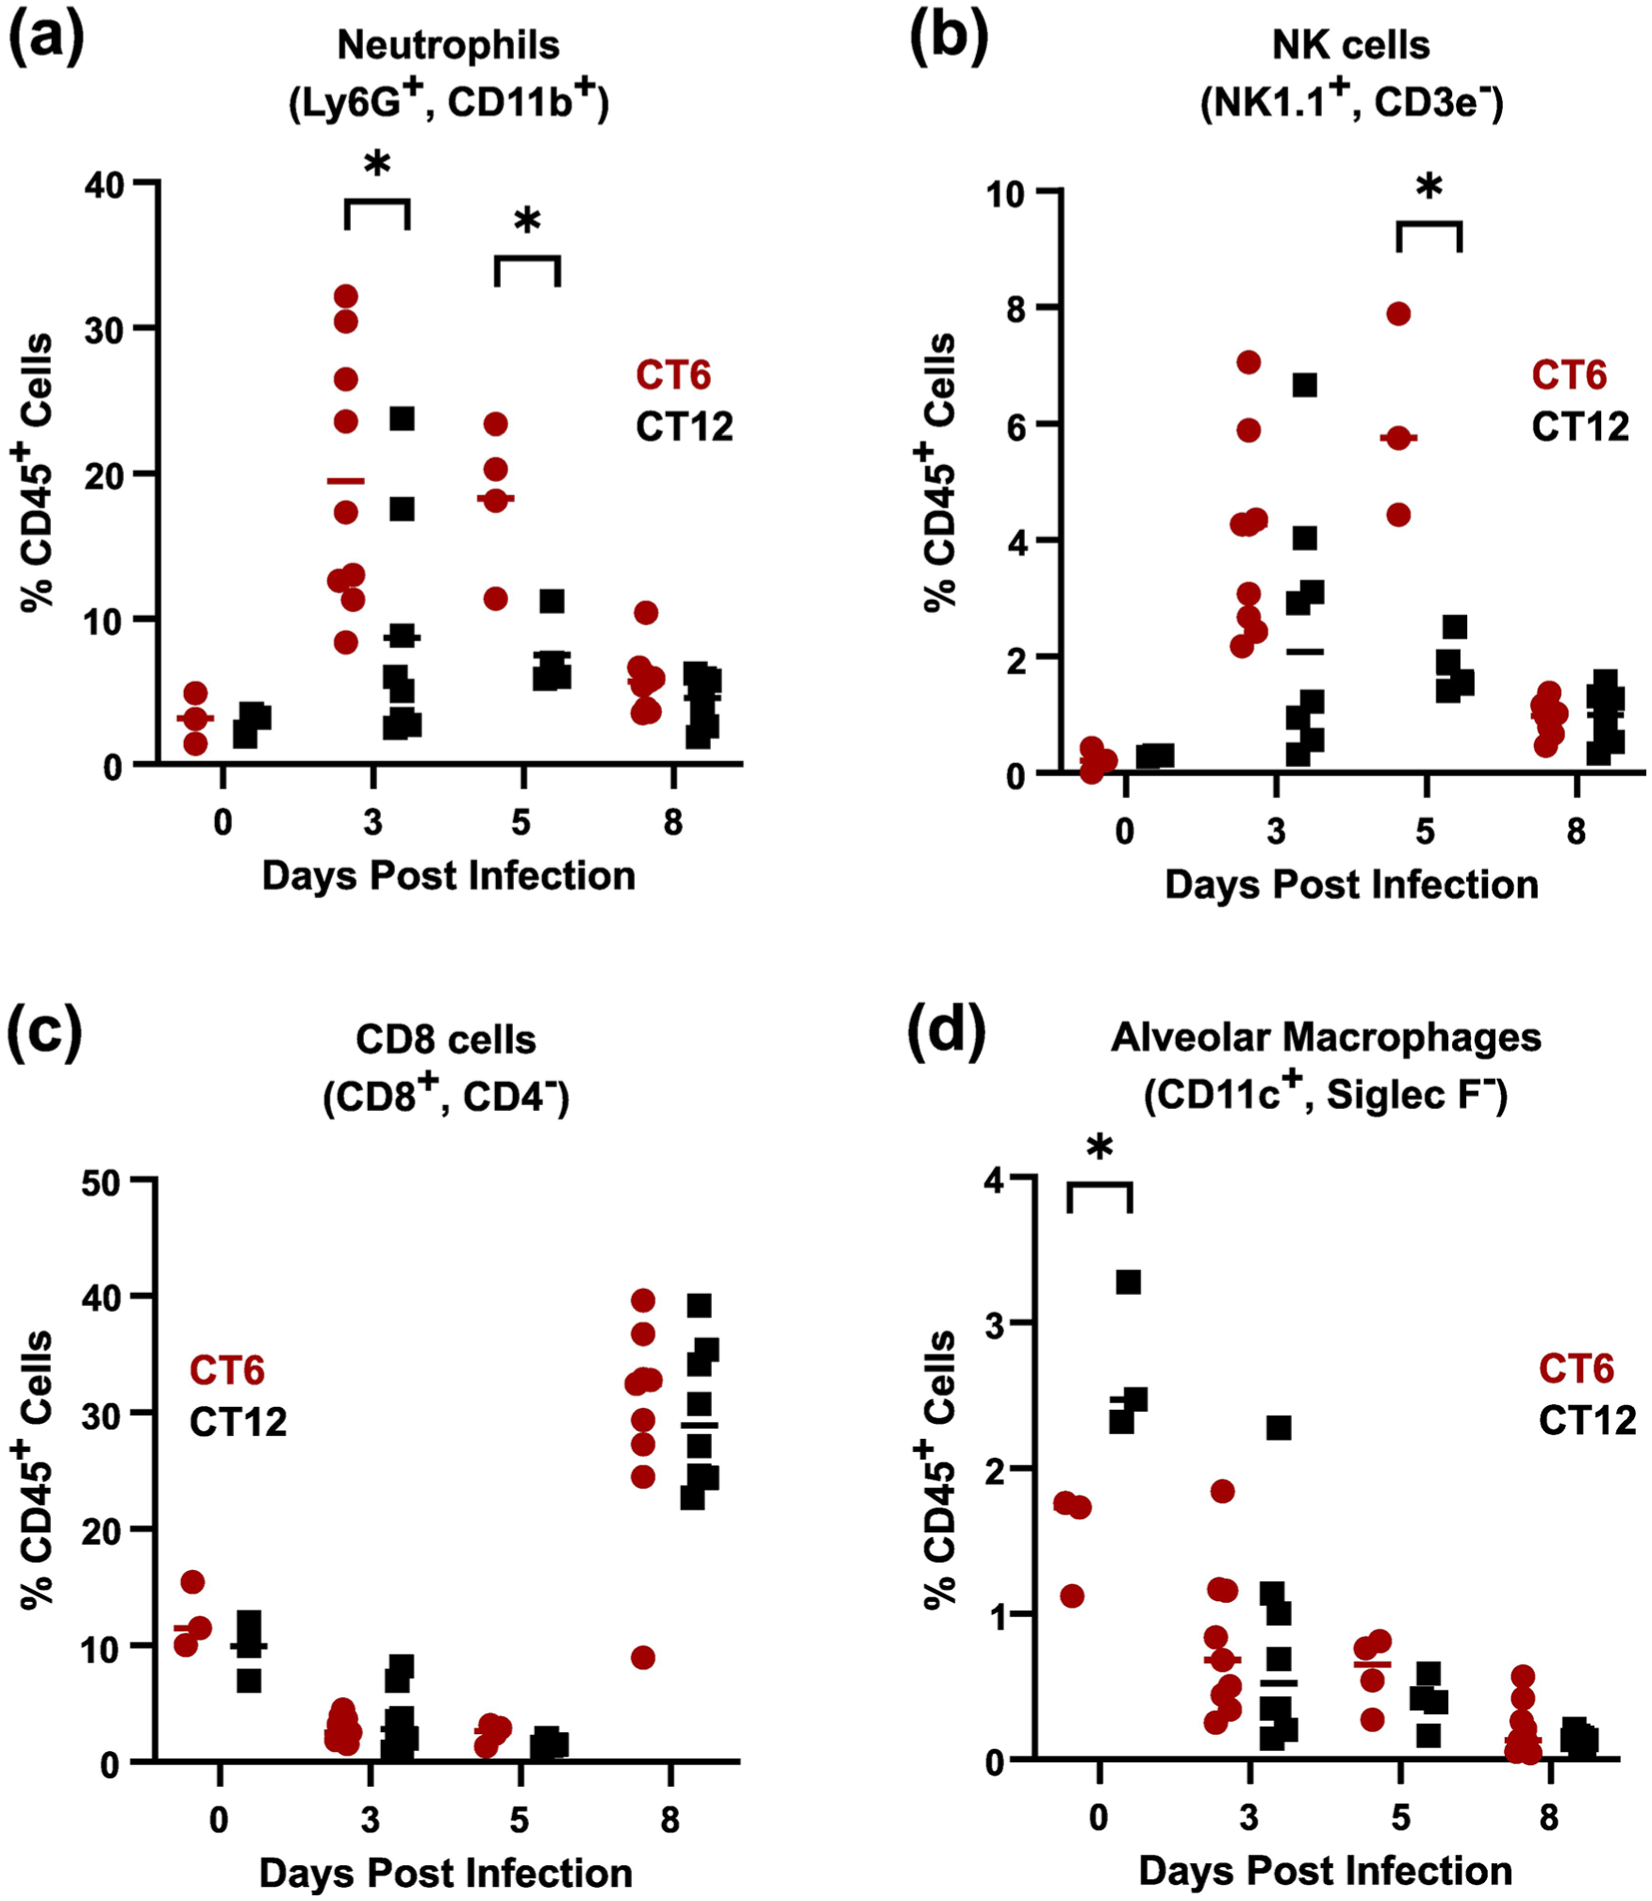
MHV-1 infection at CT6 enhances neutrophil and NK infiltration into the lung in male mice. Flow cytometric quantification of selected leukocyte subsets after sublethal infection with MHV-1 (1500 pfu of crude viral S1) at either CT6 (red circles) or CT12 (black squares). Panel (a), neutrophils. Panel (b), NK cells. Panel (c), CD8 T cells. Panel (d), alveolar macrophages (AMs). See Supplementary Figure S8 for additional cell types and Supplementary Figure S3 for representative gating. *p < 0.05, Student t test of log-normalized data.
Initial MHV-1 Binding to AMs Varies With Time of Day
To generate hypotheses about how time of day affects MHV-1 pneumonia outcomes, we used bulk RNA sequencing (RNAseq) to compare sublethal infections at CT6 and CT12 in both sexes (Figure 5a and Supplementary Data 1 and 2). Because these times of day showed baseline differences in AM frequency (Figure 4d), we analyzed BAL cells separately from lung tissue, as they are over 80% AMs at baseline (Hazan et al., 2022). Confirming earlier qPCR data (Suppl. Fig. S7a), bulk RNAseq detected higher peak MHV-1 gene expression in CT6-infected mice than in CT12-infected mice (Figure 5b). As with viral load, most of the “time-of-day-sensitive” differentially expressed genes (DEGs) were detected specifically at 2 DPI (Figure 5c). These DEGs were functionally enriched for cytokine signaling pathways (Supplementary Table S4), consistent with BAL cytokine measurements (Table 1). To scrutinize sex-specific effects at the key timepoint of 2 DPI, we compared the magnitude of “time-of-day” differential gene expression in MHV-1-infected males with that in females (defined as the absolute value of CT6:CT12 expression ratio, Figure 5d). We found that male mice showed disproportionately high CT6:CT12 expression ratios compared to females, as evidenced by the asymmetric distribution of DEGs below the unity line in Figure 5d. For DEGs in lung tissue, time-of-day effects were, on average, 1.5 times larger in males than in females (95% CI 0.81-3.3). Interestingly, this male sex skew was even more pronounced in BAL cells than in the lung (Figure 5d; blue vs orange symbols), averaging 2.1-fold (95% CI 0.92-7.9).
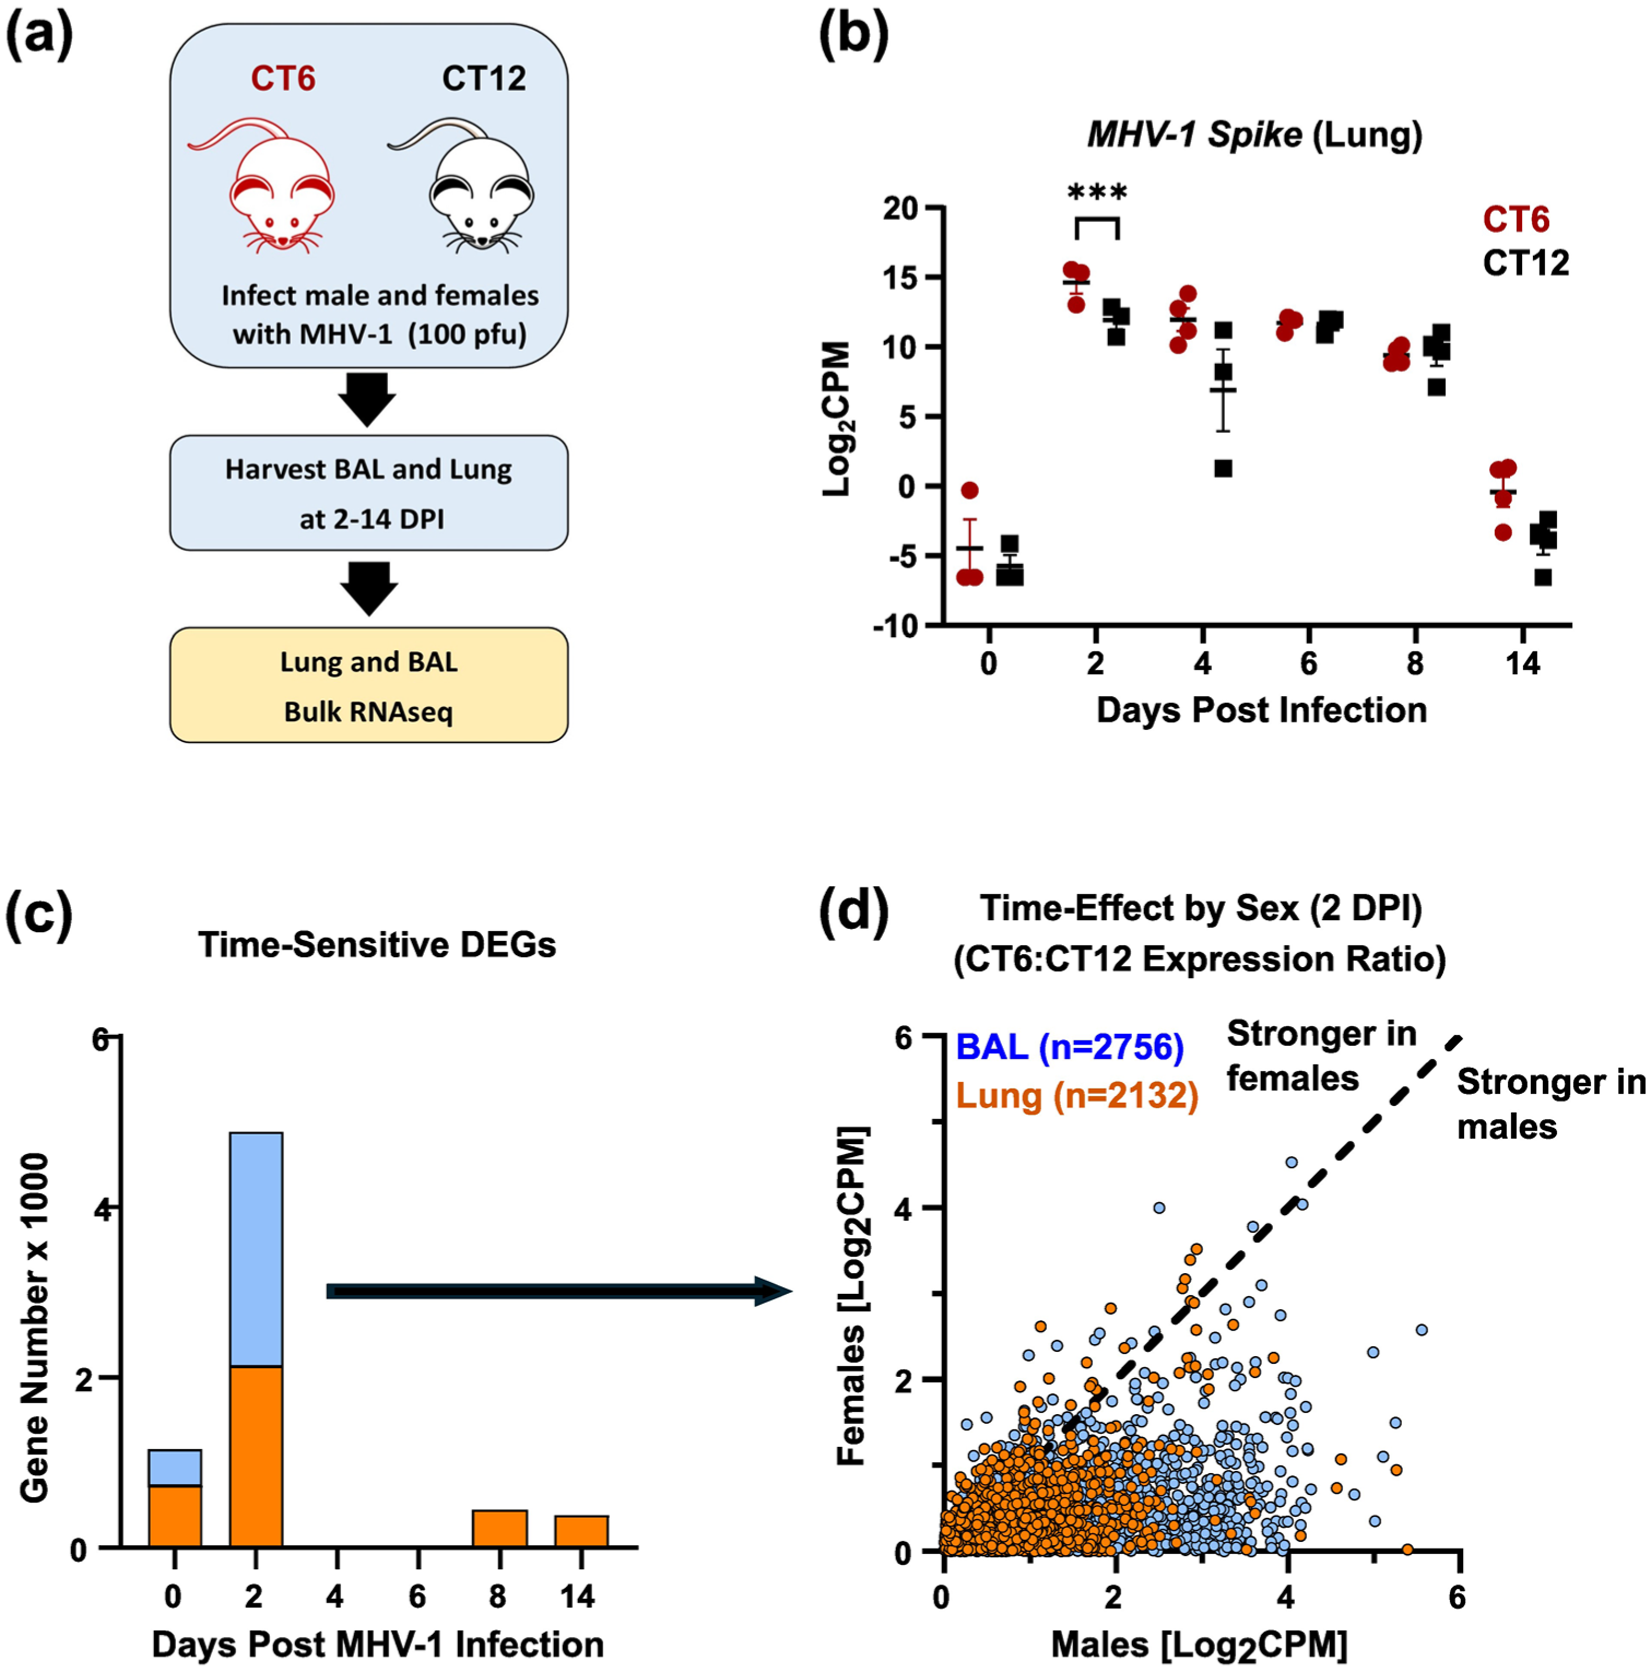
Bulk RNAseq analysis of MHV-1 infection as a function of infection time of day and sex. See Supplementary Data 1 and 2 for full expression data. Panel (a) depicts the schematic of the experiment. Panel (b) shows MHV-1 Spike expression in lung tissue binned by days post-infection (DPI) and infection time of day (mean ± SE). Red symbols, CT6 infection; black symbols, CT12 infection. Panel (c) shows the number of differentially expressed genes (DEGs) based on infection time of day at different DPIs (p < 0.05). Light blue bars, BAL cells; orange bars, lung. Panel (d) plots DEGs found at 2 DPI in BAL cells (blue symbols, n = 2756) and lung (orange symbols, n = 2132) based on the magnitude of their time-of-day effects in males and females (defined as the absolute value of the CT6:CT12 expression ratio, n = 2 pairs per sex). DEGs located on the dashed line of identity show similar time effects in males and females. DEGs below the line have a stronger time effect in males, while those above the line have a stronger time effect in females. ***p < 0.005.
The disproportionate temporal sensitivity and sexual dimorphism in BAL cell gene expression led us to hypothesize that AMs, the primary BAL cell type, may vary in their permissiveness to MHV-1 across the day. We therefore measured MHV-1 adsorption in vivo by intranasally treating wild-type mice with MHV-1 and then measuring viral RNA levels via qPCR after 3-h post-infection (3 HPI), thoroughly washing BAL cells and whole lungs to remove unbound virus (see Methods). We confirmed that there was no induction of Ifnb1 or IL-6 expression at 3 HPI in BAL cells or lung, indicating that viral replication had not yet begun; therefore, the MHV-1 detected at this time reflects binding of virus from the inoculum (Suppl. Fig. S10). In male but not female mice, virus inoculation at CT6 resulted in higher MHV-1 detection in BAL cells than at CT12 (Figure 6a). In contrast, MHV-1 adsorption to the lung parenchyma of the same mice was similar regardless of infection timing or sex (Figure 6b). One potential explanation for these findings is that the expression of the MHV-1 receptor, Ceacam1, differed in AMs between CT6 and CT12 (Williams et al., 1991). However, baseline Ceacam1 expression was comparable at CT6 and CT12 in both BAL and lung (Suppl. Fig. S11). Increased viral adsorption to male BAL cells at CT6 at 3 HPI correlated with increased viral replication in these cells at 2 DPI (Figure 6c). Similarly, we noted increased induction of inflammatory gene expression (Ifnb1, Il6) and BAL protein with CT6 infection in males but not females (Figure 6d-6f). Since AMs are the predominant cell type in BALs, these data suggest an increased cellular affinity for MHV1 in AMs across time of day and sex, potentially explaining why CT6 infection yields more severe pneumonia in male mice.
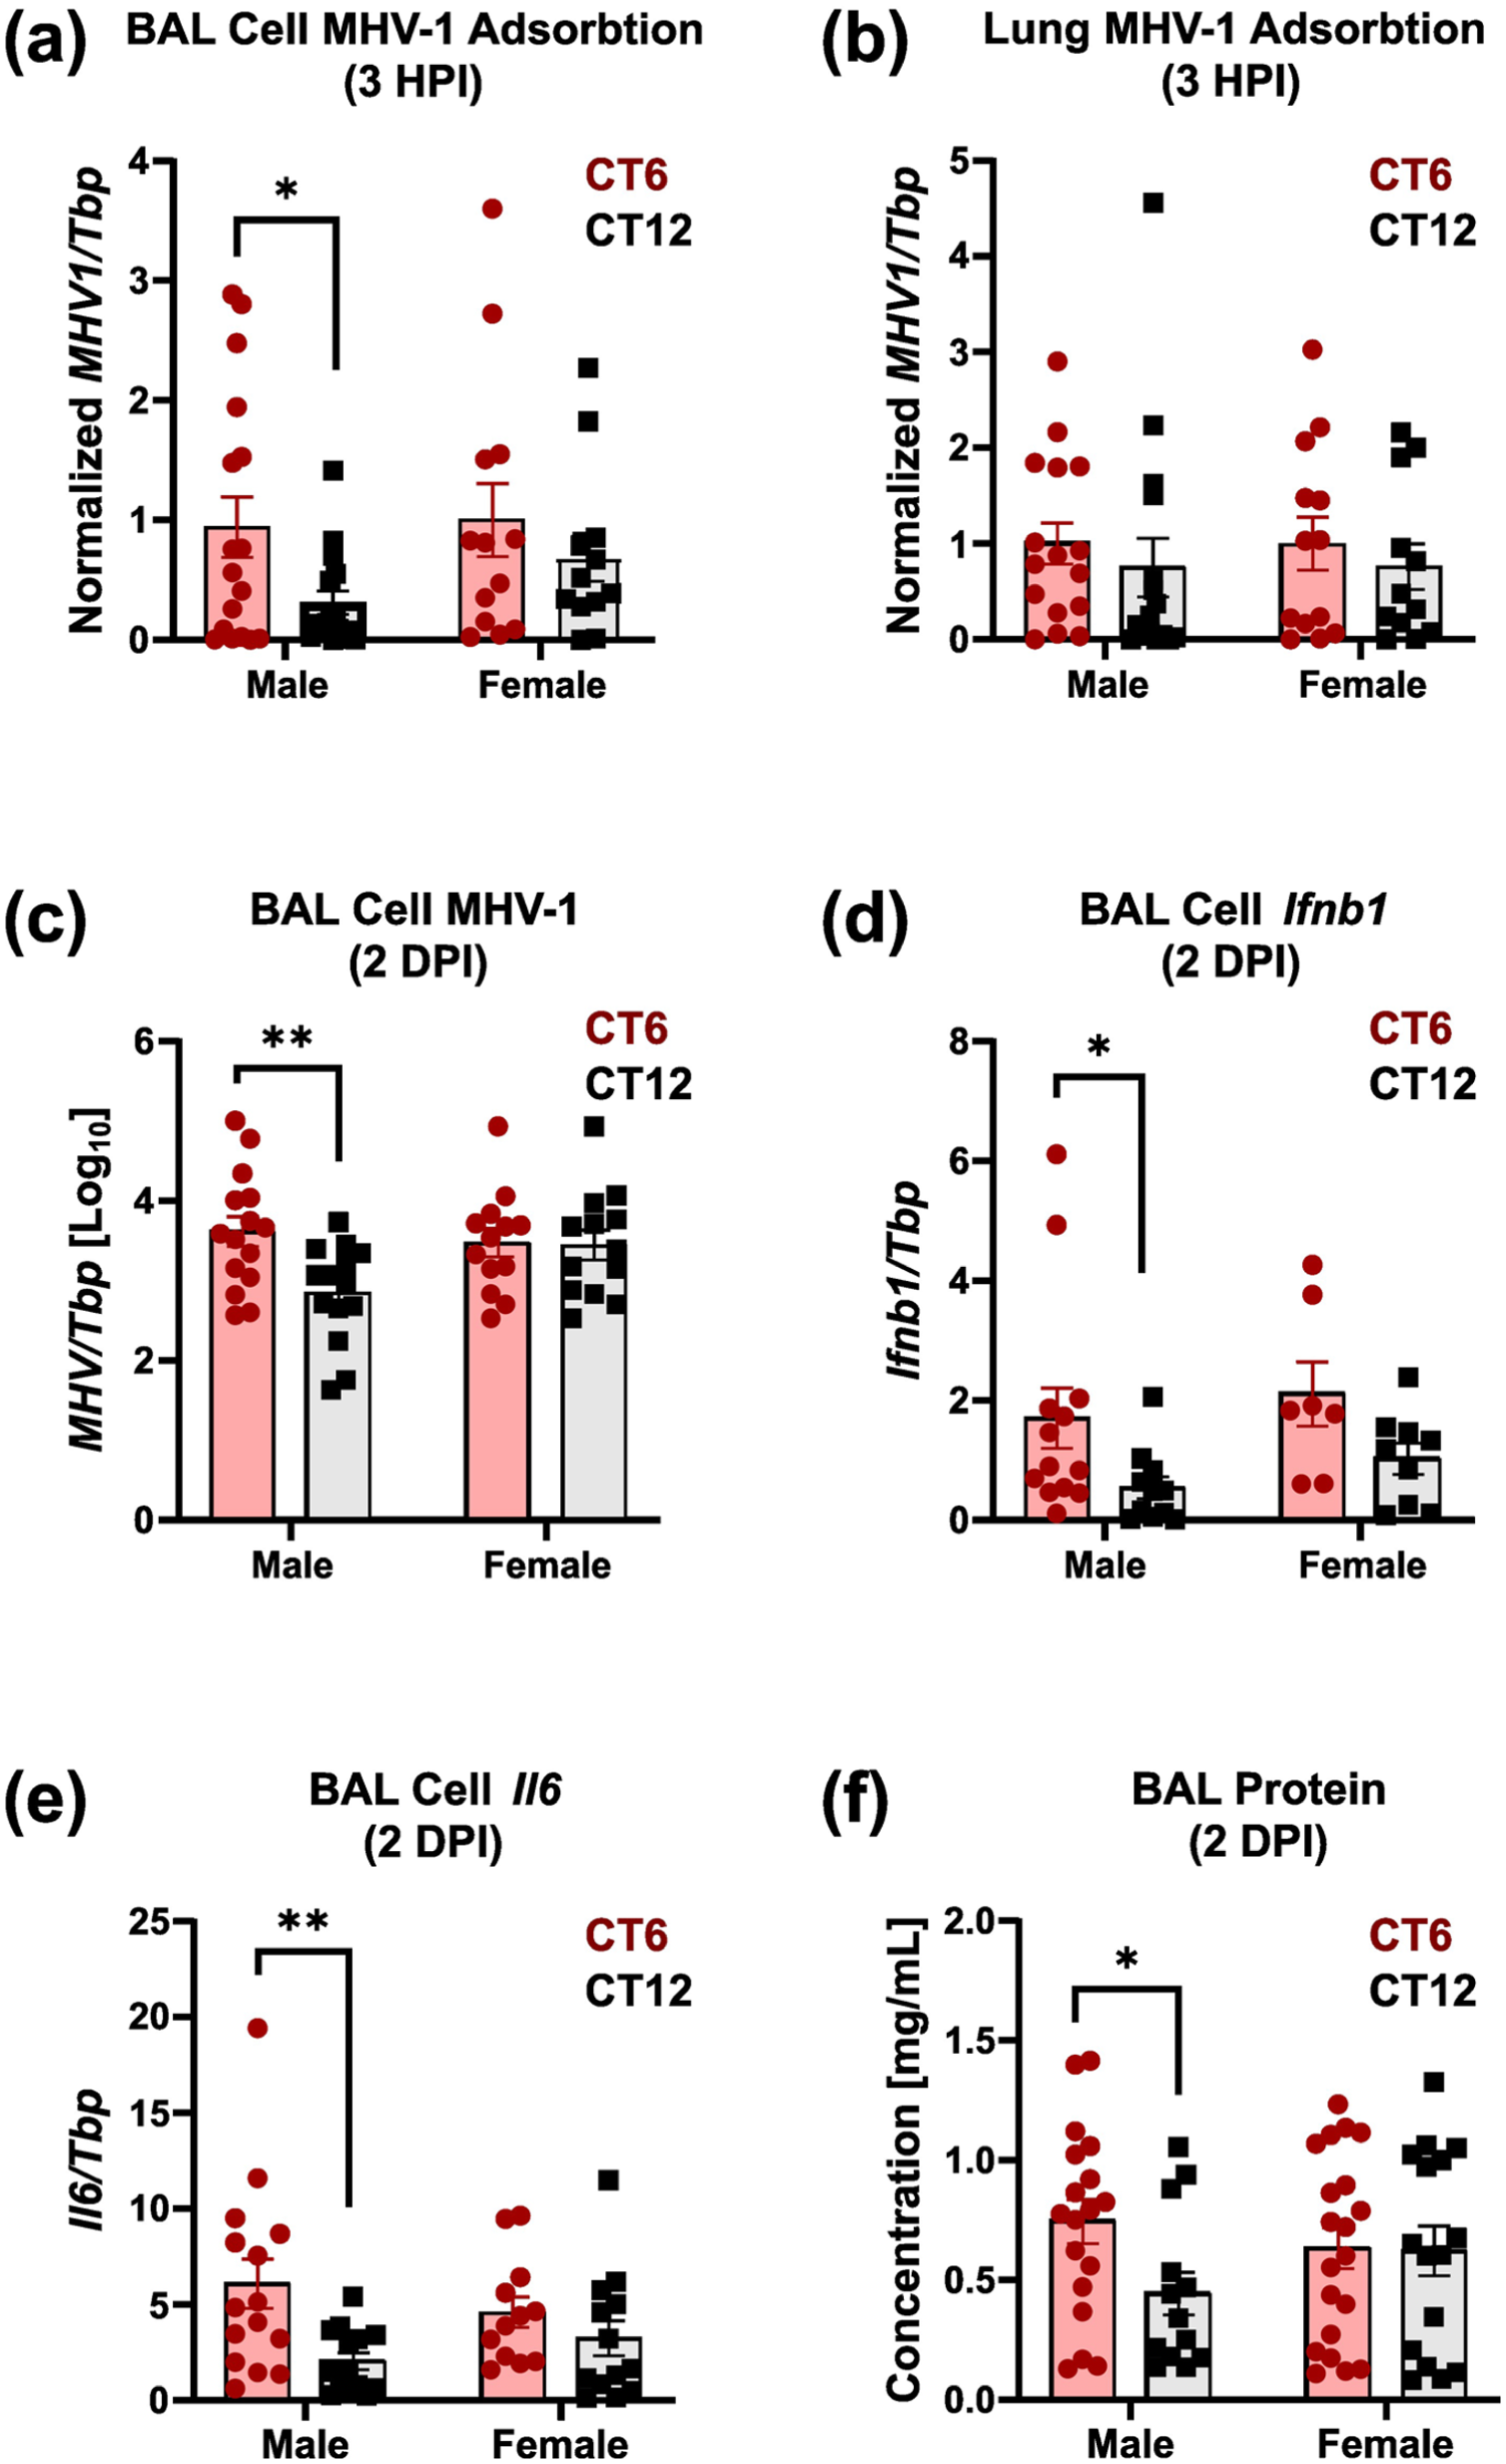
BAL cell affinity for MHV-1 varies with the time of day in males. Male and female mice were inoculated with 100 pfu PEG-fractioned MHV-1, and samples were obtained at 3-h post-infection (3 HPI, panels (a-b)) or 2 DPI (Panels (e-f)). Bars represent mean MHV1/Tbp ratios ± SE (n range 7-18). Data were pooled from three independent experiments. Red symbols, CT6 infection; black symbols, CT12 infection. Panels (a) and (b) depict MHV-1 detection in BAL cells (a) and lung (b), respectively, at 3 HPI. Data were normalized to CT6 infection and pooled from three independent experiments. Panels (c-e) show BAL cell expression of MHV-1 (c), Ifnb1 (d), and Il6 (e) at 2 DPI. Panel (f) depicts BAL protein concentration. *p < 0.05; **p < 0.005, Student t test on log-normalized data.
AM Permissiveness to MHV-1 Replication Varies With Time of Day
To directly test whether MHV-1 replication in AMs varies with time of day, we synchronized primary AMs grown in culture using serum shock, then exposed the cells to MHV-1 at various times after synchronization (Figure 7a). These experiments used a low multiplicity of infection (MOI of 0.001, or 1 virus per 1000 cells) to better mimic in vivo “first contact” infection conditions. We confirmed that our serum shock treatment synchronized wt AM circadian clocks, as shown by oscillations in Per2-Luciferase reporter activity and clock gene expression (Figure 7b and 7c). At the transcript level (Figure 7c), MHV-1 infection altered clock gene expression patterns, upregulating Bmal1 and Nr1d1 overall while suppressing Dbp as seen in vivo (Suppl. Fig. S6). At the protein level, MHV-1 infection damped AM circadian clock amplitude and increased period duration (Figure 7b and 7d). These changes resemble the effects of influenza A virus (IAV) infection in cultured lung tissue explants, and are again consistent with circadian reprogramming (Sundar et al., 2015; Shen et al., 2021). At 2 DPI, MHV-1 replication in AMs varied significantly with the timing of infection, in a Bmal1-independent manner (Figure 7e). Ceacam1 expression also varied in synchronized AM culture, exhibiting an ultradian pattern at baseline (Figure 7f). While Ceacam1 expression at 2 DPI tracked with MHV-1 levels, overall receptor expression was strongly repressed, making the significance of this finding unclear (Figure 7f). In vivo, Ceacam1 transcript levels at 2 DPI were higher in BAL cells infected at CT6 (Figure 7g), but this did not manifest at the protein level, as assessed by flow cytometry (Figure 7h and 7i). We concluded that AMs are differentially permissive for MHV-1 replication at different times of day, supporting the possibility that time-of-day effects in MHV-1 pneumonia may arise from these cells. While expression of the MHV-1 receptor Ceacam1 varied with time of day at the transcript level, this did not explain baseline differences in viral absorption or viral processivity in AMs.
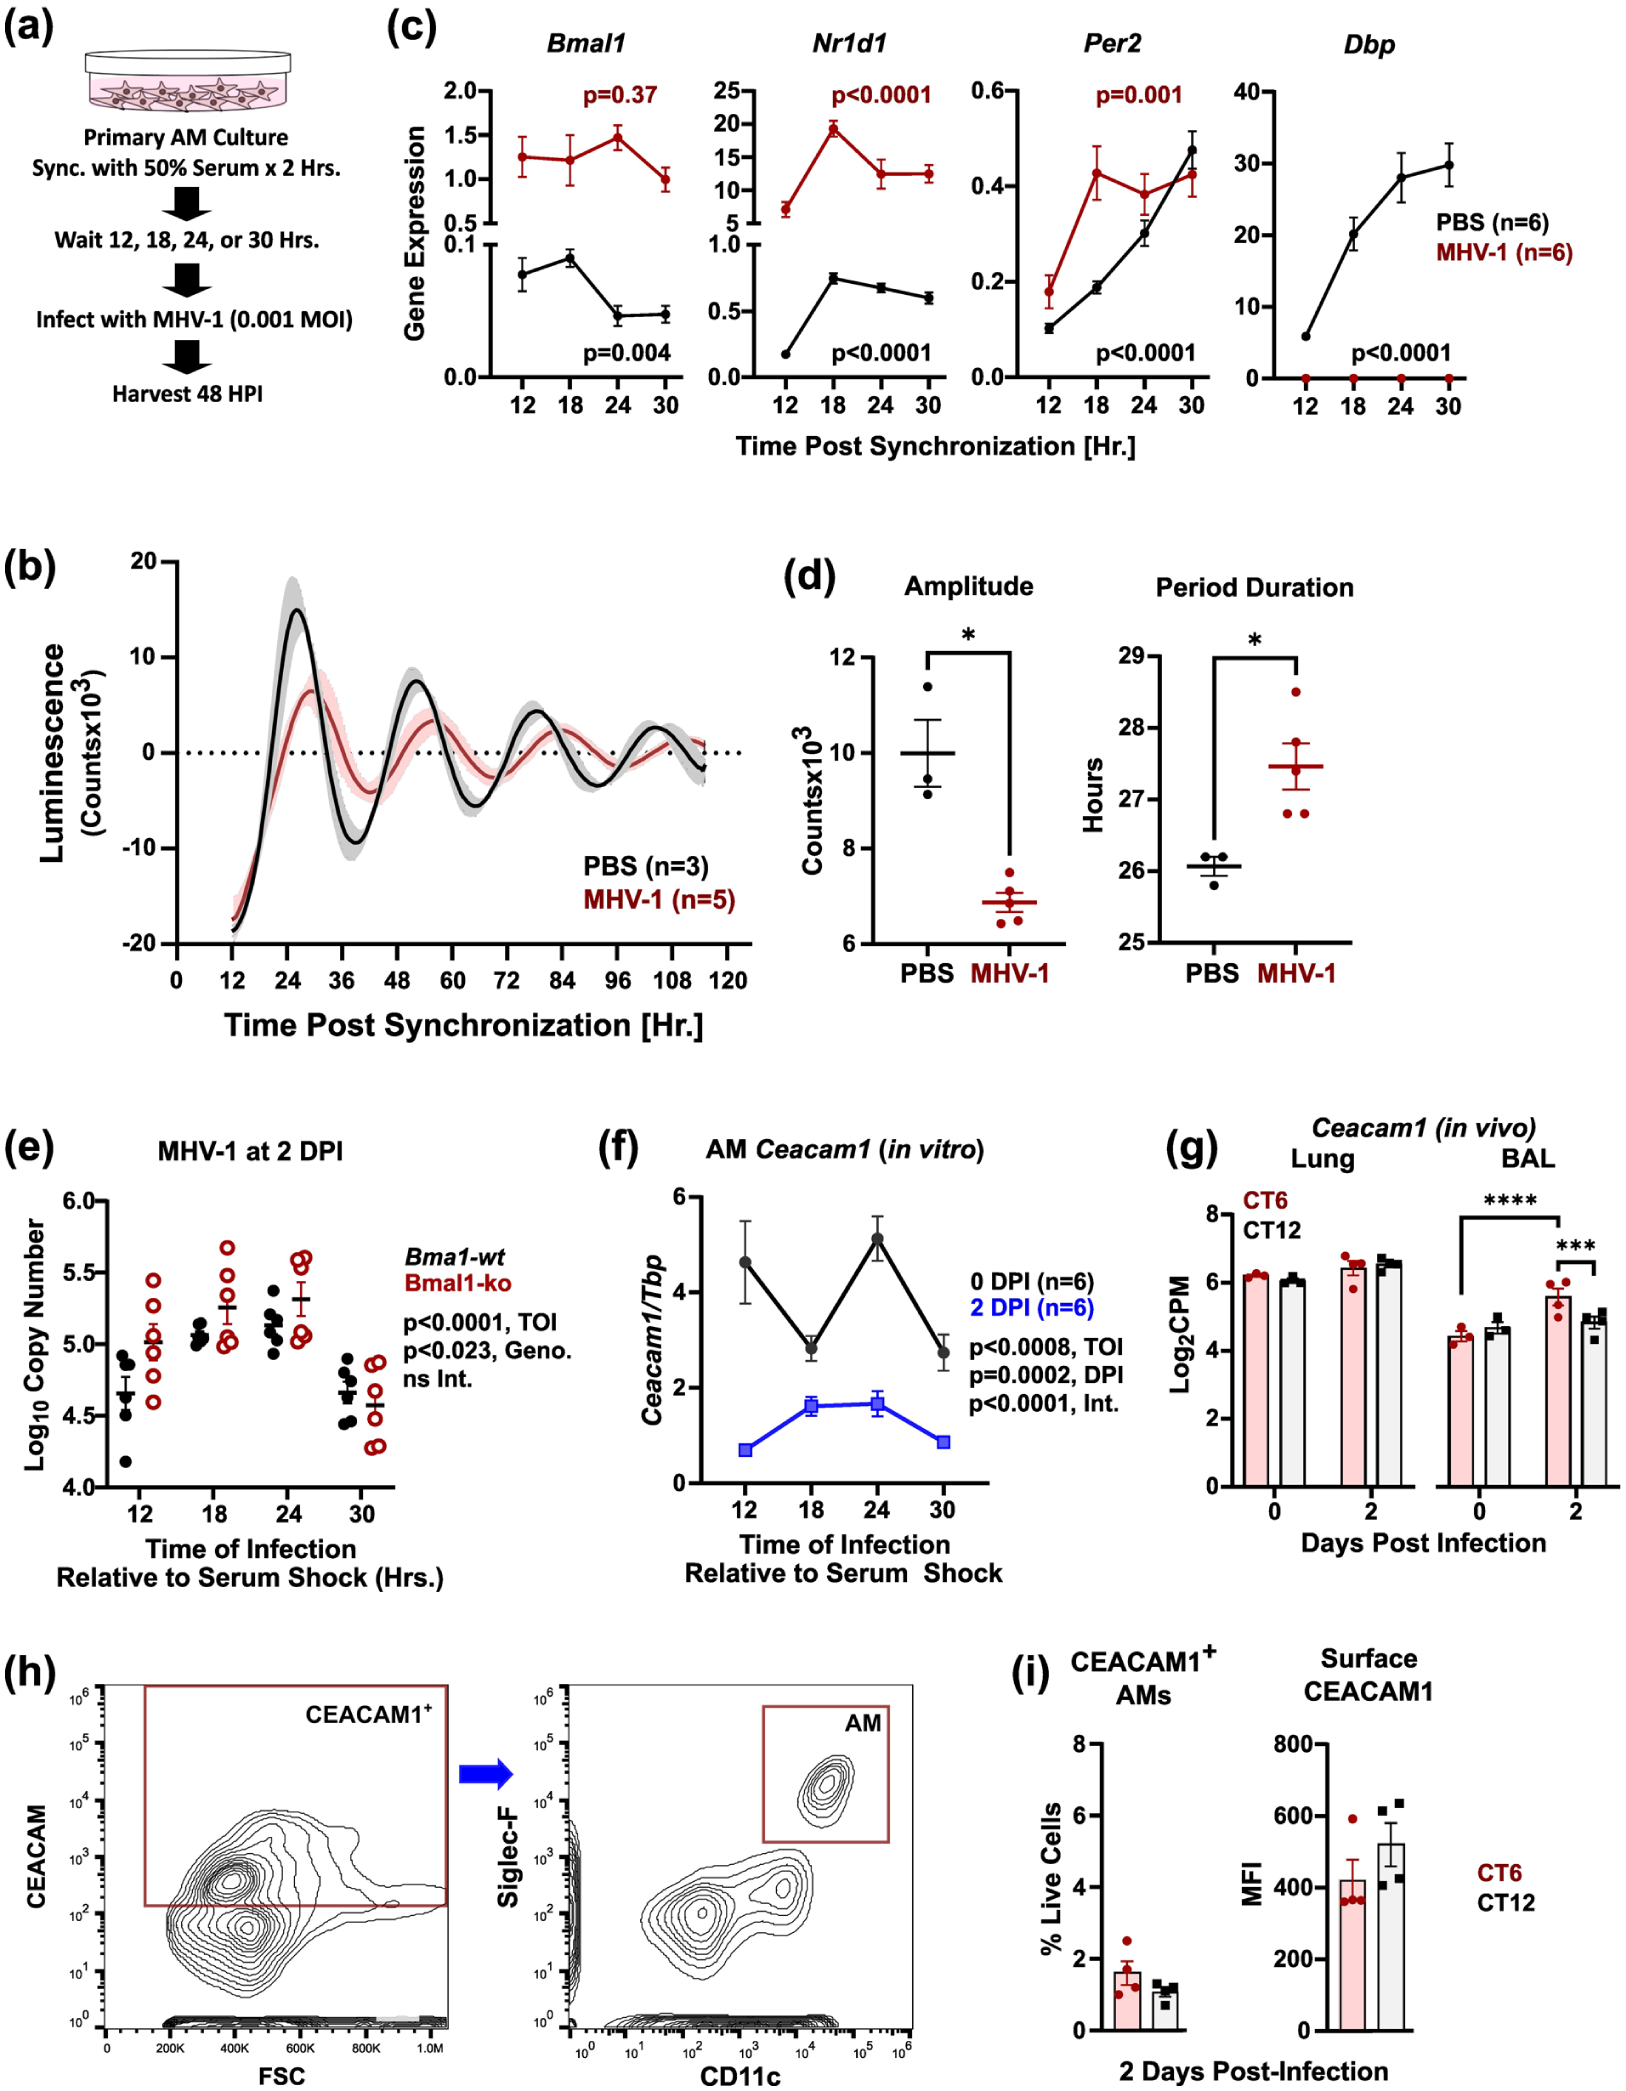
AMs have a Bmal1-independent rhythm in MHV-1 permissiveness. Panel (a) depicts our protocol for in vitro synchronization of AM clocks followed by MHV-1 infection at various circadian times. Panel (b) shows representative luminescence of synchronized AMs expressing Per2-luciferase (mean ± SD). Black tracing sham (PBS)- treated AMs (n = 3); red tracing, AMs infected with MHV-1 at the time of synchronization at 0.001 MOI (n = 5). Panel (c) shows expression of selected clock genes (mean ± SE, n = 6) in synchronized AMs at different circadian times. Black symbols, sham (PBS) treated cells; red symbols, MHV-1 infected cells at 2 DPI. Note that cells were exposed to MHV-1 and harvested at the same time post-synchronization. Depicted p-values were calculated by one-way ANOVA on log-transformed data. Panel (d) shows circadian rhythm parameter estimates for amplitude (left panel) and period duration (right panel), derived from Per2-luciferase recordings of AMs as shown in Panel (b) (mean ± SE). Panel (e) shows MHV-1 titer in the media at 2 DPI from synchronized AMs infected with MHV-1 at MOI = 0.001. Note that cells were exposed to MHV-1 and harvested at the same time post-synchronization. Black symbols, wt AMs; red open symbols, Bmal1-ko AMs. p-values were generated via two-way ANOVA on log-transformed data. Panel (f) shows Ceacam1 expression in wt AMs at various times post-synchronization (mean ± SE, n = 6). Black symbols, sham-treated cells; blue symbols, MHV-1-treated cells harvested at 2 DPI. p-values were generated via two-way ANOVA on log-transformed data. Panel (g) shows RNAseq data measuring Ceacam1 expression in BAL cells and lung in MHV-1 infected mice (mean ± SE, n = 3-4). Red symbols, CT6 infected mice; black symbols, CT12 infected mice. Panel (h) depicts our flow cytometry gating strategy to measure surface CEACAM1 expression on AMs. Panel (i) shows surface CEACAM1 on AMs from MHV-1 infected male mice (100 pfu PEG-fractioned virus) at 2 DPI. Left panel, CEACAM1 + AM frequency as a percentage of live lung cells; right panel, CEACAM1 median fluorescence intensity (MFI) on AMs. Bars represent the mean ± SE (n = 4). Red symbols, CT6 infection; black symbols, CT12 infection. *p < 0.05; **p < 0.0005; *p < 0.00005, Student t test on log normalized data.
AMs Regulate MHV-1 Pneumonia Severity and Time-of-Day Effects
If rhythms in AM permissiveness for MHV-1 are biologically meaningful, then targeting AMs should disrupt differences in pneumonia severity observed between CT6- and CT12-infected mice. To test this, we depleted AMs in mice by intranasal delivery of clodronate liposomes and then infected the mice with MHV-1 at CT6 or CT12 (Figure 8a). Neutral lipid carrier liposomes or a sham (PBS) treatment served as comparators. Clodronate treatment successfully depleted AMs, as shown microscopically (Figure 8b), by flow cytometry (Figure 8c), and via decreased CD11c gene expression in BAL cells (Figure 8d, left panel). We confirmed that these intranasal treatments did not affect Ceacam1 expression (Figure 8d, left panel). In addition to depleting AMs, clodronate also induced BAL cell neutrophil influx (Figure 8b, right panel) and strongly induced inflammatory gene expression in BAL cells (Figure 8d, right panel). Instilling neutral liposomes did not affect AM counts (Figure 8c) but did induce foamy macrophage formation (Figure 8b, middle panel), and low-level activation of Ifng and Il6 expression (Figures 8d, right panel). Clodronate rescued MHV-1-infected mice from dying and removed the survival differences between CT6 and CT12 infections (Figure 8f, left panel). Interestingly, neutral liposomes achieved similar effects but without depleting AMs (Figure 8f, right panel). Examining MHV-1 viral load in BAL, sham-treated mice exhibited the expected time-effect between CT6 and CT12-infected mice (Figure 8h). Clodronate significantly suppressed viral load overall and normalized differences between CT6 and CT12-infected mice (Figure 8h). Importantly, neutral liposomes did not suppress MHV-1 viral load overall but did eliminate the time-dependent difference between CT6- and CT12-exposed mice. Specifically, neutral liposomes prevented the boost in viral load observed with CT6 infection (p = 0.018, Student two-tailed t test) but did not affect viral levels with CT12 infection. These data show that AMs are an important contributor to MHV-1 pneumonia severity and, additionally, are critical for time-of-day differences in viral permissiveness in vivo.

Pharmacological targeting of AMs in vivo damps time-of-day variations associated with MHV-1 pneumonia. Panel (a) shows the experimental protocol. Panel (b) shows representative micrographs of BALs on 0 DPI after treatment with PBS, neutral liposomes, or clodronate-containing liposomes. Note clodronate produces AM necrosis, while neutral liposomes alone induce foamy macrophage formation. Scale bar = 100 μm. Panel (c) depicts lung flow cytometry quantifying AM frequency (mean ± SE, n = 6). Note that clodronate significantly depletes lung AMs, whereas neutral liposome treatment does not. Panel (d) depicts BAL cell expression of various genes at 0 DPI as a function of AM-directed pre-treatments (mean ± SE, n = 3-4). Black symbols, BAL cells from sham (PBS) treated mice; blue symbols, cells from neutral liposome treated mice; orange symbols, cells from clodronate treated mice. *p < 0.05; **p < 0.005, Student two-tailed t test on log-normalized data. Panel (f) depicts survival in MHV-1 infected mice (1500 pfu of PEG-fractioned virus), which were PBS-treated (unbroken lines), pre-treated with clodronate (dashed lines, left panel), or with neutral liposomes (dashed lines, right panel). Red lines, MHV-1 infection at CT6, black lines, MHV-1 infection at CT12. Note that we used a higher MHV-1 inoculum for these experiments based on observations that repeated intranasal treatments increased the LD50. *p < 0.05, log-rank test. Significance per log-rank test is shown. Panel (h) shows MHV-1 in BALs at 2 DPI, as measured by viral copy number (mean ± SE). Red symbols, CT6 infection; lack symbols, CT12 infection. **p < 0.005, Student two-tailed t test on log-normalized data.
Discussion
We show that the time of day at which mice are exposed to coronavirus affects multiple steps in subsequent pneumonia development, ranging from viral replication in the respiratory system to lung injury and, finally, survival. Furthermore, the data suggest a novel mechanism by which the time of day can influence the outcome of coronavirus pneumonia. In the MHV-1 pneumonia model, exposing male mice to the virus at midday, when they are typically resting and equivalent to midnight in humans, enhances MHV-1 infection of AMs and boosts viral load early in the course of infection. This likely increases the extent of lung injury, leading to a more severe innate inflammatory response and a higher risk of death. To our knowledge, this is the first report of an AM biological rhythm affecting the severity of viral pneumonia. However, previous studies in mice have shown that circadian rhythms in AM phagocytic activity modulate the severity of pneumococcal pneumonia (Kitchen et al., 2020; Silva Angulo et al., 2025). Thus, there is a general precedent for AMs imposing temporal sensitivity on respiratory infections, at least in mice.
The role of the molecular clock appears complex in the MHV-1 model. Globally deactivating Bmal1 function eliminates the rhythm in MHV-1 survival; however, Bmal1 function within AMs was not necessary for the effect. It is possible that Bmal1 activity in other structural lung cells, such as endothelial cells and type-I or type-II pneumocytes, generates the rhythm in MHV-1 pneumonia survival or influences AM permissiveness to infection via cell-cell interactions or paracrine effects. Alternatively, our findings could be a product of the central circadian pacemaker; for instance, circadian rhythms in autonomic tone that control airway caliber could potentially impact AM immune functions. Further research is needed to explore these possibilities.
Our data should be considered alongside pre-clinical reports linking circadian rhythms or circadian clock genes to SARS-CoV-2 pathogenesis. Zhuang et al. (2021) observed Bmal1-dependent rhythms in SARS-CoV-2 viral entry into epithelial cells in vitro and concluded these were due to oscillations in the expression of its receptor ACE2. While we saw temporal variation in the MHV-1 receptor Ceacam1 in cultured AMs, this variation did not match the rhythm of MHV-1 permissiveness in these cells or manifest at the protein level. In addition, we did not find significant differences in basal Ceacam1 expression between CT6 and CT12 in vivo. Given that SARS-CoV-2 has multiple mediators of viral entry (Behboudi et al., 2024), functionally analogous proteins yet to be identified for MHV-1 may be rhythmically expressed or activated. Alternatively, steps immediately following receptor engagement could be rhythmic and explain our findings, such as endocytic activity (McKee et al., 2023; Chang et al., 2025). Using lung epithelial and cardiomyocyte organoids, Tang et al. (2023) showed that knocking down the clock gene CIART reduced SARS-CoV-2 infection by affecting retinoid X receptor (RXR) signaling and lipid stores needed for virion synthesis. This study did not account for time of day as a biological variable and used an epithelial cell-only model, so it is unclear whether the described pathway relates to our observations in AMs. However, RXRs have been described as playing a role in macrophage lipid homeostasis (Rőszer et al., 2013), and we found that loading AMs with neutral liposomes disrupted the rhythm of MHV-1 survival in vivo. Further research is needed to explore the role of lipids in AM diurnal rhythms. To summarize, previous studies on biological rhythms in coronavirus infection mainly focused on in vitro observations of epithelial cells. Our study adds to this literature by identifying an immune component: “first contact” interactions between the virus and AMs in the airspace. Regarding the clinical importance of immunologic rhythms in coronavirus pneumonia, a recent study found that hospitalized COVID-19 patients who received dexamethasone at night had a reduced risk of in-hospital death or mechanical ventilation (Abusamak et al., 2025).
Our data should also be evaluated in relation to the existing research on circadian rhythms in other types of viral infections in mice. Sengupta et al. reported that infection with influenza at ZT11 elicited a more vigorous inflammatory response, lung damage, and higher mortality than infections at other times of day, but without a corresponding increase in viral load (Sengupta et al., 2019; Naik et al., 2023). Similarly, mice infected with murine parainfluenza virus-1 (Sendai virus) at ZT18 lose more weight than at other infection times, independent of virus levels (Ehlers et al., 2018). One difference between these viral species and MHV-1 is that beta coronaviruses productively infect AMs, whereas H1N1 influenza and Sendai virus mount “abortive” infections in these cells (Yip et al., 2014; Grant et al., 2021; Pöpperl et al., 2025). Another difference between our findings and those with influenza infection is that rhythms in influenza severity could be disrupted by Bmal1 ablation in myeloid cells or club cells (Sengupta et al., 2019); in contrast, neither conditional Bmal1 deletion affected rhythms in MHV-1 pneumonia. Furthermore, the variation of MHV-1 outcomes with time of day does not seem to follow a simple circadian or daily rhythm but more closely resembles either a 12-h ultradian rhythm or a daily pattern with an irregular waveform. This underscores that interactions between the circadian system and viruses are often complex and context-dependent in vivo, reflecting the diversity of viral life cycles and the host defenses they encounter across multiple biological levels (Borrmann et al., 2021; Zhuang et al., 2021; Tang et al., 2023). We propose that studying biological rhythms in viral infections in vivo lay bare this important complexity and provide valuable, pathogen-specific insights into disease that are lost in reductive in vitro models.
Finally, our data should be considered in the light of evidence that circadian and other biological rhythms differ between sexes. In humans and rodents, females generally show stronger circadian rhythms overall, including higher-amplitude activity patterns and a greater number of genes in their circadian transcriptomes (Talamanca et al., 2023; Astafev et al., 2024; Paschos et al., 2025). Females tend to be less vulnerable to circadian system disruptors, including night shift work, aging, and clock gene deletions (Alibhai et al., 2017; Anderson et al., 2023; Tofani et al., 2025). Immunologically, females exhibit higher amplitude rhythms in leukocyte trafficking (Kim et al., 2023). In addition, chronotherapeutic interventions, such as the timing of chemotherapy, may be more effective in females (Giacchetti et al., 2012; Kim et al., 2023). In the pulmonary pre-clinical literature, allergic sensitization to house dust mite extract in mice is significantly more time-of-day-sensitive in females than in males (Srinivasan et al., 2023). In contrast to this body of work emphasizing stronger circadian rhythms in females, diurnal rhythms in MHV-1 pneumonia appear prominently in male mice. Studies show that ovariectomy inhibits many circadian outputs in females, suggesting a role for female sex hormones (Paschos et al., 2025). However, in our hands, rhythms in MHV-1 survival were unaffected by tamoxifen, a selective estrogen antagonist. It may be that the male-selective rhythms we observed depend on other sex hormones, such as testosterone, or arise from sexually dimorphic chromatin patterns that influence gene expression and immune responses (Bhattacharya et al., 2024). Notably, male sex is linked to higher COVID-19 mortality, perhaps making biological rhythms in coronavirus pneumonia potentially easier to observe in males (Doerre and Doblhammer, 2022). More research is needed to investigate these possibilities.
To summarize, our study uncovers a new mechanism by which biological rhythms can influence the pathogenesis of coronavirus pneumonia. Our study has several limitations that should be considered. Since AMs were found to be essential to the severity of MHV-1 pneumonia, it was not possible to fully separate their role in mediating biological rhythms from their broader role in pneumonia development. This restricts our ability to draw causal conclusions. Our results do not exclude the possibility that other cell types (e.g., endothelial cells) or the central circadian pacemaker also contribute to rhythms in MHV-1 pathogenesis. All in vivo infectious models involve numerous factors that can influence results, including the preparation and lot-to-lot consistency of the infectious agent (MHV-1 in our case), differences in mouse resilience across genetic sub-strains, and the level of experimental handling. We tried to address this by empirically determining equivalent LD50 and sublethal doses for each individual viral lot and mouse sub-strain, and by including two different methods for viral preparation to ensure rigor. While we believe this strengthens the robustness of our data, it was not feasible to examine all endpoints across the entire range of experimental conditions for practical reasons. Similarly, the resource-intensive nature and sample-size requirements inherent to in vivo infectious models limited our ability to assess time of day with high precision. While our study analyzed MHV-1 infections at 6-h intervals across the day, we would have needed a much higher sampling density (2-h intervals) to definitively distinguish between ultradian time-of-day effects and daily rhythms with irregular waveforms. Further research will be needed to resolve this issue. Our study was designed to compare MHV-1 outcomes as a function of when exposure occurs during the day. To keep the duration of infection constant across comparison groups, the time of day mice were exposed to the virus and the time of data collection were kept consistent throughout. One limitation of this sampling strategy is that it does not detect rhythmic changes in individual infected animals that might unfold over time. Although littermate controls were used in all experiments, we did not assess microbiome composition in our animals, which could affect the outcomes of murine viral pneumonia (Steed et al., 2017). While we employed circadian rhythm semantics in presenting these data and used Bmal1 knockout mice, the patterns observed during MHV-1 infection do not strictly conform to a circadian rhythm and, in the case of survival, appear more consistent with a 12-h ultradian rhythm (Asher and Zhu, 2023). Regarding future clinical implications, our data cannot predict whether the time-of-day variations seen with MHV-1 infection will also occur in future viral pneumonia outbreaks, whether caused by emerging coronaviruses or other viruses. Despite these limitations, our findings broaden our understanding of what is biologically and clinically possible when core biological rhythms interact with the complex, multi-system response to respiratory viruses.
Supplemental Material
sj-pdf-1-jbr-10.1177_07487304261449284 – Supplemental material for Biological Rhythms in Coronavirus Pneumonia Pathogenesis
Supplemental material, sj-pdf-1-jbr-10.1177_07487304261449284 for Biological Rhythms in Coronavirus Pneumonia Pathogenesis by Huram Mok, Carrie Gierasch, Elaine Ostendorf, Aryaman Jaiswal, Avi J. Adler, Alex Ganninger, Lola Wright, Andrew Ganninger, Carolyn Fox, Krzysztof Hyrc, Gregory Shao, Anna Eubanks, Brielle Patlin, Manoj Arra, Prisha Kumar, Janice Huss and Jeffrey A. Haspel in Journal of Biological Rhythms
Supplemental Material
sj-xlsx-1-jbr-10.1177_07487304261449284 – Supplemental material for Biological Rhythms in Coronavirus Pneumonia Pathogenesis
Supplemental material, sj-xlsx-1-jbr-10.1177_07487304261449284 for Biological Rhythms in Coronavirus Pneumonia Pathogenesis by Huram Mok, Carrie Gierasch, Elaine Ostendorf, Aryaman Jaiswal, Avi J. Adler, Alex Ganninger, Lola Wright, Andrew Ganninger, Carolyn Fox, Krzysztof Hyrc, Gregory Shao, Anna Eubanks, Brielle Patlin, Manoj Arra, Prisha Kumar, Janice Huss and Jeffrey A. Haspel in Journal of Biological Rhythms
Footnotes
Acknowledgements
We thank Robyn Puro for her editorial input.
Author Contributions
H.M. and J.A.H. conceived the study and wrote the manuscript. All authors performed experiments and vouch for the data and analysis. All authors participated in the editing and critical review of the manuscript and decided to submit it for publication.
Conflict of Interest Statement
The authors have no potential conflicts of interest with respect to the research, authorship, and/or publication of this article.
Funding
The authors disclosed receipt of the following financial support for the research, authorship, and/or publication of this article: This work was supported by NIH R01HL152968, NIH R01HL172823, NIH R01HL173976, and an NIH Special Instrumentation Grant (S10OD032121).
Ethical Considerations
The Washington University School of Medicine Institutional Review Board approved all experiments.
Data Availability Statement
The RNA-seq data reported in this study are available at the NIH GEO (GSE301278).
Notes
References
Supplementary Material
Please find the following supplemental material available below.
For Open Access articles published under a Creative Commons License, all supplemental material carries the same license as the article it is associated with.
For non-Open Access articles published, all supplemental material carries a non-exclusive license, and permission requests for re-use of supplemental material or any part of supplemental material shall be sent directly to the copyright owner as specified in the copyright notice associated with the article.