
Abstract
Self-administered mixed-mode surveys are increasingly used as an alternative to face-to-face surveys for collecting data from the general population. However, little is known about how decisions regarding the incentive scheme and the mode-choice design jointly affect key outcomes such as response rates, net sample composition, and survey costs. To study this, we drew a probability sample of the residential population of the city of Mannheim, Germany (N = 2,980) and randomly assigned target persons to one of four incentive schemes (€0, €1, or €2 prepaid incentive on first contact, and €2 delayed prepaid incentive) and one of two mode-choice designs (concurrent or sequential [web-push]). Our results indicate that small prepaid monetary incentives work better in concurrent than in sequential designs. Moreover, a €2 prepaid incentive in a concurrent design proved particularly successful for older target persons, probably reinforcing their sense of trust and reciprocity, while also fitting better with their survey-mode preferences. Finally, a €2 delayed prepaid incentive in a sequential design primarily motivated target persons aged under 50 years. This combination of incentive scheme and mode-choice design also proved to be most cost-effective in that age group. Based on our results, we recommend using sampling frame information on age to address different age groups with different combinations of incentive scheme and mode-choice design. This may help to maximize response rates, achieve a balanced net sample composition, and minimize survey costs.
Introduction
As response rates for face-to-face surveys are falling, and costs are increasing (Beullens et al., 2018), the search for alternatives has been growing in importance in recent years. This development was further accelerated by the spread of COVID-19, as social distancing was one of the key measures for dealing with the pandemic.
Web surveys meet the need to collect data cost-effectively and physically distanced from respondents. However, they suffer from two important limitations. First, in most countries, survey managers lack an adequate sampling frame that would allow them to draw probability samples of Internet users or to recruit their target persons directly online (i.e., via email; Blom et al., 2015; Scherpenzeel and Das, 2010). Second, although Internet penetration is close to saturation in developed societies, empirical evidence suggests that the web mode predominantly attracts younger persons. By contrast, older target persons still prefer paper questionnaires at higher rates, and they sometimes struggle with online participation (Olson et al., 2012; Seil et al., 2021). As most sampling frames include residential addresses, thereby enabling target persons to be contacted by postal mail, offering web- and paper-based questionnaires for general population surveys seems to be a promising avenue for collecting data cost-effectively while improving the composition of the net sample (i.e., all cases treated as respondents) by including the offline population (Messer and Dillman, 2011).
Data collection experiments implemented in the European Values Study (EVS) 2017 suggest that self-administered mixed-mode (web, paper) surveys yield comparable response rates to face-to-face surveys, even for long questionnaires (Luijkx et al., 2021). In EVS Germany, Wolf et al. (2021) implemented a survey-mode experiment and found that the response rates in two self-administered mixed-mode surveys even exceeded that in the face-to-face survey, while overall costs were reduced by more than half. At the same time, the study showed only minor differences in substantive answers to core items of the EVS questionnaire. While such findings suggest that self-administered mixed-mode surveys are a viable alternative to face-to-face surveys, more research is required on the effects of the interplay of key survey-design elements (e.g., the incentive scheme and the mode-choice design) on response rates and net sample composition.
In addition, little is known – or has been published – about how key survey-design elements affect survey costs. This deficit recently led to a call to unpack this “black box” (Olson, 2021). To the best of our knowledge, a study by Biemer et al. (2018) is the only one to date that has explicitly addressed the interplay of incentive scheme and mode-choice design and examined the consequences of this interplay for response rates and survey costs. However, to encourage web participation, that study promised target persons a bonus monetary incentive (US$10) for choosing the web option over the paper option. Moreover, the study was extremely well resourced, offering incentives of up to US$35 to participate in the survey. Hence, it is questionable whether the results are readily transferable to survey contexts that use only small incentive amounts.
So how do incentives and mode-choice design interact in surveys, where only small monetary incentives can be offered, and no bonus incentives can be given for participating in a particular mode? To answer this question, our study – which represents the prototypical low-resource survey frequently employed, for example, by universities, non-university research institutes, and public administrations – relies on a probability-based mixed-mode (web, paper) survey carried out in the German city of Mannheim (310,000 residents). For the purpose of this study, we experimentally varied the mode-choice design (concurrent vs. sequential [web-push]) and the amount of the small prepaid (i.e., unconditional) incentive (€0, €1, €2) enclosed with the survey invitation. Additionally, target persons in two experimental groups received a €2 prepaid incentive only with the second contact. We refer to that incentive in what follows as a delayed prepaid incentive, because it was not delivered with the first contact letter but rather with the reminder letter.
The main objective of our analyses is to uncover the effects of combinations of prepaid or delayed prepaid monetary incentives and mode-choice design on response rates, net sample composition, and survey costs. Therefore, in the following sections, we first review previous research on the effects of prepaid and delayed prepaid monetary incentives and mode-choice design on these three outcome variables. Based on this evidence, we hypothesize how different combinations of incentive scheme and mode-choice design might affect response rates, net sample composition, and survey costs. After presenting our data, methods, and empirical results, we conclude by discussing the implications of our findings for survey design, and reflect briefly on the use of adaptive designs in self-administered mixed-mode surveys.
Prepaid monetary incentives
In many surveys, researchers use prepaid monetary incentives to motivate their target persons to take part. Although prepaid incentives are usually provided with the initial contact, some researchers introduce them in subsequent contacts as a tool for refusal conversion (McGonagle and Freedman, 2017).
Empirical evidence clearly suggests that prepaid monetary incentives offered with the first contact attempt significantly improve response rates, and their effectiveness has been reported to be relatively stable in recent decades (Mercer et al., 2015). This positive effect also holds for small prepaid incentives, which seem to work particularly well in paper-based surveys (Edwards et al., 2005; Stadtmüller, 2009). Prepaid monetary incentives are assumed (a) to trigger the reciprocity norm by evoking in the recipient a feeling of moral obligation to comply with the survey request, and (b) to establish trust (Becker and Glauser, 2018; Dillman et al., 2014; Gouldner, 1960). Compared with prepaid monetary incentives offered with the initial contact, empirical evidence on delayed prepaid incentives is rare. However, the little evidence there is suggests that delayed prepaid incentives might yield similar effects on response rates (Blom et al., 2015; McGonagle and Freedman, 2017) while resulting in lower survey costs.
Findings on the effects of prepaid incentives on net sample composition are much more ambiguous (McGonagle and Freedman, 2017; Petrolia and Bhattacharjee, 2009; Singer et al., 1999), with one meta-analysis even finding that “the use of an incentive is not reliably related to the magnitude of [unit] nonresponse differences” (Groves and Peytcheva, 2008: 176). For self-administered surveys, McGonagle and Freedman (2017) found that delayed prepaid monetary incentives were more effective for older than for younger adults, and that they elevated the response rates of less educated people, thereby reducing nonresponse bias (see also Petrolia and Bhattacharjee, 2009). By contrast, Sun et al. (2020) showed that a small prepaid incentive (US$2) did not affect the response rates of usually underrepresented groups. However, older target persons were more inclined to respond when they received a prepaid incentive.
One potential drawback of prepaid and delayed prepaid monetary incentives in cross-sectional surveys is cost. When researchers decide to provide such incentives, part of their funds are “wasted” in the sense that most target persons pocket the incentive but do not comply with the survey request. However, as prepaid incentives on first contact can strongly increase response rates and foster early participation, the associated costs can often be partly compensated for because a smaller number of target persons have to be contacted again (Mann et al., 2008).
Mode-choice design
In self-administered mixed-mode surveys, target persons are offered a web- and a paper-based questionnaire. Mode-choice design refers simply to when the two modes are offered: In a concurrent mixed-mode design, target persons are offered a choice of the two survey modes in each contact attempt. A sequential mixed-mode design usually starts by offering the cost-effective web mode and introduces the more expensive paper-based questionnaire option only in subsequent contact attempts (DeLeeuw, 2018; Hox et al., 2017). For the latter approach, Dillman (2017) coined the term web-push data collection, where a postal mail invitation letter with access information is used to obtain responses mostly over the Internet, while the paper-based questionnaire is withheld until later contacts.
Generally, including multiple modes of data collection can increase response rates, as different parts of the population favor different survey modes. Even more importantly, it might also lead to a more balanced net sample in terms of age, as older people use the Internet less often than do younger people, and they appear to prefer a paper-based questionnaire over a web survey. Older people are thus more likely to participate in a web-and-paper survey as opposed to a web-only survey (Olson et al., 2012; Seil et al., 2021). Although offering multiple survey modes appears favorable for response rates at first glance, a meta-analysis by Medway and Fulton (2012) concluded that concurrently offering a web-based option and a paper-based questionnaire resulted in a reduction in response rates of around 3.8%. To explain this phenomenon, Dillman et al. (2014) and Tourangeau (2017) argued that offering target persons multiple options concurrently might make things more complicated for them, so that some target persons might be inclined to postpone their decision to participate. Millar and Dillman (2011) showed that when both modes were offered sequentially, starting with the web mode, response rates did not differ from the paper-only condition. However, for the general population in Germany, recent studies by Wolf et al. (2021) and Mauz et al. (2018) found that the sequential mixed-mode design did not outperform the concurrent approach in terms of response rates.
When it comes to the composition of the net sample (i.e., all cases treated as respondents), there is some empirical evidence that net samples in mixed-mode surveys are more balanced than those in single-mode surveys (Cornesse and Bosnjak, 2018). This holds particularly for web-and-paper compared with web-only surveys, as the latter exclude certain segments of the population, especially the elderly (Messer and Dillman, 2011; Cornesse and Schaurer, 2021). In a similar vein, Bandilla et al. (2014) reported that complementing a web survey with a paper-based questionnaire brought their net sample more into line with a face-to-face reference sample. However, to our knowledge, empirical evidence is lacking on the effects of mode-choice design on net sample composition in self-administered mixed-mode surveys. On the one hand, it seems plausible to not expect the composition of the net sample to differ strongly between a concurrent and a sequential self-administered mixed-mode survey, as target persons are offered both survey modes, albeit at different times. However, due to different mode preferences between the age groups, one might at least expect the net sample composition to vary significantly between the different contact attempts, depending on the mode-choice design.
Regarding survey costs, sequential mixed-mode (web-push) designs are very appealing, as target persons with a high willingness to participate will do so in the more cost-effective web mode, whereas more resources are allocated to target persons with a lower response probability. This web-push strategy pays off in surveys with a small number of contact attempts targeting a web-prone population. However, it may turn out differently in the general population, where relying on a concurrent mixed-mode design might result in a substantially higher survey participation after the initial contact, as target persons with a strong preference for paper-based questionnaires are much more likely to respond. Consequently, fieldwork efforts in subsequent contacts, and thus survey costs, might be reduced. In essence, this front-loading effect in the concurrent design might at least partly compensate for the expected cost savings in the sequential design.
The interplay of prepaid monetary incentives and mode-choice design
Despite the growing body of research on the effects of monetary incentives and mode-choice design on outcome measures such as response rates or net sample composition, there is a surprising lack of research (or theorizing) on how these two key design conditions might influence each other. Our data collection experiment allows us to address the question of whether the effects of the interplay of prepaid and delayed prepaid monetary incentives and mode-choice design on response rates, net sample composition, and survey costs differ from those of each survey design element on its own. In the following, we propose one hypothesis for each of these three target variables.
Regarding response rates, we expect that prepaid monetary incentives delivered with the initial contact letter will have a stronger effect on survey participation in a concurrent mode-choice design than in a sequential mode-choice design (H1). In line with the psychological processes described above, target persons can be expected to feel morally obliged to comply with the survey request when they receive a small prepaid incentive (Becker and Glauser, 2018; Dillman et al., 2014; Gouldner, 1960). In a sequential design, strong mode preferences may, however, counteract the desired impact of the prepaid incentive provided with the initial contact. More precisely, when the subjectively more suitable paper-based questionnaire is offered only in subsequent contact attempts, the feeling of a moral obligation evoked by the prepaid incentive received earlier might have already dissipated.
With respect to net sample composition, we assume that small prepaid monetary incentives on first contact in the concurrent design will attract older target persons in particular (H2). There are two reasons for this assumption. First, small prepaid monetary incentives (especially if they are declared to be a token of appreciation for survey participation) trigger the reciprocity norm and contribute to establishing trust. Thus, older target persons may be more responsive to prepaid monetary incentives, as empirical evidence suggests that they show, on average, higher levels of trust and reciprocity (Dohmen et al., 2008; Sutter and Kocher, 2007). Second, older target persons are more inclined to fill in a paper-based rather than a web-based questionnaire (Olson et al., 2012; Seil et al., 2021). Hence, a concurrent design with a prepaid monetary incentive on first contact fits with the mode preference of older target persons and successfully addresses their higher sense of trust and reciprocity.
When it comes to survey costs, we assume sequential designs to be generally more cost-effective, as they push target persons toward the less expensive web mode. Hence, people with a high willingness to participate in surveys, and who are not entirely reluctant to take part via the web will do so when they are initially contacted (Messer and Dillman, 2011), so that a costly paper-based questionnaire does not have to be provided. For one thing, this effect should be especially pronounced when a prepaid incentive is provided, as the moral obligation evoked by the incentive might even push those target persons to the web mode who usually prefer to take part via a paper-based questionnaire. However, we have already hypothesized (H1) that prepaid incentives are most effective when both survey modes are available at the time the incentive is provided. This is exactly the case in the sequential design with the delayed prepaid incentive. Accordingly, we assume that this combination will be most cost-effective as it (a) exploits the cost-effectiveness of the web mode, (b) introduces the prepaid incentive only when both survey modes are available, and (c) decreases the number of incentives that need to be paid out (H3).
In sum, our hypotheses are as follows:
Data and methods
The data for this study were collected with a self-administered mixed-mode (web, paper) survey carried out between November 3, 2019, and March 16, 2020, in the city of Mannheim, Germany. For the sampling, we drew on the city’s population register, which covers the residential population of Mannheim, and requested a random sample of postal addresses of 3,000 persons aged 18 years and older. For each of the sampled persons, we received their name and address, as well as information on their sex, year of birth, and citizenship. Prior to fieldwork, we excluded 20 cases from our gross sample. We did so because we had also drawn another sample of 3,000 persons living in Mannheim from the German postal service, Deutsche Post, in order to compare the two sampling frames (for a comparison of the two samples, see Stadtmüller et al., 2023). We asked our print service provider to drop all duplicates, that is, cases that were included in both sampling frames, which resulted in the exclusion of the aforementioned 20 cases. Accordingly, a total of 2,980 persons were invited to participate in the survey.
We contacted the target persons by postal mail, invited them to participate, and informed them about the purpose and content of the survey. Those who did not participate after the initial contact were contacted again five weeks later. The study was framed as a survey about the local community and political issues. The first part of the questionnaire asked respondents about the extent of their feeling of connection to Mannheim, the most important problem facing the city, and the quality of life there. The local character of the survey was further emphasized by the fact that it was conducted by GESIS, a Mannheim-based public research institute. The next – the main – part of the questionnaire addressed more generic issues, such as political attitudes and the perception of surveys. Both topics were communicated in the invitation letter. The median completion time for web respondents was 27 minutes. The layout of the web-based questionnaire was optimized for smartphones and tablets.
The survey included a 2x4 factorial experiment. The first factor varied the mode-choice design (concurrent or sequential); the second factor varied the incentive scheme (no incentive, €1 prepaid, or €2 prepaid on first contact, and €2 delayed prepaid). We randomly assigned each target person to one of eight experimental groups (see Table 1). In the sequential design, we initially provided our target persons only with login information (URL and password) for the web-based questionnaire. By contrast, target persons assigned to the concurrent design additionally received a paper-based questionnaire and a return envelope with the initial contact letter. All target persons who did not participate in the survey after the initial contact were sent a second contact letter with login information for the web-based questionnaire and a paper-based questionnaire.
Overview of the experimental groups and the design elements
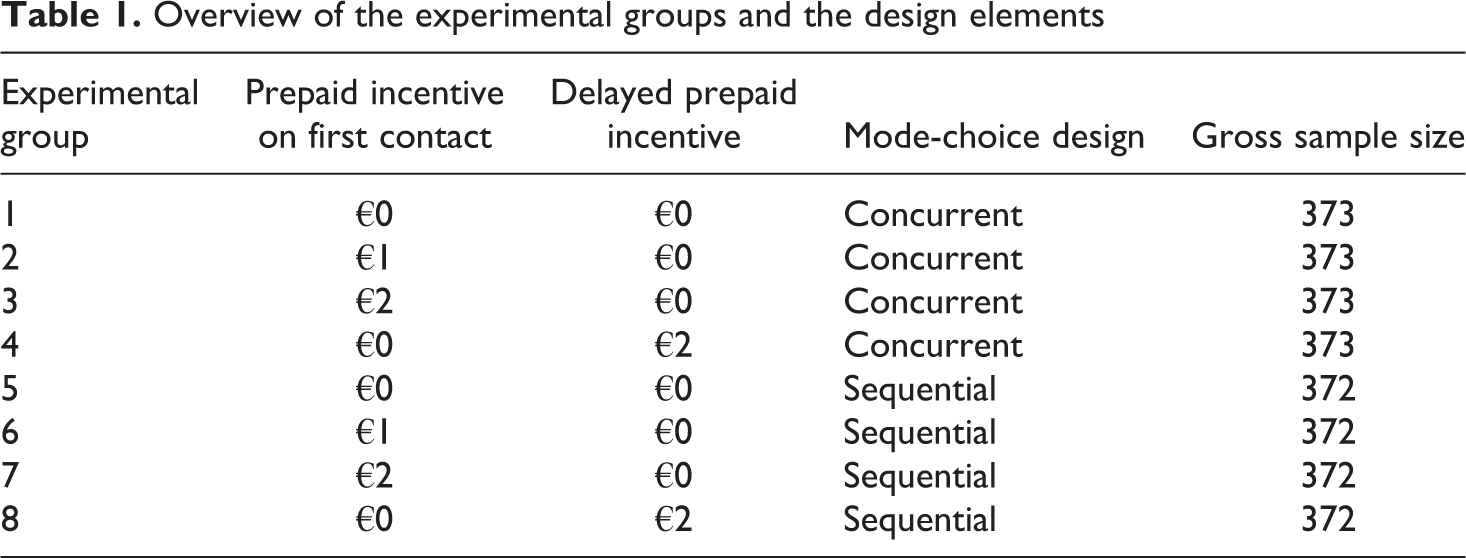
Although many surveys use more valuable incentives, we were interested in investigating whether small incentives still help to boost response rates if they are declared to be a token of appreciation (Dillman et al., 2014). Due to budget constraints, we were unable to include a further experimental group with a larger monetary incentive. The prepaid incentives consisted of a 1 euro or 2 euro coin, which our print service provider affixed to the invitation letter. The coin was described at the end of the invitation letter as a small token of our appreciation for the effort of participating in the survey. Moreover, the four experimental groups that did not receive an incentive with the first contact were split randomly into two groups that would receive either a €2 delayed prepaid incentive or no incentive with the second contact. In the second invitation letter, the delayed incentive was also declared to be a token of appreciation for survey participation.
Measures
The main dependent variable of our study was survey participation. We calculated the overall response rate (American Association for Public Opinion Research [AAPOR] Response Rate 2; see AAPOR, 2016) by experimental group. Partially completed questionnaires were treated as respondents if more than 50% of the core questions (i.e., questions addressed to all participants) were answered. In addition, we created a dichotomous variable indicating whether target persons took part after the first or the second contact based on the information on the date of completion (for the web survey) or the date of the postmark on the return envelope (for the paper questionnaire).
To analyze sample composition, we relied on the information in our sampling frame on year of birth, sex, and citizenship. For these variables, we were also able to compare the distribution of the net sample with information on our target population from official data (City of Mannheim, 2020). However, as our hypothesis regarding net sample composition (H2) relates only to the effect of the interplay of incentive scheme and mode-choice design on the age structure of the sample, we focused on the age variable in the main part of our analysis.
Survey costs were measured as costs per complete case (including partially completed questionnaires if more than 50% of core questions were answered) for each of the eight experimental groups. As Olson (2021) pointed out, reporting costs per complete case is one of the most generalizable methods of reporting costs across studies. To calculate costs per complete case, we specified the numerator as the group-specific overall survey costs and the denominator as complete cases per experimental group. The overall survey costs are the sum of (1) costs for material (e.g., envelopes), printing and processing (e.g., folding); (2) costs for incentives (including costs for procuring the coins and affixing them to the invitation letters); (3) postage costs (including postage of returned questionnaires); and (4) costs of entering the data of the returned paper-based questionnaires. In addition, we also calculated group-specific costs per complete case separately for two age groups, namely, target persons aged 50 years and older, and target persons younger than 50 years.
Our main independent variable was the experimental group to which each target person was assigned (see Table 1). We also created a mode variable indicating the mode that the respondent chose (0 = web, 1 = paper).
Analysis
Our analysis comprised five steps. First, we calculated the overall response rate and compared the demographic composition of our net sample with official data and data from our sampling frame. Second, we estimated the individual effects of our survey design elements (incentive scheme and mode-choice design) on survey participation. In a third step, we compared the overall response rates across the eight experimental groups. As these groups represent combinations of prepaid/delayed prepaid incentives and mode-choice design, we could test for effects of an interplay between these variables on response rate, as assumed in H1. To gain further insights into the processes of survey participation over the course of the field period, we estimated two additional models to predict participation after the first and second contact, respectively. In the fourth step, we included an interaction between age and the experimental groups, as this allowed for testing our hypothesis H2, which suggested that design effects differed between target persons of different ages. Lastly, to test H3, we calculated survey costs per experimental condition and by the age of our target persons.
Results
Overall response rate and description of the net sample
Of our 2,980 target persons, 300 (10.1%) were classified as ineligible (e.g., because they were deceased or had moved away); 2,048 (68.7%) were of unknown eligibility (i.e., nothing ever returned); 19 (0.6%) explicitly refused to take part (e.g., by sending back a blank questionnaire); and a further 17 (0.6%) answered less than 50% of the core questions, and were thus considered nonrespondents. Two hundred and thirty-eight target persons (8.0%) who participated in the web mode and 358 target persons (12.0%) who participated in the paper mode answered at least 50% of the core questions and were thus treated as respondents. In sum, this resulted in a net sample of N = 596 respondents and an overall Response Rate 2 of 22.2% (AAPOR, 2016).
To compare our net sample with the official data, we recoded age into five groups (18–24, 25–29, 30–64, 65–79, 80 years and older). As can be seen from Table 2, in terms of age and sex, our net sample did not differ significantly from the official data or from the distribution in the sampling frame. However, German citizens were clearly overrepresented in our net sample (91.4% vs. 71.3% in the sampling frame). Moreover, 61% of our respondents reported having a higher education entrance qualification (i.e., Abitur or Fachabitur). According to the results of the 2011 German Census, this was true of only 33% of the population of Mannheim. Finally, the fact that the median personal net monthly income in our net sample was €2,345 suggests that respondents were relatively privileged in terms of socioeconomic status. However, we do not have any information on the distribution of this variable in our target population.
Demographic composition of the net sample compared with official and sampling frame data (in percent)
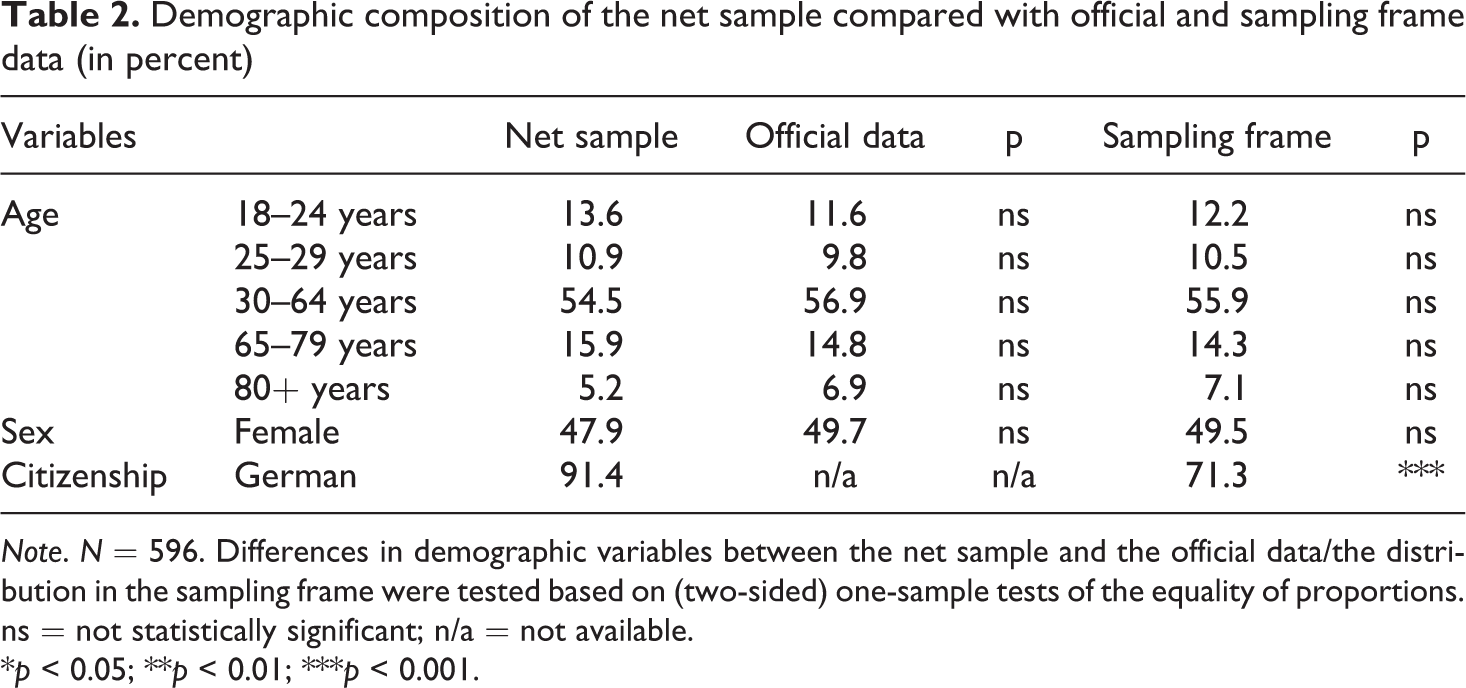
Note. N = 596. Differences in demographic variables between the net sample and the official data/the distribution in the sampling frame were tested based on (two-sided) one-sample tests of the equality of proportions.
ns = not statistically significant; n/a = not available.
* p < 0.05; ** p < 0.01; *** p < 0.001.
Individual effects of incentives and mode-choice design on response rates
With respect to our survey design elements, incentives, and mode-choice design, we first estimated their individual effects on the overall response rate and on the response rates after the first and second contact.
Logistic regression models predicting response rates (after the first contact, the second contact, and overall) by incentive scheme and mode-choice design
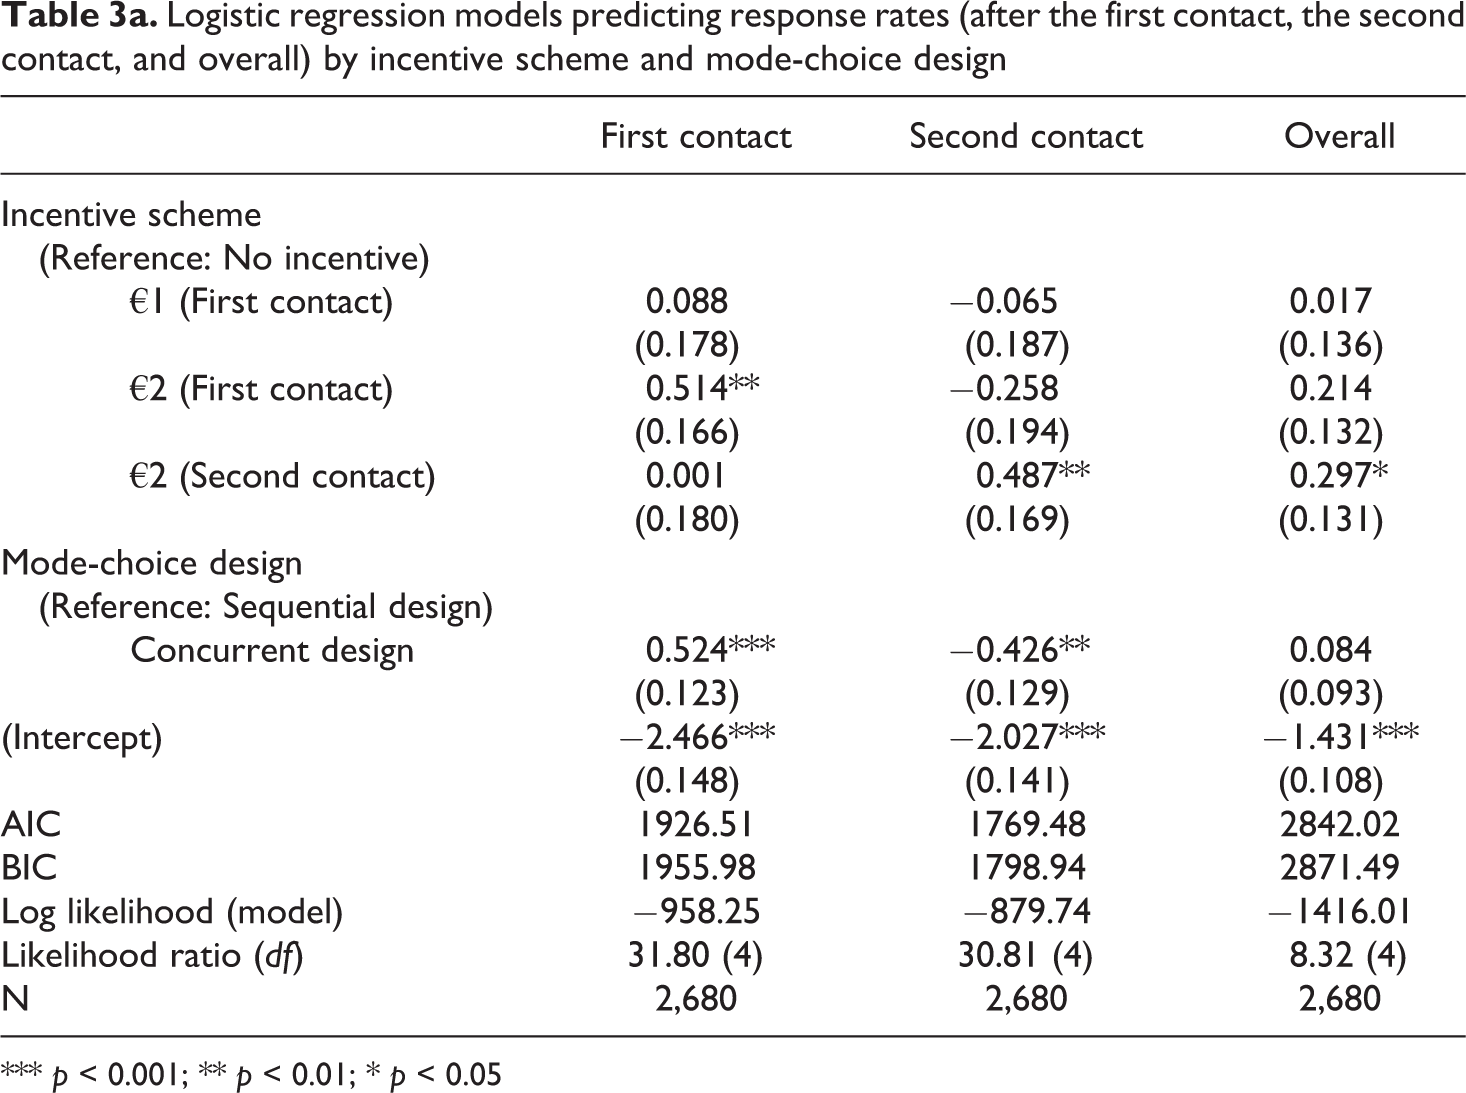
*** p < 0.001; ** p < 0.01; * p < 0.05
Predictive margins of response rates (after the first contact, the second contact, and overall) by incentive scheme and mode-choice design (based on the regression models in Table 3a)
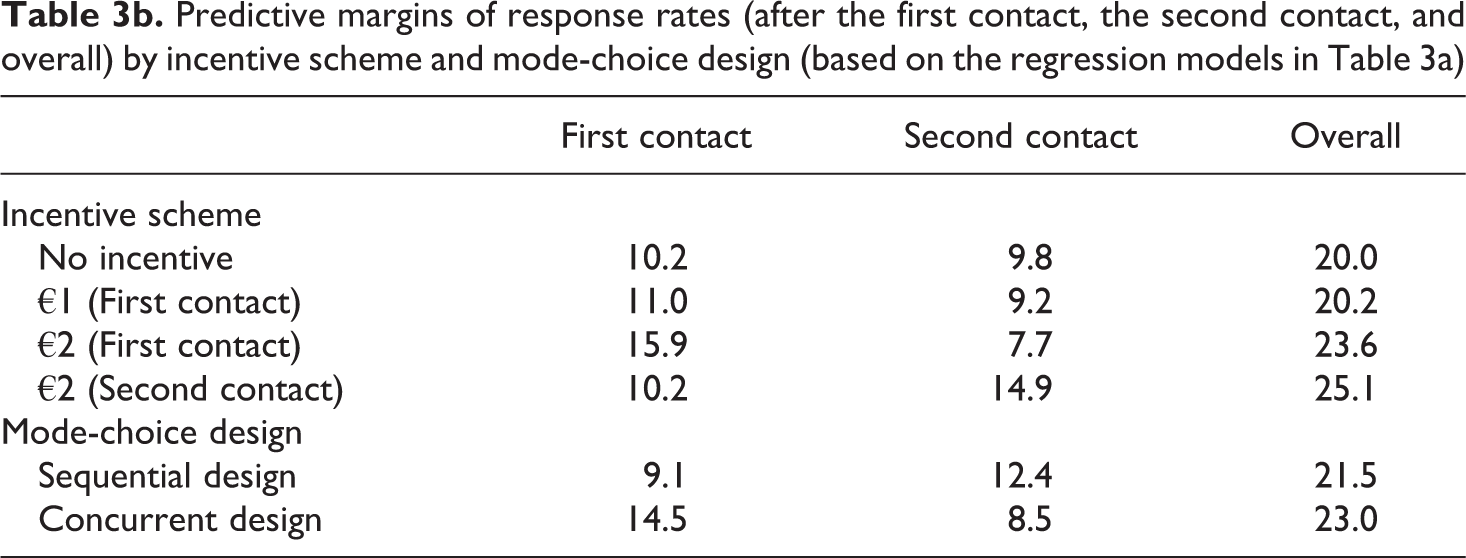
As can be seen from Tables 3a and 3b, the €1 prepaid incentive did not exert an effect on the overall response rate or on survey participation after the first and second contact. By contrast, compared with the no-incentive condition, the €2 prepaid incentive increased the response rate significantly by 5.7 percentage points (p < .01) after the first contact, but slightly decreased participation after the second contact (−2.1 percentage points; p = .184). Although the net effect on overall response was still positive (+3.5 percentage points), it was not statistically significant at conventional levels (p = .107). This was different for the €2 delayed prepaid incentive, which exerted a significant effect on both the overall response rate (+5.1 percentage points; p < .05) and on the response rate after the second contact (+5.1 percentage points; p < .001). Finally, the results for the mode-choice design suggest that the concurrent design outperformed the sequential design with respect to the response rate after the first contact (+5.4 percentage points; p < .001). However, survey participation after the second contact was higher when the paper-based questionnaire was enclosed only with the reminder letter (i.e., in the sequential design; +3.9 percentage points; p < .01). In sum, the concurrent design slightly outperformed the sequential design regarding overall response rate, but not in a statistically significant way (+1.5 percentage points; p = .370).
Joint effects of incentive scheme and mode-choice design on response rates
As our experimental groups represent combinations of incentive scheme and mode-choice design, we deduced the joint effects of these two survey design elements on survey participation by comparing the overall response rates by experimental group. As Table 4 shows, the response rates varied substantially between 19.1% and 26.2%. However, due to the small sample sizes of each experimental group, which resulted in larger variances of the point estimates, these differences were not statistically significant. Yet, we found that the sequential design with a €2 delayed prepaid incentive and the concurrent design with a €2 prepaid incentive on first contact yielded the highest response rates (26.2% and 26.1%, respectively). This is in line with our hypothesis H1, as in both groups all survey modes were available at the time the incentive was given. Similarly, when we pooled the data from the concurrent designs with a prepaid incentive (€1 or €2) on first contact and compared them with the sequential designs with the same incentive scheme, the response rates for the concurrent designs were higher (23.7% vs. 20.1%), albeit again not at conventional levels for statistical significance (χ2 (1) = 2.48 (p = .116).
Turning to the different contact attempts, the share of response after the first contact (see Table 4, Column 3) suggests a front-loading effect in the concurrent designs (62.9% vs. 42.7%; χ2 (1) = 24.49; p < .001), whereas response after the second contact was higher in the sequential designs.
Overall response rates (AAPOR Response Rate 2) and share of early, online, and older respondents by experimental group
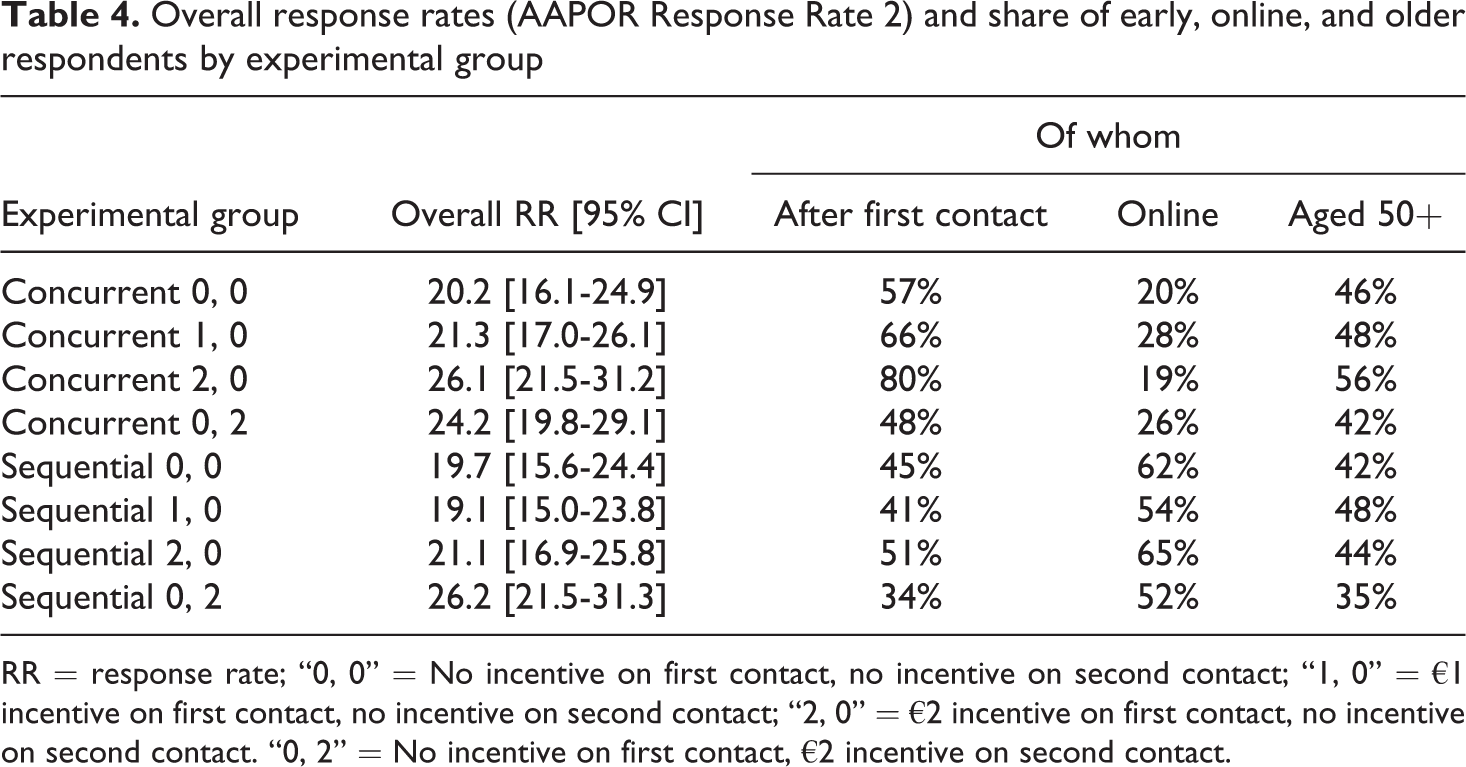
RR = response rate; “0, 0” = No incentive on first contact, no incentive on second contact; “1, 0” = €1 incentive on first contact, no incentive on second contact; “2, 0” = €2 incentive on first contact, no incentive on second contact. “0, 2” = No incentive on first contact, €2 incentive on second contact.
Joint effects of incentive scheme and mode-choice design on net sample composition
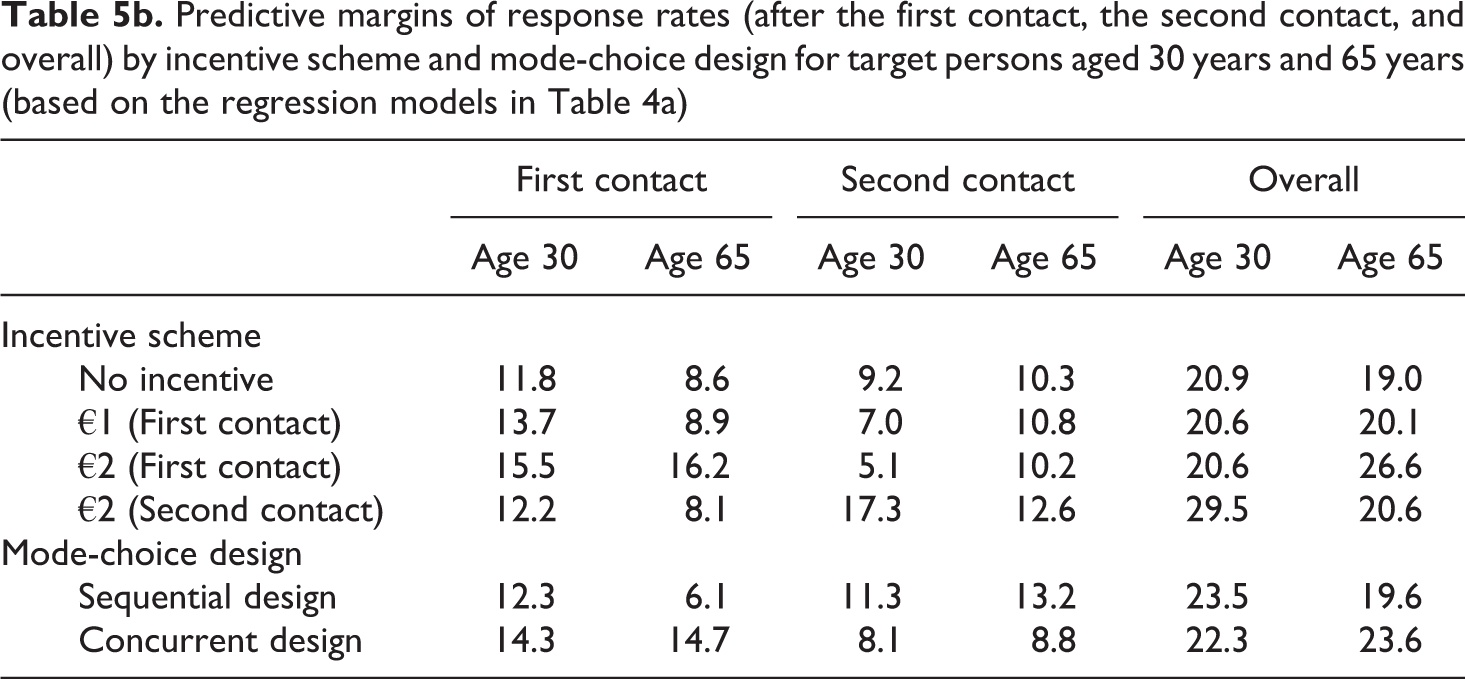
Target persons of different ages might be attracted differently by certain survey design elements and their combinations. As a first step in testing this, we investigated whether the individual effects of the incentive scheme and the mode-choice design differed by the age of the target persons. To do so, we extended our models from Table 3a by including mean-centered age as well as interaction terms for (a) age and incentive scheme and (b) age and mode-choice design (see Table 5a). To facilitate the interpretation of the results of the logit models, we calculated predictive margins of survey participation for target persons aged 30 years and target persons aged 65 years (see Table 5b).
For survey participation after the first contact, two findings stand out: First, whereas for the target persons aged 30 years, the prepaid incentives increased the response rate slightly but continuously (from 11.8% in the no-incentive condition to 15.5% in the condition with the €2 prepaid incentive), only the €2 prepaid incentive helped to increase survey participation for target persons aged 65 years. The latter effect was, however, substantial (+7.6 percentage points compared with the no-incentive condition). Second, the positive effect of the concurrent design on the response rate was much more pronounced for the older target persons (+8.6 percentage points) than for the younger target persons (+2.0 percentage points).
For participation after the second contact (Table 5b), we found decreasing response rates for the target persons aged 30 years who had already received a prepaid incentive on first contact. However, this was not the case for the target persons aged 65 years. Second, the delayed prepaid incentive substantially increased survey participation for target persons aged 30 years (+8.1 percentage points), but did so only slightly for the 65-year-old target persons (+2.3 percentage points). By contrast, third, the positive effect of the sequential design on survey participation was more pronounced for the target persons aged 65 years (+4.4 percentage points) than for the 30-year-old target persons (+3.2 percentage points).
Finally, looking at the overall response rate (Table 5b), we found that only the €2 delayed prepaid incentive boosted survey participation for 30-year-old target persons, whereas for the target persons aged 65 years, only the €2 prepaid incentive had a boosting effect on participation. Moreover, the mode-choice designs worked differently by age: Whereas the 30-year-old target persons showed a higher overall response rate in the conditions with a sequential design, the concurrent design clearly outperformed the sequential design among the 65-year-old target persons.
Logistic regression models predicting response rates (after the first contact, the second contact, and overall) by incentive scheme, mode-choice design, age of the target persons, and interactions
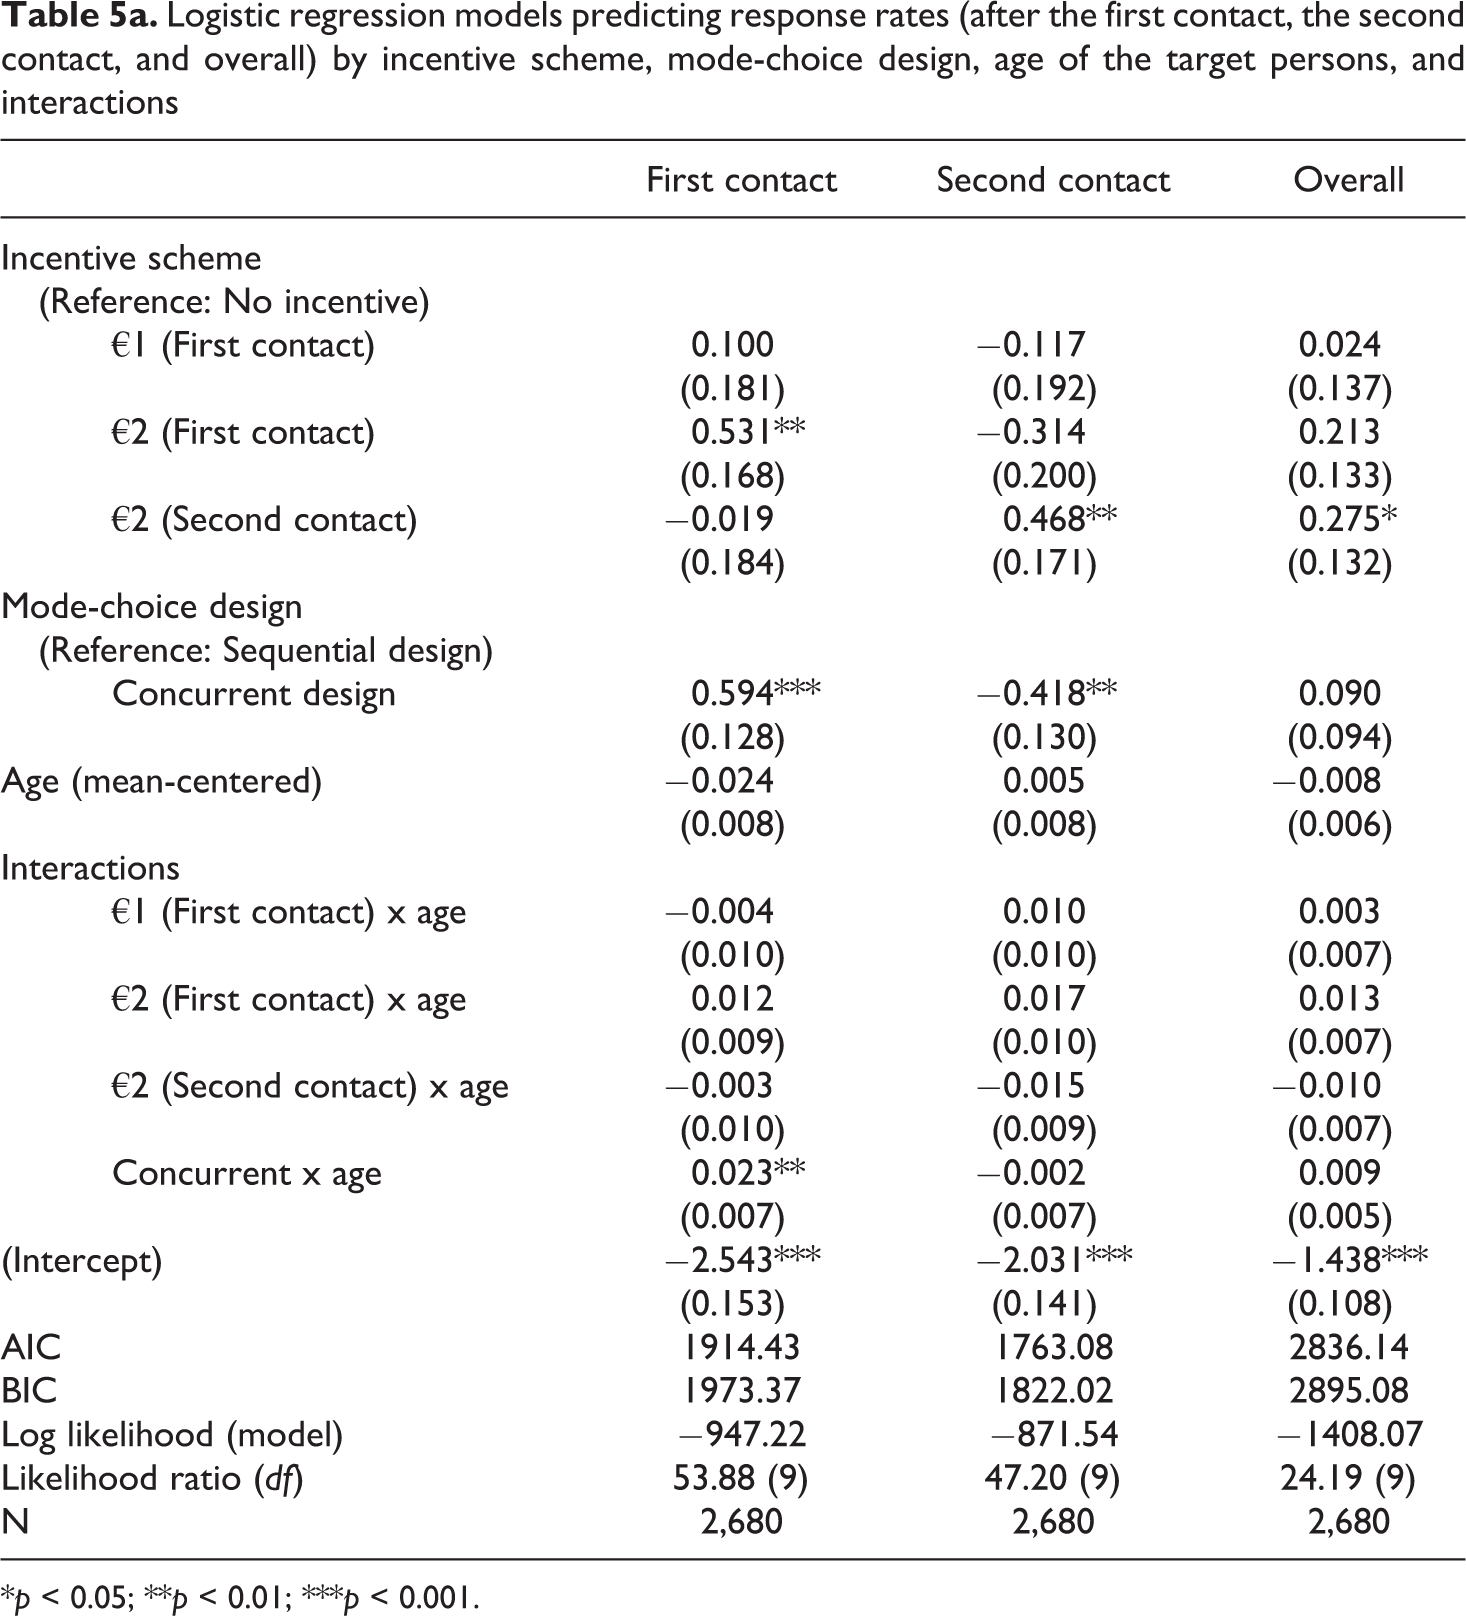
* p < 0.05; ** p < 0.01; *** p < 0.001.
Predictive margins of response rates (after the first contact, the second contact, and overall) by incentive scheme and mode-choice design for target persons aged 30 years and 65 years (based on the regression models in Table 4a)
Turning now to the analysis of the joint effects of our survey design elements, incentive scheme and mode-choice design, H2 assumed that a concurrent design in combination with a prepaid incentive delivered on first contact would yield particularly high response rates among older target persons. Table 4 (Column 5) provides a first indication of the validity of this hypothesis, as the two experimental groups with the concurrent design and the €2 or €1 prepaid incentive on first contact showed the highest share of participants aged 50 years and older (56% and 48%, respectively).
For a more detailed analysis, we relied on a model-based approach and plotted the results of a series of logistic regression models. Figure 1 displays the predicted probabilities for survey participation after the initial contact (Panel a), after the second contact (Panel b), and overall (Panel c) by experimental group and age of the target persons (see also Table 6 for the respective models). For the first contact, the sequential designs were particularly successful in motivating younger target persons, as all four graphs in the upper part of Panel a, Figure 1 share a negative gradient. By contrast, survey participation after the first contact was far less affected by the target persons’ age in the concurrent designs. However, the group with a concurrent design and a €2 prepaid incentive on first contact represents a remarkable exception, as older target persons were particularly inclined to respond after the first contact when they received a higher prepaid incentive as well as a paper-based questionnaire with the initial contact letter (Figure 1, third graph from the left in the lower part of Panel a).
The predicted probabilities of survey participation after the second contact (Figure 1, Panel b) also offer some interesting insights. Although one would expect the sequential designs to have shown a positive gradient at that stage (as older target persons may have welcomed the paper-based questionnaire more warmly than did younger target persons), this was the case in only two of the four experimental groups in question. Interestingly, these were the groups in which the target persons had received a prepaid incentive with the initial contact. By contrast, the delayed prepaid incentive motivated younger target persons more than their older counterparts, irrespective of the mode-choice design.
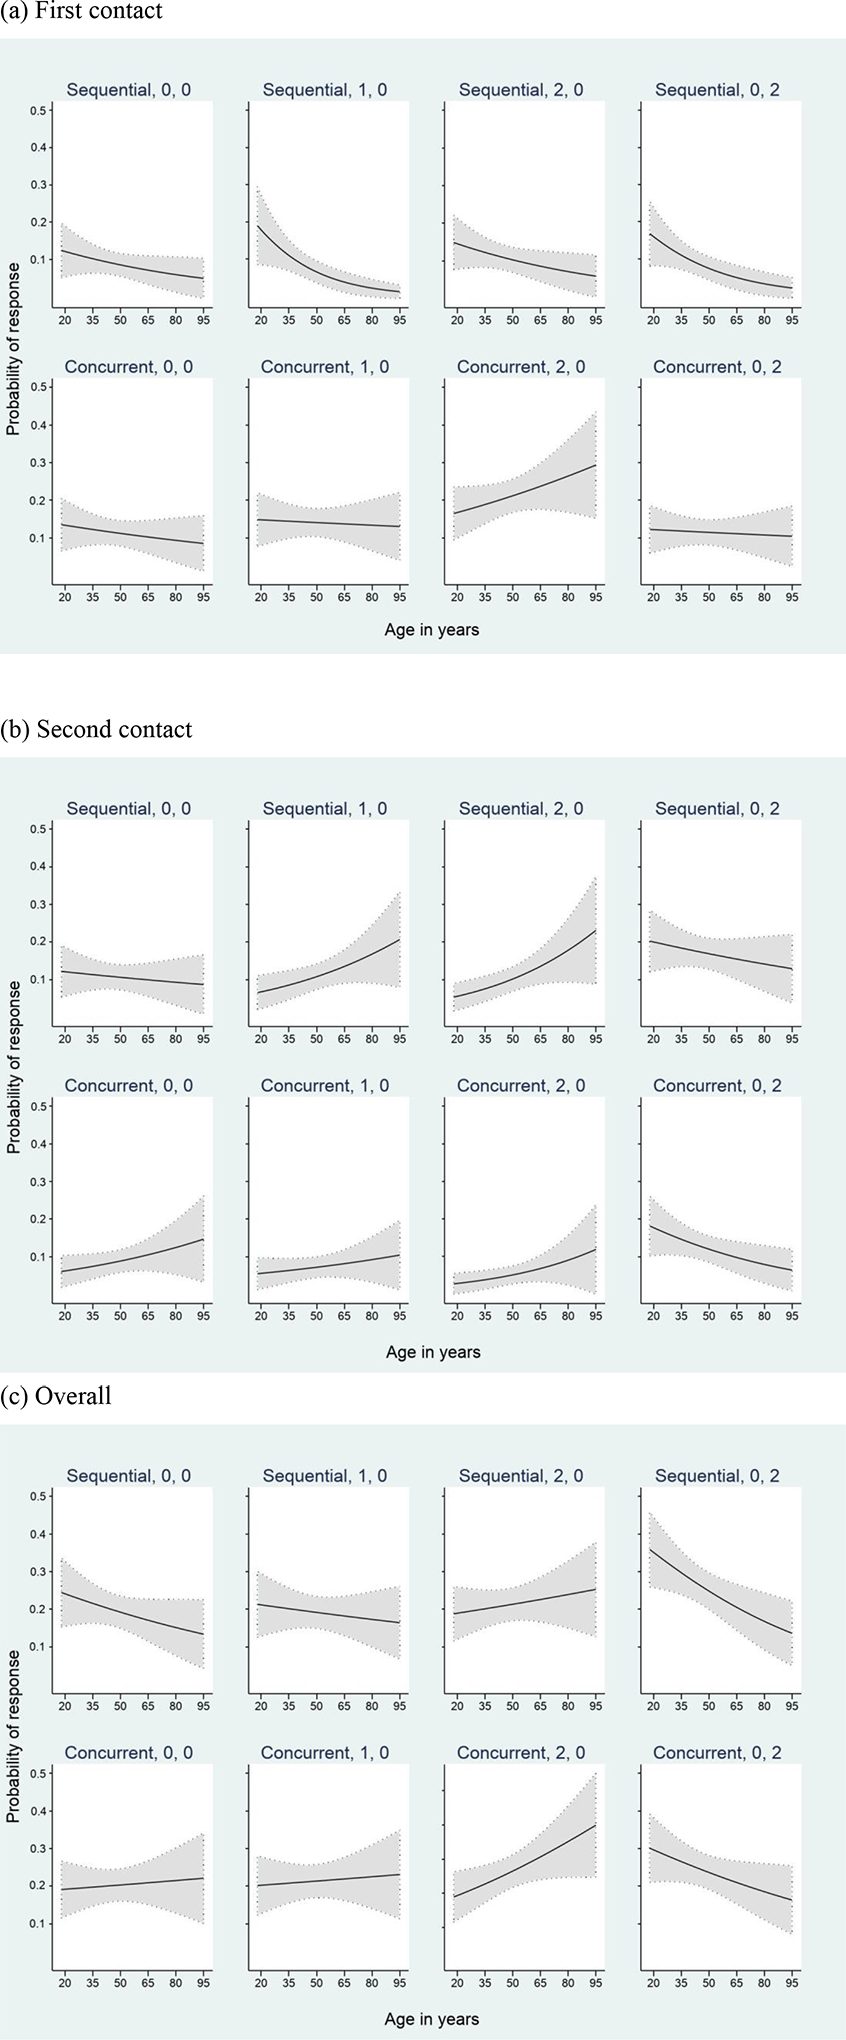
Predicted probabilities and 95% confidence intervals of survey participation by experimental group and age after the first contact, after the second contact, and overall. “0, 0” = No incentive on first contact, no incentive on second contact; “1, 0” = €1 incentive on first contact, no incentive on second contact; “0, 2” = No incentive on first contact, €2 incentive on second contact; “2, 0” = €2 incentive on first contact, no incentive on second contact.
These differences in response rates by contact attempt and age resulted in one combination of incentive scheme and mode-choice design emerging as superior to the others for younger target persons, and another combination emerging as superior to the others for older target persons (Figure 1, Panel c): The sequential design with a delayed prepaid incentive yielded the highest response rate among target persons aged under 50 years, and the concurrent design with the €2 prepaid incentive on first contact yielded a particularly high response rate among target persons aged 50 years and over. The latter finding clearly supports H2, which predicted that the net sample in the concurrent mode-choice design with the prepaid incentive would have the highest share of older target persons. However, when it comes to the experimental group with a concurrent design and the smaller prepaid incentive (€1) on first contact, the results are far less clear: Although the age gradient was still positive, this experimental group hardly differed from the group with a concurrent design and no incentive, both in terms of response rates and participation of older target persons.
Logistic regression models predicting response rates (after the first contact, the second contact, and overall) by experimental group, age, and their interaction
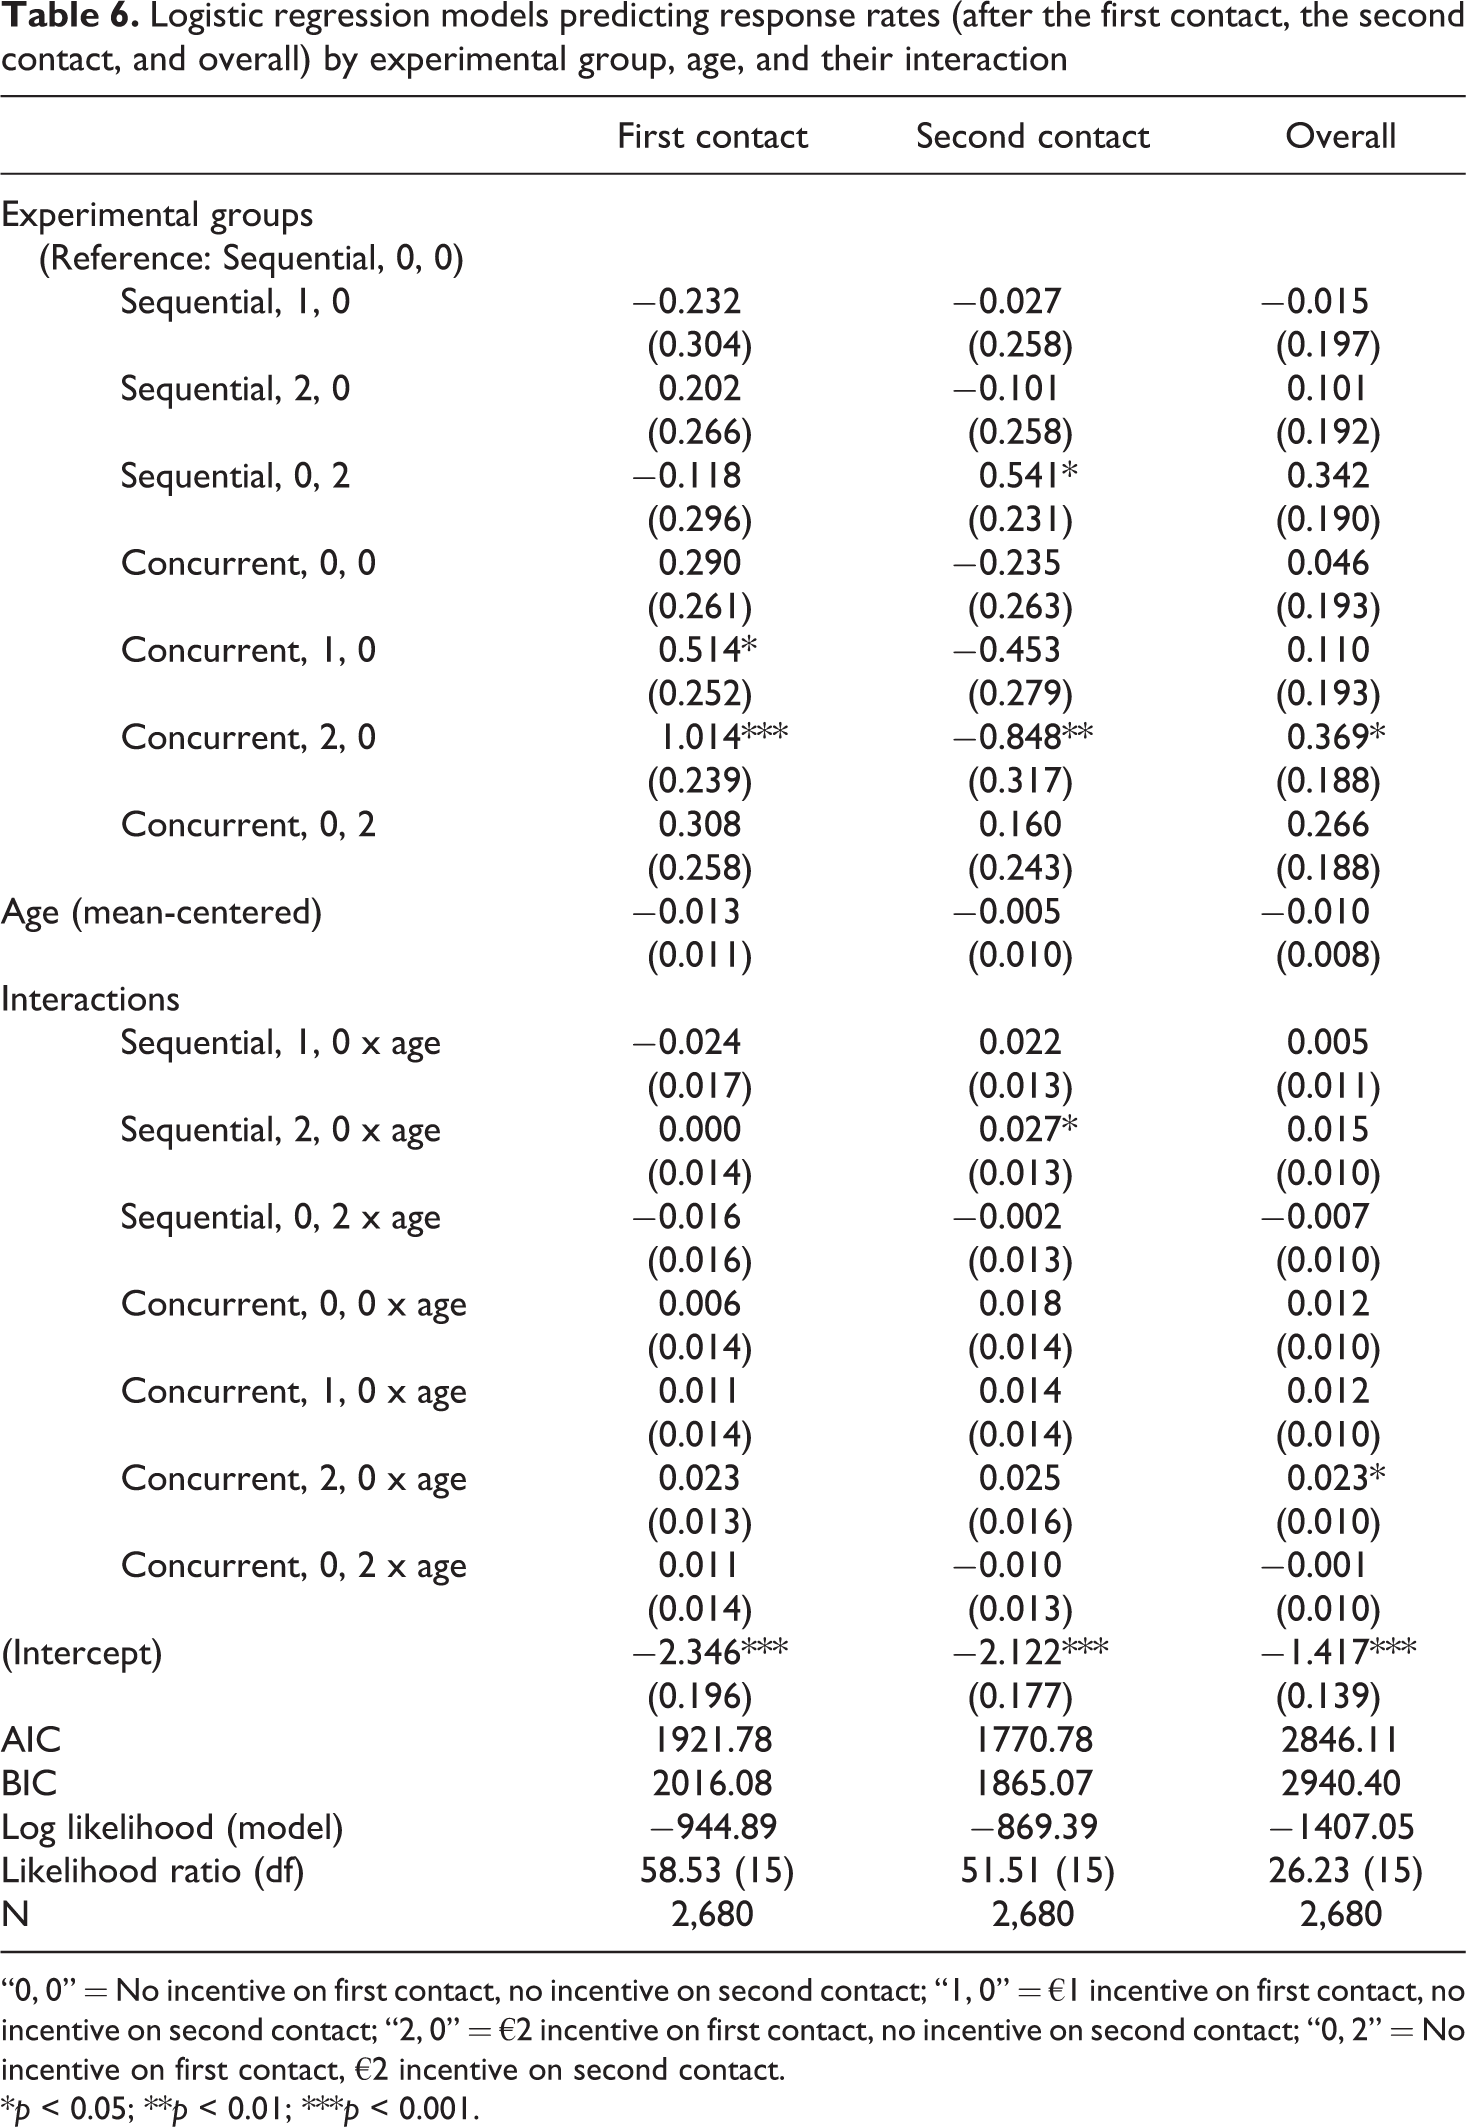
“0, 0” = No incentive on first contact, no incentive on second contact; “1, 0” = €1 incentive on first contact, no incentive on second contact; “2, 0” = €2 incentive on first contact, no incentive on second contact; “0, 2” = No incentive on first contact, €2 incentive on second contact.
* p < 0.05; ** p < 0.01; *** p < 0.001.
Joint effects of incentive scheme and mode-choice design on survey costs
The results for survey participation by mode (see Table 4, Column 4) are a first relevant finding regarding survey costs. The experimental groups with a sequential design had higher shares of online participants. The mean share of online participants in the groups with a sequential design was 58.0%, compared with 23.2% in the experimental groups with a concurrent design (χ2 (1) = 75.18; p < .001).
Table 7 displays the survey costs for the different contact attempts, the overall survey costs, the costs per complete case, and the costs per complete case by age group (< 50 years; 50 years and older). Looking first at the costs of the initial contact, it is not surprising to see that fixed costs were considerably lower for the experimental groups with a sequential design and for the experimental groups without prepaid incentives. For instance, the costs per unit for material, printing, and processing were only €0.40 in the sequential-design conditions, whereas they were €1.08 in the concurrent-design conditions. This difference was due mainly to the absence of costs for printing the questionnaire (€0.48 per unit), but also to cost savings for processing (folding), postage (as smaller envelopes were used for letters without a paper-based questionnaire), and material (because no envelopes for returning the questionnaire were needed in the sequential design).
Costs related to the incentives do not simply equal their monetary value, but also include costs for procuring and affixing the coins on the invitation letter, as well as costs for additional effort for folding (in total, €0.25 per unit). In the groups with a sequential design, no variable costs were incurred, as the costs comprised only costs for the return postage (€1.55 per unit) and for entering the data from each returned paper-based questionnaire. For data entry, we estimated €2.50 per unit, which roughly corresponds to a quarter of the hourly wage of a student research assistant. Hence, we assumed that data entry for each paper-based questionnaire took approximately 15 minutes.
When calculating overall survey costs by multiplying costs per case by the group-specific gross sample (i.e., N = 372 in the sequential groups and N = 373 in the concurrent groups), we found overall survey costs for the first contact to be lowest in the two groups with a sequential design and no prepaid incentive (€458), whereas the costs incurred in the group with a concurrent design and a €2 prepaid incentive on first contact were over four times higher (€2,089).
Survey costs (in euros) by experimental group and age
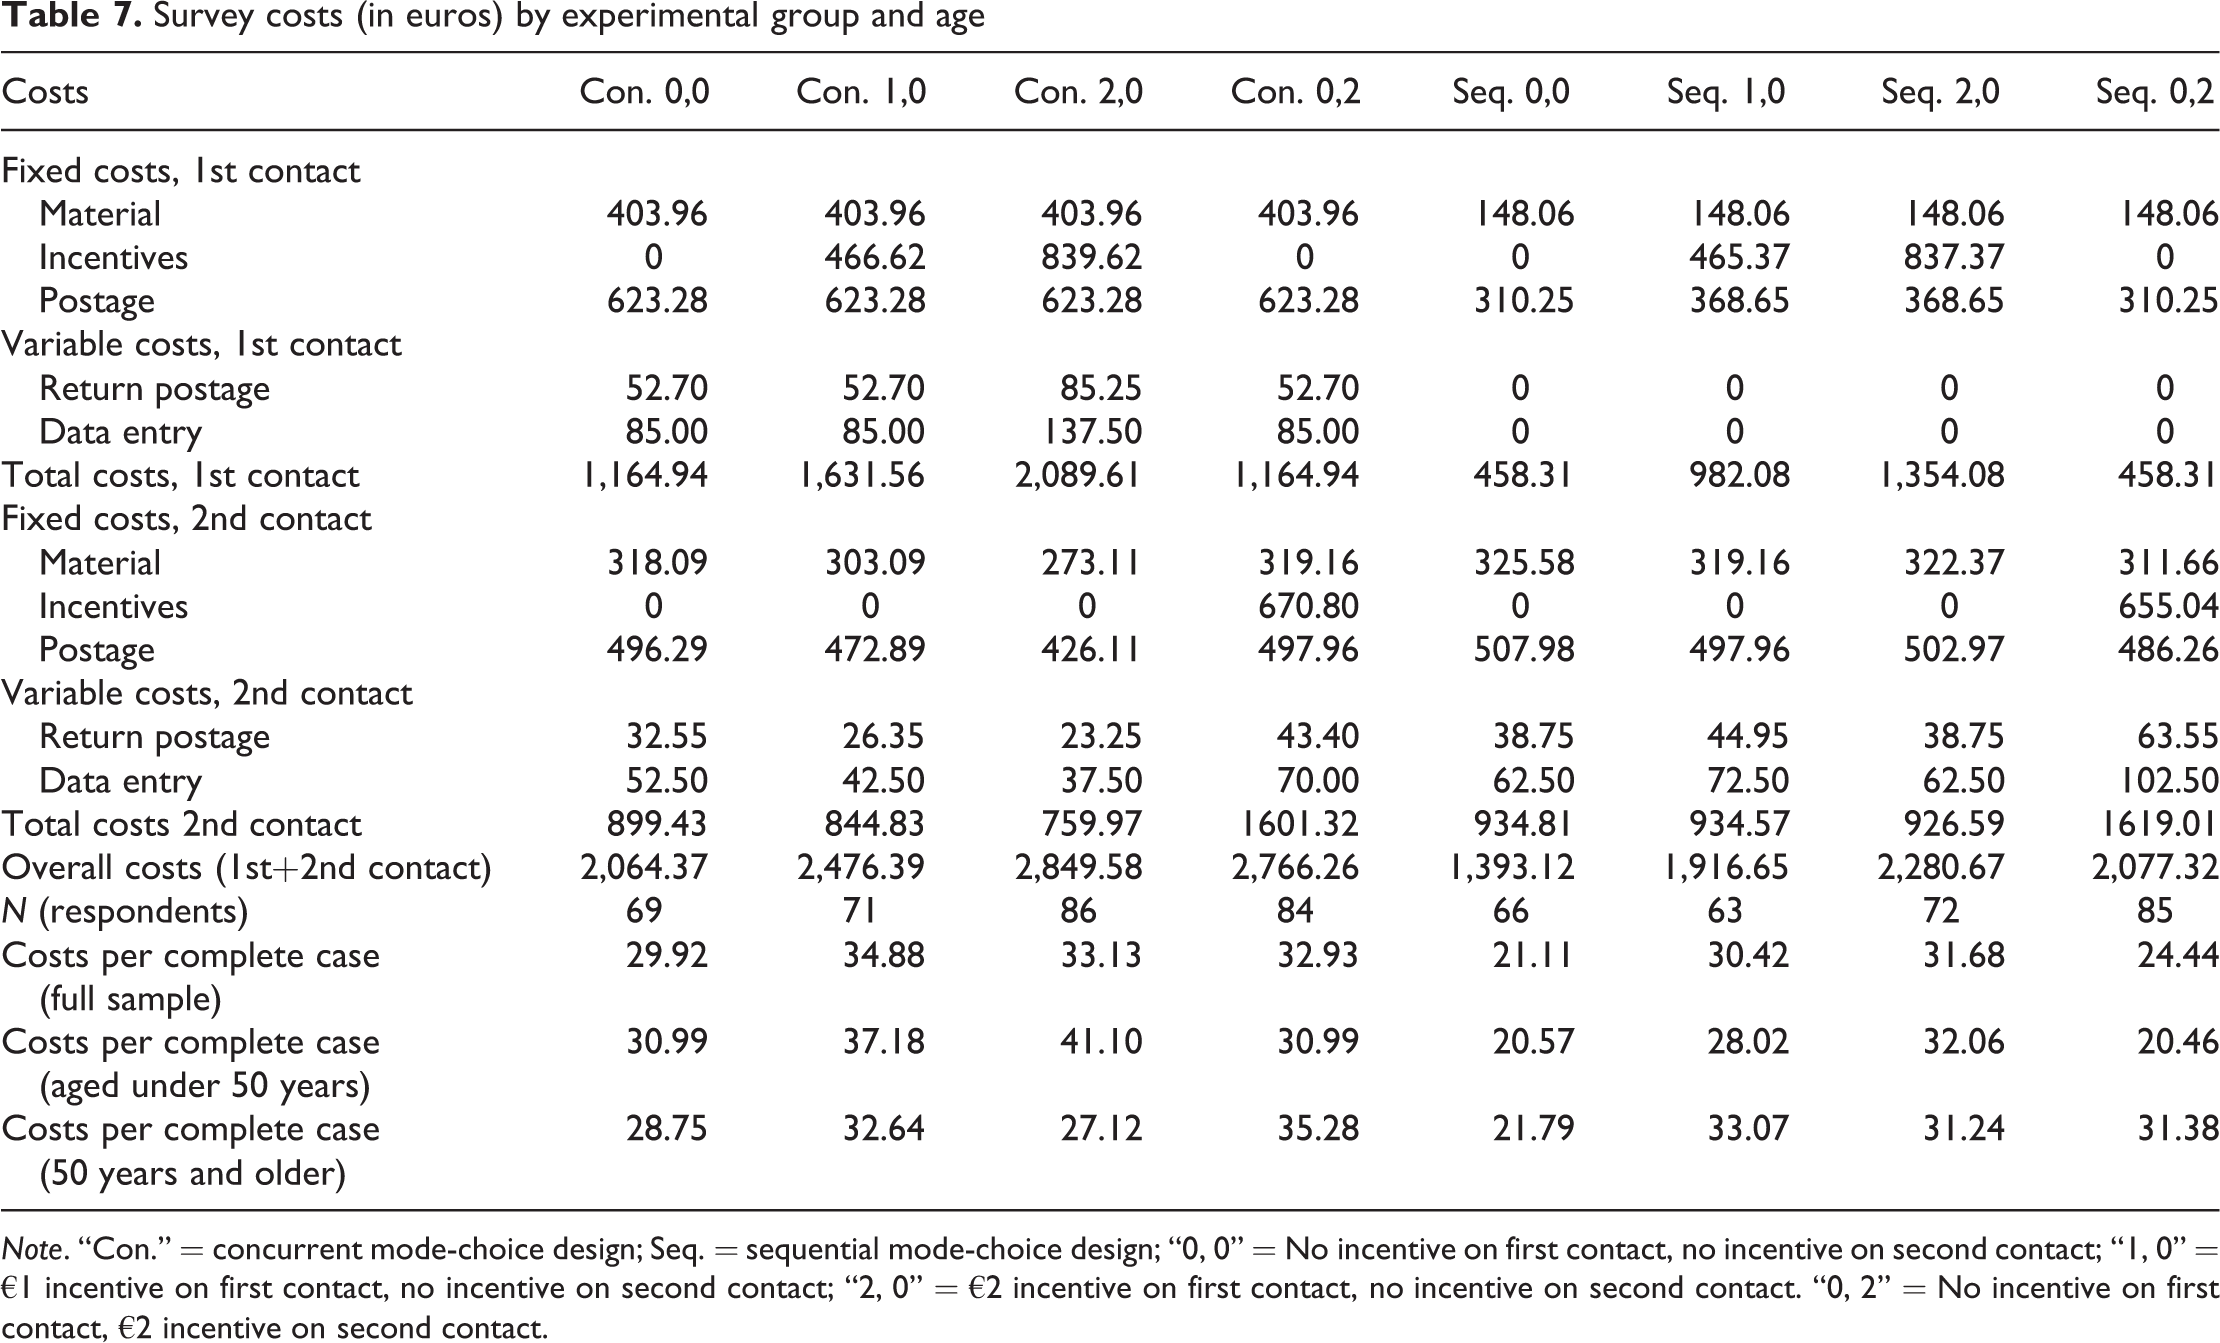
Note. “Con.” = concurrent mode-choice design; Seq. = sequential mode-choice design; “0, 0” = No incentive on first contact, no incentive on second contact; “1, 0” = €1 incentive on first contact, no incentive on second contact; “2, 0” = €2 incentive on first contact, no incentive on second contact. “0, 2” = No incentive on first contact, €2 incentive on second contact.
For the second contact (Rows 7–12 in Table 7), the fixed costs per unit in each group were multiplied by the gross sample minus the number of target persons who responded after the first contact, the number of break-offs, the number of non-eligible target persons, and the number of explicit refusals. In this contact attempt, the fixed costs were highest for the two groups that received a delayed prepaid incentive; they were also higher in the sequential-design groups. This finding is the result of a lower average response rate after the first contact in the groups with a sequential design, which meant that more target persons had to be contacted a second time (see Table 4, Column 3). Moreover, the higher number of returned paper-based questionnaires after the second contact also increased the variable costs.
The overall survey costs (1st contact plus 2nd contact; see Row 13 in Table 7) were lowest for the group with a sequential design and no incentive (€1,393). They were roughly twice as high for the groups with a concurrent design and a €2 prepaid or a delayed prepaid incentive (€2,849 and €2,766, respectively). However, when we related the overall survey costs to the overall number of respondents in order to calculate costs per complete case (Row 15 in Table 7), the ranking changed slightly, with the concurrent design with a €1 prepaid incentive on first contact emerging as the experimental condition that incurred the highest costs (€34.88). Contrary to our prediction in H3, the sequential design with the delayed prepaid incentive did not prove to be the most cost-effective combination of incentive scheme and mode-choice design. However, with €24.44 per realized case, it was the second most efficient combination of these survey design elements, behind the sequential design with no incentives (€21.11). This suggests that the higher response rate elicited by the delayed prepaid incentive was unable to compensate for the cost advantage of the sequential design with no monetary incentive.
In the final step, we took the age-related differences in response rates by experimental group into account by calculating costs per complete case for target persons aged under 50 years and target persons aged 50 years and older. The last two rows in Table 7 show that the age-group-specific costs per complete case differed remarkably from the costs per complete case for the full sample. Whereas the concurrent design with the €2 prepaid incentive on first contact was one of the most expensive designs for the full sample (€33,13), for older target persons it was one of the cheapest (€27.12). This finding is important, as this combination of incentive and mode-choice design performed well in bringing older target persons into the net sample. For target persons aged under 50 years, the combination of sequential design and a delayed prepaid incentive of €2 actually turned out to be the most cost-effective (€20.46). Here, costs per complete case were less than half as high as those of the most expensive design in that age group (the concurrent design with a €2 prepaid incentive on first contact; €41.10).
Overall, our results concerning survey costs hint at promising targeting strategies for self-administered mixed-mode surveys. Thus, in a model calculation, we estimated what the overall response rate and overall survey costs would have been if we had implemented only two rather than eight survey protocols: namely, a concurrent design with a €2 prepaid incentive on first contact for all target persons aged 50 years and over, and a sequential design with a €2 delayed prepaid incentive for all target persons aged under 50 years. Based on the results of our models, had we used only the aforementioned two survey protocols, the overall response rate would have increased by 43.2% (actual response rate [22.2%] vs. predicted response rate [31.8%]), whereas overall survey costs would have increased by 11%.
Discussion
In this paper, we analyzed the effects of the interplay of prepaid and delayed prepaid monetary incentives and mode-choice design on response rates, net sample composition, and survey costs in a self-administered mixed-mode survey. Based on the psychological processes assumed to be triggered by prepaid monetary incentives, we expected them to particularly stimulate survey participation when all survey modes were available at the time the incentive was given. By contrast, we expected the sequential design to somewhat counteract the desired effect of prepaid incentives if an incentive was provided but the survey mode was not the one that some target persons usually prefer. More precisely, we expected in H1 that the positive effect on the response rate of prepaid monetary incentives provided with the initial contact would be stronger in a concurrent than in a sequential mode-choice design, because in a concurrent design all survey modes would be available when the prepaid incentive was provided, whereas in a sequential design, target persons would only be able to participate online. Although H1 was somewhat supported by our data, the results did not reach the conventional thresholds for statistical significance.
Moreover, we expected a concurrent design with a prepaid incentive to fit with the mode preferences of older target persons (H2). We found strong support for this hypothesis for the experimental group with the concurrent design and the €2 prepaid incentive on first contact, as this combination yielded the highest response rate for target persons aged 50 years and older. However, for the experimental group with the €1 prepaid incentive on first contact, results were far less clear, and the outcomes of this combination for target persons aged 50 years and older hardly differed from those of the concurrent group with no incentive. This might indicate that, for our target population, €1 is below the threshold for a monetary incentive that stimulates survey participation. This interpretation is also supported when considering the overall response rates with sequential designs, where the groups with a €1 incentive and with no incentive did not differ either.
Finally, regarding survey costs, we expected a sequential design with a delayed prepaid incentive to be most cost-effective (H3), as this combination relies on a web-push strategy and aims at fully exploiting the potential of the prepaid incentive by giving it only when both survey modes are offered and only to those who did not participate after the first contact without being incentivized. In line with the web-push literature (Dillman, 2017; Bretschi et al., 2023), the sequential designs were more cost-effective, as they were successful in realizing a significantly higher share of web participation. A higher share of target persons taking part in the survey online is not only favorable in terms of survey costs, but also offers the possibility to increase data quality: For one thing, web-based surveys allow the use of complex filters, dependent interviewing (e.g., relying on prior information about respondents to steer question routing and wording), and format/range checks. Furthermore, web-based surveys usually have a lower share of item-nonresponse than paper-based surveys, while also allowing for soft or hard prompts for collecting crucial information. Web surveys are also more flexible in the presentation of information, allowing for the inclusion of audio-visual content. In panel surveys, screening questions can be used to check whether the person participating really is the sampled person, or to allow for the branching of a questionnaire to specific subgroups, so that they are asked different question modules. Regarding our survey cost hypothesis (H3), the sequential design with the delayed prepaid incentive performed second best in terms of costs per complete case. It was outperformed only by a sequential design with no incentive. However, in an analysis differentiated by age, the sequential design with a delayed prepaid incentive of €2 proved to be the most cost-effective method of data collection for target persons under 50 years of age.
Based on our results, researchers could consider employing an adaptive survey design (Schouten et al., 2020) focusing on the age of the target person: For target persons aged under 50 years, a sequential design in which the incentive and the paper questionnaire are withheld until the second contact seems promising in terms of response rates, web participation, and survey costs. By contrast, for target persons aged 50 years and older, a concurrent design with a prepaid incentive on first contact seems most suitable. However, adaptive designs might be problematic from a research ethics perspective, especially if studies use large monetary incentives and provide them to some age groups only with the second contact. In this case, those who participate in the study after the first contact without having to be monetarily persuaded to do so, are “disadvantaged,” whereas those who hesitate are “rewarded.” A solution might be to incentivize those participants who responded after the first contact although they did not receive an incentive, by giving them the incentive afterward, so that every sampled person ultimately receives the same amount regardless of the targeting strategy. Furthermore, more research is required on the exact age threshold for the respective designs across different countries – also because older cohorts can be expected to become more Internet prone in the future.
Our study has limitations that offer avenues for future research. First, our survey was conducted in Germany and comprised only urban citizens of one particular city. Hence, it is unclear whether our results are generalizable to the residential population of Germany as a whole, and whether they can be generalized even further. Second, we varied the mode-choice design and the incentive schemes, but there are numerous additional ways of varying the same or other design elements (e.g., higher prepaid/delayed prepaid incentives, more contact attempts, or different intervals between the contact attempts). For instance, it would also be interesting to compare the adaptive design outlined above with a survey protocol in which both modes are offered concurrently, but target persons are promised a bonus incentive for participating via the web mode, as was the case in Biemer et al. (2018). In that study, this protocol not only achieved a high response rate but also a remarkable web response while being cost-effective. Third, although our eight experimental groups each comprised 372 or 373 target persons, the gross sample was 10% lower due to cases of ineligibility (mostly outdated addresses). Moreover, our key dependent variable, survey participation, had a limited variance, as only less than a quarter of the target persons took part, thus limiting the statistical power of our analysis. In order to be able to draw inferences with greater certainty, future studies should work with larger group sizes. Fourth, our community survey was framed in terms of local issues such as the perceived quality of life in Mannheim. It would be interesting to replicate our findings in different settings with different survey topics (e.g., election studies, general population surveys, family research) and different target populations (e.g., older people, students). Fifth, and most importantly, adaptive designs in which people of different ages are treated differently are applicable only if survey managers have the relevant information (i.e., the ages of the target persons) from their sampling frames. If not, their only option is to use proxies to estimate the age structure of their target population. These proxies include, for example, aggregate data at district or municipality level. If names are available, onomastic procedures may also be used for age estimation.
Unfortunately, according to our results, and at least with respect to age, there is no combination of incentive scheme and mode-choice design that performs well in terms of survey participation and survey costs while also yielding similar response rates for all age groups. However, this would be desirable if researchers cannot, for any reason, rely on an adaptive design. Possibly, the search for such an optimal combination may succeed by testing other combinations of design elements than those that we used in our study. Therefore, this is an important area for future research. The same applies to testing the joint effects of incentive scheme and mode-choice design on variables other than age that may also introduce bias into the survey results.
Footnotes
Declaration of Conflicting Interests
The authors declared no potential conflicts of interest with respect to the research, authorship, and/or publication of this article.
Funding
The authors received no financial support for the research, authorship, and/or publication of this article.