
Abstract
Aims:
To describe changes in the place of death of patients with cancer from 1990 to 2012, and to identify issues for their end-of-life care.
Materials and Methods:
Population-based descriptive study, with analyses of place of death patterns, using the South Australian Cancer Registry records of 86 257 patients with cancer who died from 1990 to 2012.
Results:
From 1990 to 2012, the proportion of cancer deaths in hospital decreased from 63.4% to 50.9%, and in nursing homes increased from 8.2% to 22.5%. After the year 2000, the proportions in hospices and at home were both below 15%. Multivariate analyses showed that young patients with cancer were more likely to die in a hospice or at home, compared to elderly patients with cancer who were more likely to die in a nursing home; the likelihood of dying in a hospice increased with socioeconomic status; patients with a short survival time or a hematological malignancy were more likely to die in a metropolitan hospital.
Conclusions:
Compared to most other countries, the proportion of cancer deaths at home was low, and many patients would not have died at their preferred place. The trend for more cancer deaths to occur in nursing homes is likely to continue, but nursing homes generally lack the resources and skilled staff to provide quality palliative care. Models of palliative care delivery should take account of patient preferences, the growth of terminal cancer care in nursing homes, and apparent inequities.
Introduction
Historically, most deaths occurred in the home and community setting. During the 20th century in developed countries, there was a huge shift in care of the dying from home to hospitals. In South Australia, site of the present study, 92% of all deaths occurred at home in 1875, and this proportion decreased to 21% in 1990 because care was transferred to hospitals. 1,2
Toward the end of the 20th century, this hospitalization trend peaked and began to reverse in several countries. 1 -5 In Canada, for example, the proportion of deaths in hospital peaked at 78% in 1994 and declined to 61% by 2004, while there was a corresponding increase in deaths at home and nursing homes. 4
The reversal of the hospitalization trend appeared most marked for patients with cancer. 5 -8 In England and Wales between 2004 and 2010, for example, there was an overall increase in home deaths, from 18% to 21%, and the greatest increase occurred for patients with cancer, from 22% to 27%. 5
Changes in where patients with cancer died have been associated with the growth of the hospice movement that promoted end-of-life care at home and in designated hospices as alternatives to hospital care. In the United States by 2009, the use of hospice services by fee-for-service Medicare beneficiaries who died with cancer had increased to 60%, and this influenced the place of death pattern. 9 In South Australia, the use of palliative services by patients with terminal cancer grew to 68% by 1999 and this was also shown to influence where death occurred. 7,8,10
Cultural, social, and health system factors may account for large variations between countries in where cancer deaths occur. In European studies, for example, the proportion of cancer deaths in hospital varied from 85% in Sweden to 31% in the Netherlands 11 ; while the percentage of cancer deaths at home varied from 13% in Norway to 45% in the Netherlands. 12
Patient sociodemographic and disease characteristics have also been associated with where death occurs. In Ontario, Canada, for example, the likelihood of dying at home significantly increased in higher income urban neighborhoods, and decreased with rural residence, higher comorbidities, and hematological malignancy. 13
Patterns of place of death, therefore, reflect many factors in the dynamics of terminal care. Studying the patterns can enhance our understanding of terminal care, help evaluate the impact of services, help identify areas of unmet need, and generate insights for policy formulation.
“Place of death” has been recorded since 1990 in the South Australian Cancer Registry (SACR), and this enables us to describe changes in where patients with cancer died from 1990 to 2012 in a defined community, and to investigate the patient sociodemographics and disease characteristics associated with each place of death. Given South Australians have expressed a strong preference for home terminal care, and this choice has been supported by policy for palliative home care services, the study aimed to specifically evaluate deaths occurring at home. 14,15 The population of South Australia in 2012 was 1.65 million—there were 1.25 million residents in metropolitan Adelaide and 0.4 million in rural and remote regions.
Methods
Ethics approval for the study was granted by the South Australian Health Research Ethics Committee (approval number HREC/15/SAH/82). The place of death of patients with cancer has been collected as part of the SACR collection since 1990. Incidence and mortality data for the period 1990 to 2012 were extracted from the SACR Central Registry System Plus database. Cases of cancer were notified to the SACR under the Health Care Act 2008 and supporting Cancer Reporting Regulations. The cause of death in the SACR is determined by linkage with registrations for deaths at the state and national level, with the cause of death modified if necessary to be consistent with the known cancer history of the cancer case. Cases where the place of death was interstate or overseas were excluded from the study.
Place of death was categorized as follows: metropolitan hospitals (public and private); country hospitals; hospice (Daw House, Mary Potter, Philip Kennedy, Lyell McEwin & Modbury; single palliative care beds in country hospitals, or nursing homes were not included in this category); nursing homes; and private residence. There were 1733 cases with “Unknown” or “Other” place of death, which were excluded from the study.
The independent variables were as follows (reference category denoted in bold font): Sex: Age at death in years: Race: Country of birth was categorized using Australian Bureau of Statistics Standard Australian Classification of Countries 2008 Major and Minor groups: Quintiles based on place of residence at diagnosis using Australian Bureau of Statistics Socio-Economic Indexes for Areas indices from 1991 to 2011: Rurality: Survival time from diagnosis in months (censored at December 31, 2012): Year of death: Cancer type using ICD-O3: lung (C33-34), female breast (C50), colon and rectum (C18-20), pancreas (C25), other GIT (C15-17, C21-24), prostate (C61.9), urinary tract (C64-68), gynecological (C51-58), hematological (M959-999), CNS (C70-72), head and neck (C00-14, C30-32), melanoma of skin (C44.+M872-879), bone connective tissue and soft tissue (C44._ + M800-958 [excl. C44.[0,5], M872-879]; C44.[0,5] + M812-958 [excl. M8542 (C44.5), M872-879], C47 C49), unknown primary (C80, C26, C39),
The number of deaths at each site was plotted by year from 1990 to 2012, and changes over time were tested using the Cochran-Armitage trend test. All analyses were performed using IBM SPSS (version 22) and SAS version 9.4. All statistical tests were 2-tailed and a P value of .05 was used for statistical significance.
Place of death was the dependent variable and analyses were performed examining the association between metropolitan hospitals (reference category) compared to the other places of death. Univariate comparisons were first made between these for sociodemographic (age, sex, race, country of birth, rurality, and socioeconomic status [SES]—SEIFA quintiles 15 ) and clinical measurements (cancer site, year of death, and survival time in months since diagnosis up to December 31, 2012), using Pearson χ2 tests for association.
Variables that were statistically significant in the univariate analyses were included in the multivariate analyses. A generalized multinomial logistic regression analysis was carried out using place of death as the dependent variable. The multinomial logistic regression analysis was used to estimate the odds of dying from invasive cancer at different places of death compared to metropolitan hospitals, adjusting for each of the independent variables.
Results
The annual number of cancer deaths increased from 1131 in 1990 to 4707 in 2012, with crude rates being 79.0 and 284.2 per 100 000, respectively. Of the total 86 257 cancer deaths, 55.3% occurred in hospitals (40.0% occurred in metropolitan hospitals, 15.3% in country hospitals), 16.9% in nursing homes, 14.0% in hospices, and 13.8% in private residences. Figure 1 shows the proportion of cancer deaths in nursing homes changed the most, from 8.2% in 1990 to 21.6% in 2012, while the proportion of deaths in hospices and at home decreased from the mid-1990s. Each sociodemographic and clinical characteristic was significantly associated with the place of death in the univariate analyses (Table 1).
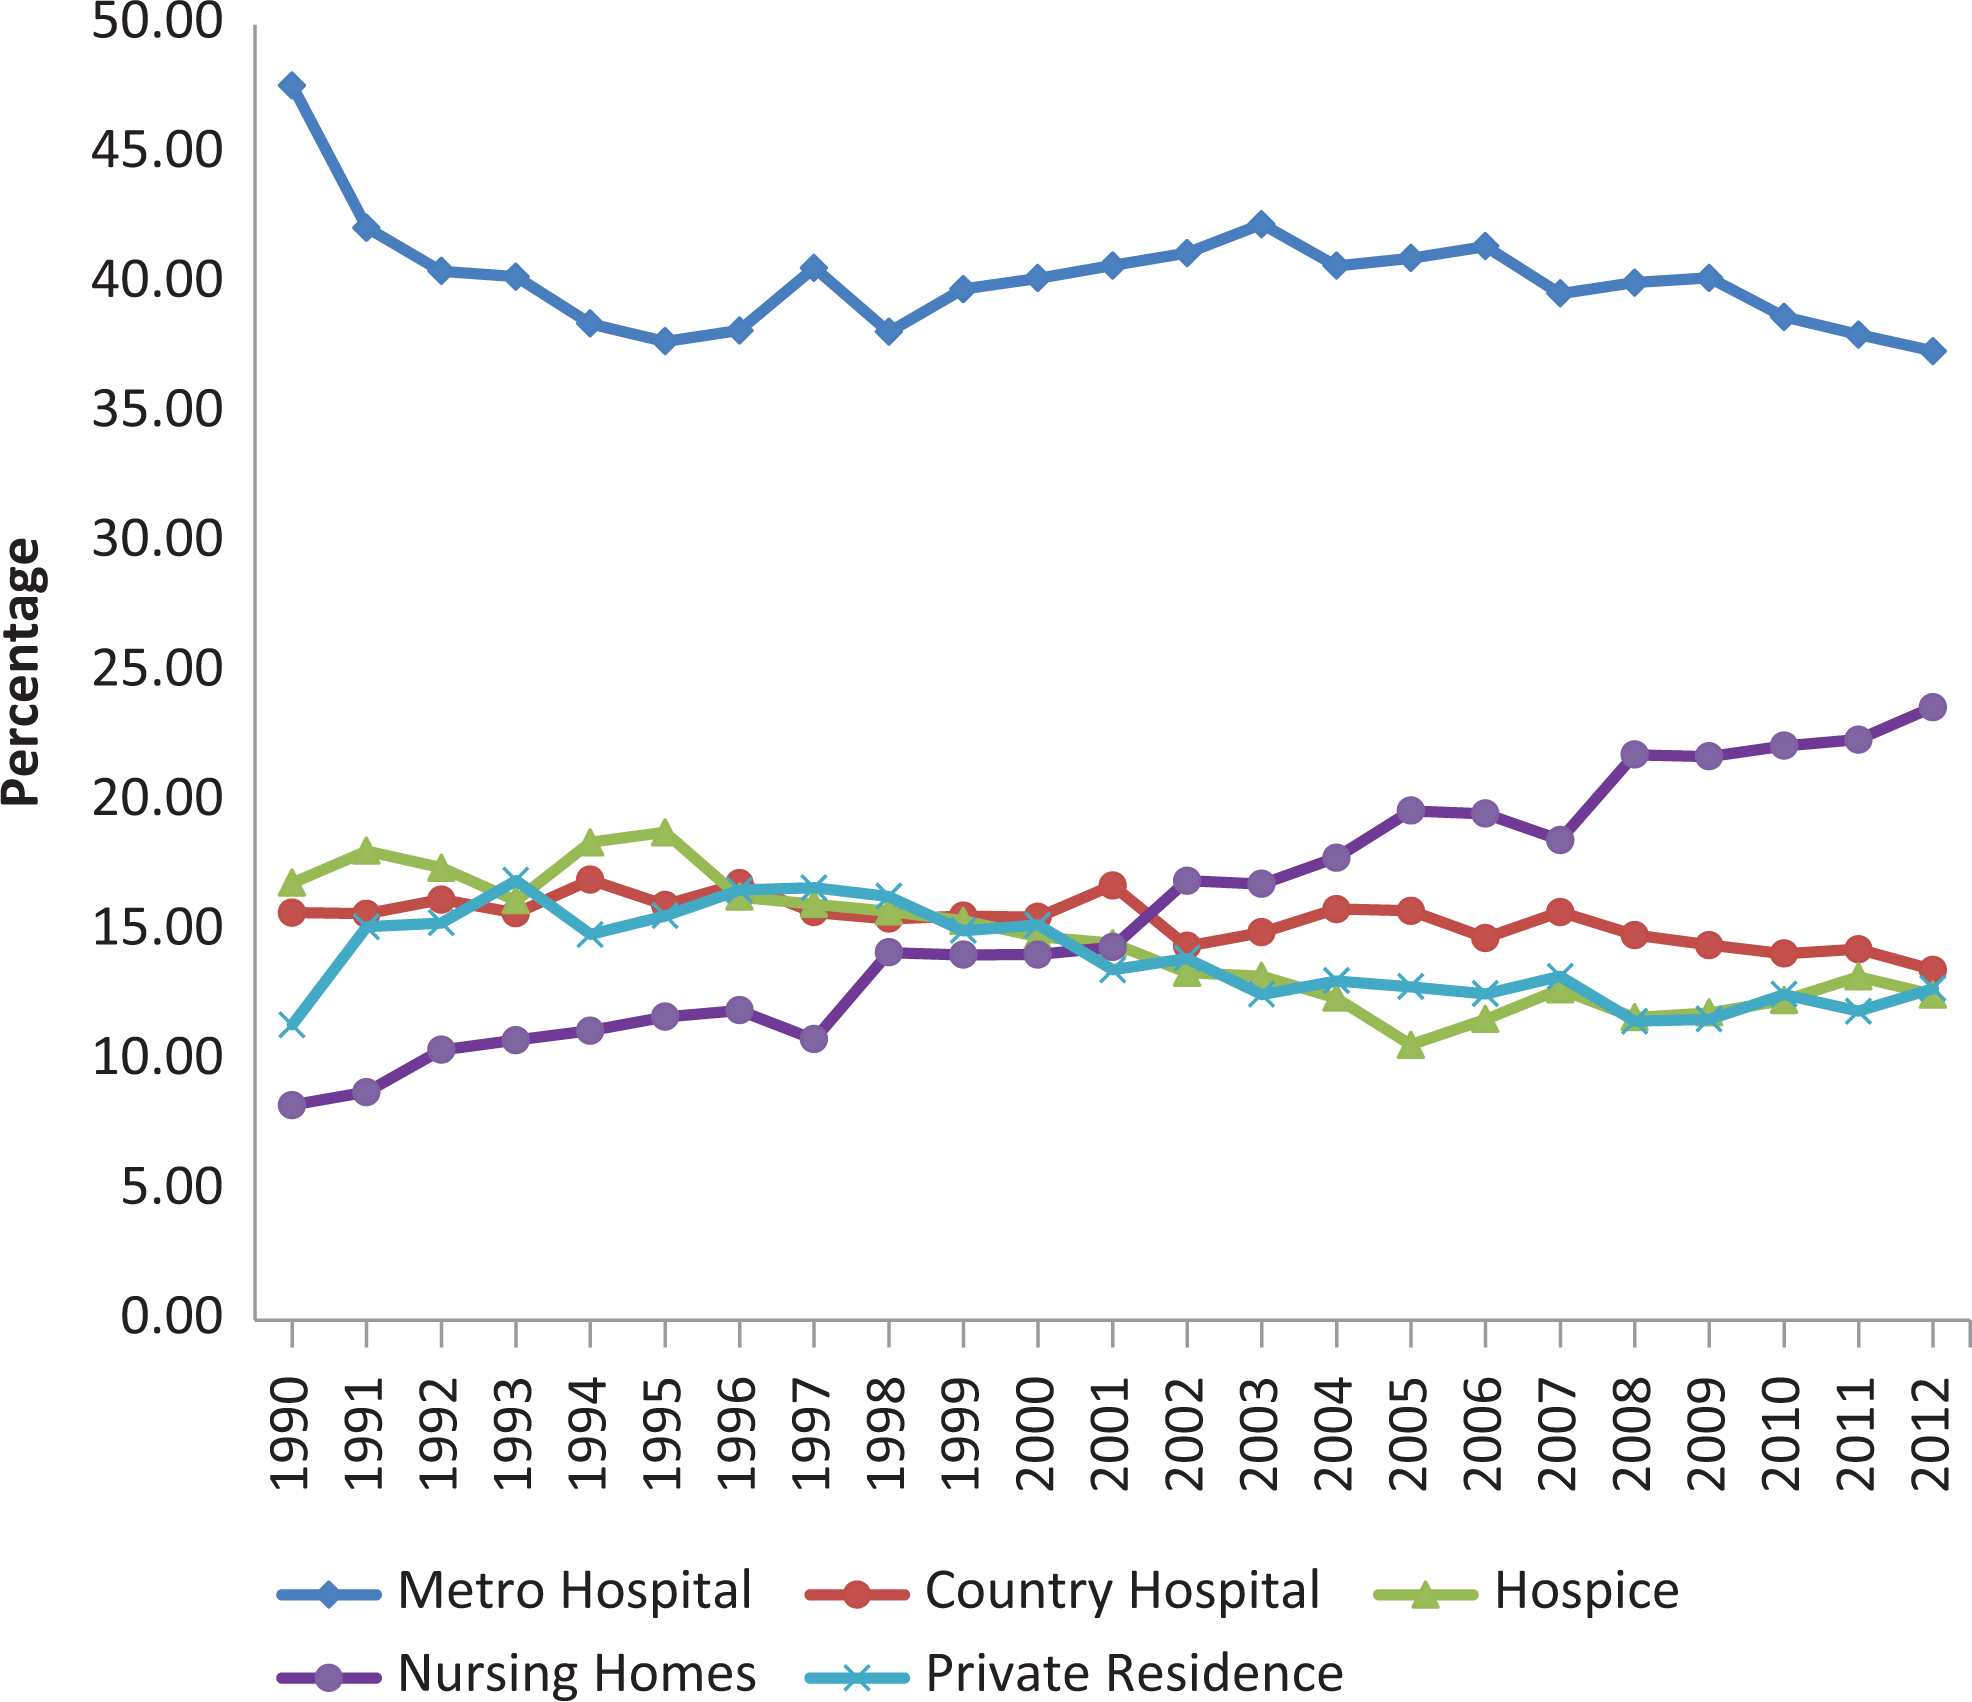
Place of death of South Australian patients with cancer by year, 1990 to 2012.
Sociodemographic and Clinical Characteristics of Cancer Deaths by Place of Death, South Australia, 1990 to 2012.
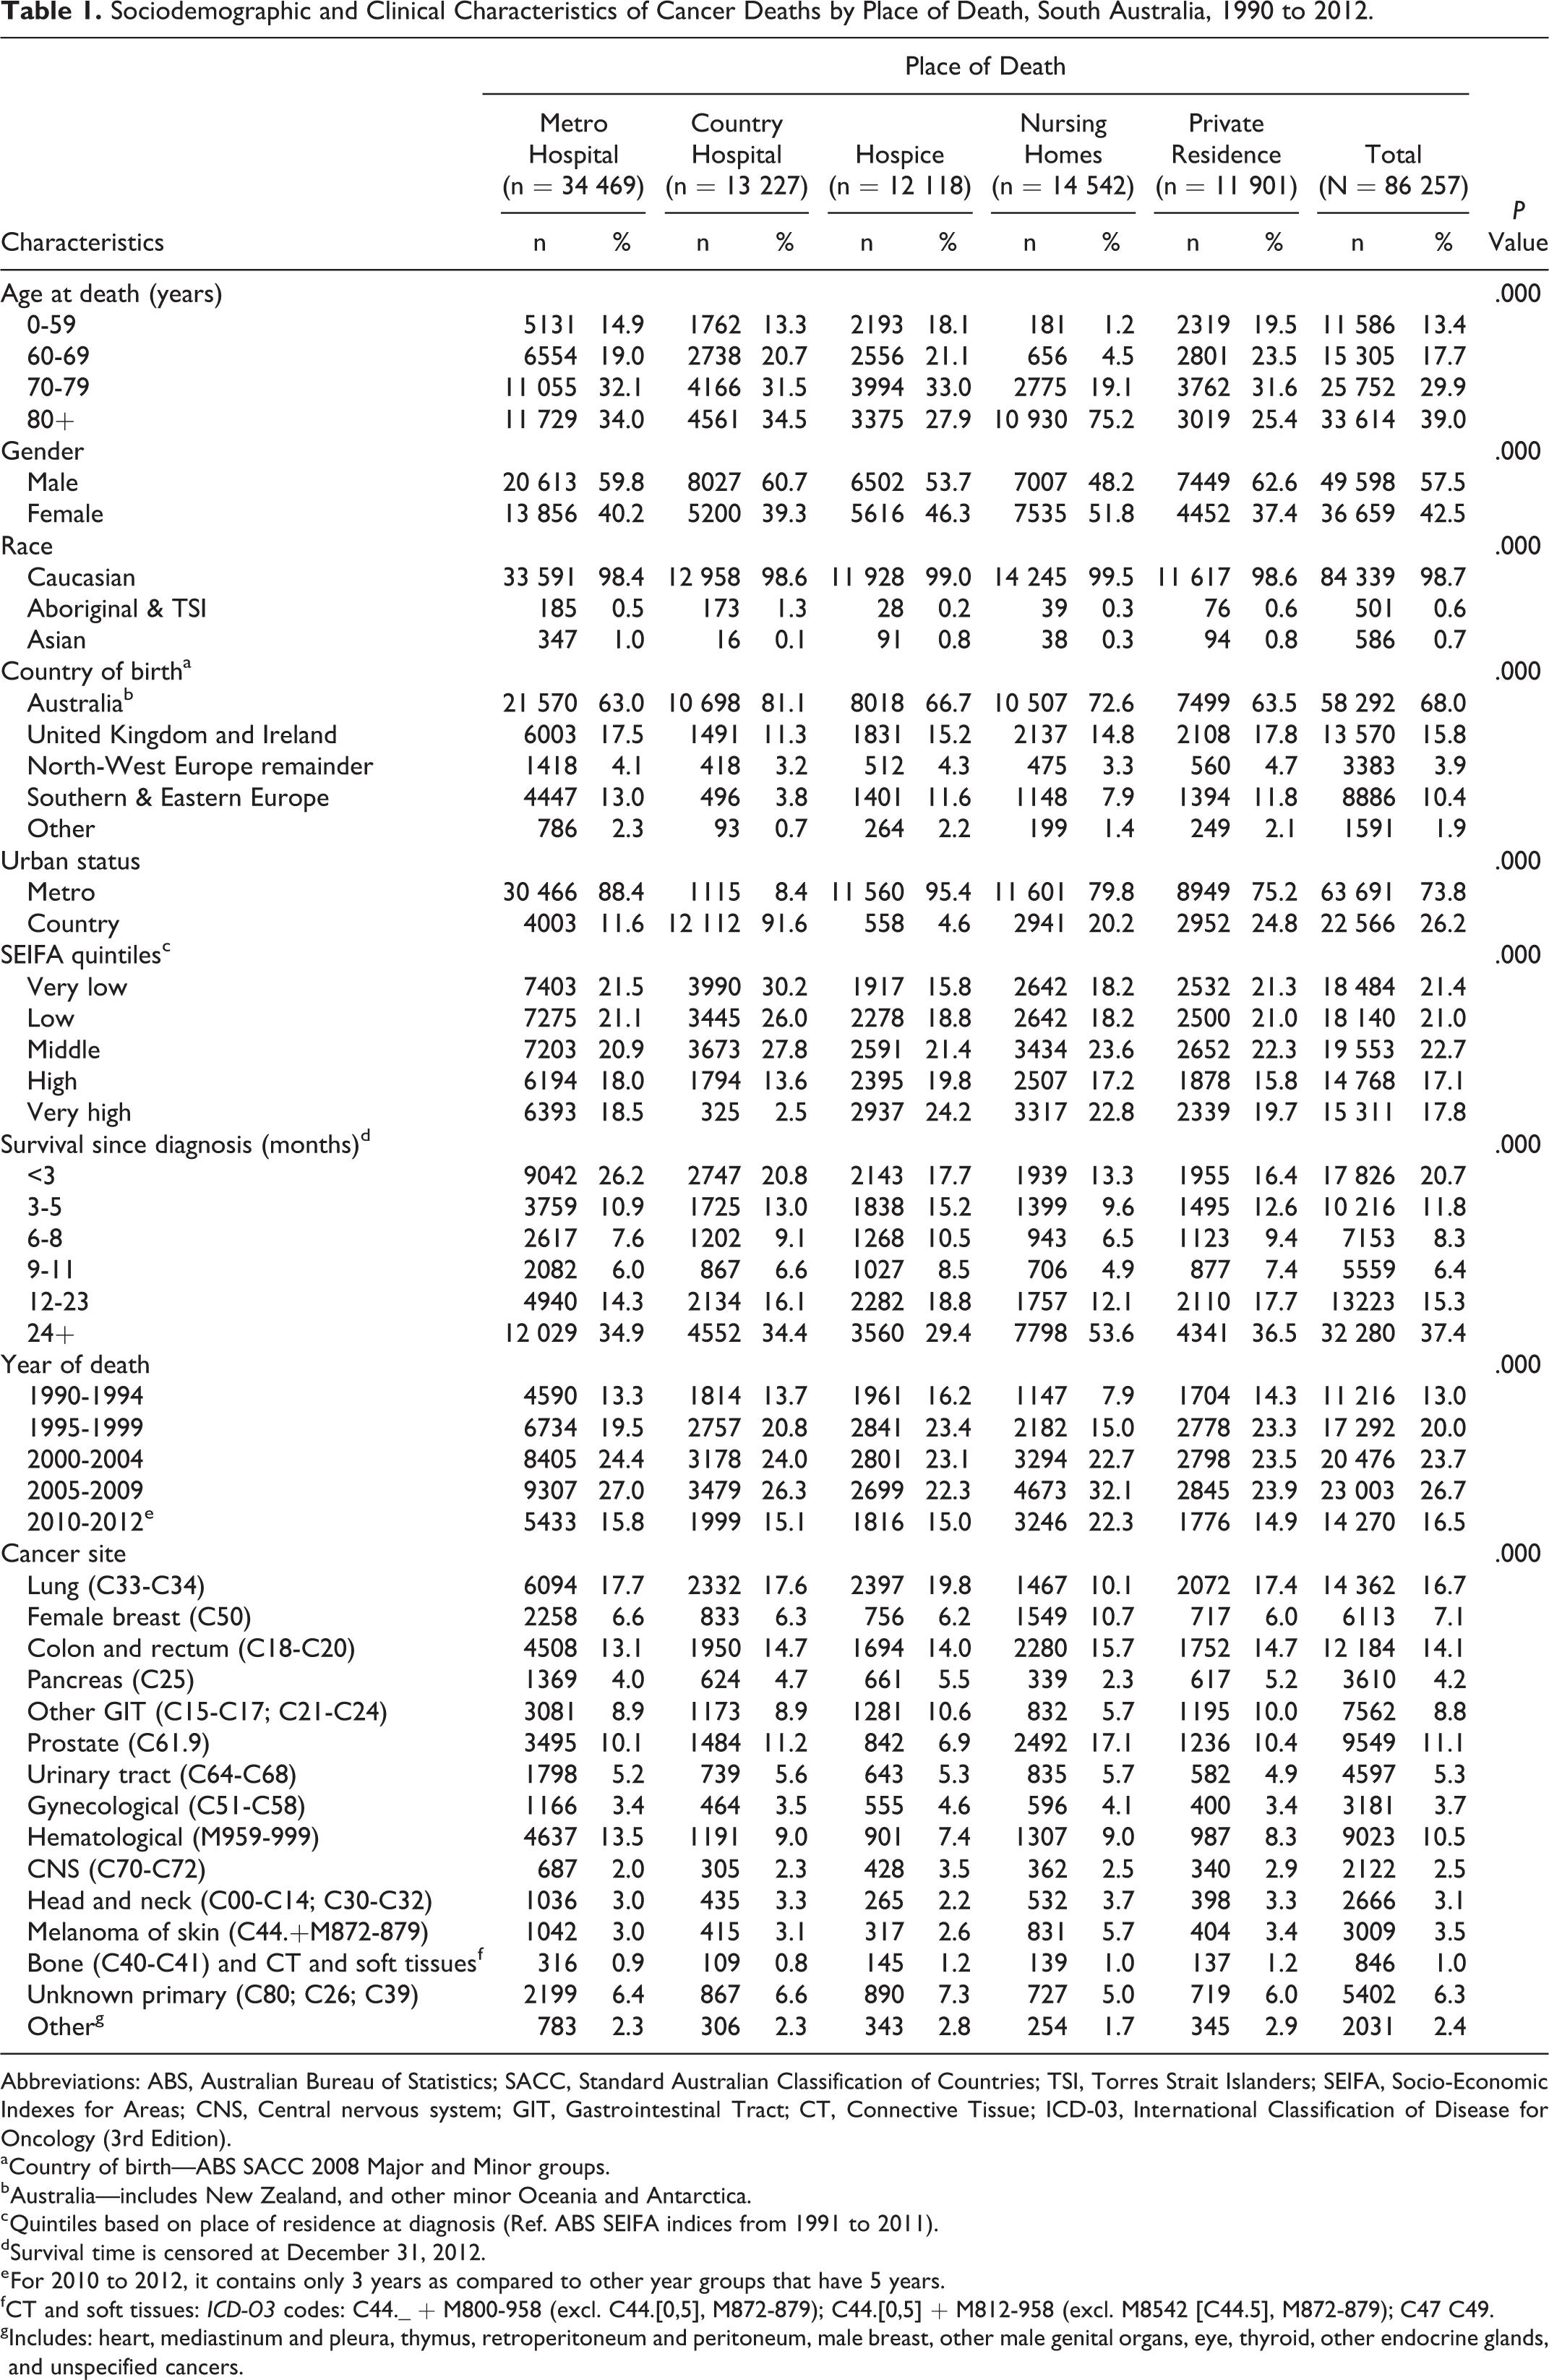
Abbreviations: ABS, Australian Bureau of Statistics; SACC, Standard Australian Classification of Countries; TSI, Torres Strait Islanders; SEIFA, Socio-Economic Indexes for Areas; CNS, Central nervous system; GIT, Gastrointestinal Tract; CT, Connective Tissue; ICD-03, International Classification of Disease for Oncology (3rd Edition).
a Country of birth—ABS SACC 2008 Major and Minor groups.
b Australia—includes New Zealand, and other minor Oceania and Antarctica.
c Quintiles based on place of residence at diagnosis (Ref. ABS SEIFA indices from 1991 to 2011).
d Survival time is censored at December 31, 2012.
e For 2010 to 2012, it contains only 3 years as compared to other year groups that have 5 years.
f CT and soft tissues: ICD-O3 codes: C44._ + M800-958 (excl. C44.[0,5], M872-879); C44.[0,5] + M812-958 (excl. M8542 [C44.5], M872-879); C47 C49.
g Includes: heart, mediastinum and pleura, thymus, retroperitoneum and peritoneum, male breast, other male genital organs, eye, thyroid, other endocrine glands, and unspecified cancers.
The results of the multinominal logistic regression show the odds of dying in various locations, as compared to the odds of dying in a metropolitan hospital, after adjusting for other variables in the model (Table 2). Place of death varied with a range of demographic factors, including age, gender, ethnicity, country of birth, and rural or metropolitan residence. For example, people who died in a country hospital or nursing home relative to those who died in a metropolitan hospital had a greater odds of being older, while those who died in a hospice or in a private residence had a greater odds of being younger. Cancer deaths at a private residence were more likely to occur for younger people, those who lived in a rural area, and those from the highest socioeconomic group.
Multinomial Logistic Regression of the Odds of Dying From Invasive Cancer in Specified Places of Death in South Australia, as Compared to Metropolitan Hospitals (Includes Public and Private), 1990 to 2012.
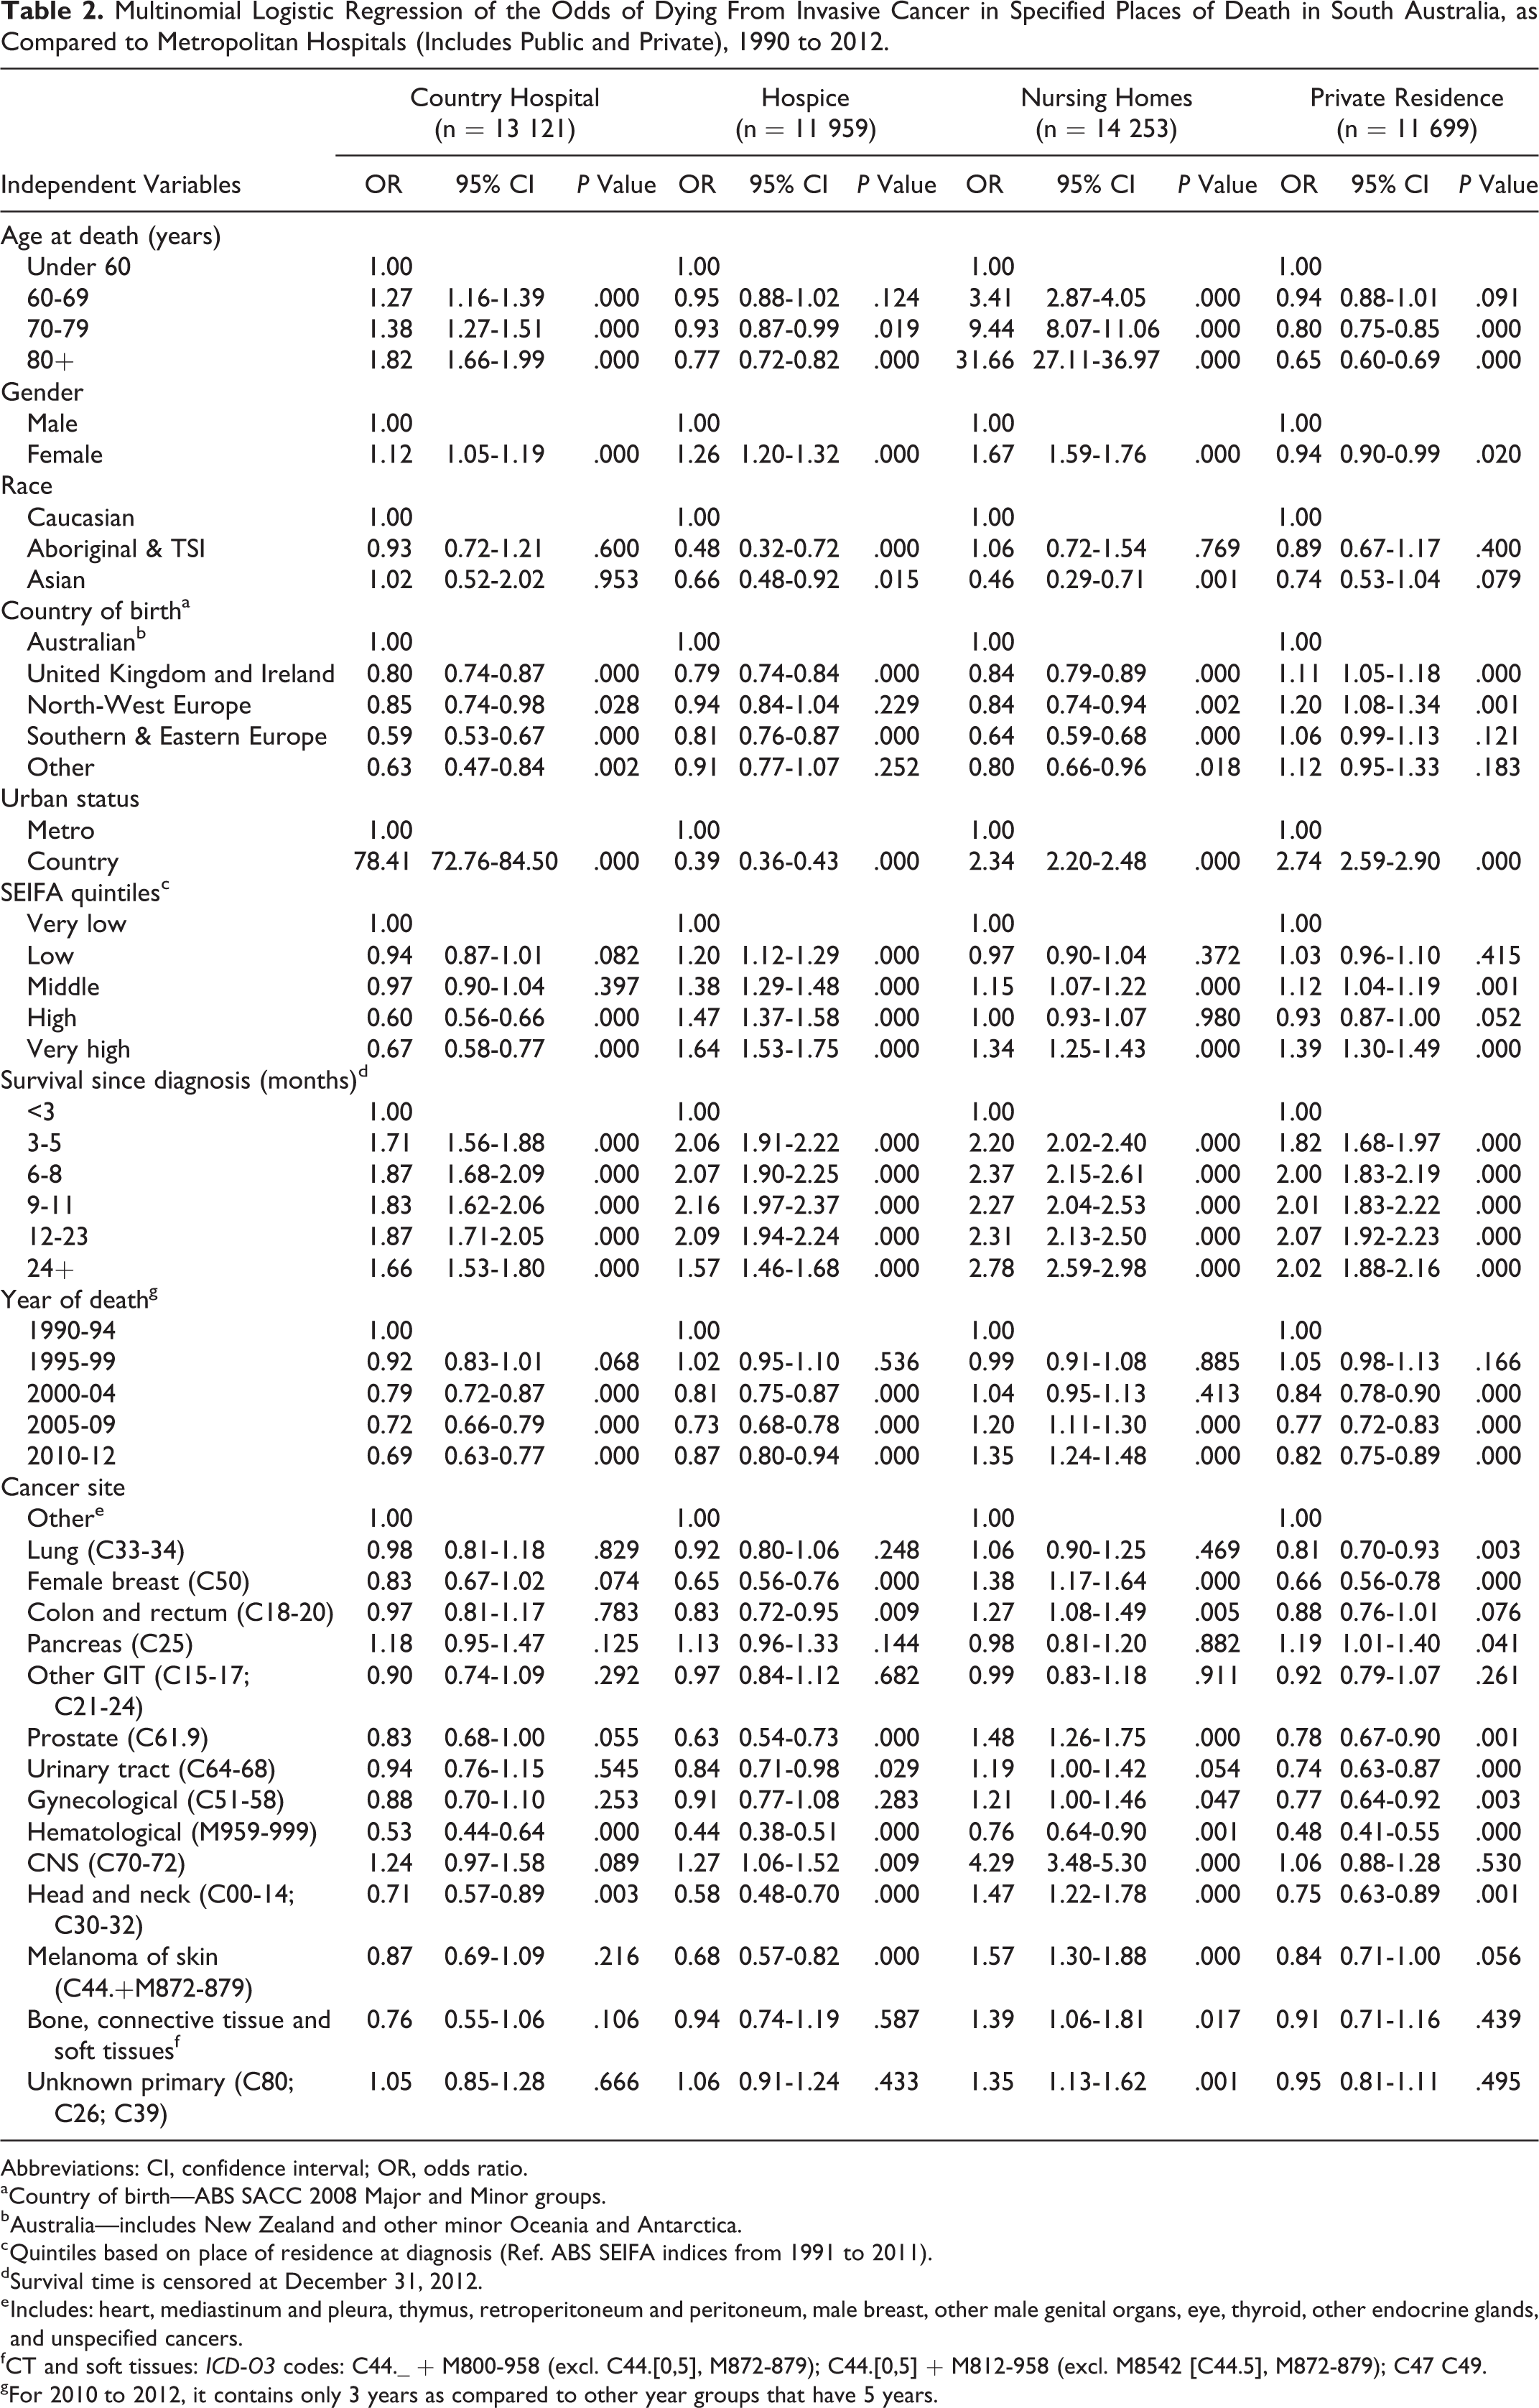
Abbreviations: CI, confidence interval; OR, odds ratio.
a Country of birth—ABS SACC 2008 Major and Minor groups.
b Australia—includes New Zealand and other minor Oceania and Antarctica.
c Quintiles based on place of residence at diagnosis (Ref. ABS SEIFA indices from 1991 to 2011).
d Survival time is censored at December 31, 2012.
e Includes: heart, mediastinum and pleura, thymus, retroperitoneum and peritoneum, male breast, other male genital organs, eye, thyroid, other endocrine glands, and unspecified cancers.
f CT and soft tissues: ICD-O3 codes: C44._ + M800-958 (excl. C44.[0,5], M872-879); C44.[0,5] + M812-958 (excl. M8542 [C44.5], M872-879); C47 C49.
g For 2010 to 2012, it contains only 3 years as compared to other year groups that have 5 years.
Those who died in a metropolitan hospital compared to the other places had greater odds of having a short survival time and an hematological malignancy, while those with a central nervous system malignancy were more likely to die in nursing homes. Patients with primary cancers of breast, prostate, head and neck, and melanoma had lower odds of dying in hospices and private residences, and greater odds of dying in nursing homes.
Discussion
This population-based study of where cancer deaths occurred over a 23-year period is the longest of its kind, and it provides insights into the dynamics of terminal care that are relevant to other communities and countries. It is important to study place of death patterns to improve our understanding of terminal care, to evaluate the impact of policy and services, to identify areas of unmet need, and to plan future services.
Population growth and aging will result in more patients with cancer who require care at the end of life. In South Australia, the number of deaths from invasive cancer increased by more than 4-fold between 1990 and 2012, and future service plans should take account of further increases.
Deaths in Hospital
The proportion of cancer deaths that occurred in hospital lessened over time, from 63.4% in 1990 to 50.9% in 2012. Similar trends for declining proportions of cancer deaths in hospital have been reported in North America and Europe. 3 -6,11 In South Australia, the trend began in the early 1980s, as hospice and palliative care services emerged to promote home and hospice alternatives to hospitals for terminal cancer care. 7,8 The continuing high demand for the limited number of hospital beds suggests the trend may continue.
Around half of all cancer deaths still occur in hospitals, however, so it is important that specialist palliative services are readily available in hospitals. All metropolitan public hospitals have developed specialist palliative care consult teams, but private hospitals have tended to lack ready access to specialist palliative care services. For country hospitals, the vast distances and limited specialist resources create additional challenges. Links between metropolitan specialist services and country services are continuing to develop, and telemedicine support should have an important role.
Patients with cancer who survived less than 3 months were more likely to die in a metropolitan hospital than any other site, perhaps because they quickly deteriorated from the time of diagnosis and could not be safely discharged to other sites. 7 -9 As previously found, patients with an hematological malignancy were more likely than other patients with cancer to die in a metropolitan hospital. 7 -11 We found that 51% of patients with hematological malignancy died in metropolitan hospitals, compared to 42% with lung cancer, 37% with colorectal cancer, 37% with prostate cancer, and 37% with breast cancer. This observation may be explained by the close relationships that develop with hematology teams through the course of multiple hospital admissions, and the common types of fatal complications (eg, infection and hemorrhage) that tend to be treated in hospital.
Deaths at Home
The development of hospice and palliative care services in the 1980s and early 1990s may have contributed to an increase in home deaths that peaked at 17% in 1993. 7,8 Previous research using SACR data showed the overall proportion of patients with terminal cancer who had care from a specialist palliative service increased from 56% in 1990 to 63% in 1993 and 68% in 1999; also, patients with cancer who died at home had the highest coverage (75%) with designated palliative services. 10 Despite this relatively high usage of palliative services by South Australians with terminal cancer, the likelihood of home death remained below 14% from the year 2000. It is noted that these multidisciplinary palliative services provided support and coordinated the generic home care services, rather than providing “hands on” care for patients at home. A limitation of the present study is that there were no data about the coverage of patients with cancer by palliative services after 1999, and so it was not possible to estimate the impact of palliative service provision on their place of death.
Perhaps the availability of home supports explains an increased likelihood of dying at home for young compared to older patients, for males compared to females, and for those in the highest socioeconomic group. Unlike a Canadian study, we found country patients with cancer were more likely than their metropolitan counterparts to die at home. 13
The proportion of home cancer deaths in South Australia was lower than in many other countries. Cohen et al reported that in 2003 the percentage of cancer deaths at home was 45.4 in the Netherlands, 35.8 in Italy, 27.9 in Belgium, 22.7 in Wales, and 22.1 in England. 12 In Mexico City in 2003, 54% of cancer deaths occurred at home. 17 In Singapore, 30% of cancer deaths occurred at home, and in Taiwan 34% occurred at home. 18,19 Various cultural, social, and health system postulates may account for these differences. Compared to South Australia, only a few places report similar or lower cancer deaths at home; Norway had 12.8% in 2003 and Japan less than 10% in 2002. 12,20
The relative low proportion of home cancer deaths contrasts with the preferences of a representative sample of South Australians that showed 70% preferred to die at home if they had a terminal illness. 14 The preference for home death would be less in an actual population of terminally ill patients, however, because of their older age, less home supports, and poorer health status (all of which were associated with lower preference for home death). 14 Nevertheless, there were likely to be substantial differences between the preferred and actual place of death of South Australian patients with cancer, and this would reduce their quality of life and satisfaction with care. 21
The Palliative Care Services Plan, 2009 to 2016 aimed to improve home palliative services to enable more South Australians to die at home—the service model mainly involved expert advice and the coordination of generic services, rather than “hands on” care. 15 Further evaluation will be required to determine its impact. Monitoring of preferences in the target population of patients with cancer, and their actual place of death is warranted. Reconfiguring service models may be required to improve the opportunity for patients with cancer to die at their desired location.
Deaths in Nursing Homes
The most outstanding change between 1990 and 2012 was the increase in nursing home deaths. Only 8.2% of cancer deaths occurred in nursing homes in 1990, less than any other site, but by 2012 this proportion had increased to 22.5%, nearly as much as hospices and private residences combined. The trend away from hospitals to nursing homes for terminal care has been reported elsewhere (eg, United States, Canada, the Netherlands, and Belgium). 3,4,12,21,22 As previously found, patients with cancer who died in nursing homes were more likely to be older, female, and Australian born. 2,8,10
The adequacy of resources for South Australian nursing homes to provide terminal care is uncertain. The nursing hours available to residents are vastly below that of hospitals and hospices, and the skill-mix has changed toward carers rather than trained nurses, so skilled assessment and the administration of palliative medication has become problematic.
Additionally, nursing home residents tend to miss out on specialist palliative services to support and oversee care, compared to patients with cancer dying at other sites. In 1999, for example, 48% of patients with cancer who died in nursing homes had used designated palliative services, compared to 75% of patients who died at a private residence. 10
The quality of care for patients with terminal cancer in nursing homes requires explicit end-of-life care planning. There are examples in other countries of where skilled nursing beds and specific palliative services have been provided to address the needs of nursing home residents with terminal cancer, and these models could be tried in South Australia. 12,21,22
Deaths in Hospices
Overall, 14.0% of cancer deaths occurred in a designated hospice. Over time, the number of hospice beds was relatively stable, but the number of cancer deaths increased, so there was a relative reduction in the proportion of cancer deaths in hospices since the mid-1990s.
A concerning finding was that some groups tend to miss out on the benefits of care in a designated hospice facility. Asian and Aboriginal and Torres Strait Islander people were less likely than Caucasians to have in-hospice care. This may relate to cultural factors or reduced access to hospices. People with low SES were also less likely to die in a hospice—only 10% of those in the lowest SES group died in a hospice compared to 19% in the highest SES group. Higher SES suggests better education and knowledge about hospice facilities, and improved access because of private health insurance for a hospice in a private hospital. With this in mind, a review of the location of hospices and their admission policies is indicated.
Limitations of the study include the absence of information about patient preferences, which limits potential judgments about the patterns and trends, whether patients’ were satisfied with their site of care, and whether they could be better satisfied. The involvement of palliative services was limited to just 3 years (1993, 1993, and 1999), and did not measure the level of involvement for each person, so it was not possible to estimate the impact of these services on the place of death patterns. Additionally, the “hospice” category did not include acute palliative care beds in some major hospitals, nor the single rooms that have been set up for end-of-life care in some country hospitals and nursing homes. It was not possible to understand further the influence of ethnicity beyond the categories presented, which has limited the conclusions based on ethnicity. The strengths of the study include the use of high quality registry data that spans a large number of years in addition to the consistent capture of place of death in a defined community.
Conclusion
Systematic documentation of the place of death of 86 257 patients with cancer between 1990 and 2012 was used to portray changes over time and enable international comparisons. Despite the relatively high coverage of the patients with terminal cancer by specialist palliative services in South Australia, the proportion of home cancer deaths was lower than in most other countries. The trend toward nursing homes for the increasing number of cancer deaths is likely to continue. Nursing homes, however, generally lack the resources and skilled staff to provide quality palliative care. These findings challenge policy makers and clinicians to find cost-effective models of care that can satisfy the interests and wishes of patients dying with advanced cancer.
Footnotes
Acknowledgments
The authors thank Prof David Roder for originally agreeing to include place of death in the database, and SACR staff for ensuring quality of the database.
Declaration of Conflicting Interests
The author(s) declared no potential conflicts of interest with respect to the research, authorship, and/or publication of this article.
Funding
The author(s) received no financial support for the research, authorship, and/or publication of this article.