
Abstract
In Ontario, pregnant people can choose to seek care from an obstetrician, family physician, or midwife. This study aimed to determine whether Ontario’s Champlain Region displayed the levels of access to the full range of maternity care providers required to afford pregnant people the opportunity to exercise choice of provider. Drawing on data from a census survey of midwifery practice groups, the CIHI National Physician Database, and BORN Ontario, the Enhanced Two-Step Floating Catchment Area Method was adapted to calculate provider-specific accessibility scores for communities across the region. The resulting maps revealed inequities in the distribution of access across the region, differences in relative access across provider groups, and underserviced communities with minimal access to any provider group. This study presents a new approach to mapping alignment between maternity care workforce capacity and pregnant people’s needs, and illustrates that additional action is required to equitably support access and choice.
Introduction
In Ontario, pregnant people can choose to seek maternity care from an obstetrician, a family physician, or a midwife. However, through extensive consultation with families, healthcare providers, and community organizations, the Champlain Maternal Newborn Regional Program identified variability in the availability of different healthcare providers as a barrier to optimal access to perinatal care in Ontario’s Champlain Region, which encompasses Ottawa, and its surrounding communities. 1 As of 2018, obstetricians remained the principal providers of maternity care in the Champlain Region, attending 68.39% of all births, while 11.66% were attended by midwives, and 8.9% were attended by family physicians. 2 Evidence suggested that this distribution was not fully reflective of population needs nor demand for these services. 3 For instance, in fiscal year 2017/18, 269 pregnant people requesting midwifery care in the Champlain Region remained unaccommodated throughout their pregnancy, and a further 109 pregnant people who requested midwifery care were initially unaccommodated but eventually received care from a midwifery practice group. 2
In response to this challenge identified by local health system leaders, this study aimed to determine whether the maternity care system in Ontario’s Champlain Region displayed the levels of access required to afford pregnant people the opportunity to exercise choice of provider. To achieve this objective, we employed geospatial analysis to map the distribution of pregnant people’s access to the full range of maternity care providers across the Champlain Region. For the purposes of this study, we have defined access to the full range of maternity care providers as access to family physicians, midwives, and obstetricians who provide intrapartum care. The scope of this study is, therefore, restricted to the three groups of maternity care providers all residents of the Champlain Region can choose as their primary birth attendant.
Methods
This study was completed as an embedded research project within the Champlain Maternal Newborn Regional Program, which enabled ongoing partnership and consultation with local interest-holders. We adapted the Enhanced Two-Step Floating Catchment Area Method 4 (E2SFCA) to calculate a provider-specific accessibility scores for each census aggregate dissemination area (ADA) 5 (community/neighbourhood) within the Champlain Region using ArcGIS 6 software. We then produced choropleth (heat) maps, which visually represented the provider-specific accessibility scores, and allowed us to compare access within the region and across provider groups.
In line with the principles of Integrated Knowledge Translation, 7 local policy-makers, maternity care providers, and people with lived experience accessing maternity care in the region were actively engaged in validation and interpretation of the choropleth maps through subsequent qualitative focus groups.
Luo and Qi 4 propose a two-step process to measure geographic accessibility of care and to identify areas of workforce shortage. The fundamental measure upon which the original methodology is built is a provider-to-population ratio. To build upon Luo and Qi’s approach, and account for a more nuanced representation of the match between the service requirements generated by population health needs, and the service capacity generated by provider practice patterns, our adapted methodology replaces provider-to-population ratios with service capacity-to-requirement ratios.
This adapted methodology allowed us to account for individual providers’ practice patterns when measuring the service capacity they offer within the local maternity care system. This adapted methodology also allowed us to account for the unique demographic and risk profiles of local populations when measuring the maternity care needs they generate.
Step 1: Calculating Service Capacity-to-Requirement Ratios for Each Provider Location
In the first step of this adapted methodology, once representative points for providers and populations had been geolocated, all of the population locations that fell within a weighted 30-minute drive-time threshold from each practice location were identified and a service capacity-to-requirement ratio was computed for the defined catchment area. A variety of data sources were necessary to complete this step.
Complementing data already available from the CIHI National Physician Database with a census survey of local midwifery practice groups conducted specifically for the purposes of this study, we mapped the distribution of service capacity generated by obstetricians, family physicians, and midwives providing intrapartum care across the Champlain Region using each individual provider’s average yearly number of births attended as the principal care provider. The total service capacity attributed to a particular provider location represented the sum of the service capacity of all professionals within the provider group whose postal code of practice fell within a particular ADA.
Drawing on data requested from the BORN Ontario database of maternal-child health information on all births within the province, we mapped the distribution of maternity care service requirements using the average yearly volume births generated by residents of each ADA. The total service requirement input into this step was calculated using the weighted sum of the service requirements of each population location falling within the established drive-time threshold from the provider location in question. Whereas service requirements for obstetricians included all births generated by residents, in the case of midwives and family physicians, service requirements were limited to births classified as low risk as per the Provincial Council for Maternal & Child Health definition used by the BORN Ontario database.
Step 2: Calculating Provider-Specific Accessibility Scores for Each Population Location
In the second step of this adapted methodology, a provider-specific accessibility score was produced for each population location by calculating the weighted sum of the service capacity-to-requirement ratios of all provider locations that fell within the established drive-time threshold from the population location.
To map the current state of access to the full range of maternity care providers, while accounting for year-to-year variations in the service capacity delivered by professionals and the services required by populations within a relatively small unit of geography, all data input into this mapping represented 3-year averages covering the period between FY 2015/16 and FY 2017/18. All steps were run using a 30-minute drive-time threshold, applying Gaussian weights for the midpoints of three equidistant breaks within the threshold.
For some population locations, such as urban centres, accessibility scores reflect their combined access to multiple providers’ capacity within a 30-minute drive-time. For others, such as some suburban populations, accessibility scores will only reflect access to the service capacity generated by a single provider. Finally, some rural population locations will have absolutely no access to any providers within a 30-minute drive-time, resulting in an accessibility score of zero. The weighted catchment areas used in this methodology also allowed us to account for the distance between patients and providers in our measurement of access. This acknowledges that a provider whose practice location is within 5 minutes of a pregnant person’s home will offer the pregnant person more access than a provider whose practice location is 25 minutes away from the pregnant person’s home.
Results
Service Requirements Generated by the Population
Between 2015/16 and 2017/18, residents of the Champlain Region generated an average of 12,922 births per year as a service requirement, of which an average of 55.34% were classified as low risk. Maternity care service requirements, for all levels of risk, were unevenly distributed across the Champlain Region, with some ADAs displaying a higher average yearly number of births generated by residents than others (minimum: (1-5), median: 90.33, maximum: 302.33). Furthermore, not all populations across the Champlain Region shared the same risk profile, with some ADAs displaying a greater proportion of births categorized as low risk than others (minimum: 0%, median: 55.81%, maximum: 72.09%).
Service Capacity Generated by the Workforce
The cohort of physicians with postal codes of practice within the Champlain Region who attended at least one birth between 2015/16 and 2017/18 included 104 obstetricians and 130 family physicians. At the time of data collection, the midwifery practice groups included in this study encompassed a total of 91 midwives. In aggregate, obstetricians generated an average yearly service capacity of 10,903 births, family physicians generated an average yearly service capacity of 1,559 births, and midwives generated an average yearly service capacity of 2,199 births across the Champlain Region.
While there were more family physicians than obstetricians in this cohort, obstetricians’ level of participation in the maternity care sector and the volume of births they attend on a yearly basis far exceeded that of family physicians. In other words, this cohort encompassed a high number of family physicians providing relatively low volumes of intrapartum care. On average, obstetricians attended approximately 105 births per year, whereas a family physician attended an average of 12 births. This cohort also demonstrated that not all obstetricians can be counted in the same way, with obstetricians engaging in variable levels of activity and participation in intrapartum care. Notably, obstetricians’ average yearly volumes ranged from less than one to more than 300 births attended per year.
Distribution of Access to the Full Range of Providers
Measuring the interaction between these service requirement and capacity trends using the adapted E2SFCA methodology, we produced the choropleth maps presented in Figures 1–3, which illustrate the distribution of access to obstetricians, family physicians who provide intrapartum care, and midwives, respectively. As is illustrated by the accessibility scores displayed in all three of these maps, access to all three maternity care provider groups was inequitably distributed across the Champlain Region. Choropleth Map of Accessibility Scores for Intrapartum Care Provided by Obstetricians Across ADAs Within the Champlain Region Choropleth Map of Accessibility Scores for Intrapartum Care Provided by Family Physicians Across ADAs Within the Champlain Region Choropleth Map of Accessibility Scores for Intrapartum Care Provided by Midwives Across ADAs Within the Champlain Region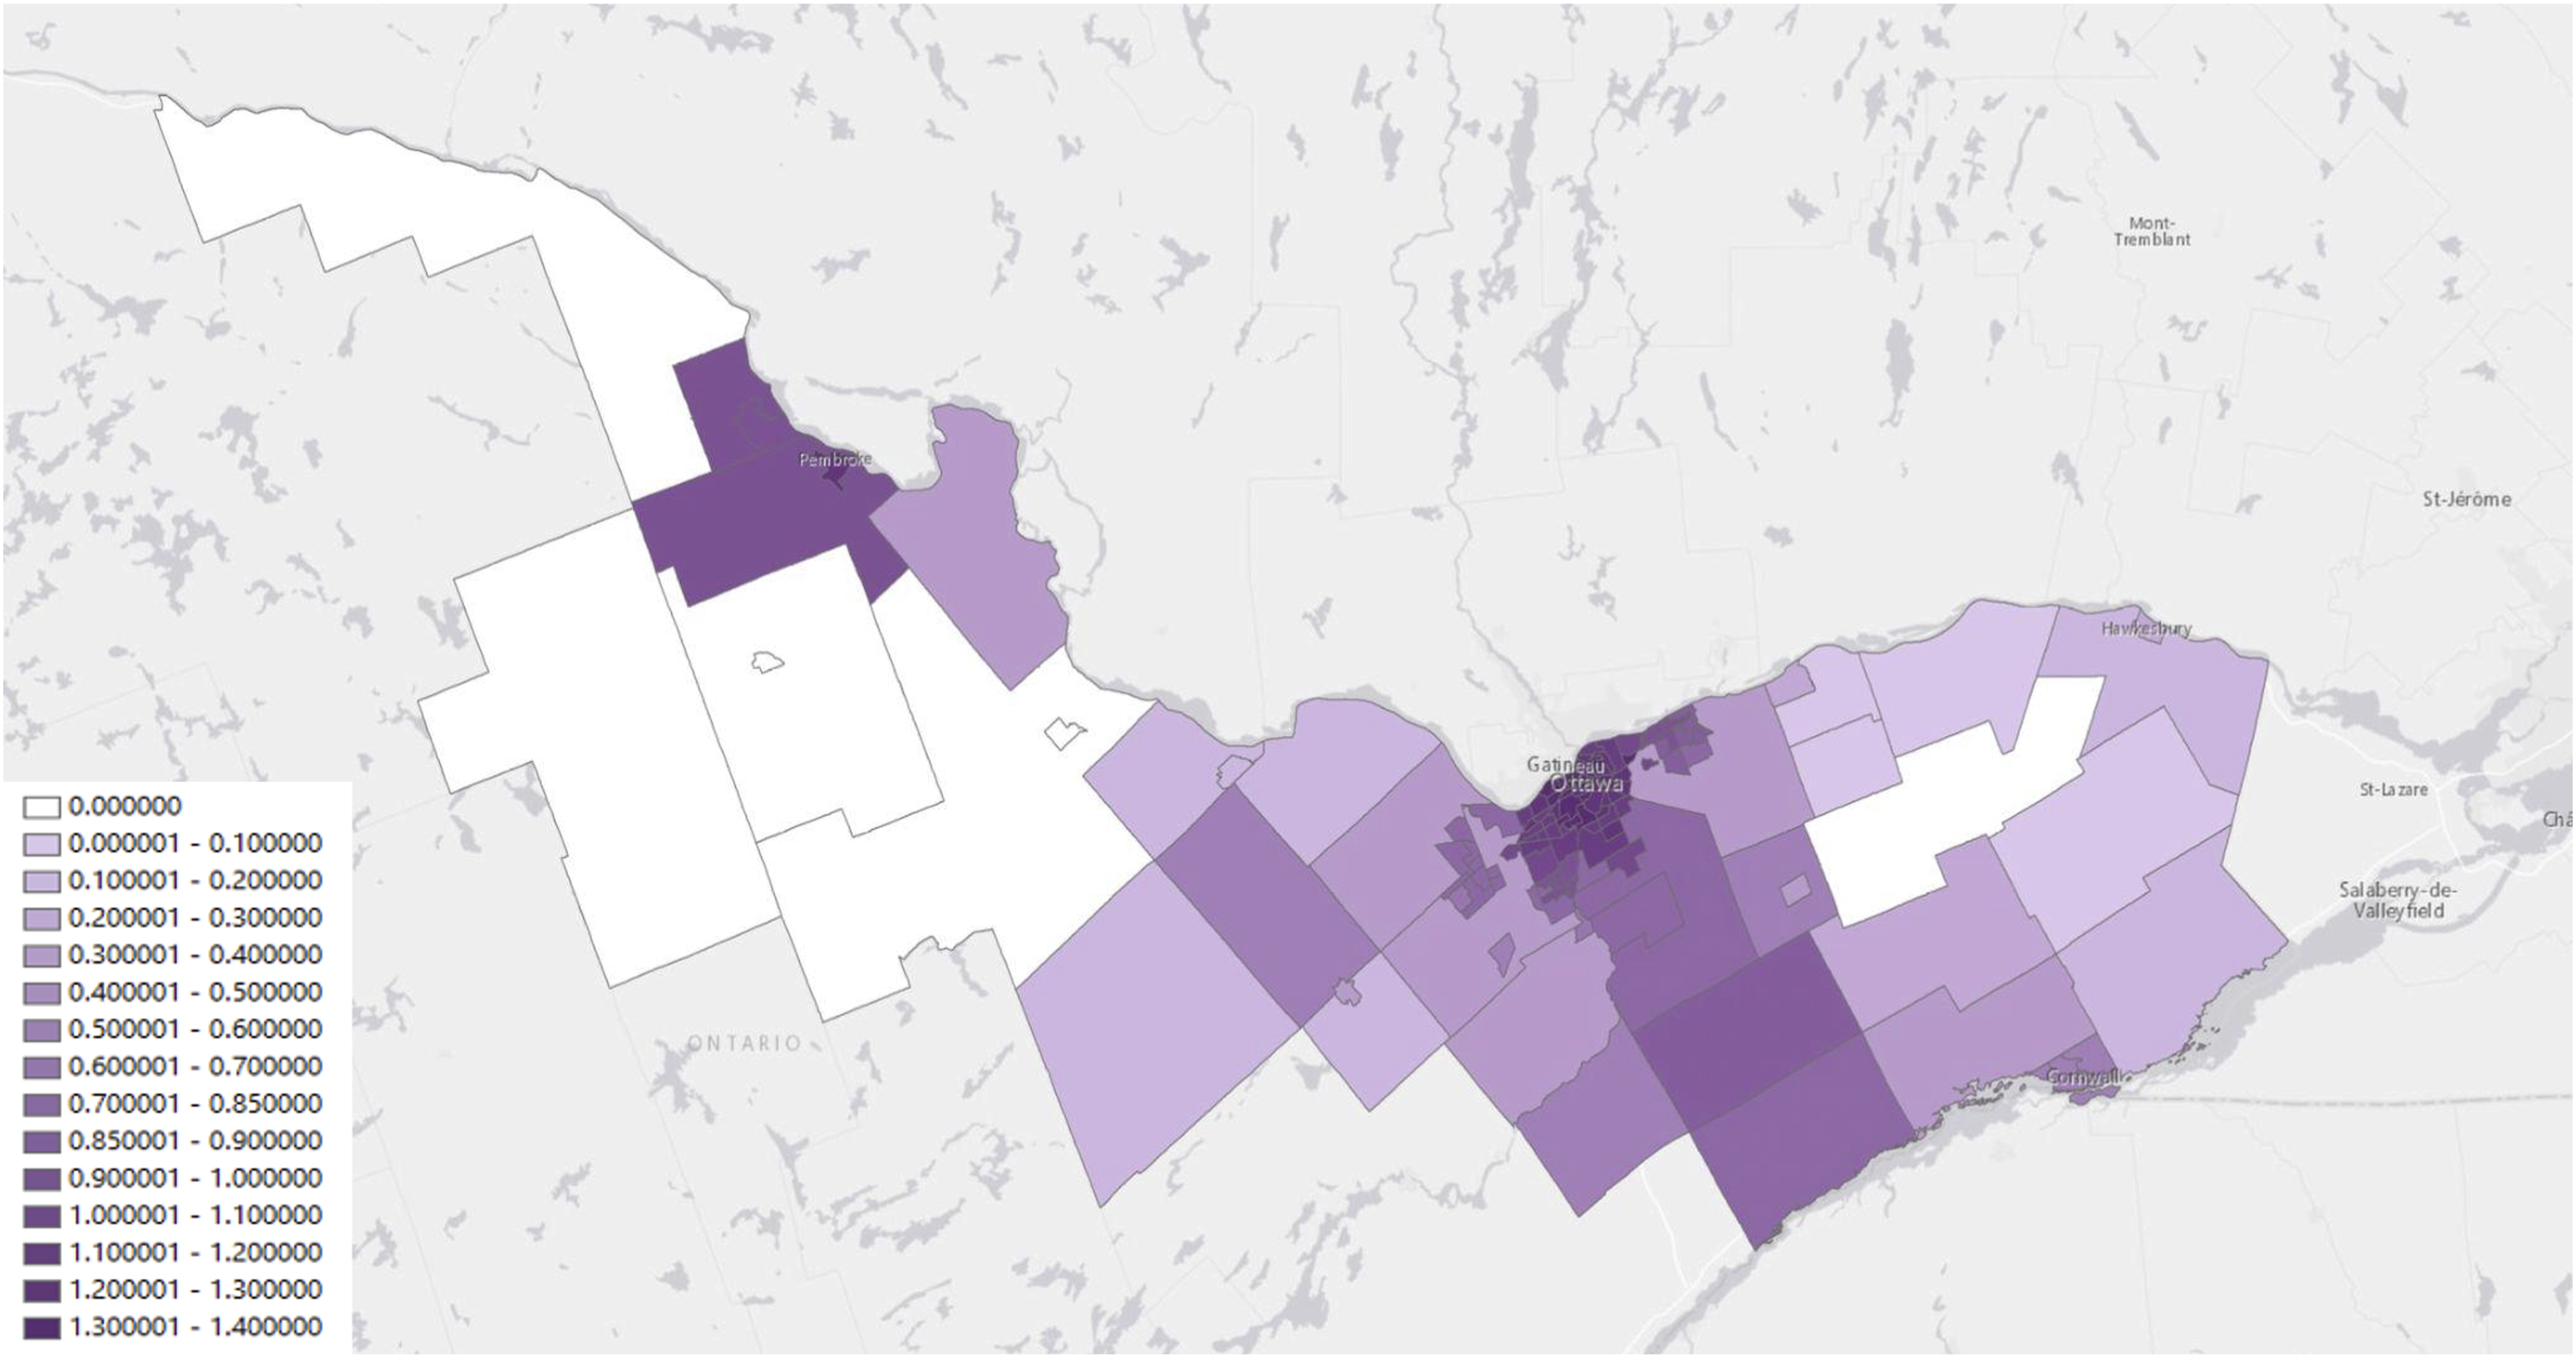
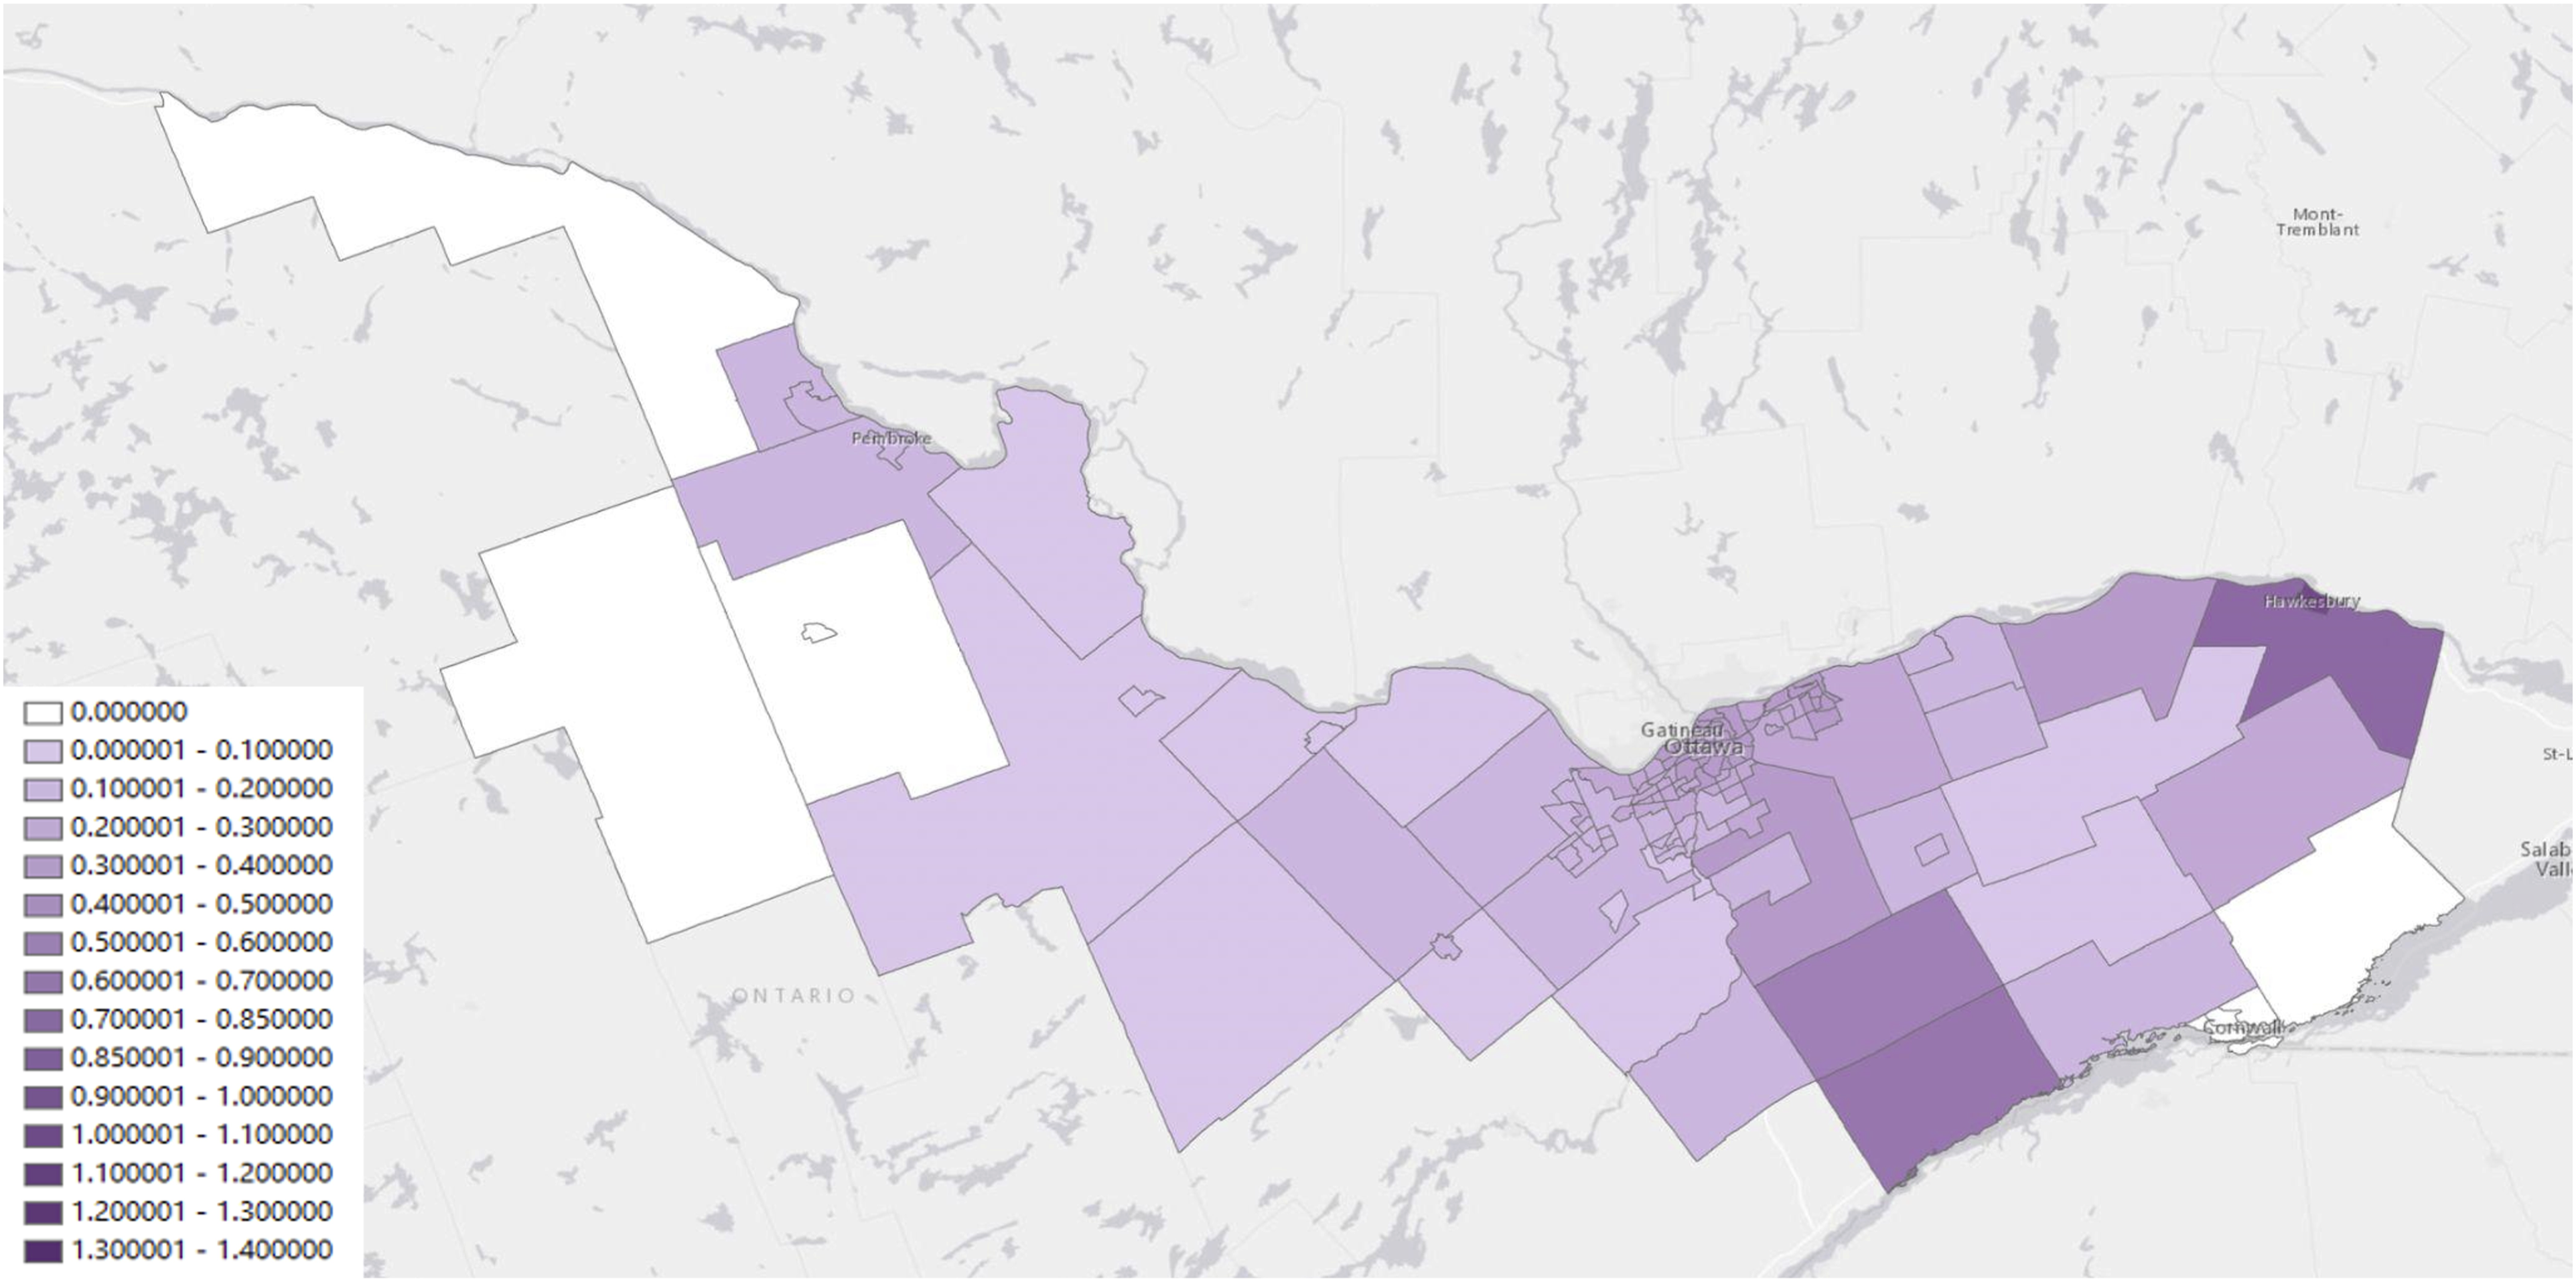
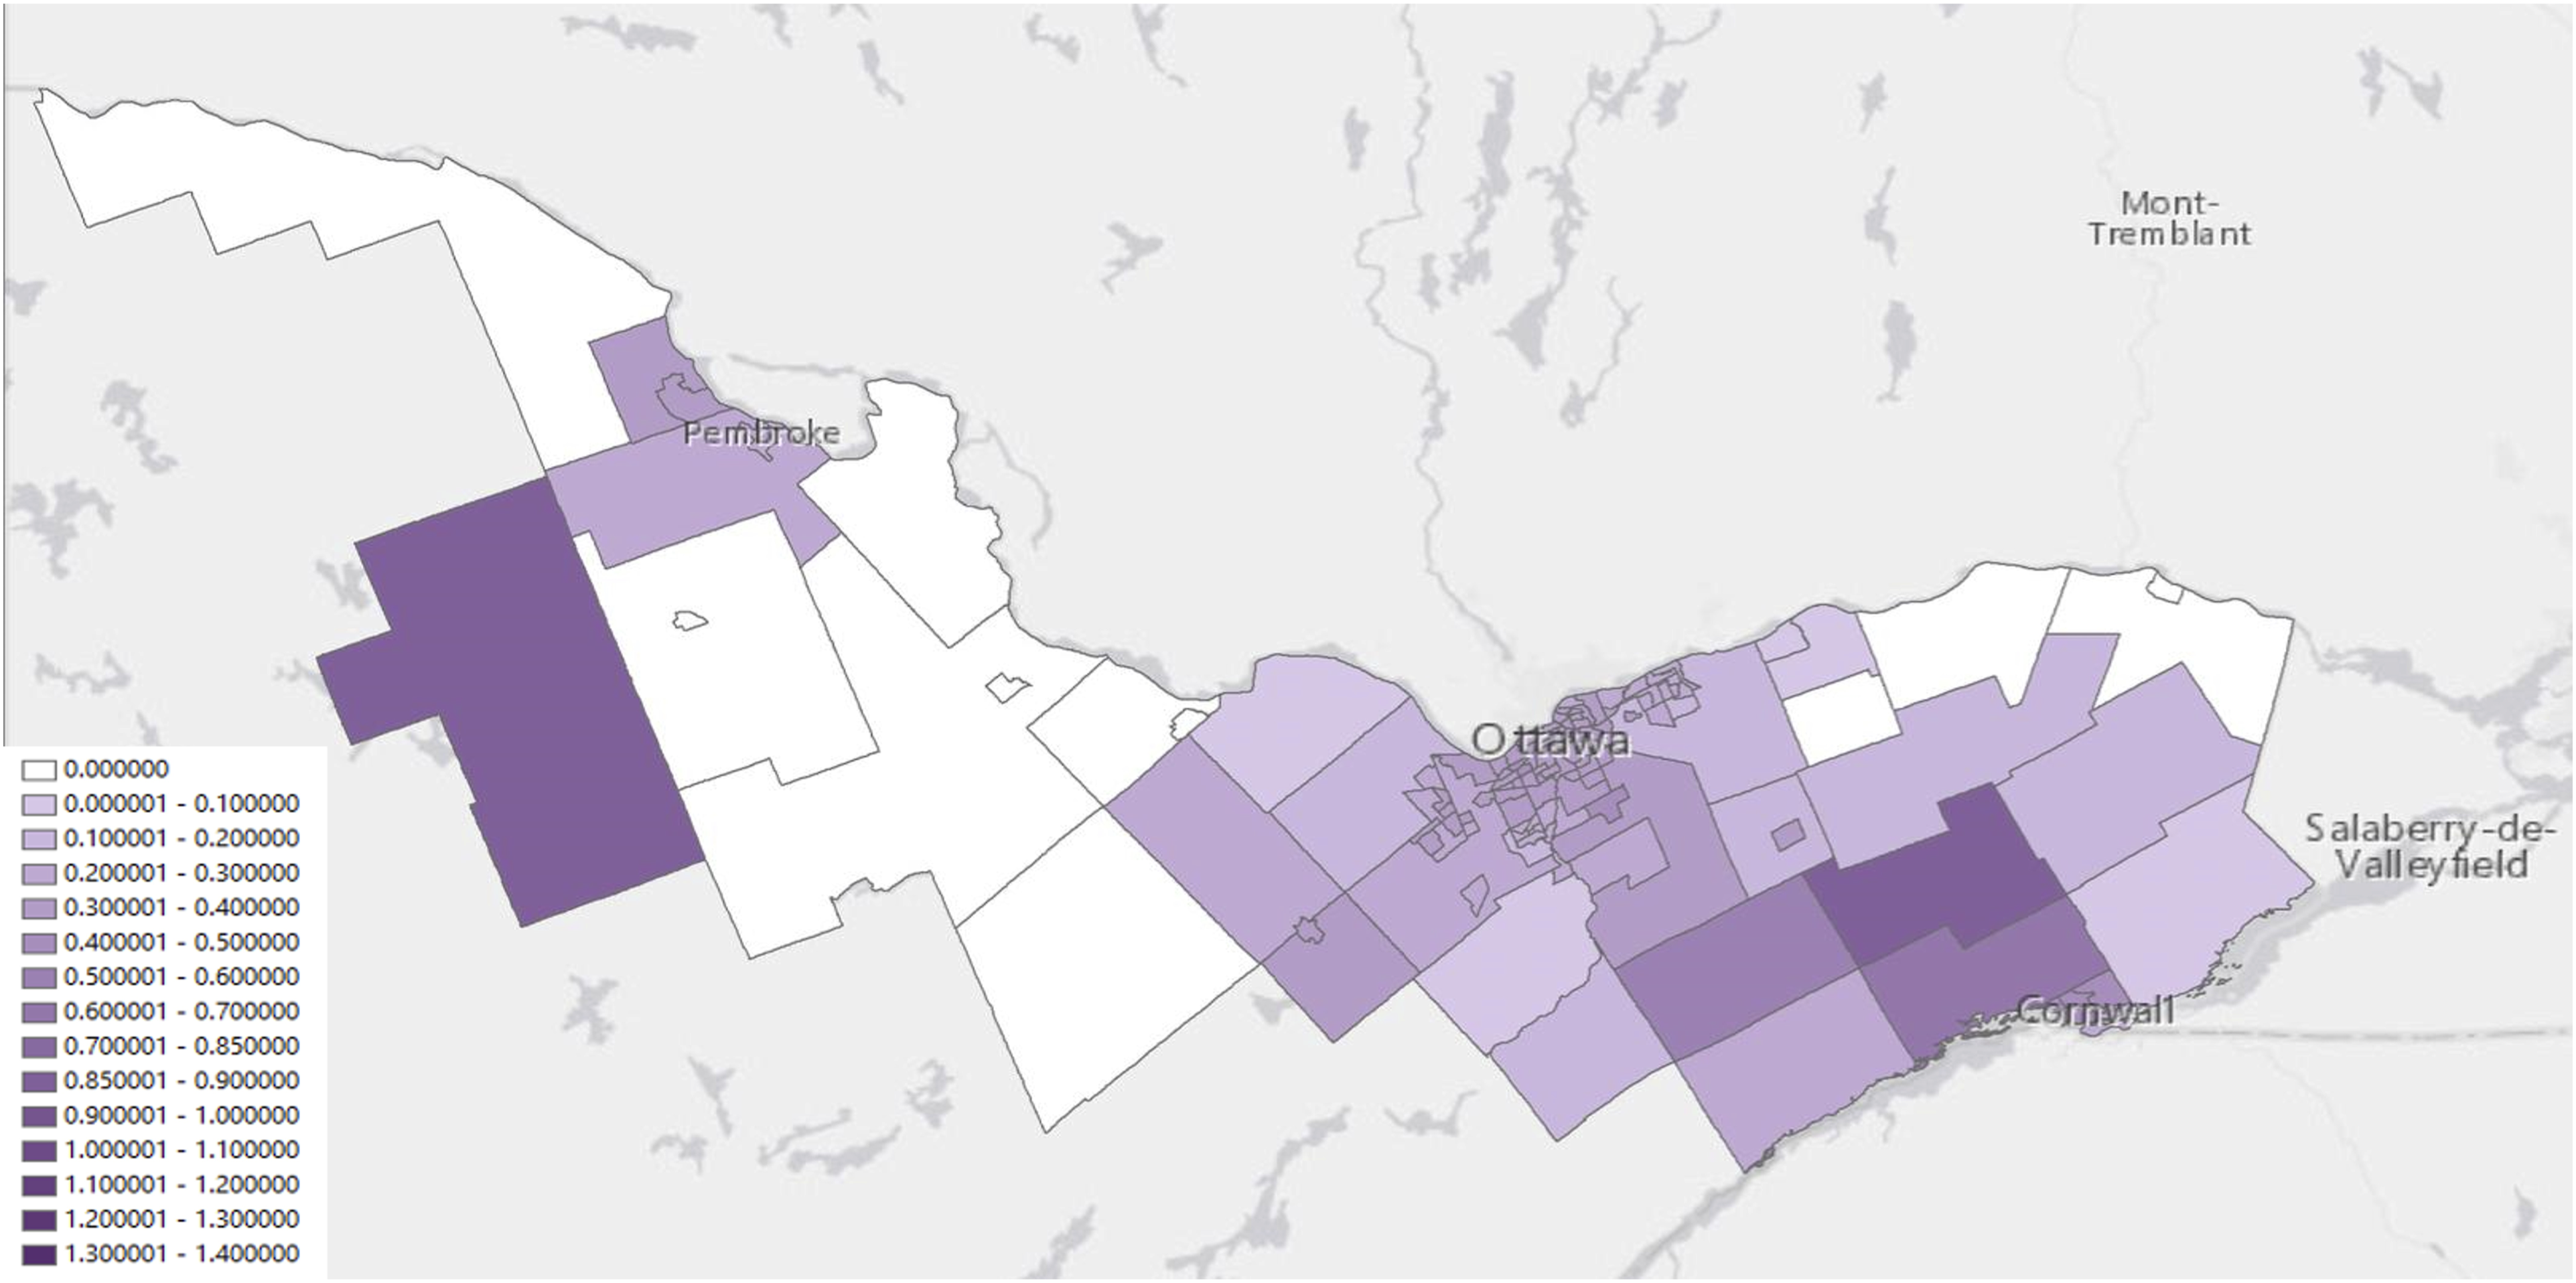
An accessibility index score of 0, which is represented in white on these maps, indicates that the population in this ADA has no access to the provider group in question within the 30-minute drive-time threshold. As scores increase and the colour gradient becomes darker, relative access to this provider group increases. It should be noted that these scores are relative measures that allow us to compare levels of access, but no particular score is a normative threshold for adequate access.
Comparing Relative Access Across Provider Groups
When comparing relative accessibility across provider groups, the average accessibility score for care provided by obstetricians (0.82) was significantly higher than the average accessibility score for care provided by family physicians (0.22) or midwives (0.28).
In some areas, access to one provider group was compensating for lack of access to others. This allowed for access to care without necessarily affording pregnant people the opportunity to exercise choice of provider. For example, due in part to the model of care established at the local hospital, the area surrounding Hawkesbury exhibited higher levels of access to family physicians, with minimal access to obstetricians, and no access to midwifery care. Similarly, in the rural areas of Barry’s Bay and Killaloe, pregnant people had relatively high access to midwifery care because of a satellite practice that has been established by one of the midwifery practice groups, but had no access to any other provider group.
Inequities in Access Across Rural and Urban Communities
With access concentrated in population centres—like Ottawa, and to a lesser degree Cornwall, Hawkesbury, and Pembroke—a number of smaller rural communities were left “stuck in the middle” with little to no access to any provider group and forced to drive long distances and leave their community to access maternity care.
For instance, the Ottawa Valley region appeared to be significantly underserviced for maternity care, consistently displaying low levels of accessibility across provider groups. This trend could partially be attributed to the closure of the maternity care program at a local hospital in June 2014. This provides a clear example of the critical importance of rural maternity care programs and satellite practices to upholding access to care closer to home, and of the effects program closures can have on access to care.
An ADA in the Eastern Champlain Region, which encompassed several growing communities and represented a source of concentrated demand for maternity care, also appeared to be significantly underserviced, with low levels of access to family physicians and midwives, and no access to obstetricians.
Discussion
While access to maternity care has been examined by others, very few studies have compared access to provider-specific maternity care. Also, to our knowledge, no studies have employed geospatial analysis as a means of describing the geographic distribution of pregnant people’s opportunity to exercise choice across a range of maternity care providers.
In this study, we developed an innovative methodology that is readily adaptable to other planning geographies and sectors of care within and beyond Ontario. Given that the birth rates and proportion of births classified as low risk were variable across the region, the adapted methodology’s ability to account for the unique demographic and risk profiles of local populations proved to be essential to the validity of our measures of access. Moreover, given the variable levels of activity and participation in intrapartum care displayed by providers in the Champlain Region, our adapted methodology’s ability to account for individual providers’ practice patterns when measuring the service capacity they offer within the local maternity care system proved to be essential to the validity of our measures of access. Most notably, using a simple headcount-based provider-to-population ratio would have led us to considerably overestimate access to intrapartum care provided by family physician.
Achieving this level of rigour did, however, require significant investment of time, energy, and financial resources into data collection and acquisition. Data available to calculate service requirements and service capacity were held by two separate data stewards, requiring separate data request processes, considerable negotiation to allow for data release at the level of geography required to support this type of analysis, significant financial costs, and long processing timelines. Furthermore, not all required data were available within existing administrative databases, requiring additional primary data collection with local midwifery practices, which involved extensive coordination, follow up and technical assistance to obtain accurate and complete data from all midwifery practice groups practicing within the Champlain Region. These details are not provided to dissuade others from engaging in this type of activity, but rather to advocate for more comprehensive, coordinated, and accessible data acquisition pathways to enable more robust research and planning activities that support leaders with the evidence they need to inform health system improvements.
Beyond evidence generation activities designed to identify gaps in access, such data are critically important to leaders’ development, implementation, and evaluation of the policy actions used to address gaps in access identified through this type of geospatial analysis. For optimal integration and impact, leaders should accompany these responsive interventions with follow up geospatial analyses to quantify their impact on access and choice, and appropriate monitoring and evaluation mechanisms to measure the interventions’ broader impact and inform their ongoing refinement.
Limitations
Recognizing that all research has limitations, we would now like acknowledge the limitations of this study. First, this study employs “Average Yearly Number of Births Attended as the Principal Care Provider” to measure service capacity. This is the most feasible proxy for a course of care available within our current data infrastructure but does not capture transfers of care at any stage during the prenatal or intrapartum period. Second, this study attributed providers’ service capacity to an ADA based on their postal code of practice. As a result, this study does not reflect the full breadth of geographic coverage that midwives provide through home care and may misallocate the service capacity of physicians in the event that the postal code of practice available in administrative databases is inaccurate. Third, the most recent year of administrative data available is for fiscal year 2017/18. As a result, any trends that have emerged since April 2018 are not reflected in these maps. Finally, while the data used are limited to patients and providers that reside or practice within the region’s boundaries, both residents and providers in and around the Champlain Region are free to access and provide maternity care services within and beyond these boundaries.
Conclusion
This geospatial analysis enabled the identification of underserviced areas where pregnant people’s access to and choice of maternity care provider may have been restricted by issues of service capacity or geographic access. By enabling the identification of underserviced areas, we offered local health system planners and policy-makers an evidence base to support better alignment of the maternity care workforce with pregnant people’s choices and needs.
Key Considerations for Health Leaders
• Geospatial mapping is a useful tool to identify underserviced communities where targeted expansion of local maternity care workforce capacity could address identified gaps in access. • More equitable access to the full range of maternity care providers is needed to give all pregnant people the opportunity to exercise choice of provider. • Rural maternity care programs, satellite practices, and home care are critical to upholding access to care closer to home for rural communities. • Enhanced data pathways are needed to facilitate evidence generation and planning exercises that better account for populations’ unique needs and providers’ unique practice patterns.
Footnotes
Acknowledgements
This study was conducted under the guidance of a thesis advisory committee, including Dr. Ivy Bourgeault, Dr. Agnes Grudniewicz, Dr. Elizabeth Kristjansson, and Dr. Wendy Peterson, and benefitted from additional review and evaluation from Dr. Saraswathi Vedam. The study also benefitted from the contributions of an advisory committee of community collaborators—including Ms. Darlene Rose, Ms. Mari Teitelbaum, Ms. Marie-Josée Trépanier, Dr. Mark Walker, Dr. Daisy Moores, Ms. Rosemarie Parisien, Ms. Elyse Banham, and Ms. Elizabeth Heller.
Ethical Considerations
The University of Ottawa’s Social Sciences and Humanities Research Ethics Board conferred ethical approval for this study (S-11-19-2363 and S-12-19-5320). This study conformed all privacy procedures required by data stewards and the approving REB. All data were anonymized prior to release and aggregated either prior to release or reporting.
Funding
The authors disclosed receipt of the following financial support for the research, authorship, and/or publication of this article: This study was funded through a Women’s Xchange $15K Challenge Grant and CIHR’s Health System Impact Fellowship Program.
Declaration of Conflicting Interests
The authors declared no potential conflicts of interest with respect to the research, authorship, and/or publication of this article.
Data Availability Statement
Aggregate data on accessibility index scores, service requirements, and service capacity are available upon request directed to the corresponding author. In line with established data sharing agreements, no other data are available for distribution.