
Abstract
A simplified production function framework is used to identify and analyze the international aspect of the maritime industries. The article focusses on four parameters – the market, the ship, the labour force and the shipowner – to discuss the development of the shipping industry. It is suggested that with the current technology, around 170 ships and less than 600 seafarers would have been needed to transport all the world trade in 1900. Finally, the international dimension of maritime transport is discussed.
Although rooted in national cultures and traditions, much – if not the majority – of maritime history has a strong international component. Moreover, the maritime industries have followed the general economic and social trends towards more internationalization and closer integration over the last centuries. As we move nearer to our time, the cross-border aspect of maritime history becomes stronger.
This article provides a discussion of the central elements of maritime business, using deep sea shipping as an example. The aim is to identify the fundamentals of the shipping business in the twentieth and early twenty-first centuries. This ‘reduced form’ presentation of shipping is then used to highlight the international dimension of the maritime industries. 1
The shipping business: A simplification
The production of goods and services is in reality an extremely complex operation, but it can still be presented in a very simple manner. For instance, to understand how shipping services are produced, we can use the generalized Cobb-Douglas production function, Y=ALβKα (where β=1-α). Here, labour (L) and capital (K) work together to ensure production (Y), which is also influenced by an efficiency component (A). 2 Improvements in A can occur as a result of, for instance, technological or organizational innovation.
The aim of the production function is to measure the relationship between total output and the various inputs. The model has been criticized for its significant simplification, but that is of no concern for us. Indeed, it is this simplifying element that enables us to identify and discuss the crucial parameters of the shipping business. In this framework, four factors combine to make up the shipping business: the market, the shipowner, the labour force and the ship. Typically, in the traditional model, these four factors are ‘monetized’ and expressed in monetary terms – dollar or pound, Euro or yen. Growth in A, L and/or K, will lead to an increase in Y. The model is thus usually based upon the value of production and the value of the inputs. We will depart from this, as our aim is not to understand the national economic element, or value added, of transport, but rather the mechanisms in the industry per se.
In our simplification, the market is represented by the total production (Y) – this can be seen as an aggregate that denotes the amount, quality and types of shipping services that are produced. The reality is more complex, of course, as the market also contains a demand side, where the price mechanism works as a signal between sellers and buyers. In addition, there are several sub-markets, or segments, with varying degrees of overlap. 3
For our purpose, however, we can think of the output as the amount of shipping – various types of seaborne transport services – that is produced. This is the ‘product’ that is made, when the three other factors are combined. In shipping, as in other industries, production is usually considered in terms of value creation. However, for those involved in shipping, the parameter that is commonly used to describe the market is ‘the amount of transport produced’ – represented by the volume of goods carried, and the distance that they are transported. This production is reported as ton-miles of transport. 4
In order to produce shipping services, we need the work performed by seafarers (labour: L) and we need the ships (capital: K). By adding labour and ships, the amount of cargo transported, or the distance that a given amount of cargo is transported, can be increased. The output is also affected by the mysterious A, an efficiency dimension, which has traditionally just been computed as the residual in the equation. When production increased more than the growth of K and L was able to explain, this was credited to ‘improved efficiency’. In traditional growth accounting models, this growth, which is not directly explained by observed increases in labour and capital, is referred to as Total Factor Productivity.
In shipping, this unexplained growth can be connected to observable factors such as improvements in cargo handling or vessel speed, which both mean that production will increase for a given set of K and L. But behind this, we find a relatively ‘intangible’ sort of entrepreneurship, the business acumen that brings the industry forward, through technological and organizational innovation. This dimension – what we may call maritime enterprise – is the creative contribution of the shipowner, in the traditional scheme, or the shipping company, in today’s corporate system.
One of the world’s pioneering maritime economists and joint winner of the first Onassis prize for shipping, the late Richard Goss, pointed out that despite its obvious importance for shipping, ‘enterprise is not easily measured or discussed by economists; it has no clear unit and cannot appear on the graphs they love’. 5 Even today, the fact that maritime entrepreneurship is difficult to quantify and measure, means that it is often overlooked in formal models. 6
The relatively simple production function framework captures the core of the business of shipping. Moreover, it allows us to split the production of shipping services into smaller pieces. This simplification enables us to discuss how the shipping business has developed historically, and to highlight the international dimension of the various elements.
The production of shipping services: A quantification
If we accept the proposition above, that the four relevant parameters in shipping are the market, the ship, the labour force and the shipowner, it will be illuminating to see how these four elements have developed across time – both in the short- and the long-term. We can start at the left side of the equation, and consider the amount of shipping services produced. In the long-term, there has been a tremendous growth in seaborne transports, as a result of population growth, income growth and trade growth. Shipping has been crucial in facilitating specialization and division of labour in the international economy.
The period from around 1960 to 2018 is no exception. 7 Two points are worth noting. First, there is no doubt that the main trend is strongly upwards, with a few setbacks, as seen in Figure 1. Seaborne trade (measured in tons) was around ten times larger in 2017 than it had been in 1962. Moreover, the few years where seaborne trade did not increase, are usually associated with short-term shocks – the OPEC oil crisis (1975), the Asian crisis (1998) and the financial crisis (2009).
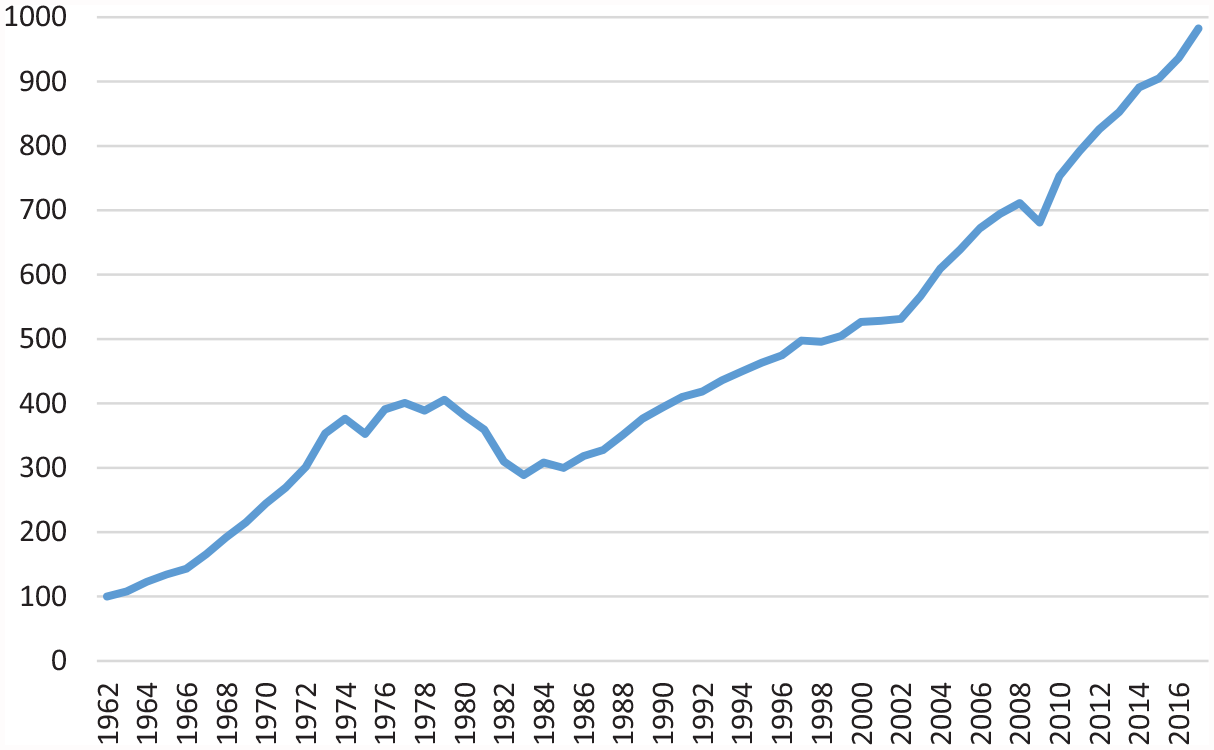
World seaborne trade 1960–2017, ton-miles (1960 = 100).
Behind the aggregate data, there have been substantial changes in the importance of the various shipping segments. Oil transport dominated the growth in the pre-1973 period, but became less important following the OPEC oil price increase. The stagnation in the second half of the 1970s and the decline in the early 1980s can be fully explained by crude oil movements. 8 Dry bulk transport fuelled the Chinese boom in the first years of the twenty-first century, while container transport has grown strongly, particularly in the last 20 years.
The importance of considering both volumes and distance can be seen from Figure 2, where the data have been decomposed, in order to show the relative contribution from these two factors. The figure shows that there are periods where the increases in average haul have added substantially to the volume growth (for instance, in the period after the closure of the Suez Canal in 1967). However, it is worth noting that while the volume growth is sustained (increasing in 85 per cent of all years 1962–2017), variations in average distance has a negative effect almost as often as it has a positive effect.
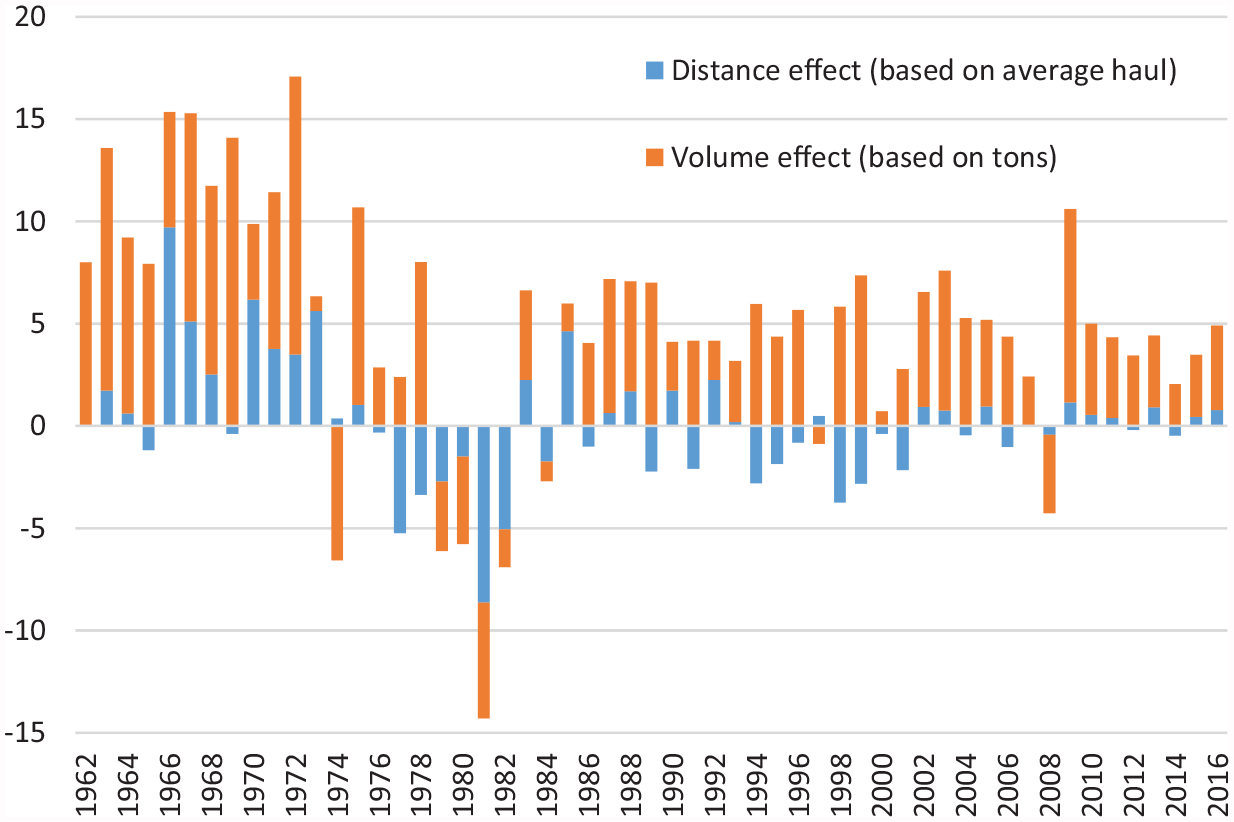
The basis for annual seaborne trade changes, volume and distance, per cent, 1962–2016.
One flaw in the figures above, a perennial problem in connection with growth accounting, is the fact that the data are unable to pick up improvements in the quality of the service. Better ships and improved cargo-handling and stowage have ensured faster and more reliable services, reduced damage to cargoes, etc. Ship losses and oil spills are far less common than before. Consequently, the fact that the data show only the quantity of shipping services produced, implies that it is likely to be a ‘lower boundary’ measure of the production growth.
Capital, labour and enterprise: Ships, seafarers and shipowners
Moving to the right-hand side of the equation, it is difficult to disentangle the relative contributions of the three factors – the ship, the seafarer and the shipowner (in his or her position as responsible for technological and organizational innovations). The manner in which we specify the model – what we decide to measure – plays an important role for the relative importance of the various factors. 9
The Greek letters in the model, α and β, suggest that it is possible to substitute labour and capital. In shipping, this type of substitution has undoubtedly been seen, for instance, in connection with vessels utilising economies of scale and relying on automated engine rooms, rather than labour-intensive sail rigs or stoker-dependent boilers. The replacement has largely gone one way – more capital at the expense of labour.
A simple thought experiment can illustrate the enormous technological improvement in shipping, in particular the role of economies of scale. At the start of the twentieth century, world seaborne trade amounted to around 170 million tons. 10 Given that we use the largest ships that operate today, what would it take to move this cargo?
With five roundtrips per year, the massive ore carriers in the Valemax-fleet would each carry one million tons annually. 11 This would imply that 170 ships would be needed. Each ship has a crew of 33. In other words, with the current technology, around 170 ships and less than 600 sailors would be needed to transport all the world’s trade in 1900. 12
A dominant feature of the development of shipping markets in the twentieth century has been the strong growth of demand – with a concomitant increase in the world fleet. Figure 3 presents aggregate data for the world fleet in the period 1904–2018. While there are various ways to measure this – utilizing different cut off points for vessel size, tonnage measures and sources – the data suggest that the world fleet multiplied by a factor of almost four in the first half of the period, from 1904 to 1961, then multiplied again by a factor of almost 10 from 1961 to 2018.
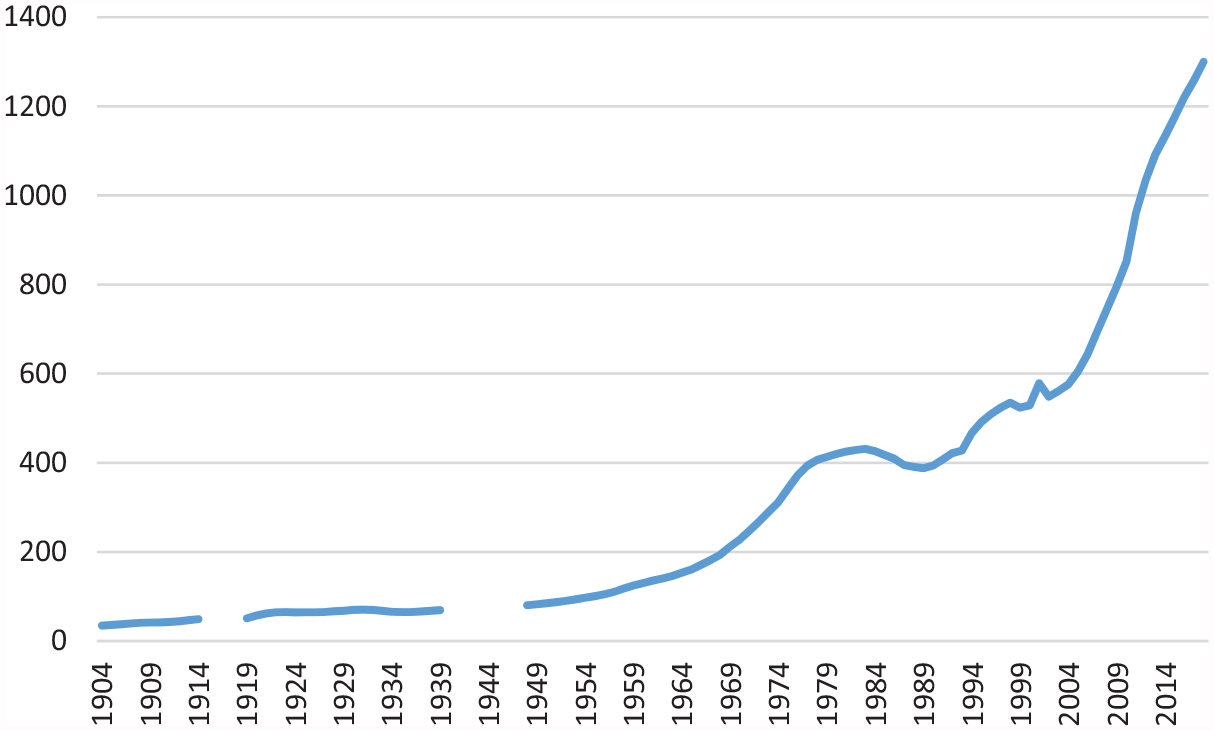
World fleet, 1904–2018, million gross register tons/gross tons.
In addition to the growth, the world fleet has seen substantial differentiation. At the start of the century, the major distinctions between ships were propulsion (sail versus steam), building material (wood versus steel), vessel size and the manner in which the ships were operated (liner versus tramp). With regard to the type of cargoes to which the ship was suited, there was very little distinction. 13 However, one of the defining features of the development of the world fleet, particularly in the post-1945 period, has been the substantial specialization of the ships.
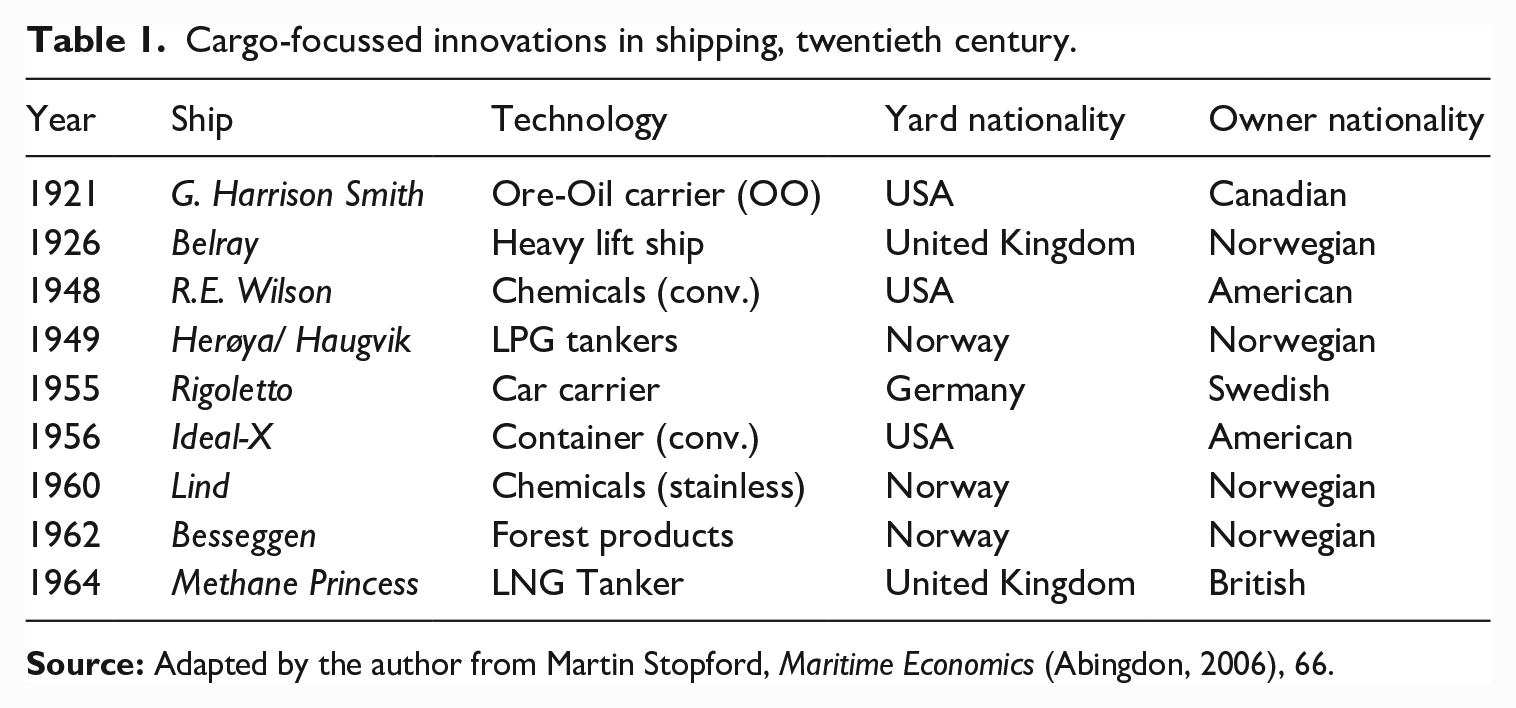
Table 1 presents some of the revolutionary improvements in cargo storage and handling – the cases where technological innovation has led to the development of completely new markets or dramatic efficiency improvements in existing markets. 14 The question of ‘pioneering’ technology is difficult, and necessitates some discretionary decision making; the list could be based on the first application of technology (including converted tonnage), the first purpose-built new building, the first commercially successful ship or the first ship operating in an international market. There are very few instances where the four criteria would apply to the same vessel. Consequently, Table 1 should not be seen as a definite list, but rather an indicative starting point.
Cargo-focussed innovations in shipping, twentieth century.
The gradual specialization of the tonnage has been one of the most important developments, and one that is not evident from the aggregate figures. The main trend has been that the flexible general cargo carriers – able to transport most types of cargoes, but really not well-suited to any – have become less important. At the same time, ships that have much less flexibility have given a strong reduction in the unit transport cost of other cargoes.
Figure 4 illustrates the dramatic changes in the composition of the fleet over the last twenty years. In addition to the general cargo carriers, reefers (vessels with refrigeration facilities) have increasingly been squeezed out. In both instances, the main driver has been the container vessels, where the combination of standardization and economies of scale has given extreme productivity improvements.
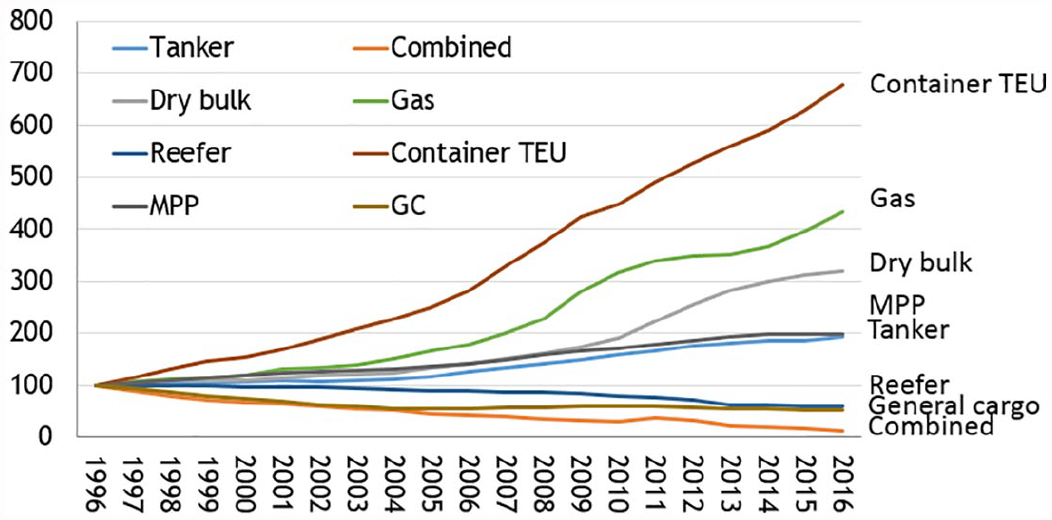
Development of ship segments, 1996-2017 (1996 = 100).
While we have quite detailed data on the world fleet, there are no similar statistics on the number, nationality and skills of seafarers. 15 Such datasets are neither as easily accessible nor as precise. However, as suggested above, the development has by no means matched the fleet growth. With the demise of the sailing ships and coal hungry steam vessels, a lot of jobs that were necessary to move the ship disappeared. Subsequently, vessel automation and the utilisation of economies of scale have been important. For instance, from 1990 to 2015 the deadweight tonnage of the world fleet increased by almost 200 per cent, while the growth in the number of seafarers was around 33 per cent, according to the most reliable survey. 16
It is evident from the figures above that labour has to a large extent been replaced by capital, and the trend seems to continue. Ghost ships that sail without a crew are no longer only the stuff of legend – they are becoming a reality. In 2020, the autonomous vessel Yara Birkeland will commence operation in the Oslofjord region of Norway. The 3,150 deadweight ton ship, carrying 120 containers, will sail with two people onboard – in quite difficult coastal waters and with frequent port calls. However, the only reason that the ship is manned at all, is the fact that ‘the world is not ready for unmanned tonnage’. The technology to remotely control the ship is already in place.
So far, we have mainly looked at the two quantifiable factors of production – capital and labour. But how do we account for maritime entrepreneurship? The shipowner drives the shipping industry forward. In previous periods, the focus would often be just that: the owner of the ship. However, in more recent periods, we have to think of this element, not as a person, but as an institution. Companies that, based on market knowledge and creativity, improve the provision of shipping services by means of new technological and organizational innovations. Such innovations might often involve a plethora of interests – shipyards, customers, naval engineers, classification societies and regulatory authorities. The important bit, however, is the end result, the improvements in the manner in which shipping services, seaborne transport from A to B, are produced.
While maritime entrepreneurship, as Goss pointed out, is difficult to quantify, we can see clear traces of it in the data. One example is the new ship types, both their introduction, as seen in Table 1, and their growth, as illustrated in Figure 4. These would not have been introduced without shipowners’ market knowledge, inventiveness and willingness to take risk. Technological innovations have been supplemented by organizational innovations – new ways to obtain and utilize the factors of production. And it is particularly within this element, that we see the increasingly important role of international markets in the demand for and provision of shipping services.
The international dimensions
With regard to all the elements in the model above – Y, K, L and A – there is an important international aspect, and one that has become more important across time.
Since the British repeal of the Navigation Acts in the middle of the nineteenth century, the shipping market – the demand side, which is not explicitly modelled here – can be considered ‘international’. While there are still some restrictions on nationality, in particular in coastal trade, the majority of shipping takes place in a setting where the various factors are nation-less. It is not only shipping demand that is global in scope, the capital, the labour and the enterprise all have a global character.
Shipping companies acquire their ships in an international market – around 90 per cent of the world fleet is built in three countries, South Korea, China and Japan. Consequently, for shipowners of all nationalities, Asian yards will most likely supply the tonnage. Moreover, the ships are likely to be financed in the international market – particularly with regard to mortgages, but increasingly also with regard to equity. Most dimensions of the K are thus truly international.
In historical terms, the international market for ships started to grow rapidly in the second half of the nineteenth century, when market growth and technology differences between countries encouraged trade, both in new vessels and in second-hand tonnage. International mortgage financing – sometimes arranged by the yard and subsidized by the authorities in the country building the ship – emerged on a large scale in the interwar period, and grew in importance after the Second World War. With regard to equity, national restrictions that limited foreign ownership were in place well into the 1980s in many of the leading shipping nations. However, in tandem with the general liberalization of capital markets, such barriers to cross-country investments have gradually disappeared. Moreover, for many of the companies an ‘efficient’ ownership model involves use of foreign subsidiaries, often in tax havens.
The labour element has also been characterized by liberalization, particularly in the second half of the twentieth century. While there has been an international market for seafarers for a long time, national regulations restricted the use of foreign seafarers in most of the leading fleets. In the second half of the twentieth century, two trends worked together to create a truly global market for seafarers. The first was the growing use of ‘flags of convenience’ – states such as Liberia, Panama and Bermuda, which had no restrictions on the nationalities of the seafarers. The second development was the increasing number of second registers – so-called ‘international registers’ in, for instance, Norway, Denmark and Germany – where old regulations were lifted for ships operating in the international market.
While maritime entrepreneurship is difficult to quantify, it is relatively easy to identify its international dimension. The shipowners’ ability to combine customers and factors of production from different countries has been a key element in the search for lower costs and efficient business models. The manner in which Norwegian shipping companies pioneered tanker transports on behalf of the oil companies in the interwar period is one example. The manner in which Greek shipping mavericks utilized flags of convenience and foreign yard financing after the Second World War is another.
The international dimension of maritime history
The maritime industries are to a large extent global industries, and most maritime history should therefore explicitly take into account the international dimension. Moreover, as Figure 5 suggests, by using the simple scheme of the shipping business, as one example of maritime history, it is possible to identify neighbouring fields of the history discipline where the maritime dimension might be extremely useful.
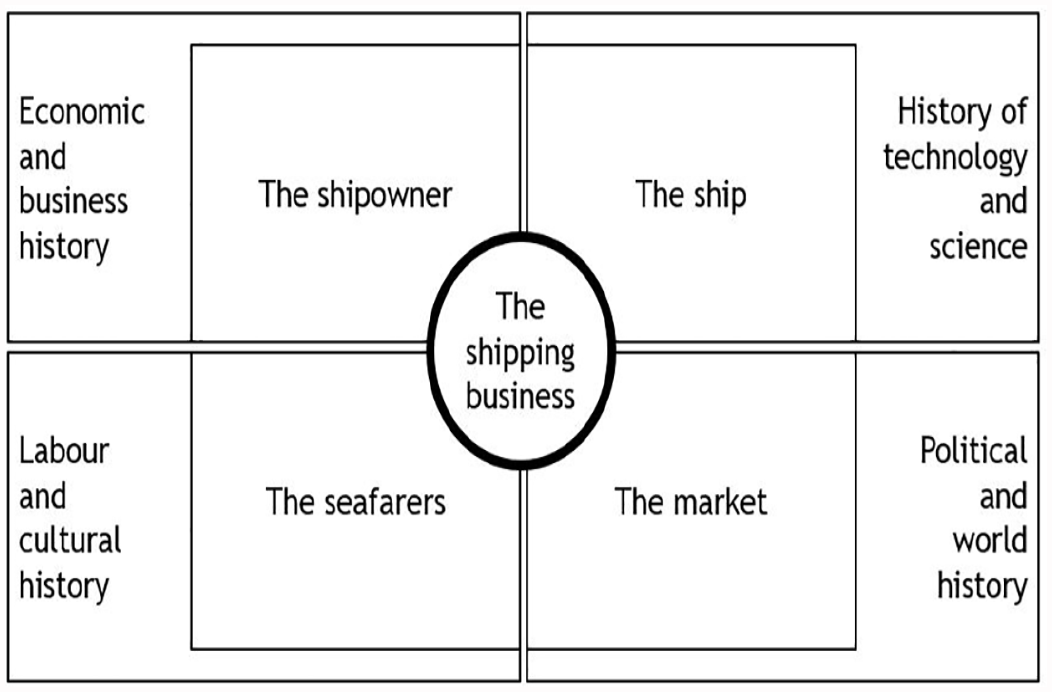
An overview of the shipping business and its links to other fields within history.
I will not discuss the possibilities that Figure 5 offer in detail, but provide only one example, based on the upper left quadrant: information on the shipowner/shipping company and the manner in which business is conducted, is a great starting point for research within economic and business history. Questions about strategies, risk and governance could be answered from a maritime history point of view. With the distances involved in shipping, the manner in which principal/agent problems have been solved is of great importance. Given that shipowning – in one way or another – is a practically universal industry, the scope for comparative studies is substantial.
As international cooperation and cross-border projects are increasingly encouraged, maritime history is well-positioned to play an important part due to its inherently international character. Figure 5 illustrates how it is possible to identify potential avenues of research by utilizing a very basic look at the subject, in this case the shipping business. Such an approach would be relevant for other areas within maritime history – fisheries history, naval history, shipbuilding history, and so on. Sometimes a simple – even simplistic – methodology can take you quite far.
For more than 200 years, the maritime industries have constantly crossed borders. As a result, so should maritime historians.