






Abstract
Background
Nurse researchers from six participating countries (Great Britain, Australia, New Zealand, USA, Finland and Denmark) collaborated on an international menopause study on nurses.
Purpose
To demonstrate an iterative two stage thematic analysis within a qualitative paradigm as it applied to an international menopause study.
Methods
Using an exploratory approach, the Framework Method and Braun and Clarke's thematic analysis were applied to data from 48 participants.
Results
The Framework method provided an organising structure capturing large amounts of narrative data into a structured matrix. Following detailing of the larger data set into abstracted categories, Braun & Clarke's thematic analysis method enabled researchers to abstract themes into specific narratives reflective of participants voices.
Conclusion
The iterative thematic analysis approach enabled nurse researchers to effectively collaborate across different countries, different time-zones and different cultures to synthesise a large body of qualitative data in a systematic, structured approach. This research demonstrates an iterative systematic methodological approach that can be used by nurse researchers analysing data manually where other programmes are not available.
Introduction
Nurse researchers from six countries (UK, Australia, Finland, New Zealand, USA and Denmark) collaborated to gain insight into the potential for developing a digital intervention application for nurses in the workforce experiencing menopause. Using qualitative explorative methodology, this article discusses methods that were undertaken to ensure the data gathered and analysed was seamless, robust and transparent. A two-step iterative process using the Framework Method to classify data into coherent first level categories and Braun and Clark's thematic analysis was applied to gain deeper understanding of the narrative through analysis using abstracted themes. Collaborating across six different countries with different time-zones, languages and cultures requires insight, collegiality and a structured process. This article provides a worked example for future research collaboratives using qualitative analysis and manual data collection.
Background
Researchers shared an interest in women's health issues and were specifically interested in menopause and women's narratives and potential links to digital health. The agreed approach was focus groups using a semi-structured questionnaire for collecting data on the topic of menopause. However, the Covid pandemic impacted resulting in both face to face, virtual focus groups and interviews used to collect data. The same semi-structured questions were used to ensure consistency in data collection with an interview schedule used to guide focus groups and/or interviews. Data gathering took place over a two-year period due to the Covid pandemic. The UK collected the first set of data in February 2020 with the USA collecting the final set of data in early 2022. During the data gathering phase, a structured matrix was developed using Framework methodology.
Spencer et al. (2003) developed the Framework Method in the late 1980s to assist with analysing large scale policy research (Spencer et al., 2014). Gale et al. (2013) utilised the method to analyse data across multi-disciplinary health research and provided a step-by-step process to ensure rigour and consistency was adhered to in application. Goldsmith defined the framework method as a way “to identify, describe and interpret key patterns within and across cases of, and themes within the phenomenon of interest through being grounded in, and interpreting from the data” (2021, p. 2016).
One key aspect of using the framework method is the ability to lend itself to applied research questions in primary qualitative research (Dixon-Woods, 2011; Kiernan & Hill, 2018; Pattison et al., 2021). The research question had an applied aspect to find out about interventions for menopause and was viewed by researchers as an appropriate tool for this research (Parkinson et al., 2016). With both context and strategy in mind the framework grid was set under the umbrella of analysing data through an applied lens.
Analysing the data across six countries, at different timeframes into a central repository, the framework matrix provided a coherent structure that enabled researchers to easily locate data through broad identifiers. The second phase of the analysis then utilised Braun and Clark's thematic analysis methods to draw on deeper narratives using a reflexive approach. In this phase participants voices were coded according to similar and different themes found within the framework categories.
Purpose
This research aimed to demonstrate international collaborative use of an iterative two stage thematic analysis within an exploratory qualitative paradigm as it applied to an international menopause research study. This research looks at the methodology used and the benefits and limitations of using such methods in a comparative country study.
Research Methodology
Using a qualitative exploratory design with two distinct thematic lenses; the Framework Method and thematic analysis were applied to the international menopause study data. The framework method was best suited to reviewing data derived from individual interviews, focus groups, observational data and case studies (Gale et al., 2013; Goldsmith, 2021). Creating a matrix grid, built in excel, researchers designed a broad set of coded categories that were data driven based on commonalities and differences in the data (Frazer et al., 2022; Gale et al., 2013; Goldsmith, 2021). These coded categories were organised into key categories with sub-categories agreed amongst researchers as the most suitable phenomena being researched. Matrix grid categories were structured to synthesise with the semi-structured interview questions. The framework method can be used inductively and deductively in analysing data (Jackson, 2022). The researchers in this project used the framework method inductively to analyse categories from the transcribed datasets.
Interview narratives were captured into the matrix grid as a coherent set of data categories and were then analysed using Braun and Clarke's (2021b) thematic analysis reflexive method. Using thematic analysis allowed for flexibility and closer reading of data narratives which enabled researchers to draw themes from narratives reflected in participant's voices. Benefits of using thematic analysis lie not only in being able to let data drive the abstraction of themes but also provides a methodology in how to analyse lived experiences of the participants and their views (Braun & Clarke, 2006, 2020b). This two-step analysis process of using a framework matrix and then applying Braun and Clark's method enabled both a pragmatic application of dealing with a large body of data and a deeper and more critical interrogation of that data.
Methods
Data Collection
Nurse researchers from Great Britain, Australia, New Zealand, USA, Finland and Denmark, collaborated to gather data for the international menopause study. Data was collected from nurse participants through a mix of face to face and zoom focus groups and interviews using a semi-structured qualitative interview schedule. The COREQ 32 item checklist was applied to the qualitative research process (Tong et al., 2007). Participants were eligible if they identified as female, registered nurses and were between the age of 45 and 65. United Kingdom collected data from 11 participants, Finland had six participants, Australia had eight participants, New Zealand had nine participants, Denmark had six participants, and the USA had eight participants Refer Table 1. Participants.
Participants
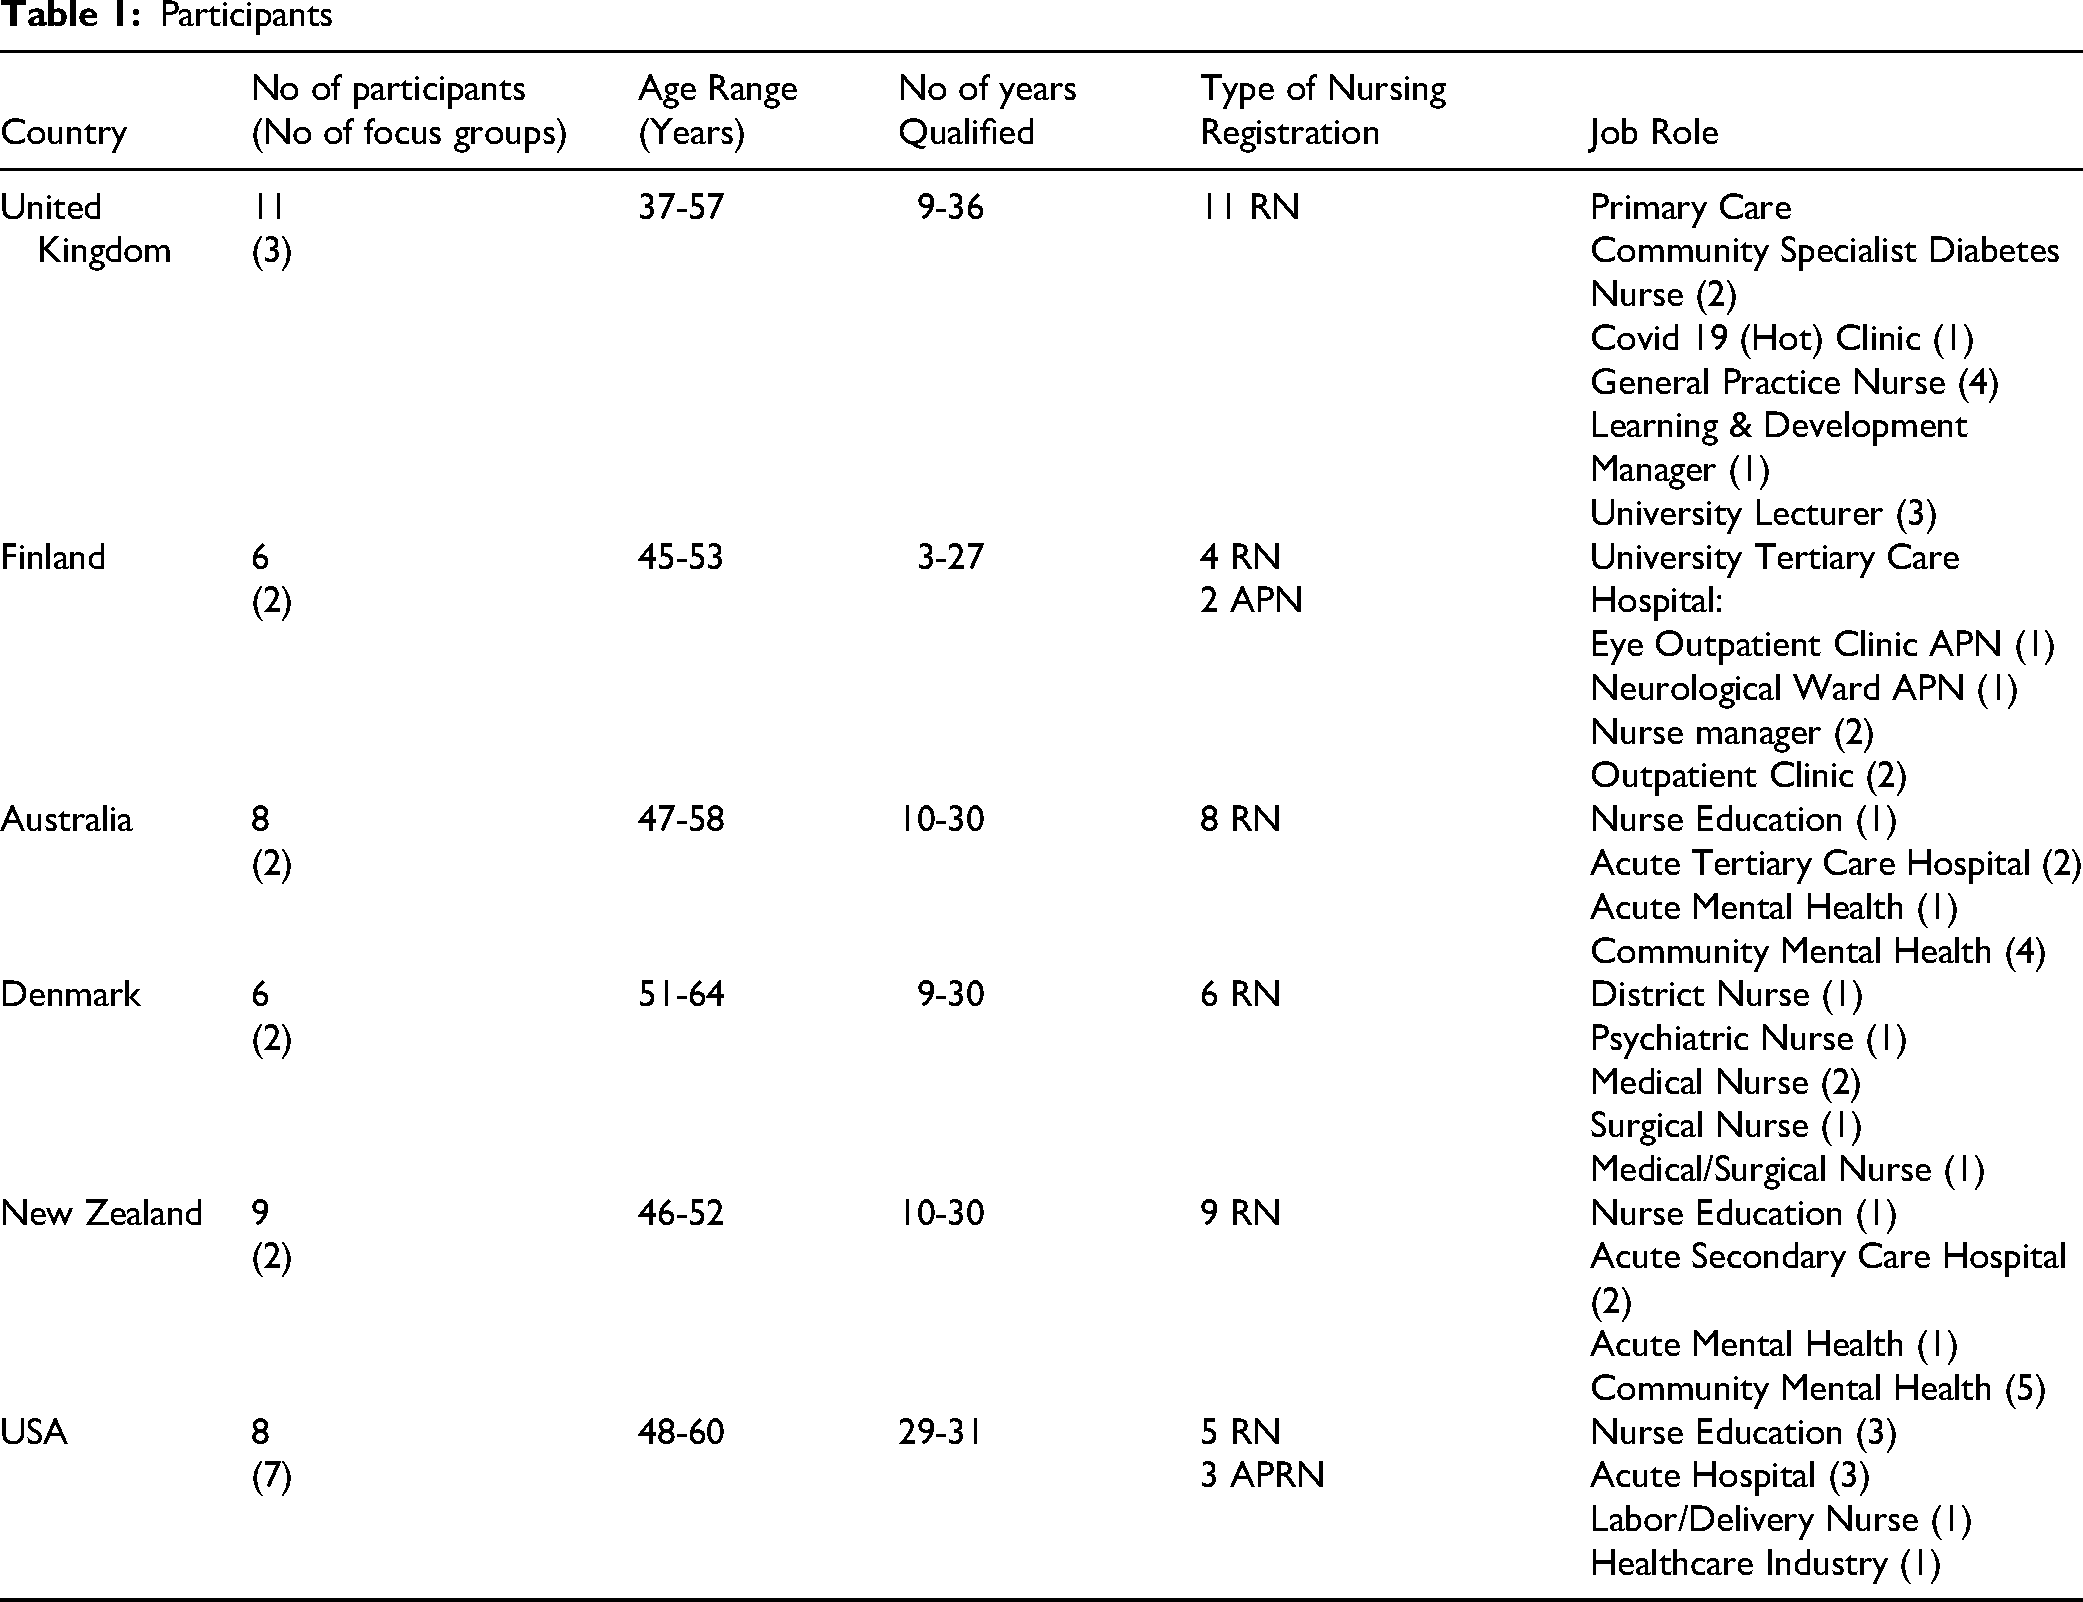
Data collection started February 2020 with the final data collected in late December 2021. Data was collected through zoom interviews and meetings and face to face, where permitted within pandemic regulations. Following collection, data was inputted into the framework at the following times refer Figure 1.
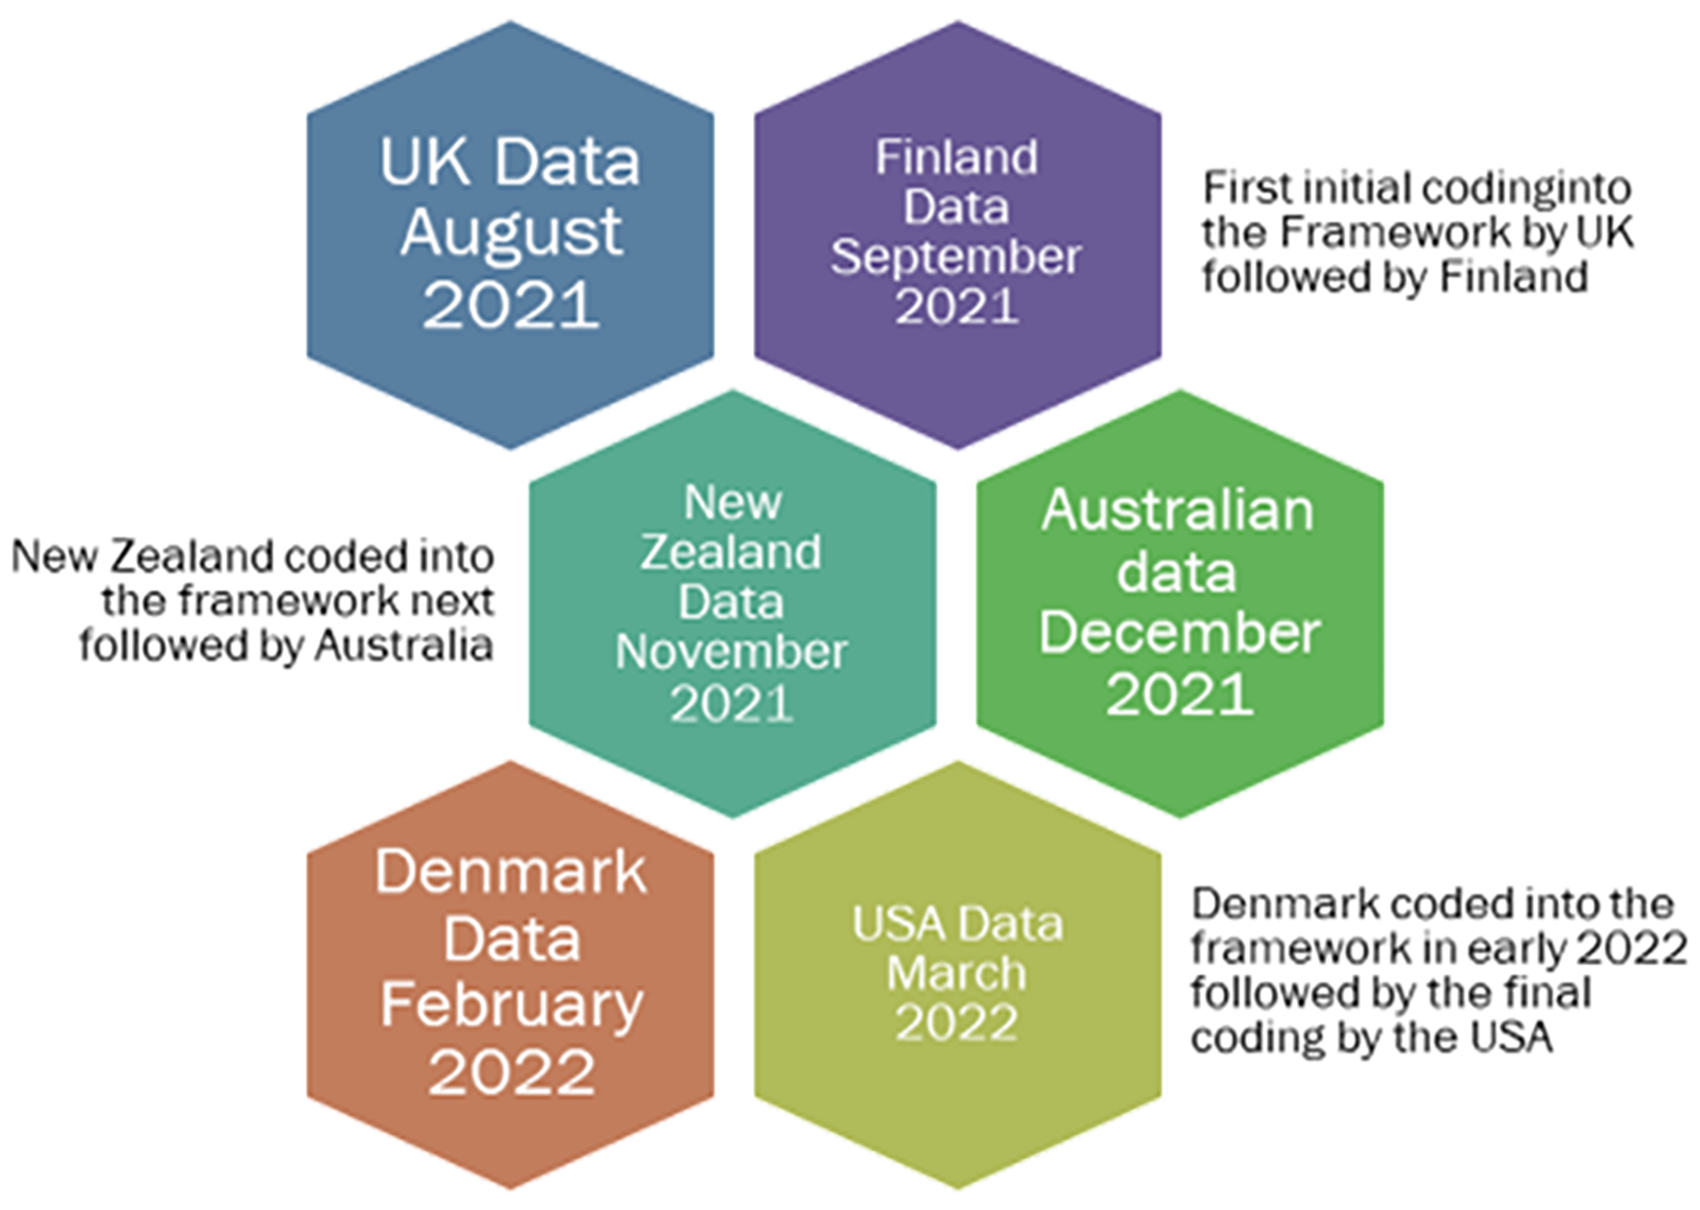
IMS data input timeframe.
Interview and focus group material was transcribed by nurse researchers, with translational work undertaken by Finnish and Danish researchers to ensure language translations reflected the true meaning of participants’ voices. Each month the international group met through zoom monthly meetings and discussed data sets, with participating countries identifying where they were with focus group data collection. Alongside monthly meetings initial data analysis groups were set up with paired researchers from two countries to discuss data for each of the respective countries.
The UK university as the principal lead site, set up BOX as a repository for storing and sharing files that was secure and only accessible by the research group and enabled live working. Two main barriers occurred because of the Covid pandemic during the data collection period where undertaking focus groups and interviews face to face was limited. Social distancing restrictions where initially planned face to face discussions with participants became online virtual discussions. Registered nurse availability to attend focus groups was not optimal, this was due to Covid related sick leave, and increased workload pressure on well nursing staff.
Ethical Considerations
Ethical approval was granted from the relevant University Institutional Review Board, UK, principal research site (REF: ETH1920-0103), with reciprocal ethical permissions obtained from each country. All participants provided written informed consent. This study was conducted in accordance with the Declaration of Helsinki and follows the International Committee of Medical Journal Editors (ICMJE) recommendations for the Conduct, Reporting, Editing, and Publication of Scholarly Work in Medical Journals.
Data Analysis
Discussion on the way data was collated was agreed at the monthly meeting using the Framework Method to collate and organise data from the participants transcripts as a way of organising a large amount of data and then using thematic analysis to further analyse the data into abstracted themes.
The Framework Method
The following five steps are critical to using framework method to ensure systematic rigour which include familiarisation, indexing, charting, mapping and finally synthesis of the data (Frazer et al., 2022; Gale et al., 2013; Goldsmith et al., (2021). Prior to the familiarisation process, data is transcribed word for word from the audiotapes of focus groups and interviews (Brooke et al., 2019). Step one data familiarisation involves the researchers immersing themselves in the data and becoming familiar with the data requiring multiple readings of the data (Furber, 2010). To establish an initial framework matrix, questions from the semi-structured questionnaire were used to guide development of the matrix. The initial dataset collected was the UK focus group data using two participant focus groups. Based on the questions and the responses from the UK dataset an initial draft set of categories was established. The interview questions covered five key areas (1) understanding and perceptions of menopause (2) symptom recognition (3) managing menopause (4) interventions for menopause and (5) potential digital interventions.
This initial framework was distributed around the group to discuss and agree or disagree with the categories. Agreement prevailed as the categories aligned to the semi-structured interview questions. The framework matrix was accepted as the tool to collate and organise the participant focus group data. As each countries’ dataset was collected the researcher from each country worked with the UK researchers to add in the new data. Researchers worked collaboratively together as each dataset was entered and discussed any new organising categories and sub-categories.
Following on from the initial categorisation of the interview questions and first dataset, four initial codes were indexed into the framework matrix cells: (1) Managing symptoms in the workplace (2) Recognition of menopause in the workplace (3) Menopause Interventions and (4) Expectation versus reality. The section on interventions for menopause and digital interventions were combined initially into one matrix cell with sub-categories under this index code. It should be noted that using these four index codes did not preclude any further indexing but formed the initial coding to organise data.
Charting of the data provided deeper familiarisation with the datasets and enabled the researchers to sort data and create subcategories. The four different categories as outlined above were coded into colours: (1) Managing symptoms in the workplace was coded green (2) Recognition in the workplace was coded blue (3) Menopause interventions were coded yellow and (4) Expectations versus reality were coded purple. The sub-categories were coded in the category colour and then charted into the framework matrix under the primary category. The following sub-categories were created from the participant focus group data transcriptions:
Managing symptoms in the workplace – embarrassment, guilt, management and treatment of menopause symptoms, emotional stress and physical symptoms. Recognition in the workplace – impact on performance, coping strategies, lack of understanding (management) and poor management of symptoms. Menopause Interventions – layered approach required using apps/ zoom link and in person, access to therapies and interventions in the workplace, resources for everyone in the workplace, exercise and diet, mindfulness and relaxation techniques and peer support. Expectations versus reality – the lived experience of menopause, the lack of communication and preparedness women felt, the lack of insight or understanding of menopause by both health professionals and their peers in the workplace and maternal experiences versus the expectations woman had of menopause.
Through the data familiarisation transcript, data was indexed according to the initial key categories, and charting enabled a transparent comparative analysis to look for similarities and differences in the data. Where narrative examples differed, sub-categories were established. The framework matrix evolved as additional data became evident with each country completing their focus group data collection. The reading and re-reading of the transcripts enabled quotes from the text to be highlighted in the colour coding of the identified category and sub-category.
The benefits of charting enabled researchers to check where data was replicated and where it looked different. This enabled any differences to be identified from the different countries, including different cultural nuances. As data was added to the framework matrix categories and sub-categories, changes occurred in the framework offering both similar and different responses and perspectives. An example of a sub-category change was seen in the category “Menopause interventions” where a sub-category of alternative therapies was created. Whilst participants across all countries had mentioned diet, exercise and meditation, New Zealand and Danish participants provided narratives on yoga and alternative health remedies as useful interventions. Another example of a sub-category change was in the primary category “Recognition of menopause (in the workplace)” where initial datasets only recorded narratives on lack of understanding (by management), these became broader to include a lack of recognition not only by management but also by colleagues and peers.
The replication of narratives across the six countries in four primary categories in the framework not only provided transferability but a base to engage with the second step of translating the narratives into unifying themes (Sandelowski & Leeman, 2012). The inclusion of sub-categories through indexing, and then charting confirmed the replication of data or enabled new cells to be created to account for different narratives in the participant's voices. The inclusion of new sub-category cells enabled the data to remain in context within the overall dataset. Throughout the process, colour coding was used to identify comments from different countries as well as establish a main set of colours for each primary category.
For step four - mapping, researchers read transcripts and mapped the narrative quotes under assigned categories and subcategories using a combination of relevant quotes from participants and field notes from original transcripts, highlighting quotes in set coded colours to each narrative. See Table 2, for an example of the mapping process.
Mapping quotes to primary categories
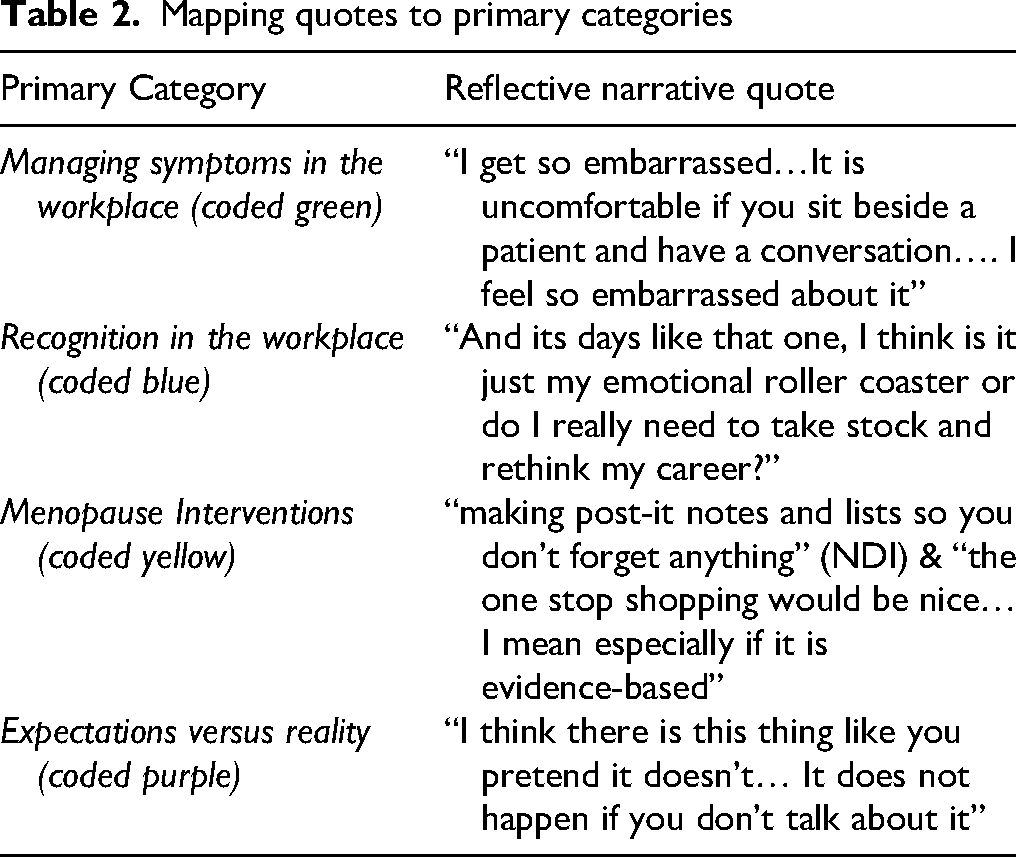
In green coding “Managing symptoms in the workplace” the quote encompassing how the participant felt when having a hot flush and the embarrassment she felt when working with patients was coded to managing symptoms under the sub-category “emotional distress”. The blue coded “recognition in the workplace” demonstrates a participant's feelings about how her day wasn’t going so well and how this impacted her performance and made her question her choice of career. The quote was mapped under the sub-category “impact on performance”. Two sub-categories were strongly indicated in the “menopause interventions” primary category for “non-digital interventions” and “digital interventions” with the first part of the quote related to the non-digital intervention and the second part of the quote referring to having a digital one stop shop application available. In the fourth primary category “Expectations versus Reality”, the narrative focussed on the feeling of lack of preparedness and the lack of information women had where their expectations differed from the reality of what was happening or had happened during the menopause phase.
In the final stage, synthesising the data, researchers from two countries were paired to review in depth content on different primary data categories. The UK researchers paired with the Finnish researcher to review managing symptoms in the workplace, the UK researchers also worked with the Danish researcher to review recognition of menopause in the workplace. The researcher from the US paired with the Australian researcher to review the data on menopause interventions and the Australian and New Zealand researchers paired to review the category on expectations versus reality of menopause.
These reviews enabled the researchers to synthesise findings and remove any duplication of data in other categories. The original categories were isolated and transposed into individual word documents. To remain true to participants narratives, significant quotes were highlighted in the category colour in the word documents, as narrative themes to prepare for final analysis of the data using thematic analysis.
Braun & Clarke's Thematic Analysis
Thematic analysis allows for identification, analysis and reporting of patterns within the data (Braun & Clarke, 2006) and offers different types of conceptual tools to analyse data qualitatively highlighting coding reliability, codebook and reflexive types of analysis (Braun & Clarke, 2021a). As part of the decision-making process when reading data, the researchers all acknowledged that they were women who were nurses and had insight and experience of the phenomenon of menopause being studied. Reading and rereading the categorised data with highlighted quotes, the individualised word documents under the broader classifications were scrutinised for themes using a reflexive approach. This ongoing reflexive discussion of the data was key to the global group analysis and being fully immersed in the data.
In the analysis of the international data, researchers continued highlighting using colour coding classifications embedded in the Framework method. Researchers looked for key narratives using participants voices so they could move from synthesising data to analysing reflexively on what was underpinning the narrative. Researchers inductively analysed data for patterns of shared meaning (Braun & Clarke, 2020a,b). From the four initial categories – Managing symptoms in the workplace; Recognition [of menopause] in the workplace; Interventions for living with menopause and Expectation versus Reality, 14 themes were created by researchers based on six recursive phases of familiarisation, coding, generating initial themes, reviewing and developing themes, refining, defining and naming themes and then writing up (Braun & Clarke, 2020a,b).
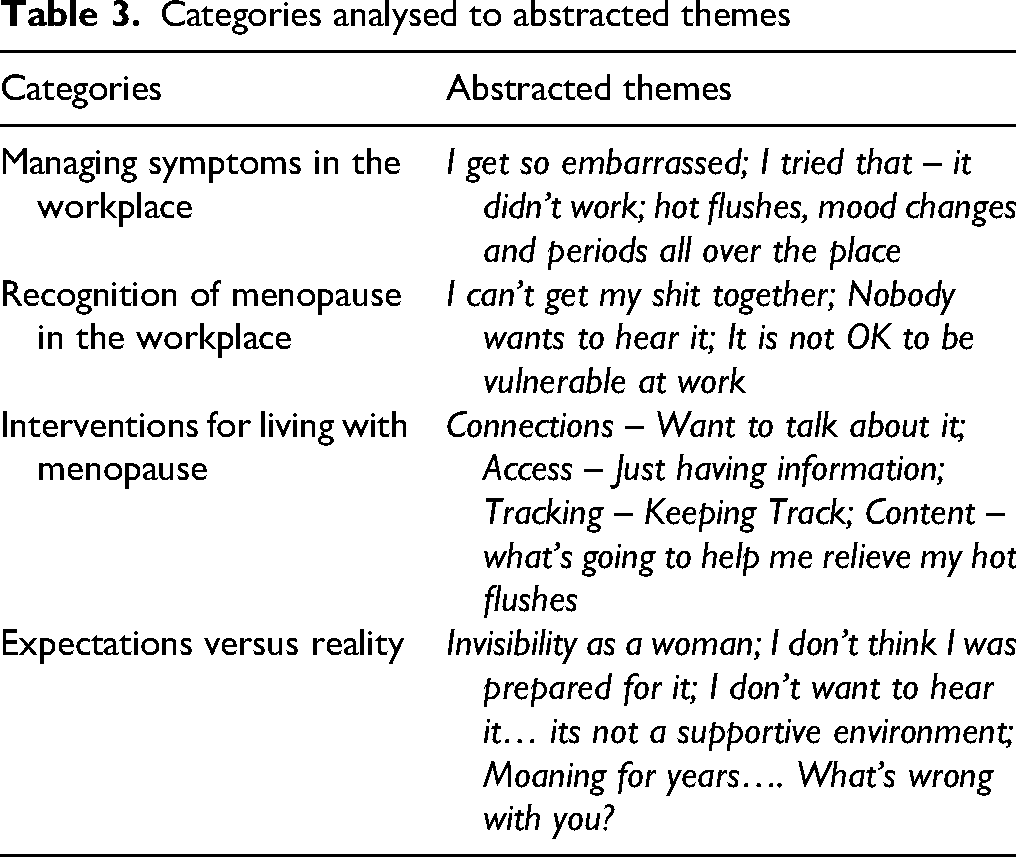
Shared meaning within the transcripts were often derived from the text where women used metaphors to express their experiences (Refer Table 3). Examples ranged from feeling like they were a “Belisha Beacon” when discussing the embarrassment, they felt when they had a hot flush in managing symptoms in the workplace – sub theme “I get so Embarrassed”, to being on a “emotional roller coaster” when discussing recognition of menopause in the workplace in the theme “I can’t get my shit together”. In Interventions for living with menopause the theme Just having information arose out of the comment “I always have my phone with me” followed by Expectations versus Reality where women reflected on their experiences alongside what they had grown up with and a common comment was “moaning for years…. What's wrong with you” (Cronin et al., 2023).
Categories analysed to abstracted themes
Rigour, Transparency & Process
The benefit of using the framework method was the ability to work through a series of systematic steps that provided an explicit audit trail. Following each step as outlined in the method, the refinement of the data into coded categories with multiple researchers from the group reviewing the different categories enabled both transparency and rigour in how data is agreed and transposed into the matrix grid. As noted above cross checking and reviewing of data using paired researchers from different countries assisted with maintaining integrity of participants voices. Using this reflexive approach enabled further interrogation of data to find the underlying narratives of the women. Re-reading and re-reading data in pairs, highlighting in colour significant quotes, and looking for repetition in the framework categories ensured that analysis of the research was transparent and followed a rigorous process.
Findings & Discussion
Using the Framework method provided an initial structure to capture large amounts of narrative data into a structured grid or matrix. This enabled cross sectional analysis using data description and abstraction of data. Benefits of using the Framework method enabled researchers to use thematic analysis as an overarching qualitative design for analysing data that was constructionist in design and enabled an inductive approach to the analysis.
The unique approach of using the grid enabled focus group data to be matched to different categories on different lines ensuring a transparent and clear process (Frazer et al., 2022) which enabled the researchers to quickly recognise patterns in the grid. This approach was best suited to the research question in looking at women experiencing menopause and wanting to find out their lived experiences and perceptions but also looking forward in what they might see as a useful tool in the form of a digital intervention. The framework matrix enabled data to be organised and coded in broad categories that were synthesised to survey questions. Data was to be structured in a semantic approach following the familiarisation of data across the different countries and identifying four key categories that initially appeared in the framework, that were then added to as other country data was included. The steps for drilling down into the data to ensure that it was not inconsistent with the categories or required another category occurred with indexing, charting and mapping (Clarissa et al., 2021; Gale et al., 2013). The final stage of synthesising, data was then analysed using reflexive thematic analysis approach to find deeper meaning (Braun & Clarke, 2021b). Using this approach within designated categories meant that the coding further evolved to capture deeper understanding of the data and reflected a redefining of the data through abstracted themes as outlined above in Table 2.
Criticism of the use of broader groups of thematic analysis methodology have been put forward as a method that has not always provided clarity around analysing the data and having an “opaqueness” or lack of transparency (Ward et al., 2013, p. 2424). The five-step method used in the Framework method and the six-step method used in reflexive thematic analysis provide a very clear and transparent process for how the research team collaborated to collate, organise and analyse and interpret data collected in this study. Agreement and adherence of the research team to the structured methodological approach provided rigour through transparency throughout the process. Using this iterative two stage process to gain insight into women's needs around menopause the research team was now able to move to the next stage focussing on designing a digital application for menopause.
Limitations
Whilst there are many benefits to using NVivo including efficient use of time, transparency and the programmes’ ability to capture a large amount of qualitative data. There are also challenges to using such a programme, namely, the time required to learn how to use the application, expense due to lack of funding to support the application, and in some cases the data is not easily interpretable (Dollah et al., 2017, pp. 61–63). As researchers came from various backgrounds NVivo was not a useful tool as not all researchers had access to the software or had used it previously. In addition, the research was not funded by grants that enabled purchase of the software or training.
Conclusions
Using an iterative two-stage qualitative thematic analysis approach enabled nurse researchers to effectively collaborate across different countries, timezones and cultures to bring together a large body of qualitative data in a systematic structured approach that provided a robust and transparent audit trail. Utilising the framework method and grid approach was a pragmatic and useful way in which to collect a large body of data manually in addition to providing a transparent method in how the categories were classified. To interrogate the data further the use of Braun and Clarke's method enabled researchers to analyse data reflexively and true to participants voices, as well as providing a deeper analysis of data using abstracted themes. This clear and transparent process enabled a large body of qualitative data to be analysed across countries in a systematic and robust manner that was true to the research question.
Key Points for Policy, Practice and/or Research
This research demonstrates value in using multi-method qualitative frameworks for analysis in international studies.
Where computer generated programmes are not available for use with large datasets alternative manually structured methods are critical for enabling nurse researchers globally.
The use of the methodological tools in a clear and transparent manner ensured common understanding of what nurse researchers were trying to achieve across different countries with different cultures.
Footnotes
Acknowledgements
The authors wish to acknowledge the participants who gave their time freely and willingly in interviews and focus groups, without the participants support, this research would not have occurred.

Ethical Permissions
The University of Essex, UK principal research site (REF: ETH1920-0103) approved our research with reciprocal ethical permissions obtained from each country. All participants provided written informed consent before starting interviews. This study was conducted in accordance with the Declaration of Helsinki and follows the International Committee of Medical Journal Editors (ICMJE) recommendations for the Conduct, Reporting, Editing, and Publication of Scholarly Work in Medical Journals.
Funding
The authors received no financial support for the research, authorship, and/or publication of this article.
Declaration of Conflicting Interests
The authors declared no potential conflicts of interest with respect to the research, authorship, and/or publication of this article.