
Abstract
Purpose:
Quality improvement is vital to ensure health-care providers meet optimal patient care standards. Within our jurisdiction, accreditation requires image peer review as part of the quality assurance program. We propose a method to improve quality assurance in radiography by implementing a novel software-based peer review system for radiography technologists.
Methods:
This is a retrospective study. A peer review tool was developed in Microsoft Excel and Visual Basic. The tool has 14 image quality criteria, which were selected based on national and international criteria, each containing standardized answers ensuring a common scoring regime. The tool provides data analysis and storage of all peer reviews performed. Radiography supervisors utilized the tool to evaluate image quality of various body parts at 28 hospitals. The tool enabled each Medical Imaging Department to objectively score images at their own hospital. Approximately 2% of all radiographs were randomly chosen for peer review. Additionally, the tool allowed for regional analysis based on hospital, body part, and quality criterion.
Results:
Initial findings exposed equipment-related issues such as worn imaging plates, artifacts, and poor exposures, which prompted increased preventative maintenance. Other documented issues included foreign objects, inadequate collimation and centering, and inconsistent usage of lead markers. After identifying quality assurance-related issues, hospitals implemented education, resulting in improved overall image quality scores in subsequent audits.
Conclusion:
The peer review tool helped identify and correct various issues affecting image quality and ensures our program meets required accreditation standards. Furthermore, staff found utilizing the tool to identify areas for improvement improved collaboration, ongoing education, and support between staff.
Introduction
Since the start of the medical profession, a peer review system has existed in some form and is constantly evolving to provide optimal patient care. 1 The standard of the peer review system focused on quality of care until in 1999 when it was encouraged that health-care providers shift toward focusing on quality improvement. 2,3 In medical imaging, quality refers to the process of ensuring the final radiologist’s report is accurate based on the images provided. This process includes quality control (QC), which are technical checks to ensure consistent performance of medical imaging systems, and quality assurance (QA), which focuses on the overall product and includes peer review. Both QC and QA are required as part of an overall quality program. This fact is highlighted of the need for both as part of numerous accreditation requirements. 4 -10
Currently in our jurisdiction, image peer review is required for accreditation through the College of Physicians and Surgeons of British Columbia–Diagnostic Accreditation Program. 4 Prior to a software-based solution, peer review audits were performed manually on paper. This method was time-consuming, difficult to reproduce, and logistically difficult to execute. As a result, image peer review was not conducted regularly. This was confirmed by an internal audit performed (2013), which revealed radiography image review was at best performed by 5 of 28 hospitals at a monthly interval.
Without having sufficient data on image quality parameters, it was unbeknownst how a department as a whole was performing in terms of image quality. In addition, increased reliance on imaging departments and radiologists to provide timely examinations and reports, combined with population growth and the ability to transmit images to any department, has increased the number of digital radiographs produced and the pressure to produce them with high quality. The transition from analog to digital radiographic systems has allowed for numerous opportunities to enhance workflow in radiology for both radiologists and technologists. 11 -14 It has been well-documented in literature advocating the need for better image quality evaluation in digital radiography. 15 -17
A software-based tool was developed to address deficiencies with the paper-based method. This tool can produce real-time data, which identifies individual image quality metrics. By being able to objectively score each individual quality metric, the hypothesis is that this will better identify which element can be improved upon during the next auditing cycle, therefore slowly but consistently improving overall image quality.
This article highlights the development of a software tool to improve the image peer review process. The tool goes beyond simply meeting accreditation requirements by providing intrahospital data for comparison and ongoing education. By providing technologists feedback and education, our hope is that this will also create engagement and support between technologists contributing in our overall goal of producing better image quality. The aim of this study was to improve the QA of digital radiography and to investigate the effect on QC after implementation of the peer review tool.
Methodology
A peer review tool, which includes a graphical user interface, was developed in Microsoft Excel (Redmond, Washington) using the Visual Basic development tools (Figure 1). This project was internally funded by Lower Mainland Medical Imaging. Tool development and implementation took 6 months to complete. This included consultation by the regional lead radiography technologist (RLRT), medical physicist, department supervisors, and a radiologist. The RLRT initiated the application of the tool including training, hospital setup, and data storage of reviews at each site.
A peer review tool, which includes a graphical user interface, was developed in Microsoft Excel using the Visual Basic development tools. The tool allows reviewers to document examination-specific details, including hospital name, examination room, performing technologist(s), patient identifiers, examination date, and examination and views acquired. There are 14 image quality criteria that reviewers are able to assess. The drop-down menu for each parameter includes three answers: good, acceptable, and poor.
The tool allows reviewers to document examination-specific details, including hospital name, examination room, performing technologist(s), patient identifiers, examination date, and examination and views acquired. Image quality is assessed for each acquired view of an examination according to 14 criteria: hanging protocol, side marker visibility, technologist initials visibility, positional marker visibility, presence of foreign objects, presence of image artifacts, appropriate image exposure, presence of image burn [this is specific to computed radiology, CR exams], appropriate use of collimation, appropriate use of masking, proper centering, inclusion of the required structures, patient positioning, and whether the view should have been rejected and repeated. These criteria were selected in accordance with Canadian Association of Medical Radiation Technologists, American Society of Radiation Technologists, and British Columbia Institute of Technology guidelines. 18 -20
Each criterion has a standardized answer set (available via a drop-down menu), which facilitates a common scoring regime. The drop-down menu contains answers of good, acceptable, and poor. A scoring criterion was implemented to reduce reviewer subjectivity. Many criteria also have a free-text comment section which allows the reviewer to input more specific, non-standardized feedback, which provides context (e.g. why an image scored poorly, or why an image scored excellently, providing positive feedback) on the reviewer’s scoring. The comments are crucial since they provide a deeper understanding to the reviewers scores when providing technologists feedback.
The tool also provides peer review of examination-related documentation, including whether the patient requisition was properly documented, whether the correct patient was imaged, technologist’s notes were properly documented when required, patient lead protection was used and documented, and if pregnancy status and last menstrual period was determined and documented, when appropriate.
Finally, the tool facilitates storage and data analysis of all peer reviews performed. Outcomes of reviews can be analyzed and categorized based on specific hospitals or region-wide data, body part, examinations, and view. It also allows for the option for feedback anonymization once the data are analyzed.
The computer-based peer review tool was deployed throughout our region, along with an audit protocol specifying the body parts, examinations, and number of exams each site is required to review each month (Figure 2). Twelve commonly performed examinations were selected for mandatory review with the option, time permitting to review the other less commonly performed examinations. This tool can also be used to create run charts.
The semiannual review schedule listing body parts to review within the lower mainland medical imaging jurisdiction to fulfill the audit criteria that the BC College of Physicians and Surgeons and the Diagnostic Accreditation Program mandate.
Peer review is based on a semi-annual schedule whereby each month from January to June, a minimum of 10 randomly selected examinations from each body part assigned to that month are reviewed and this review scheme is then repeated from July to December. For example, 10 chest examinations and 10 portable chest examinations are reviewed in January and 6 months later in July. This offers a 6-month lead time for the site to correct any identified issues.
There is no standardized randomization method. The randomized strategy includes picking random examinations from different times of the day on across the different days of the month.
Participation in this program was voluntary. Each hospital elected a peer review auditor that is in charge of this entire process. The reason behind selecting the threshold of a minimum of 10 examinations per body part per site is to have an annual review rate of approximately 2%. Currently, there is no consensus or evidence base regarding the required percentage of studies to be reviewed. 21,22 Therefore, we selected a value of 2% because it was considered reasonable and feasible to attain.
Results of the monthly peer review are presented at each hospital’s general radiography staff meeting providing technologists with feedback to correct commonly identified issues. Each site collects image quality data independently and has their own responsibility to make ensuing corrections based on the data collected. The monthly audit schedule is repeated semi-annually to ensure common examinations undergo peer review a minimum of twice per year, thus providing on-going staff education and the ability to compare departmental quality before and after educational intervention. Audit results from each hospital are combined to provide an overall representation of the health-care region’s image quality.
In addition, a survey was also created using Survey Monkey (San Mateo, California) to receive feedback regarding the tool.
Results
Regional image quality results were collected from January 1, 2016, to June 30, 2018, from 10,000 peer-reviewed radiography examinations. Initially, from January 1, 2016, to June 30, 2016, 20 out of 28 hospitals opted into the implementation of the peer review tool; in 2018, 27 out of the 28 hospitals opted into using the peer review tool. The 6 results for the most commonly performed radiography examinations are shown in Figure 3A to F, respectively: routine chest, portable chest, 3-view abdomen, pelvis and hip, portable pelvis and shoulder.
The results from the cumulative image quality control audit spanning from January 2016 to June 2018 in semiannual periods of different examinations: (A) routine chest, (B) portable chest, (C) 3-view abdomen, (D) pelvis and hip, (E) portable pelvis, and (F) shoulders.
Prior to implementation of the peer review software application in 2016, the data was insufficient and incomplete. This made it difficult to compare pre-implementation with current post-implementation results; the reason is without the implementation of the software tool, it was logistically very difficult to track and gather each image quality parameter from each hospital as these peer review audits were rarely completed.
Initial audit findings identified many equipment-related issues, including CR plate scratches and dust affecting image quality, which prompted regular scheduled cleaning and replacement of worn out plates; pressure marks on CR plates due to patients’ weight bearing directly on plates, which initiated a project to design and manufacture a cost-effective CR plate protector for weight-bearing examinations; faulty automatic exposure control settings; and foreign object artifacts caused by patient gowns and decade-old sponges used as positioning aides, both of which were replaced. These problems were only detected as a result of the sequential review of multiple examinations.
These results showed some inconsistencies in selected parameters, such as positional markers and technologist initials; however, the results are associated with an improvement in the overall image quality score across all examinations. The results stated are illustrated in Figure 3A to F. The repeat reject rate data were also calculated for 2015 (preimplementation) to 2018 (Figure 4). The repeat reject rate is calculated in a percentage of total images that are deemed unacceptable and therefore needed to have a repeat image examination done.
In addition to assessing quantitative data on image quality, we explored technologists’ and peer review auditors’ feeling toward the new peer review tool through a survey. The entirety of the survey and results can be seen in Figure 5. Overall, the survey demonstrates that the implementation of this peer review tool was beneficial for the technologists. These technologists are positive about the introduction of the new peer review tool and have subjectively seen improvement in the overall quality of images done by their site.
The results of the repeat reject rates from 2015 to 2018. The ranges that were selected for good (below 5.0%), acceptable (5.0 to 8.0%), and poor (above 8.0%) were in accordance to national and international rates. 23
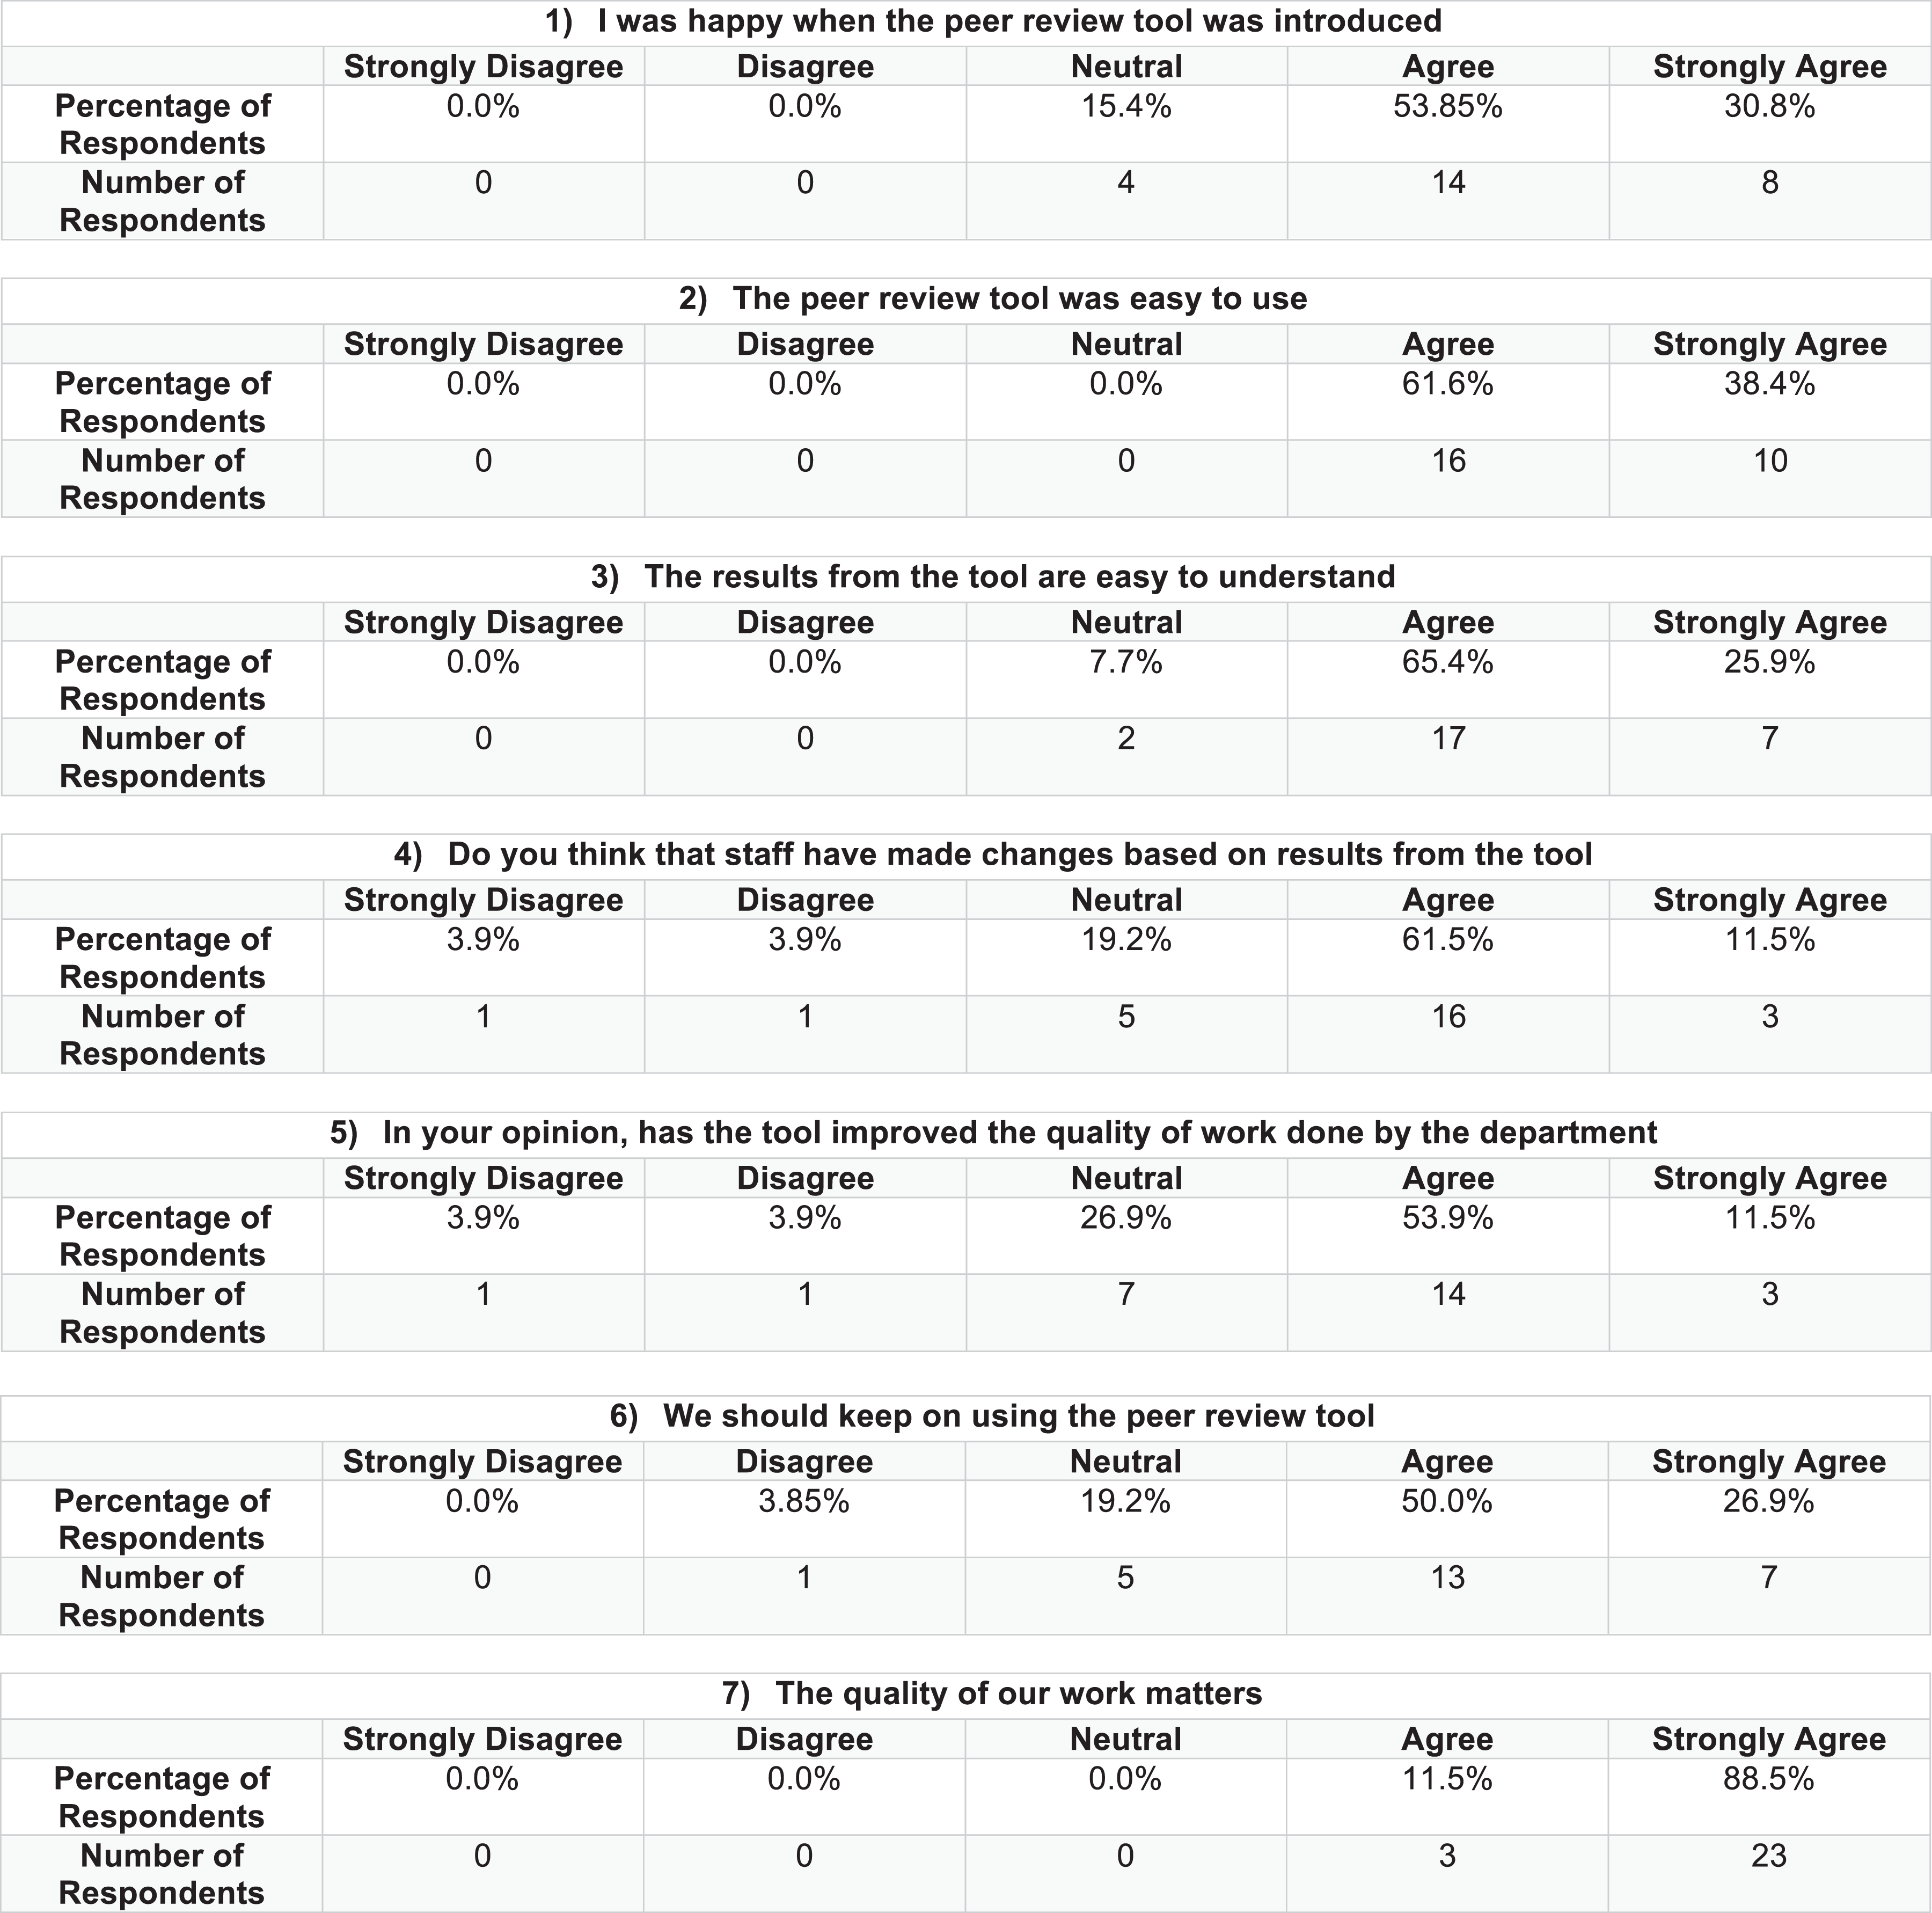
The results of the survey sent to peer review auditors and technologists involved with the peer review tool.
Discussion
To the best of our knowledge, this is the first implemented peer review software tool utilized in Canada for radiology technologists. While there have been peer review systems established for radiologists such as RADPEER 24 and peerVUE, 25 there has not been any tool developed for a feedback review system for X-ray technologists in regard to QA improvement.
Initially, when the peer review software tool was first implemented on January 1, 2016, only 20 out of 28 hospitals participated in this program. This was due to computer upgrades occurring at some sites, low numbers of staffing, staffing changes, and other factors. However, 6 sites implemented the tool after peer-reviewed feedback relating to tool use and benefits (ease of use, improved efficiency, and efficacy related to review time and metric output). As of January 1, 2018, only 1 site has not adopted this tool as it is undergoing substantial IT upgrades.
The results collected from the tool showed overall acceptable to good results across almost all individual quality metrics (Figure 3A-F). However, some parameters showed marked variability throughout different time periods such as positional marker visibility and technologists’ initials visibility. These factors may be attributed to new staff and that these parameters are especially more easily forgotten. In addition, since the implementation of the tool, each subsequent period included additional site participation. This may have affected some of the data, especially in 2017 to 2018, which saw an additional 5 new hospitals opt into the program and may have contributed to the decreased scores in some of these parameters. Nevertheless, it is noted that our overall image quality scores across all examinations showed correlations of constant improvements throughout subsequent audit cycles, which supports the envisioned hypothesized result.
For the first time ever, using this tool, objective data and quality metrics were obtained from all hospitals, in a consistent manner. These data allow us to view how each individual site is performing and compare against performance against all sites. Areas for improvement allowed staff to develop targeted standard operating procedures (SOPs) to fill gaps in protocol and knowledge, with the goal of ongoing QA improvement across each site and the consolidated department as a whole. An example SOP of an axial shoulder procedure can be seen in Online Appendix A. Each site was mandated to improve engagement and involvement with technologists by providing feedback sessions as well as developing continuous educational methods. An example of this is an image QC educational board that is placed in the department to engage technologists and to improve knowledge on image quality (Online Appendix B). Implementing feedback and education should allow for continued QA improvement.
One limitation of this study is the inability to correlate our data with mandatory repeat/reject rates. Repeat/Reject rates for plain film radiography has been traditionally set at 5%. 8 However, with the transition to digital imaging, the AAPM has recommended changes to the repeat/reject rate. 23 This includes a maximum rate of 8% for rejected digital images, 5% rate for repeated pediatric images, and 7% for repeated adult images. The current study was not designed to evaluate impact on repeat and reject rates. Retrospective review of data was not possible as repeated/rejected images were not part of the peer-review process. Presently, only images sent to PACS are evaluated by staff with the tool. As future work, sites will be requested to review rejected/repeated images as part of the process. This will identify images that would have been diagnostically acceptable but were instead rejected by the technologist. Reviewing rejected/repeated images is a substantial task, as each vendor has their own method of storing and reporting these images.
This study is limited by not incorporating repeat/reject rate into the analysis. Ideally, repeated or rejected images would also be reviewed to see if they should have been “truly” repeated. With more education, we may expect the repeat/reject rate to increase as a transient response and then settle at a number consistent with each hospital’s demographics/technology. This analysis was out of scope for this tool; however, this should be incorporated for others performing a similar analysis.
As our peer review system is still at its preliminary stages, an update study may be beneficial at 5 years to observe if this early positive momentum has carried over in the long run.
In addition, conducting image and examination QA, this tool has been embraced by staff. Most notably, our survey demonstrates that staff was content with the initiation of this peer review tool as well as the easy accessibility of this tool. It has been documented in literature that with ease of tool use, combined with consistent and relevant output data and meaningful feedback that can readily improve practice has become a standard of practice and essential for performance management. 26 -28 Feedback provides guidance and impetus which fortifies positive behaviors while altering ineffective performances. By providing positive feedback and anonymized suggested improvements, staff felt their work is appreciated and valued, which is associated with an enhancement of intrinsic motivation. 29 It has also been suggested that nonanonymous feedback is more often disparaging or harsh whether it is intentional or unintentional. 27 Additionally, receivers of critical feedback may feel innately inclined to be defensive or choose to ignore crucial information. 30 By having an anonymized peer review tool, the goal is not to negatively critique individual technologists but to ultimately try and improve the overall quality of the entire department as a whole via education and positive feedback.
The survey also showed positive support for the tool except at one site; this provides important information for future development. By identifying deficiencies, the tool can be improved to address concerns of frontline users. This will improve tool usage and staff morale.
Conclusion
The development and implementation of a computer-based peer review tool for general radiography examinations effectively meets accreditations standards for monthly image quality audits and feedback to technologists. The peer review tool has helped identify and correct many issues affecting image quality, improved overall image QC, and has increased team work and collaboration between staff. Lastly, by using a Microsoft Excel-based tool, our hospitals are able to perform image and examination quality review in a simple, efficient, and standardized manner.
We hope our experience demonstrates the value of image peer review and that is attainable with a simple software tool. Other departments across Canada can easily implement their own versions, which will help to revolutionize image QA across the control.
Supplemental Material
Supplemental_Appendix_S1 - Peer Review Tool for General Radiography Technologists Improves Image Quality
Supplemental_Appendix_S1 for Peer Review Tool for General Radiography Technologists Improves Image Quality by Andrew M. Hsiao, Annemarie Budau-Bymoen, Petar Seslija, Charlotte J. Yong-Hing and Yogesh Thakur in Canadian Association of Radiologists Journal
Supplemental Material
Supplemental_Appendix_S2 - Peer Review Tool for General Radiography Technologists Improves Image Quality
Supplemental_Appendix_S2 for Peer Review Tool for General Radiography Technologists Improves Image Quality by Andrew M. Hsiao, Annemarie Budau-Bymoen, Petar Seslija, Charlotte J. Yong-Hing and Yogesh Thakur in Canadian Association of Radiologists Journal
Footnotes
Acknowledgments
The authors would like to thank Lower Mainland Medical Imaging (LMMI) for funding the development of our peer review software application. The authors would also like to thank all the X-ray technologists and peer review auditors who participated in this research project.
Declaration of Conflicting Interests
The author(s) declared no potential conflicts of interest with respect to the research, authorship, and/or publication of this article.
Funding
The author(s) received no financial support for the research, authorship, and/or publication of this article.
Supplemental Material
Supplemental material for this article is available online.
References
Supplementary Material
Please find the following supplemental material available below.
For Open Access articles published under a Creative Commons License, all supplemental material carries the same license as the article it is associated with.
For non-Open Access articles published, all supplemental material carries a non-exclusive license, and permission requests for re-use of supplemental material or any part of supplemental material shall be sent directly to the copyright owner as specified in the copyright notice associated with the article.