Corrigendum to “Low Tube Voltage Chest Computed Tomography With Enhancement Using Low-Concentration Iodinated Contrast Media: Comparison of 240 mg/mL Versus 300 mg/mL Iodinated Contrast Media”
Available accessCorrectionFirst published online November, 2023
Corrigendum to “Low Tube Voltage Chest Computed Tomography With Enhancement Using Low-Concentration Iodinated Contrast Media: Comparison of 240 mg/mL Versus 300 mg/mL Iodinated Contrast Media”
Chang S, Jung JI, Beck KS. Low Tube Voltage Chest Computed Tomography With Enhancement Using Low-Concentration Iodinated Contrast Media: Comparison of 240 mg/mL Versus 300 mg/mL Iodinated Contrast Media. Canadian Association of Radiologists Journal. 2023;74(1):127-136. doi:10.1177/08465371221102631
There were errors in Table 2, in the original submission. This has now been corrected. Please see below the updated Table 2.
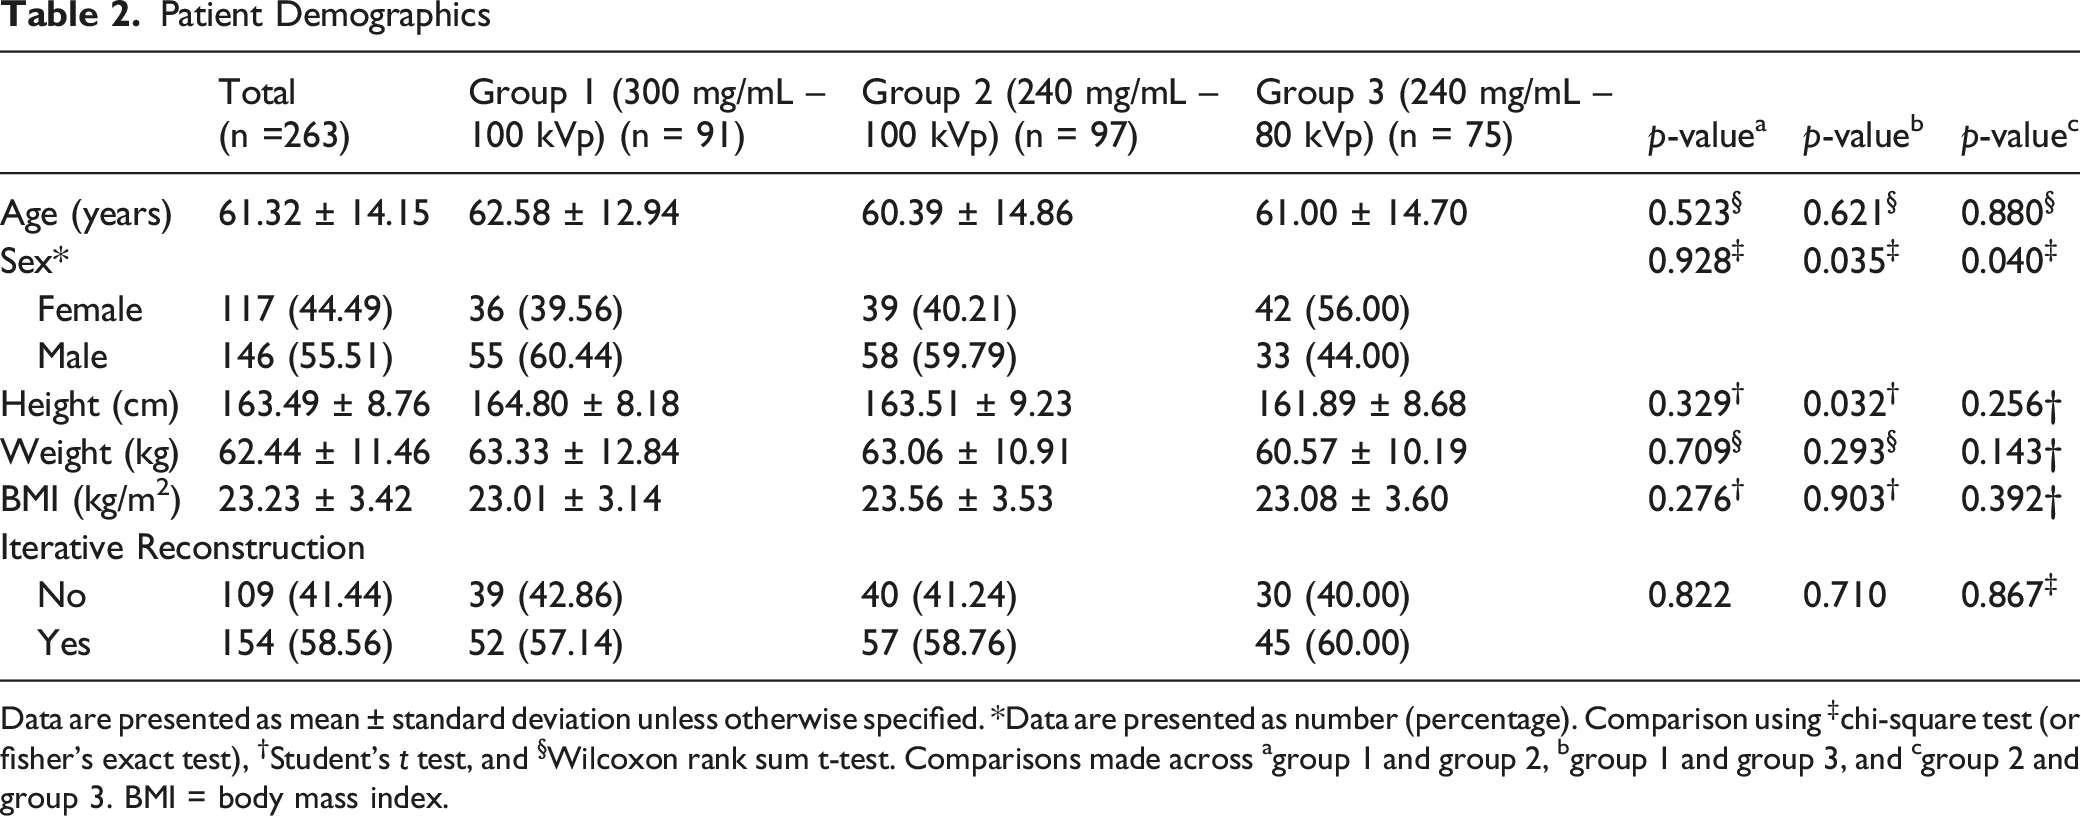
Patient Demographics
Total (n =263)
Group 1 (300 mg/mL – 100 kVp) (n = 91)
Group 2 (240 mg/mL – 100 kVp) (n = 97)
Group 3 (240 mg/mL – 80 kVp) (n = 75)
p-valuea
p-valueb
p-valuec
Age (years)
61.32 ± 14.15
62.58 ± 12.94
60.39 ± 14.86
61.00 ± 14.70
0.523§
0.621§
0.880§
Sex*
0.928‡
0.035‡
0.040‡
Female
117 (44.49)
36 (39.56)
39 (40.21)
42 (56.00)
Male
146 (55.51)
55 (60.44)
58 (59.79)
33 (44.00)
Height (cm)
163.49 ± 8.76
164.80 ± 8.18
163.51 ± 9.23
161.89 ± 8.68
0.329†
0.032†
0.256†
Weight (kg)
62.44 ± 11.46
63.33 ± 12.84
63.06 ± 10.91
60.57 ± 10.19
0.709§
0.293§
0.143†
BMI (kg/m2)
23.23 ± 3.42
23.01 ± 3.14
23.56 ± 3.53
23.08 ± 3.60
0.276†
0.903†
0.392†
Iterative Reconstruction
No
109 (41.44)
39 (42.86)
40 (41.24)
30 (40.00)
0.822
0.710
0.867‡
Yes
154 (58.56)
52 (57.14)
57 (58.76)
45 (60.00)
Data are presented as mean ± standard deviation unless otherwise specified. *Data are presented as number (percentage). Comparison using ‡chi-square test (or fisher's exact test), †Student’s t test, and §Wilcoxon rank sum t-test. Comparisons made across agroup 1 and group 2, bgroup 1 and group 3, and cgroup 2 and group 3. BMI = body mass index.