In this study, we determined whether diffusion tensor imaging (DTI), a more widely available imaging modality, is as effective as α-[11C]methyl-l-tryptophan (AMT)–positron emission tomography (PET) in localizing epileptogenic tubers in tuberous sclerosis complex. Following that, coregistration of AMT-PET and diffusion tensor imaging scans apparent diffusion coefficient (ADC) and fractional anisotropy (FA) were measured in all tubers using a region-of-interest approach and were compared with AMT-PET tuber/cortex uptake ratios, which were used to differentiate between epileptogenic and nonepileptogenic tubers. Forty-three tubers, out of a total of 320 tubers, had AMT-PET uptake ratios greater than 1 and hence were classified as potentially epileptogenic. FA in epileptogenic tubers was reduced compared with the other tubers (P = .03). A significant negative correlation was observed between AMT-PET uptake ratio of epileptogenic tubers and FA values (r = –.45; P = .003). Tubers with higher AMT-PET uptake ratios corresponded well with lower FA values in tuberous sclerosis complex patients.
The majority of patients with tuberous sclerosis complex (TSC) have seizures during their lifetime, and many develop intractable epilepsy.1 In tuberous sclerosis complex subjects with intractable epilepsy, surgical resection of the offending tuber is an option to control seizures but is not always feasible. Since tuberous sclerosis complex patients often present with multiple tubers within close proximity and scalp electroencephalograms may not be able to distinguish between epileptogenic and nonepileptogenic tubers, presurgical localization of the epileptogenic lesion is very challenging.
Neuroimaging methods capable of differentiating epileptogenic from nonepileptogenic tubers in patients with tuberous sclerosis complex would be expected to facilitate surgical treatment. Magnetic resonance imaging (MRI), especially fluid-attenuated inversion recovery (FLAIR) images,2 and positron emission tomography (PET) scanning of glucose metabolism3,4 are sensitive in the detection of tubers but do not differentiate between epileptogenic and nonepileptogenic lesions. PET imaging employing α-[11C]methyl-l-tryptophan (AMT), a tracer of tryptophan metabolism,5–7 can differentiate between epileptogenic and nonepileptogenic tubers interictally in two-thirds of tuberous sclerosis complex patients with intractable epilepsy.8 Our group later also reported that an α-[11C]methyl-l-tryptophan PET uptake ratio (tuber/normal cortex) cut-off value of 0.98 reliably differentiates between epileptogenic tubers and nonepileptogenic tubers.9 This ratio takes into account that nonepileptogenic tubers have lower α-[11C]methyl-l-tryptophan uptake than normal cortex.
A disadvantage of α-[11C]methyl-l-tryptophan PET, however, is that it is not widely available. There have been attempts to pinpoint epileptogenic tubers using MRI but success has been limited. In the present study, we determined whether diffusion tensor imaging (DTI) could assist in the differentiation between epileptogenic and nonepileptogenic tubers. Diffusion tensor imaging can provide 3-dimensional information about white matter tissue water diffusion in individual image voxels, thus offering a new method to evaluate not only the magnitude of water diffusivity but also the direction of the diffusion.10 Fractional anisotropy (FA) is a quantitative diffusion tensor imaging parameter, which measures the direction-dependent diffusivity of water molecules and is an indicator of the diameter and density of fibers, myelination, and macrostructural features of brain white matter.10 Apparent diffusion coefficient (ADC) denotes the degree of restriction to water diffusion and is another important parameter of diffusion tensor imaging along with fractional anisotropy in identifying white matter abnormalities. The aim of this study was to evaluate whether the diffusion tensor imaging indices (fractional anisotropy and apparent diffusion coefficient) of cortical tubers can be used as biomarkers of epileptogenic and nonepileptogenic tubers.
Methods
Seventeen children (11 boys, 6 girls; age range, 3-14 years; mean age, 7.6 years) with a diagnosis of definite tuberous sclerosis complex as defined in the revised clinical diagnostic criteria1 and medically refractory epilepsy were included in the present study. None of these patients had been included in our previous studies. Selection criteria included presence of tubers on MRI, availability of diffusion tensor imaging and an α-[11C]methyl-l-tryptophan PET scan. Interictal and ictal scalp electroencephalogram findings were unable to accurately define the tubers for surgical resection but, instead, lateralized the seizure focus or localized the focus to a quadrant of the brain. In those brain regions, typically multiple tubers were found that could be potential surgical targets. Studies were performed in compliance with regulations of the Wayne State University Human Investigation Committee, and written informed consent of a parent or guardian was obtained.
Magnetic Resonance Imaging Procedure
Magnetic resonance imaging scans were performed using a 3-T Twin-Speed GE Scanner with an 8-channel head coil. The full MRI acquisition included the following series: (a) 3-dimensional structural MRI scan of the brain using a T1-weighted inversion recovery fast spoiled gradient recall sequence designed to optimize the tissue contrast between gray and white matter. Imaging parameters were as follows: repetition time/echo time/inversion time = 6.2/2.5/450 ms; flip angle = 12°; matrix size = 265 × 265, Array Spatial Sensitivity Encoding Technique factor of 2; field of view = 205 × 205 mm2, zipped by 2, with a thickness of 1.6 mm, yielding a cubic voxel of 0.8 × 0.8 × 0.8 mm3; (b) T2 fluid-attenuated inversion recovery acquired in 30 coronal planes with repetition time/echo time/inversion time = 11000/160/2450 ms; field of view = 240 × 240 mm2; matrix = 288 × 192; slice thickness = 4 mm and 1-mm gap, 2 repetitions; (c) axial T2-weighted fast spin echo (32 echo train length) with repetition time/echo time = 5000/108 ms; slice thickness = 4 mm; gap = 1 mm; matrix = 384 × 256, 2 repetitions.
α-[11 C]methyl-l-tryptophan PET Scanning Procedure
For the α-[11C]methyl-l-tryptophan PET scan, subjects fasted for 6 hours to obtain stable plasma tryptophan and large neutral amino acid levels during the study. Two venous lines were established, 1 for tracer injection and 1 for collection of timed blood samples (0.5 mL/sample, collected at 0, 20, 30, 40, 50, and 60 minutes after α-[11C]methyl-l-tryptophan injection); plasma tryptophan concentration was measured in these samples by high-pressure liquid chromatography as previously described to confirm stable values during the study.11 Children were sedated intravenously with either nembutal (Wyeth-Ayerst, Philadelphia, Pennsylvania; 5 mg/kg) or midazolam (0.2-0.4 mg/kg) if necessary. Prior studies performed on 5 adults each scanned twice (once without and once with sedation using midazolam) in our laboratory have shown no significant difference in serotonin synthesis between the 2 testing conditions (Chugani and colleagues, unpublished data, 1995). The α-[11C]methyl-l-tryptophan (0.1 mCi/kg) was injected intravenously over 2 minutes. Twenty-five minutes after tracer injection, a dynamic emission scan of the brain (7 × 5 minutes) was acquired in 3-dimensional mode, generating 47 image planes with a slice thickness of 3.125 mm. Measured attenuation and decay correction were applied to all images. The standard uptake value (SUV; represents tissue activity concentration normalized to the injected activity per kilogram of body weight) method for semiquantitative analysis of tracer accumulation was used.12 As all subjects received a standardized dose based on their weight (0.1 mCi/kg), calibrated images (μCi/mL) directly depict the standard uptake value.7
Diffusion Tensor Imaging Acquisition and Generation of Fractional Anisotropy and Apparent Diffusion Coefficient Maps
Spin-echo echo-planar diffusion weighted sequences were acquired in the axial plane with 55 diffusion sensitization gradients (b = 1000 [s/mm2]) applied in noncolinear directions (Di, i = [1,…, 55]) and a T2-weighted reference (D0) scan (b = 0 [s/mm2]). The diffusion weighted sequence consisted of the following imaging parameters: a set of minimum 34 axial slices of 3-mm thickness without gap, field of view = 240 × 240 mm2, matrix = 128 × 128 reconstructed with homodyne to 256 × 256, repetition time/echo time = 9000 to 11000/80 ms. Double radiofrequency-refocusing pulses and parallel imaging capability (Array Spatial Sensitivity Encoding Technique factor of 2) were applied to reduce eddy current and geometric distortion artifacts derived from echo-planar imaging. Because the scans for tuberous sclerosis complex subjects were clinical MRI studies, sedation was used as necessary by the sedation team at Children’s Hospital of Michigan according to standard clinical protocols. All children were monitored for movement during the scan. If there was significant movement, those scans for which MRI was repeated were removed from the study. Diffusion tensor imaging fractional anisotropy and apparent diffusion coefficient maps were generated using diffusion tensor imaging studio software.13
Regions of Interest
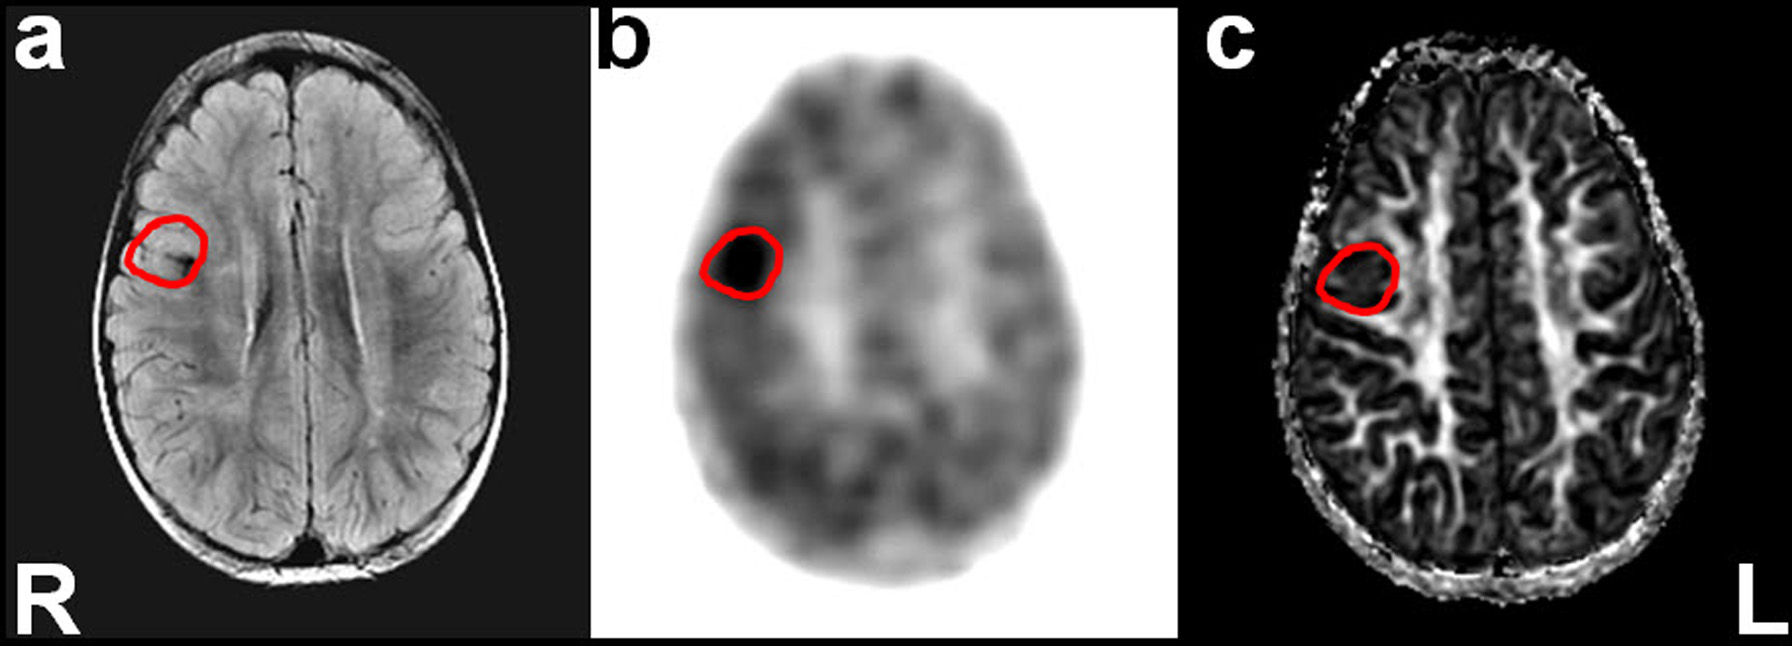
Cortical tubers were visually identified on the fluid-attenuated inversion recovery, T2-weighted images. Definable lesions in the cortex that were hyperintense or heterointense with calcification were counted as cortical tubers on fluid-attenuated inversion recovery and T2-weighted images. Hyperintense lesions within the white matter such as subcortical heterotopias or radial migration lines were not taken as cortical tubers. α-[11C]methyl-l-tryptophan PET, diffusion tensor imaging fractional anisotropy and apparent diffusion coefficient map images were coregistered to fluid-attenuated inversion recovery, T2-weighted images using VINCI software (VINCI 3.80.0, Germany). Regions of interest for the cortical tubers and normal cortex were delineated on the fluid-attenuated inversion recovery images (Figure 1
) manually across all the planes of each patient using region of interest editor software (MRI studio). Similarly, regions of interest for normal cortex were selected manually.
Coregistered axial T2-weighted magnetic resonance images (MRIs) (A), α-[11C]methyl-l-tryptophan (AMT) PET images (B), and diffusion tensor imaging fractional anisotropy (FA) maps (C). Note the intense uptake of α-[11C]methyl-l-tryptophan (AMT) in PET image.
Data Analysis
The α-[11C]methyl-l-tryptophan PET standardized uptake values of the cortical tubers were divided by the standardized uptake value from normal cortical regions to obtain the α-[11C]methyl-l-tryptophan PET tuber/cortex uptake ratios. The values for normal cortex regions of interest were taken across several planes and averaged for each patient. Normal cortex was identified based on all the neuroimaging data. In our previous studies, we have reported that epileptogenic tubers have an α-[11C]methyl-l-tryptophan PET uptake of 0.98 or more.9 In a subsequent study, we reported that a ratio of 1.02 should be used as an optimal cutoff between epileptogenic and nonepileptogenic tubers.14 Here, we have used an α-[11C]methyl-l-tryptophan PET uptake ratio of 1 as a cut-off for differentiating between epileptogenic and nonepileptogenic tubers. Apparent diffusion coefficient and fractional anisotropy values of epileptogenic and nonepileptogenic tubers based on the α-[11C]methyl-l-tryptophan PET uptake ratio cut-off were entered into a database and analyzed using a statistical program (SPSS version 19). Differences between epileptogenic and nonepileptogenic tubers involving continuous dependent variables were statistically compared using t tests. Results were considered different at a minimal level of significance of P <.05.
Mean age at presurgical evaluation in these children was 7.6 ± 4.5 (SD) years (range 3–14 years) and seizure duration was 6.1 ± 5.8 years (range 3-12; median 4.7 years). A total of 320 tubers were evaluated, and the mean (±SD) number of tubers per patient was 18 (±13). Forty-nine percent of the tubers (n = 157) were in the left cerebral hemisphere.
α-[11 C]methyl-l-tryptophan PET Uptake Results
Of the total of 320 tubers, 43 tubers showed an α-[11C]methyl-l-tryptophan PET uptake ratio greater than 1.0 and hence were classified as epileptogenic tubers. The remaining 277 tubers were classified as nonepileptogenic tubers.
Fractional Anisotropy and Apparent Diffusion Coefficient Values in Epileptogenic and Nonepileptogenic Tubers
Diffusion tensor imaging apparent diffusion coefficient and fractional anisotropy values in tuberous sclerosis complex patients were compared between epileptogenic tubers and nonepileptogenic tubers, as defined above. For all tubers, the mean fractional anisotropy values were 0.202 ± 0.088 (range, 0.079-0.770), and difference in fractional anisotropy between epileptogenic (0.17 ± 0.05) and nonepileptogenic (0.21 ± 0.09) tubers was significant (P = .03). The mean (±SD) apparent diffusion coefficient value for all tubers was 0.101 (±0.028) (range, 0.050-0.230). However, there was no significant difference in apparent diffusion coefficient values between epileptogenic and nonepileptogenic tubers.
Correlation Between Fractional Anisotropy and α-[11 C]methyl-l-tryptophan PET Uptake Ratio in Epileptogenic and Nonepileptogenic Tubers
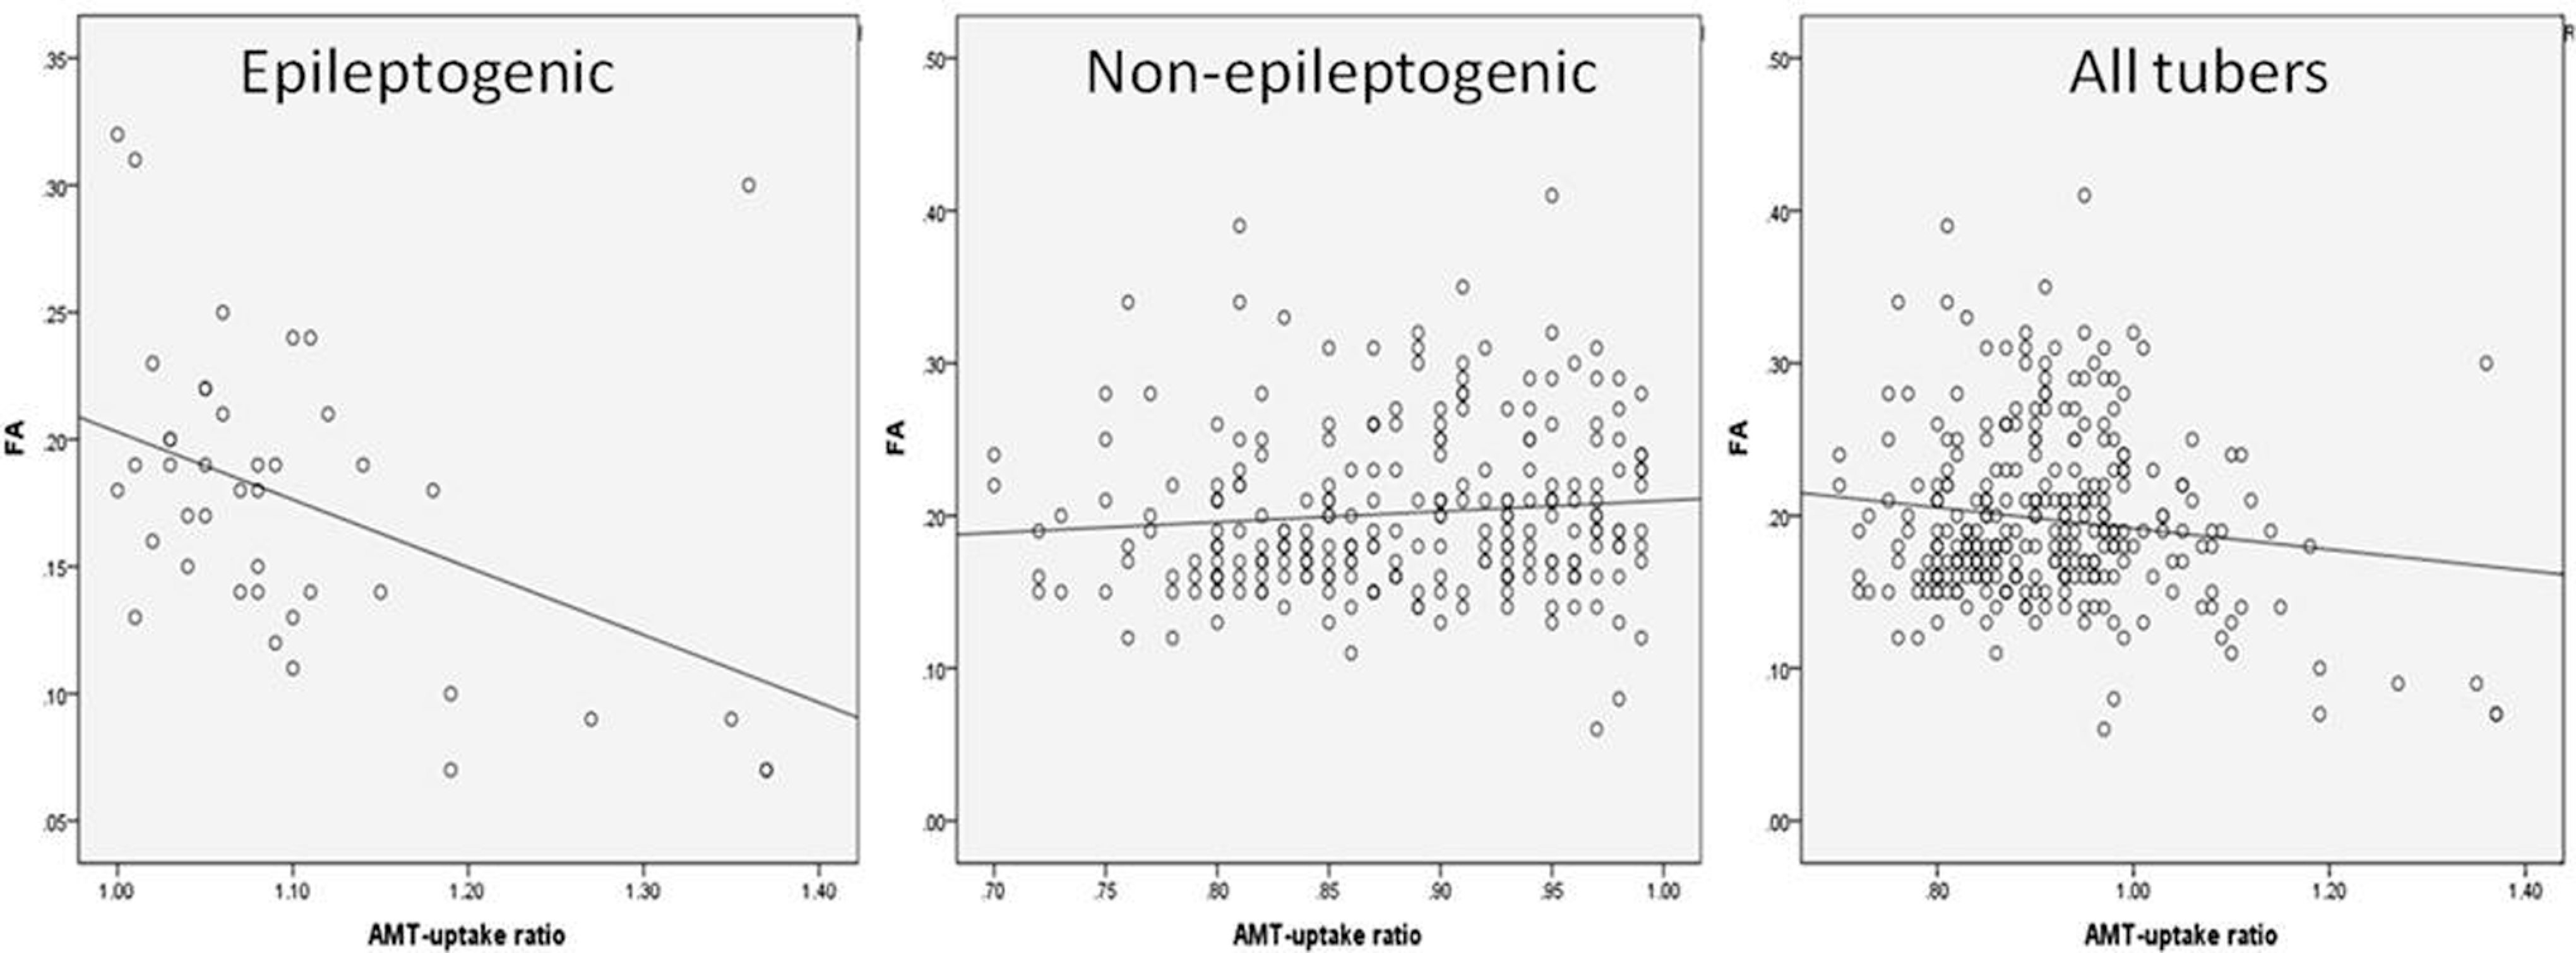
We also performed correlation analysis between the fractional anisotropy values and α-[11C]methyl-l-tryptophan PET uptake ratios of epileptogenic and nonepileptogenic tubers. For epileptogenic tubers, the correlation between fractional anisotropy and α-[11C]methyl-l-tryptophan uptake ratio was significant (R = –.45; P = .003); however, the correlation was not significant for nonepileptogenic tubers (Figure 2
). Overall, taking all tubers into account, there was a trend toward correlation between α-[11C]methyl-l-tryptophan PET uptake ratio and fractional anisotropy (R = –.125; P = .03).
Scatter graphs showing linear correlation between α-[11C]methyl-l-tryptophan PET uptake ratios and fractional anisotropy values. A significant correlation was observed between α-[11C]methyl-l-tryptophan uptake ratio and fractional anisotropy of epileptogenic tubers (R = –.45; P = .003). Correlation was not significant in nonepileptogenic tubers.
Discussion
We have previously demonstrated in tuberous sclerosis complex patients that cortex with increased α-[11C]methyl-l-tryptophan PET uptake corresponds well with the seizure onset area as defined by intracranial electroencephalogram recordings.9 Thus, the location of increased α-[11C]methyl-l-tryptophan uptake on PET can be a useful guide for locating the epileptogenic cortex. In tuberous sclerosis complex subjects with intractable epilepsy, a cut-off value of α-[11C]methyl-l-tryptophan PET uptake ratio (>1) was ascertained to differentiate between epileptogenic and nonepileptogenic tubers based on receiver operating characteristic (ROC) analysis.9 The rationale for performing the present study was to determine whether a more widely available neuroimaging tool (ie, magnetic resonance diffusion tensor imaging) might suffice to differentiate epileptogenic from nonepileptognic tubers and, thus, replace α-[11C]methyl-l-tryptophan PET in the presurgical evaluation of tuberous sclerosis complex patients since α-[11C]methyl-l-tryptophan PET is not a widely available tool.
In this preliminary retrospective analysis, we report that the fractional anisotropy of epileptogenic tuber(s) is significantly lower than fractional anisotropy of nonepileptogenic tubers. We also found a good correlation between fractional anisotropy and α-[11C]methyl-l-tryptophan PET uptake ratio in epileptogenic tubers. Although fractional anisotropy values are helpful, it is unlikely that they have the same localization accuracy as α-[11C]methyl-l-tryptophan PET. Nevertheless, we have begun a prospective study to address this issue. Based on these preliminary data, we believe these 2 modalities (diffusion tensor imaging and α-[11C]methyl-l-tryptophan PET) complement each other in identifying epileptogenic tubers.
Tuberous sclerosis complex is fundamentally a brain disorder of cortical development and, histologically, the normal cortical architecture is disrupted within a tuber and effaced by abnormally oriented dysmorphic neurons, reactive astrocytes and eosinophilic cells, which may exhibit both neuronal and glial features. Thus, both the disruption of normal cortical architecture and the presence of atypical cells may contribute to the abnormalities observed in diffusion tensor imaging indices.15,16 Motion of fluid within the brain is normally restricted to movement along the same axis as the axon or myelin sheath. When neurons or myelin sheaths are damaged, the fractional anisotropy decreases because the fluid can move freely along various axes. On the basis of our diffusion tensor imaging assessment in tuberous sclerosis complex patients, we suggest that these regions (tubers) most likely reflect histopathologic abnormalities of cortical dysplasia and this in turn is manifested as a fractional anisotropy abnormality.
α-[11 C]methyl-l-tryptophan PET in Tuberous Sclerosis Complex
In this study we have relied on α-[11C]methyl-l-tryptophan PET to differentiate between epileptogenic and nonepileptogenic tubers. α-[11C]methyl-l-tryptophan PET has been shown to have 20% to 188% higher uptake in epileptogenic compared with nonepileptogenic tubers in two-thirds of individuals with tuberous sclerosis complex and medically intractable epilepsy.6,9,14 In our epilepsy surgery program, α-[11C]methyl-l-tryptophan PET is now routinely used as one of the most important tools in the presurgical evaluation of individuals with tuberous sclerosis complex for epilepsy surgery.14 A number of other surgery programs, including one from overseas, refers tuberous sclerosis complex patients to Detroit for α-[11C]methyl-l-tryptophan PET scans. Indeed, detection of tuber(s) with increased α-[11C]methyl-l-tryptophan PET uptake can provide additional localizing information, even when the scalp electroencephalogram results are not precisely localizing.14 Therefore, it is clinically desirable to obtain independent imaging data to confirm the location of the presumed epileptic focus, to enhance the confidence of patient selection for epilepsy surgery, and, in some cases, to raise the possibility of additional epileptic regions missed by scalp electroencephalogram. α-[11C]methyl-l-tryptophan PET can help optimize subdural electrode placement in such cases.
The major disadvantage of α-[11C]methyl-l-tryptophan PET is its availability. Although PET scanners are now widely available, few centers have the expertise in the synthesis of α-[11C]methyl-l-tryptophan. Furthermore, the α-[11C]methyl-l-tryptophan is labeled with 11C, which has a half-life of only 20 minutes and can, therefore, be synthesized only at PET centers that have cyclotrons. Efforts are being made to overcome this pitfall by developing an 18F-labeled α-[11C]methyl-l-tryptophan (2-hour half-life) and thus allow transport to nearby PET centers, as is being done widely with [18F]fluorodeoxyglucose.
Diffusion Tensor Imaging in Tuberous Sclerosis Complex
Diffusion tensor imaging techniques can be of value in the investigation of children with tuberous sclerosis complex and show some promise in improving our understanding of tuber properties. Some diffusion tensor imaging studies in tuberous sclerosis complex patients have reported increased apparent diffusion coefficient values17,18 in cortical tubers with no difference in fractional anisotropy18 compared with controls. Reductions of fractional anisotropy were also observed in a previous diffusion tensor imaging study of patients with miscellaneous cortical dysplasias.19 In another study, fractional anisotropy of corpus callosum correlated negatively with total tuber volume.20 In the present study, we compared fractional anisotropy and apparent diffusion coefficient values in epileptogenic tubers with values in nonepileptogenic tubers, as defined by α-[11C]methyl-l-tryptophan PET, in tuberous sclerosis complex patients. Reduced fractional anisotropy observed in tubers in general is consistent with results from some of the previous reports. Indeed, reduced fractional anisotropy has been described in a variety of conditions associated with hypomyelination and increased ectopic neurons that can also occur in the cortical tubers,21 and therefore reduced fractional anisotropy observed in this study may indicate the underlying pathology of cortical tubers. Our study shows that epileptogenic tubers have even lower fractional anisotropy than tubers in general, thus providing some value in localization for epilepsy surgery. For example, fractional anisotropy measurements may be useful in α-[11C]methyl-l-tryptophan PET negative cases. Although apparent diffusion coefficient values were higher in epileptogenic tubers compared with nonepileptogenic tubers, the increase was not statistically significant.
Methodological Considerations
One of the limitations of this study is accurate assessment of α-[11C]methyl-l-tryptophan PET uptake values for small tubers owing to partial volume effects. Region of interest–based analysis of α-[11C]methyl-l-tryptophan PET uptake can give false-positive results for tubers whose diameter falls below the resolution of images. However such small tubers are not usually epileptogenic and hence were omitted from our analysis. The second issue is that reduced fractional anisotropy is found in a wide variety of neurologic disorders and is not specific to tuberous sclerosis complex; still it could provide some predictive value when combined with other methods.
Conclusions
Converging information between α-[11C]methyl-l-tryptophan PET and diffusion tensor imaging along with extracranial ictal and interictal electroencephalogram localization can improve our ability to select candidates who would potentially benefit from surgical treatment and minimize the invasiveness of currently available presurgical localization procedures. In our opinion, invasive electroencephalogram monitoring should never be used for diagnostic purposes. Our initial results using α-[11C]methyl-l-tryptophan PET and diffusion tensor imaging support the concept that newer neuroimaging techniques, when combined with scalp electroencephalogram, may be able to identify epileptogenic tubers and those tuberous sclerosis complex patients who are surgical candidates less invasively and more cost-effectively.
Footnotes
VNT participated in the formulation of the hypothesis, acquired and analyzed the diffusion tensor imaging data, and wrote the first draft of the manuscript. AK participated in the design of the study and revised the first draft of the manuscript. PKC synthesized α-[11C]methyl-l-tryptophan (AMT) and revised the first draft of the manuscript. HTC participated in the design of the study, recruited the patients using the inclusion and exclusion criteria, and took part in extensive revision of the manuscript.
The authors declared no potential conflicts of interest with respect to the research, authorship, and/or publication of this article.
The authors disclosed receipt of the following financial support for the research, authorship, and/or publication of this article: This work was supported by grants from the National Institutes of Health to HTC (R01-NS34488, R01-NS064989).
The Human Investigations Committee at Wayne State University granted permission for the retrieval and analysis of deidentified diffusion tensor imaging (DTI) and outcome data that had been obtained clinically for these children.
TakanashiJSugitaKFujiiKNiimiH.MR evaluation of tuberous sclerosis: increased sensitivity with fluid-attenuated inversion recovery and relation to severity of seizures and mental retardation. AJNR Am J Neuroradiol. 1995;16:1923–1928.
3.
SzeliesBHerholzKHeissWD. Hypometabolic cortical lesions in tuberous sclerosis with epilepsy: demonstration by positron emission tomography. J Comput Assist Tomogr. 1983;7:946–953.
4.
RintahakaPJChuganiHT.Clinical role of positron emission tomography in children with tuberous sclerosis complex. J Child Neurol. 1997;12:42–52.
5.
DiksicMNagahiroSSourkesTLYamamotoYL.A new method to measure brain serotonin synthesis in vivo. I. Theory and basic data for a biological model. J Cereb Blood Flow Metab. 1990;10:1–12.
6.
ChuganiDCMuzikOChakrabortyPMangnerTChuganiHT.Human brain serotonin synthesis capacity measured in vivo with alpha-[C-11]methyl-l-tryptophan. Synapse. 1998;28:33–43.
7.
MuzikOChuganiDCChakrabortyPMangnerTChuganiHT.Analysis of [C-11]alpha-methyl-tryptophan kinetics for the estimation of serotonin synthesis rate in vivo. J Cereb Blood Flow Metab. 1997;17:659–669.
8.
ChuganiDCChuganiHTMuzikO. Imaging epileptogenic tubers in children with tuberous sclerosis complex using alpha-[11C]methyl-l-tryptophan positron emission tomography. Ann Neurol. 1998;44:858–866.
9.
AsanoEChuganiDCMuzikO. Multimodality imaging for improved detection of epileptogenic foci in tuberous sclerosis complex. Neurology. 2000;54:1976–1984.
10.
BeaulieuC.The basis of anisotropic water diffusion in the nervous system—a technical review. NMR Biomed. 2002;15:435–455.
11.
WolfWAKuhnDM.Uptake and release of tryptophan and serotonin: an HPLC method to study the flux of endogenous 5-hydroxyindoles through synaptosomes. J Neurochem. 1986;46:61–67.
12.
WoodardHQBiglerREFreedB.Expression of tissue isotope distribution [Letter]. J Nucl Med. 1975;16:958–959.
13.
JiangHvan ZijlPCKimJPearlsonGDMoriS.DtiStudio: resource program for diffusion tensor computation and fiber bundle tracking. Comput Methods Programs Biomed. 2006;81:106–116.
14.
KagawaKChuganiDCAsanoE. Epilepsy surgery outcome in children with tuberous sclerosis complex evaluated with alpha-[11C]methyl-l-tryptophan positron emission tomography (PET). J Child Neurol. 2005;20:429–438.
15.
KaradagDMentzelHJGullmarD. Diffusion tensor imaging in children and adolescents with tuberous sclerosis. Pediatr Radiol. 2005;35:980–983.
16.
MizuguchiMTakashimaS.Neuropathology of tuberous sclerosis. Brain Dev. 2001;23:508–515.
17.
ArulrajahSErtanGJordanL. Magnetic resonance imaging and diffusion-weighted imaging of normal-appearing white matter in children and young adults with tuberous sclerosis complex. Neuroradiology. 2009;51:781–786.
18.
ChandraPSSalamonNHuangJ. FDG-PET/MRI coregistration and diffusion-tensor imaging distinguish epileptogenic tubers and cortex in patients with tuberous sclerosis complex: a preliminary report. Epilepsia. 2006;47:1543–1549.
19.
ErikssonSHRugg-GunnFJSymmsMRBarkerGJDuncanJS.Diffusion tensor imaging in patients with epilepsy and malformations of cortical development. Brain. 2001;124:617–626.
20.
SimaoGRaybaudCChuangSGoCSneadOCWidjajaE.Diffusion tensor imaging of commissural and projection white matter in tuberous sclerosis complex and correlation with tuber load. AJNR Am J Neuroradiol. 2010;31:1273–1277.
21.
RidlerKBullmoreETDe VriesPJ. Widespread anatomical abnormalities of grey and white matter structure in tuberous sclerosis. Psychol Med. 2001;31:1437–1446.