
Abstract
This study investigates the craniospinal flows of blood and cerebrospinal fluid using phase-contrast magnetic resonance imaging (MRI) on 23 control neonates and infants (5 d-68 mo old). Mean arterial cerebral blood flow increased with age of infant from 180 mL/min after birth to 1330 mL/min around 6 years of age. This corresponds to 51 mL/min/100 g and 95 mL/min/100 g, respectively. Cervical cerebrospinal fluid stroke volume increased from 38 × 10–3 mL to 752 × 10–3 mL per cardiac cycle. After arterial systolic blood inflow, we observed a delay of the venous outflow that was always preceded by cerebrospinal fluid flushing out through the spinal canal. These results highlighted the importance of compliance of the spinal compartment and the interaction of blood and cerebrospinal fluid dynamics. The capacity of the spinal compartment to receive intracranial cerebrospinal fluid in presence of fontanels was demonstrated. We provide reference values to understand the physiology of cerebrospinal fluid and cerebral blood.
The brain’s hemo-and hydrodynamics of human neonates and children differ from that of adults because their skull is not rigid and their cerebral parenchyma and ventricles grow with age (Figure 1). In neonates, fontanels oscillate with the heart rate; thus, their intracranial volume fluctuates during the cardiac cycle. Fontanels closure (40% at 12 mo and 70.4% at 18 mo of age) occurs simultaneously with maturation of the central nervous system and is very acute during walk practicing (near 15 mo). 1 The arachnoids villi are absent in fetus and begin to develop after birth 2 ; nevertheless, it has been shown that they play an important role in cerebrospinal fluid resorption in adult. 3
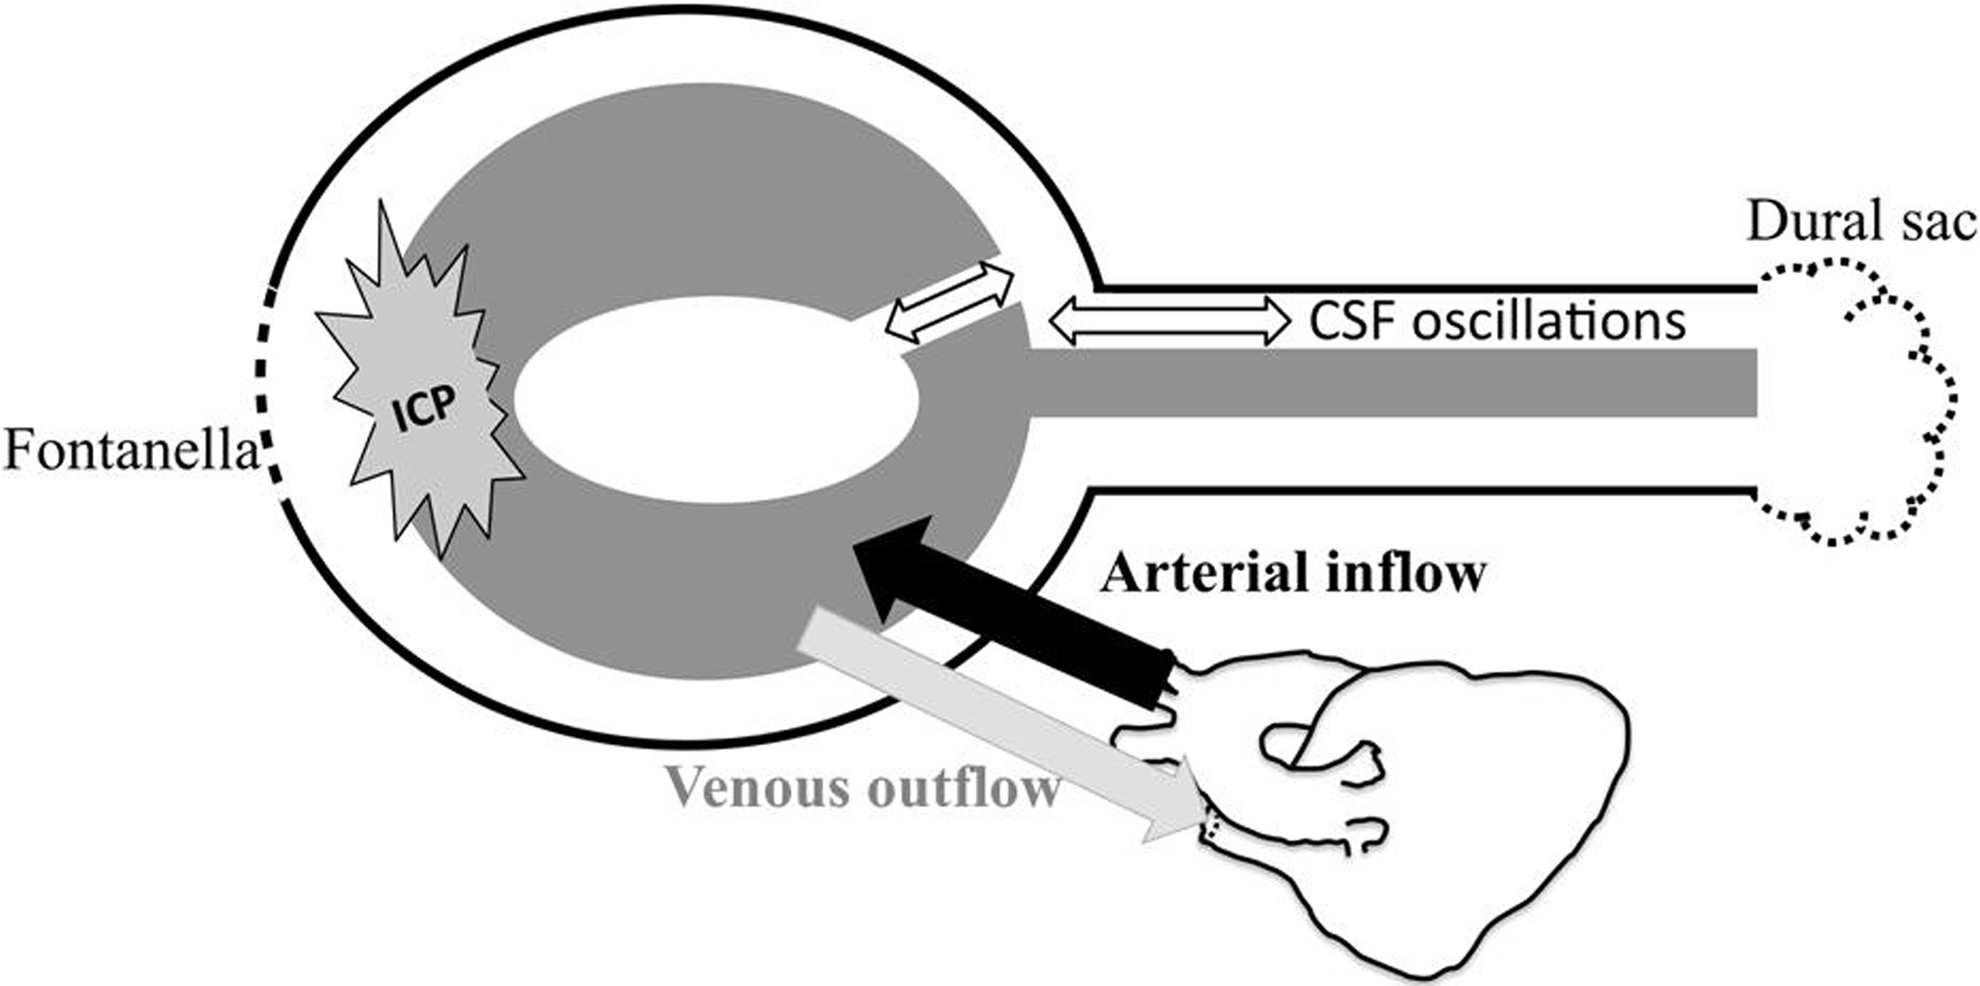
Sketch of pediatric cranium model with fontanel and unmerged joint. With the systolic pulse, a sudden arterial blood inflow flushes in. In response to this vascular expansion, we observe a flush-out of the venous blood and cerebrospinal fluid. The dural sac is an expansible structure located in the caudal extremity of the craniospinal system. But in neonates, the fontanels present an additional compliance system and the volumes of all intracranial compartments change and generate a variation of the intracranial pressure amplitude during the cardiac cycle.
Many newborn cerebral pathologies result from either cerebrospinal fluid or vascular flow dysfunctions that alter both the craniospinal compliance and the intracranial pressure and generate brain development problems. The importance of the arachnoid granulation in cerebrospinal fluid absorption is not completely defined. In young children, nasal lymphatics have shown to be an important absorption site. 3 –6 Parenchymal veins was suggested as the major absorption site in healthy controls and hydrocephalus, 6,7 associated with ependymal permeability and astrocytic function. 3,4 To date, the formation and absorption of the cerebrospinal fluid is still arguable. Consequently, there is a tremendous need to quantify noninvasively both cerebrospinal fluid and blood flows and investigate the evolution with age.
Using Doppler, Couture et al 8 showed that peak systolic velocity increased from 40 cm/s at birth (32 wk of gestation) to 90 cm/s at 6 months whereas end diastolic blood velocity increased from 10 cm/s at birth to 30 cm/s. Another Doppler study of intracranial venous flow showed a continuous low velocity in a control pediatric population. 9 It has been demonstrated that abnormal increases of pulsatile venous flow can indicate an increase of either intracranial pressure or intrathoracic pressure dysfunction (severe respiratory failure). 9
Unlike blood, cerebrospinal fluid cannot be studied by transfontanellar Doppler in the physiologic state because in normal cerebrospinal fluid there are not sufficient interfaces to generate signal. This is achievable with the presence of scattering particles or cells. 10
Phase-contrast magnetic resonance imaging (MRI) is an established conventional sequence that has the potential to overcome some of the problems experienced with Doppler and has been applied to quantify fluid velocities 11 –13 and oscillations in vivo during the cardiac cycle. Phase-contrast MRI is performed to study obstructive and nonobstructive cerebrospinal fluid flows in adults 14 –16 and intracranial compliance and intracranial pressure. 16 Measurements of blood flow pulsatility in the main cerebral arteries and veins by phase-contrast MRI in neonates and children would be useful to quantify cerebral brain expansion during one cardiac cycle. 11 –13,16,17 It has been demonstrated that quantification of cerebral blood flow (CBF) associated with cerebrospinal fluid oscillations can give a new approach to study craniospinal compliance. 16,17 Infants and young children experience rapid brain growth and development and we need reference values for cerebrospinal fluid and cerebral blood flow to improve our knowledge of the physiology and the pathologies it might cause. To date there is no study to combine quantification of cerebrospinal fluid and vascular flows in pediatrics and correlate these with age. The aims of this study were (1) to investigate craniospinal flows of both blood and cerebrospinal fluid in a pediatric population, (2) to correlate the flow changes of both blood and cerebrospinal fluid flows with age, and (3) to assess the intercompartment hemo-and hydrodynamic interaction. We hypothesized that cerebral blood flow waveforms and cervical cerebrospinal fluid flow waveforms are dependent on each other, and fontanels are not the only intracranial compliance.
Materials and Method
Patients
Between 2007 and 2010, 23 term-born young children were included as healthy control subjects (age range: 5 d–68 mo, 12 boys) (Figure 2) and had 4 complementary phase-contrast MRI acquisitions (∼5 min). Inclusion criteria are no evidence of perinatal brain injury on the basis of MRI, no neurologic abnormality, and a good outcome in their clinical history after 12 months of follow-up (normal psychomotor development, no recurrence of convulsion and normal neurologic examination). This study was approved by the regional ethical committee.
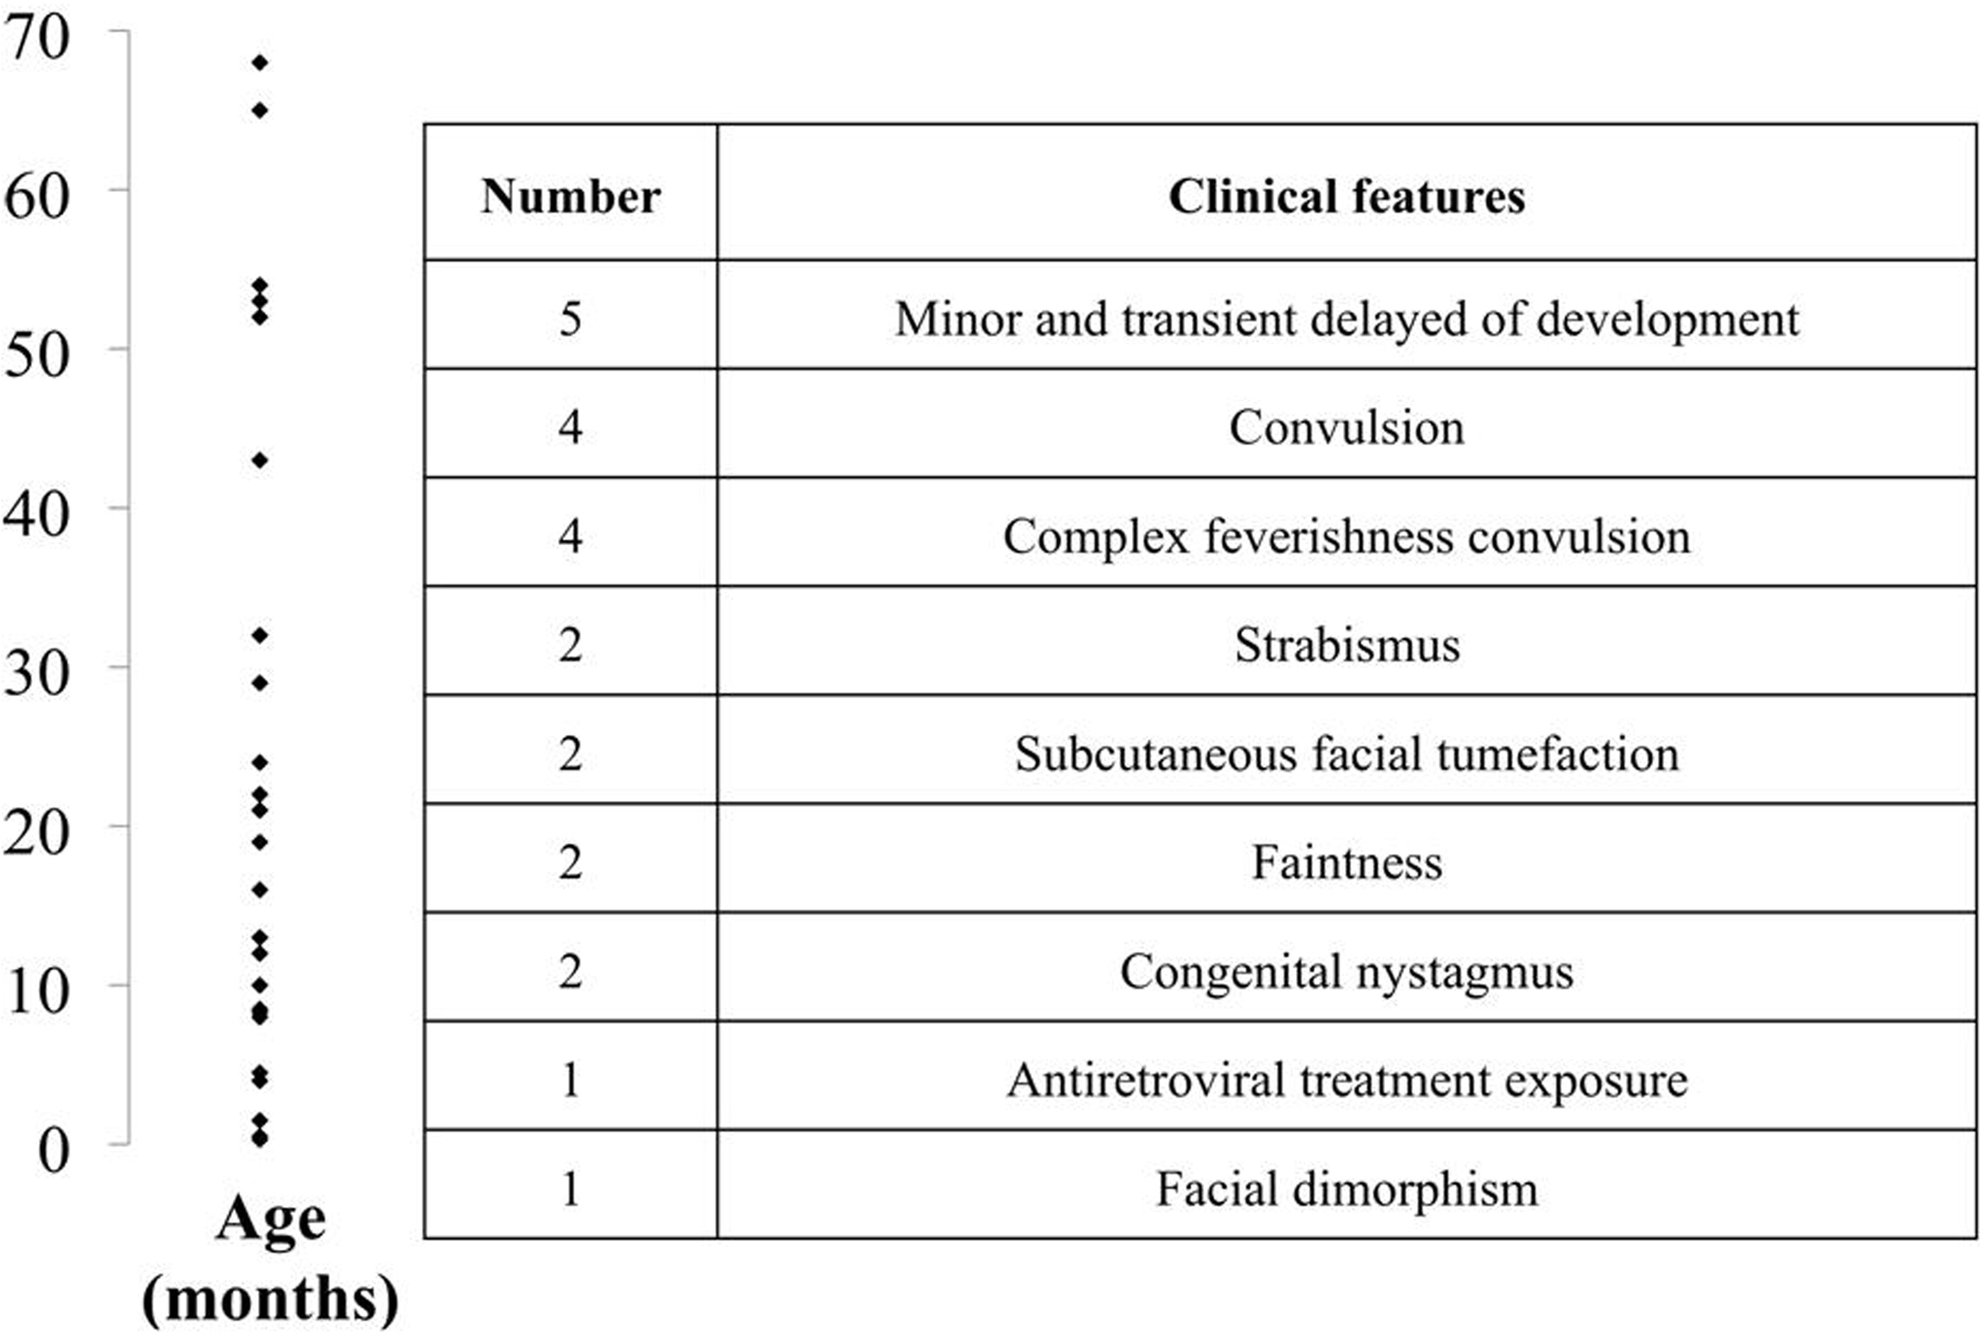
Age distribution (left) and initial clinical features (right) of all subjects included in our control population.
Acquisition
The “Feed and Sleep” method was performed on all neonates under 28 days of age. Older children who were able to hold still during examination were not sedated. All other subjects were sedated by the anesthesiologist who administered a minimal dose of sevoflurane (2%) and monitored the subject to check whether oxygen saturation, arterial blood pressure, heart rate, and P
Cerebral MRIs were performed on a 3-Tesla scanner as described in Baledent et al (2001). 11 Peripheral cardiac synchronization was achieved with retrospective gating to reconstruct 32 phases and reproduce a mean of all cardiac cycles. The velocity encoding parameter was adjusted to be close to the expected maximum velocity of the fluid. For cerebrospinal fluid flow, we started with 5 cm/s at the cervical level (increased to 10 cm/s if aliasing occurred), and 10 cm/s at the aqueduct. For cervical and intracranial blood flows, we started with a velocity encoding parameter of 80 cm/s (increased to 100 cm/s if aliasing). Cerebrospinal fluid and blood flow acquisition slices were positioned perpendicular to the presumed direction of the flows. A 3-dimensional time-of-flight reconstruction was performed to avoid the level of sharp turn in the arteries (Figure 3B and D). For cerebrospinal fluid, the position was set at the level of the C2C3 subarachnoid space and aqueduct (Figure 3A, E, and F) whereas for blood, flows were measured bilaterally in the internal carotids, the vertebral arteries, and in the jugular veins at the C2C3 level (Figure 3A and C).
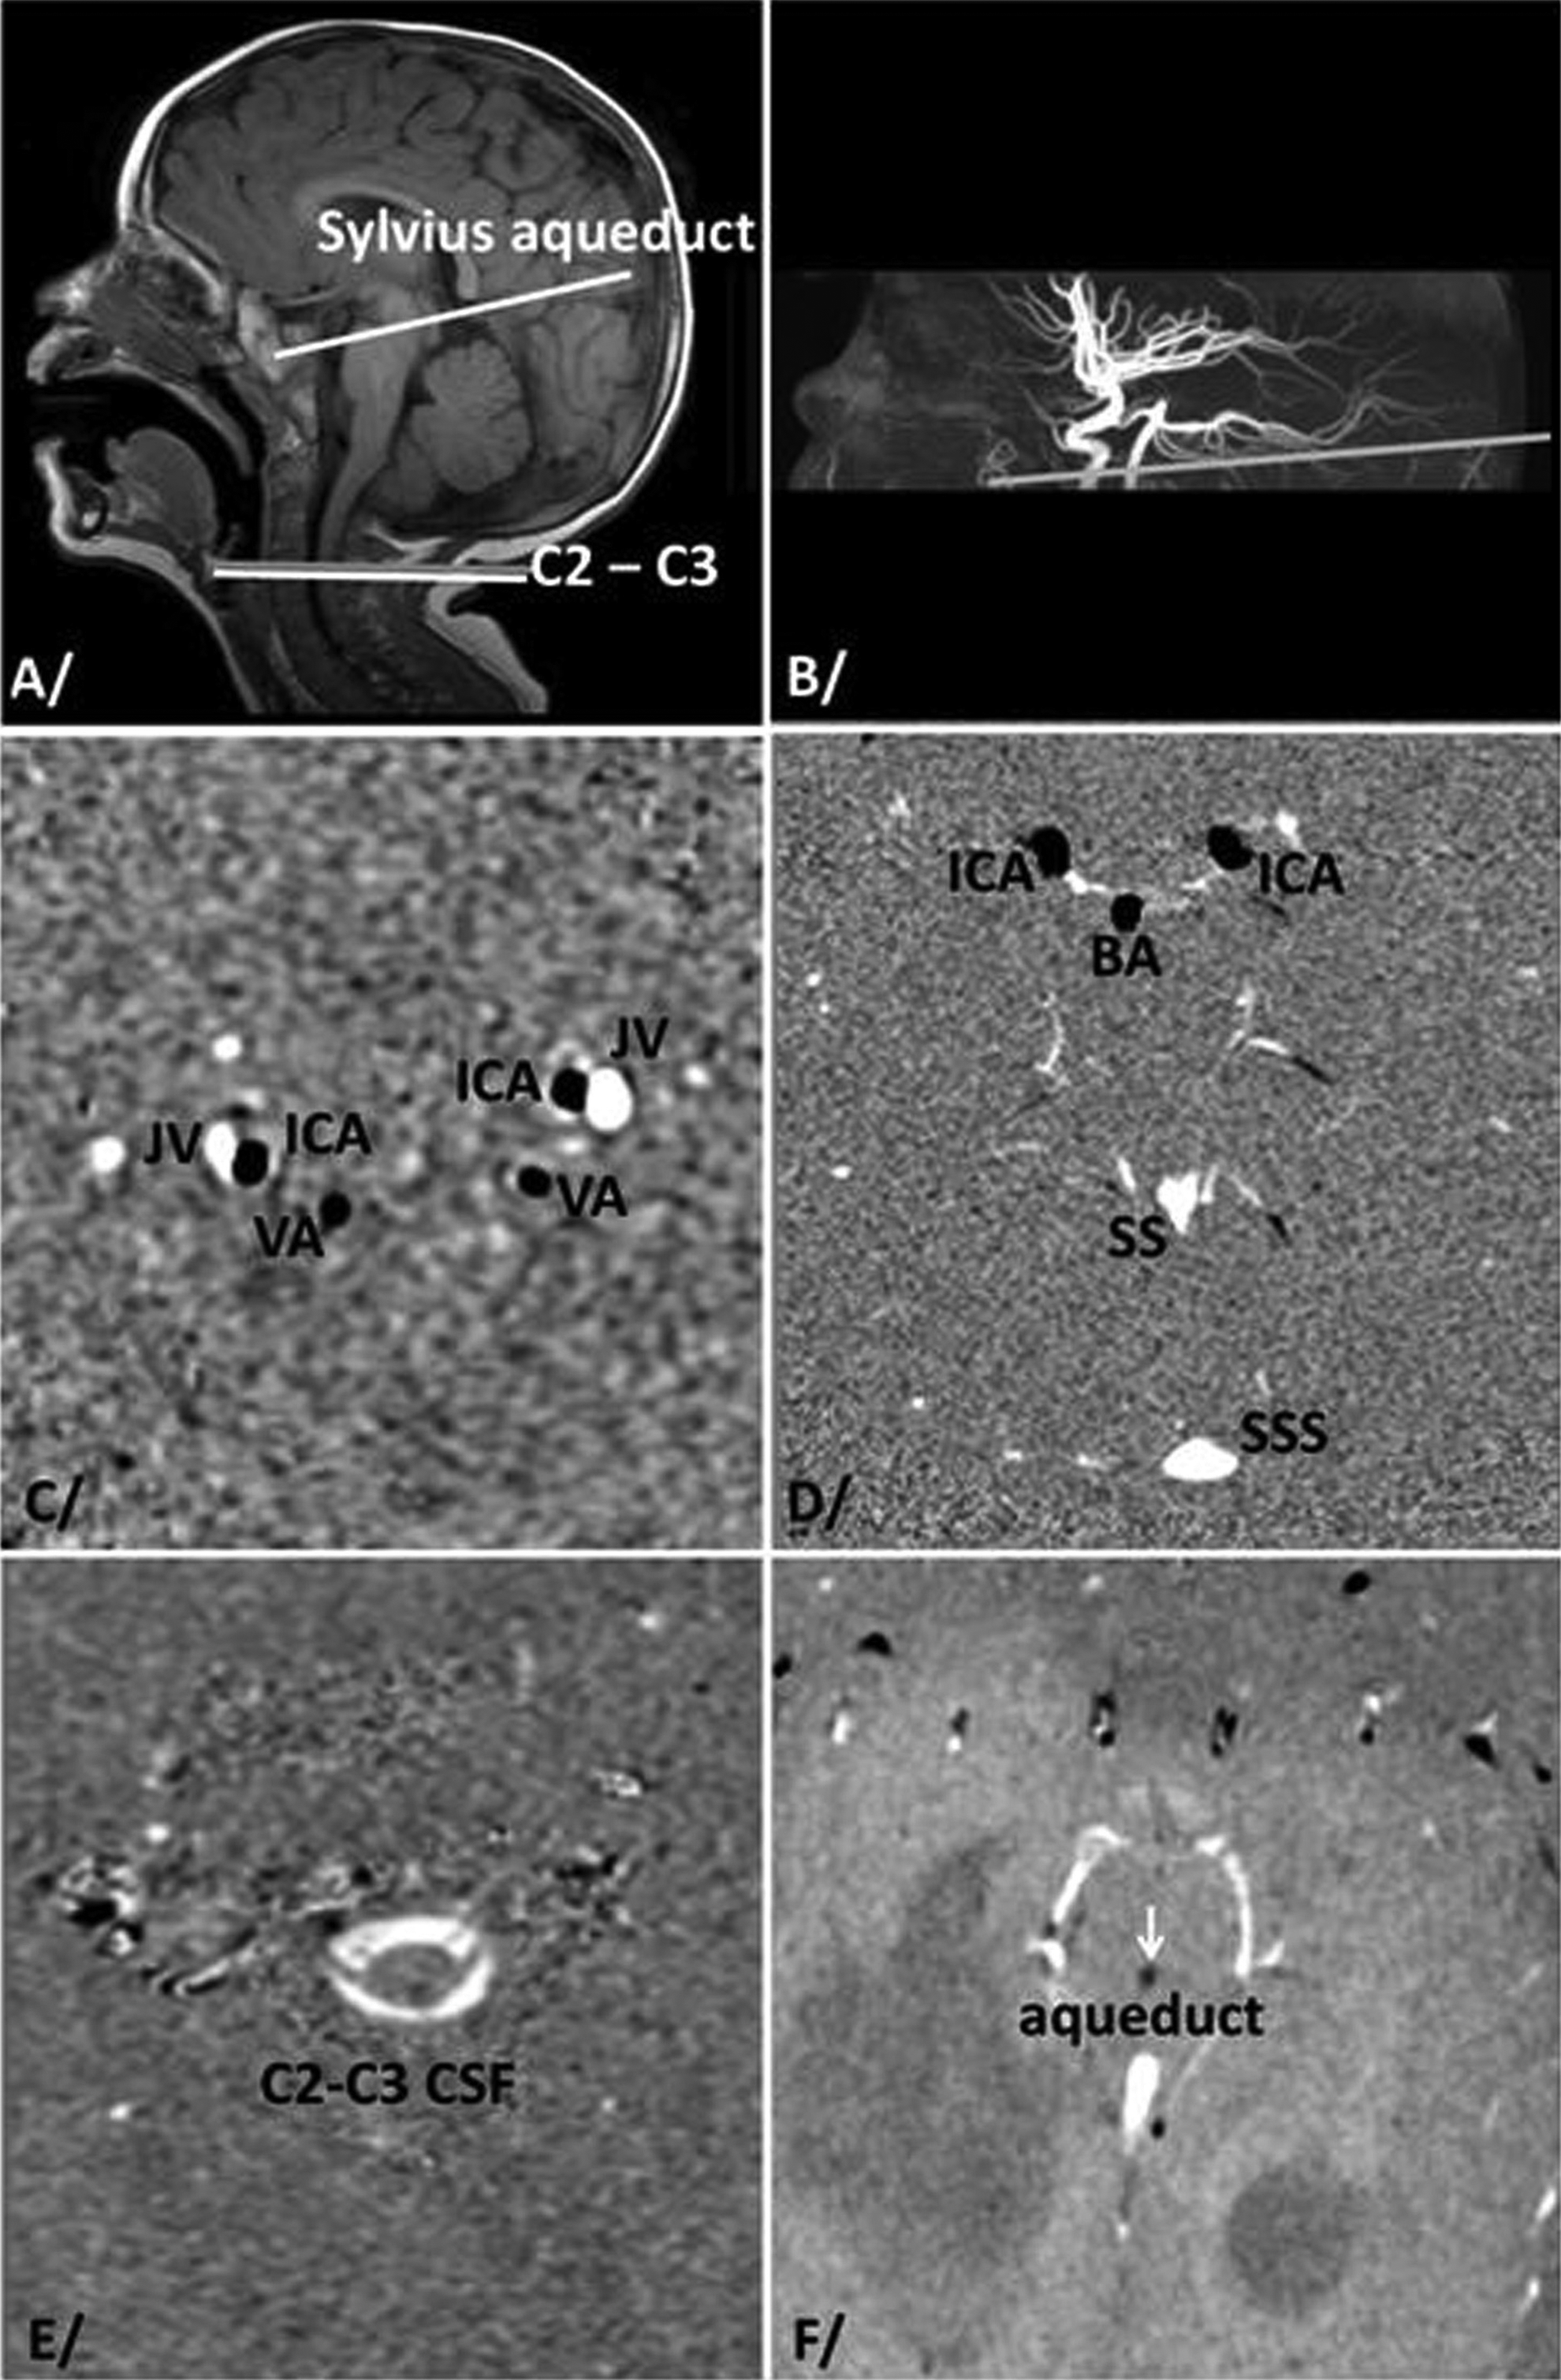
(A) Sagittal scout view used for anatomical localization to quantify cerebrospinal fluid (white) cervical (C2C3 subarachnoid space), Sylvius aqueduct, and cervical blood flows. B) Time-of-flight acquisition is performed to localize the best levels for quantification of both internal carotid and basilar artery flows. (C-F) reproduce 1 of the 32 phases of cardiac cycles with native phase images on vascular cervical (C), intracranial (D), cervical CSF (E), and aqueductal (F). Negative flows (black pixels) represent caudocranial velocities. Positive flows (bright pixels) represent cerebral craniocaudal velocities. Null velocity is represented in gray pixels. BA, basilar artery; C2-C3 CSF, cervical perimedullar subarachnoid spaces; ICA, internal carotid artery; JV, jugular vein; VA, vertebral artery; SS, straight sinus; SSS, superior sagittal sinus.
Analysis
Data were analyzed using an in-house software for an automatic and separate delineation of blood vessel and cerebrospinal fluid compartments. 11 The velocity in each compartment was measured through each of the 32 cardiac phases to chronologically analyze the peak delay of blood flow in jugular vein, cerebrospinal fluid in cervical subarachnoid space, and cerebrospinal fluid in aqueduct, in comparison of the internal carotid systolic peak reference during the cardiac cycle.
Stroke volumes were defined as the average of craniocaudal and caudocranial volumes displaced through the region of interest during the cardiac cycle. 12 They were measured for cerebrospinal fluid in the aqueduct and cervical level and were expressed in milliliters per cardiac cycle.
Cerebral arterial blood flow (CBFa) was defined as the sum of the internal carotids and vertebral arteries (or basilar artery) flows. It was measured at both the cervical (C2C3) and intracranial levels (Figure 3).
Cerebral venous blood flow (CBFv) was measured at the same 2 levels (Figure 3) and was defined as the sum of superior sagittal flow plus straight sinus flow at the intracranial level and jugular vein flow at the cervical level. The blood volume that fills the brain during the cardiac cycle by the arteries is completely flushed out by the veins; thus, cerebral venous blood flow measures need to be adjusted to compensate for the undetectable blood volume that flows through the peripheral veins. First we take the ratio (R) of the mean cerebral arterial volume to the mean venous volume (jugular) measured during 1 cardiac cycle. Then we multiply the mean jugular flow by this factor R to obtain a corrected venous flow and summed this with the arterial flow to provide cerebral venous blood flow ( corrected CBFv). Doing this, we are sure that mean arterial and venous flow are equal ( corrected CBFv) = mean (CBFa). 11,12,18
Arteriovenous flow was calculated by the sum of arterial inflow CBFa and corrected venous outflow corrected CBFv. Consequently, we were able to generate the vascular flow curve during the cardiac cycle. Arteriovenous stroke volumes were calculated by the time integral of both positive and negative parts of the arteriovenous flow to provide the intracranial blood volume change during the cardiac cycle. The flow curves were presented as a percentage of cardiac cycle (Figure 4). The occurrence of the arterial and venous blood peaks were measured in milliseconds, then expressed in percentage of the cardiac cycle. The occurrence of the internal carotid artery peak flow was chosen as the reference to perform group study regardless of heart rate duration. Wilcoxon test (P = .05) was performed to compare all mean flows and Pearson correlation were used to correlate the measured parameters with age.
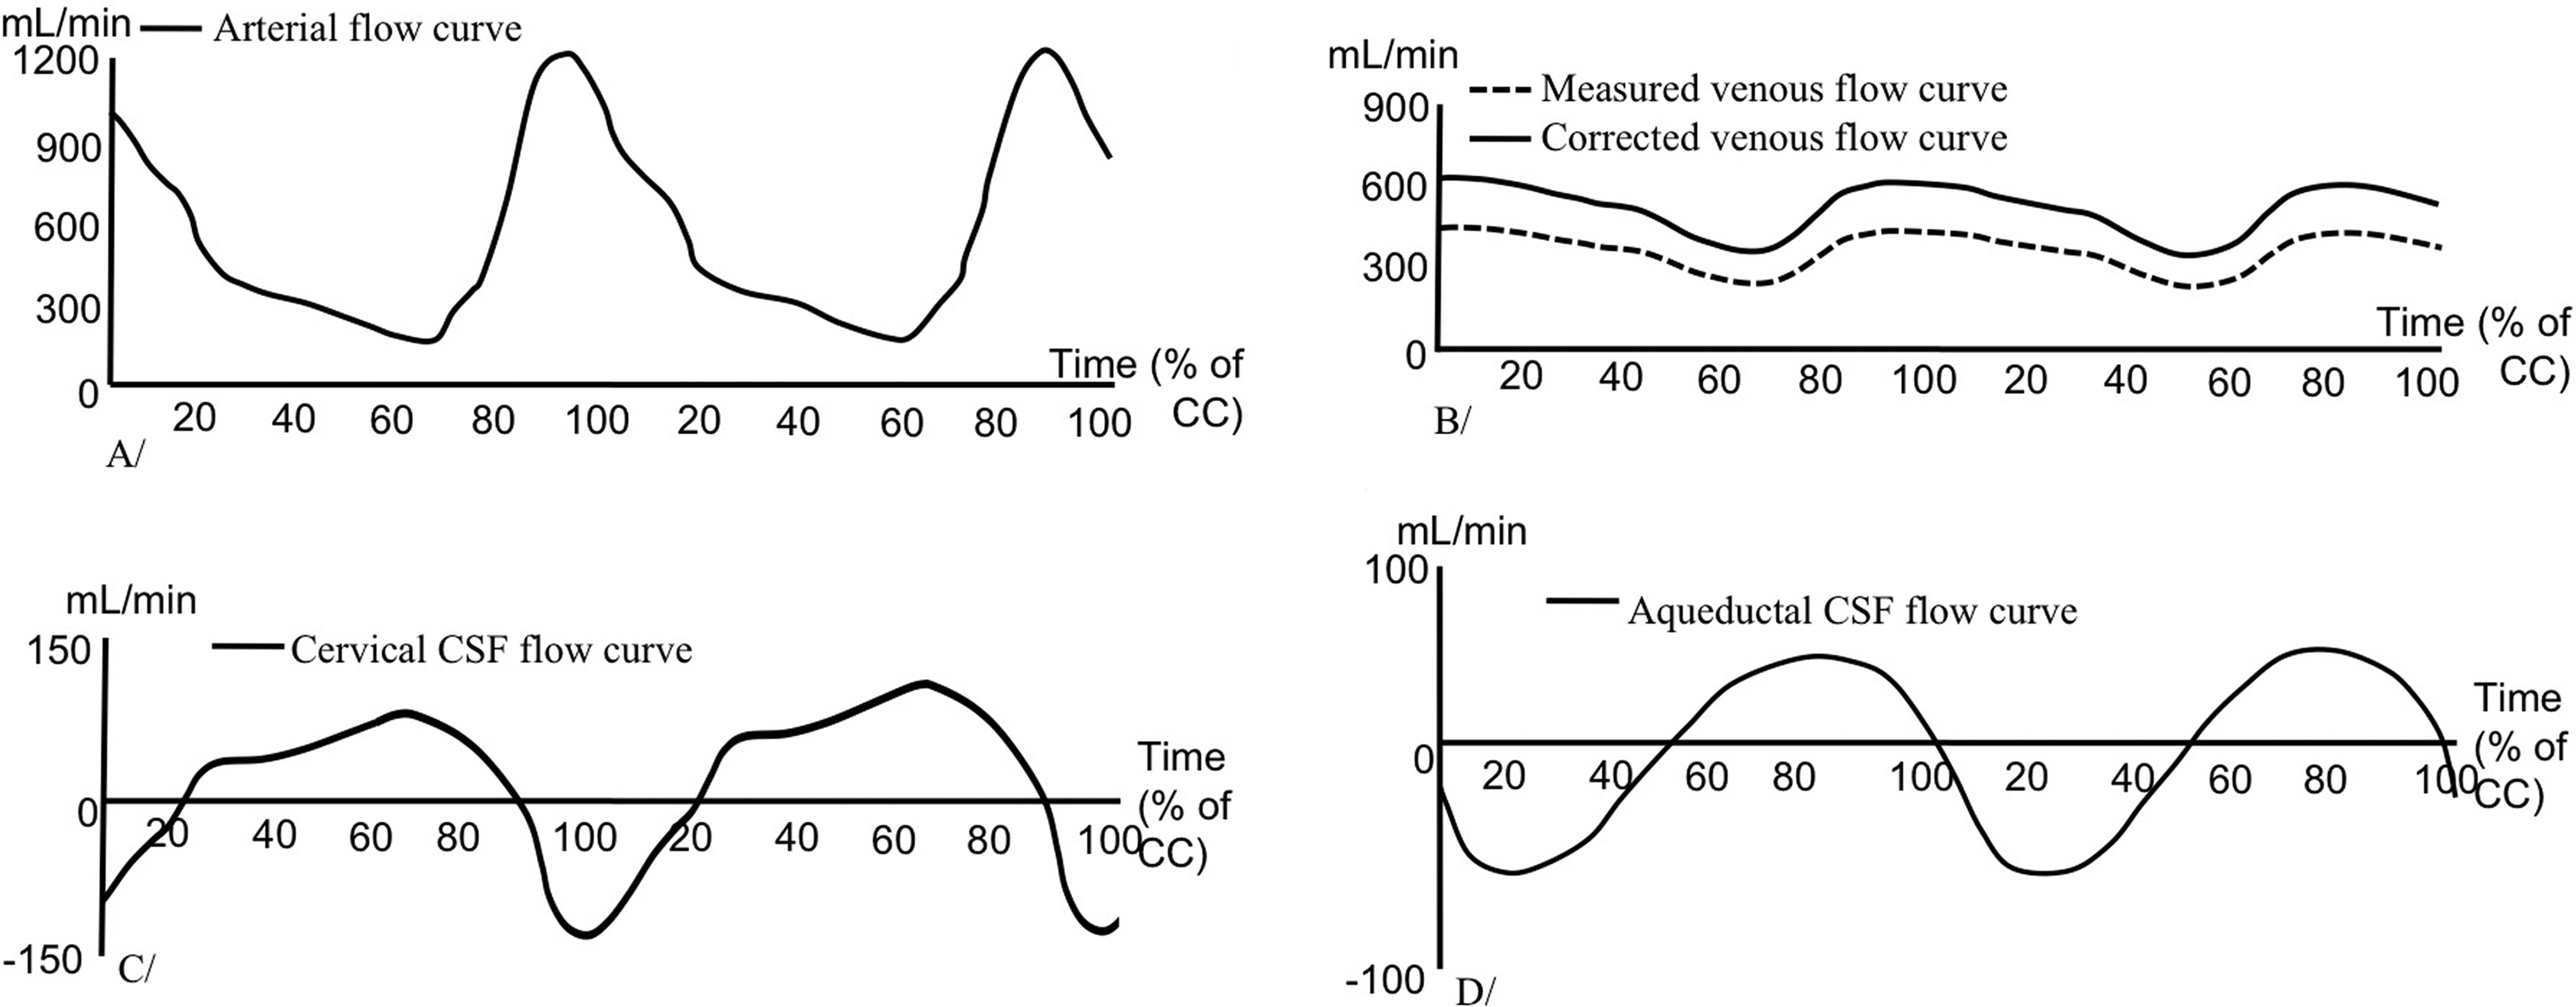
Flow curves plotted in absolute values during 2 CCs in the artery (A), vein (B), cervical CSF (C), and aqueduct during 2 CCs. Positive values correspond to caudocranial direction and negative values to craniocaudal direction. CC, cardiac cycle; CSF, cerebrospinal fluid.
Results
Figure 5A shows arterial, venous, and arteriovenous curve patterns during 2 cardiac cycles in a 21-month-old child. Physiologically large changes in the amplitude of the cerebrospinal fluid and blood flows have been observed with patients’ age but the curve temporal patterns during cardiac cycles do not change.
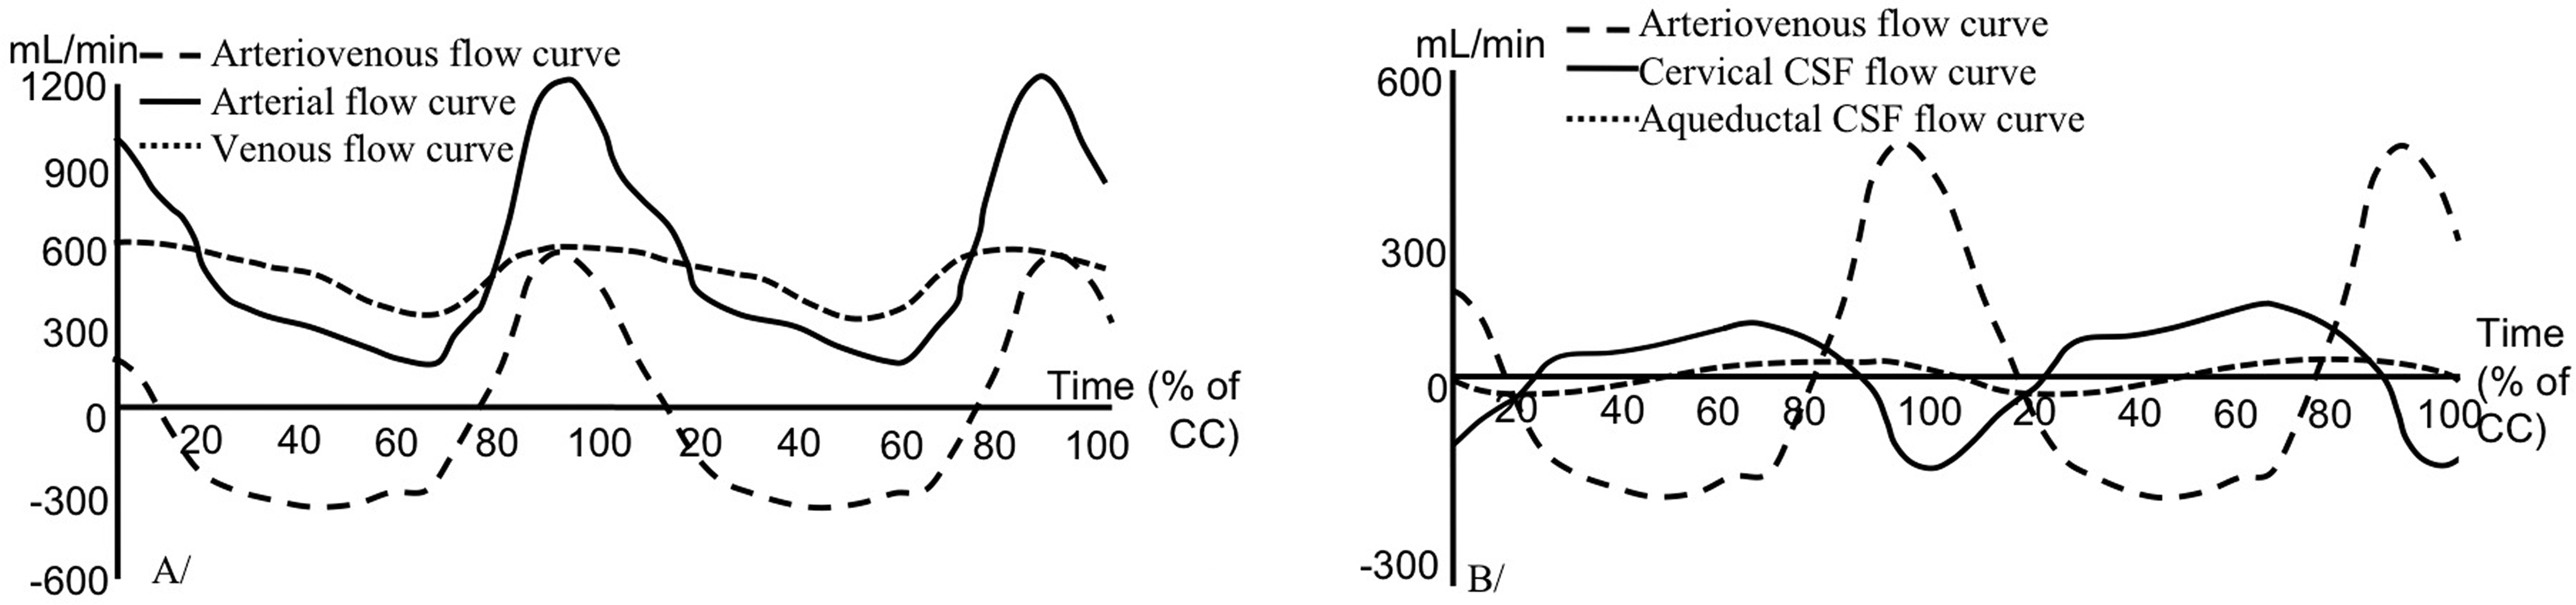
(A) Blood flow curve in a 21-month-old infant during 2 cardiac cycles (CCs). Arterial blood flow is composed of 2 phases: systole, which lasts for 20% of the CC, and diastole, approximately 80%. The systole is short, with a sudden increase of blood inflow from 270 to 1200 mL/min. During diastole, inflow decreases slowly during the rest of the cardiac cycle. Venous flow is not constant during the cardiac cycle. We can observe 2 phases: systole, which is shorter than diastole and slightly shifted in time compared to arterial and increases during systole from 300 to 660 mL/min. Venous and arterial curves show asynchrony, with a slightly delayed venous response to arterial variations. Arteriovenous flow is not constant. Consequently, intracranial blood volume varies during a cardiac cycle. (B) Plots of arteriovenous, cervical, and aqueductal cerebrospinal fluid flows during 2 cardiac cycles. Aqueductal flow is composed of 2 symmetric phases (diastole and systole) with similar amplitude. At the cervical level, we can see 2 phases: systole, composed of a sudden and high outflow of cerebrospinal fluid during roughly 20% of the cardiac cycle, and diastole, showing a slowly increasing cerebrospinal fluid inflow. Cervical cerebrospinal fluid and arteriovenous flows are in opposed phase with a phase shift near 4% of the cardiac cycle.
Blood Flow
Left and right flows in each vessel (internal carotid plus vertebral arteries, and jugular veins) were combined to represent the total volume flowing in and out of the brain. Cerebral blood flows measured at the intracranial level were not significantly different from those measured at the cervical level. Arterial and venous cerebral blood flows increased with the age of the infant (P = .001) (Figure 6A), and cerebral blood stroke volume increased with the age (Figure 6B) as well. The mean arterial cerebral blood flow increased from 180 mL/min at birth to 1330 mL/min around 6 years of age. Combined internal carotid flow represented 69% ± 7 of the entire cerebral arterial blood flow whereas vertebral artery flows represented 31%±7. Jugular vein outflow represented 86%±13 of the cerebral venous blood flow.
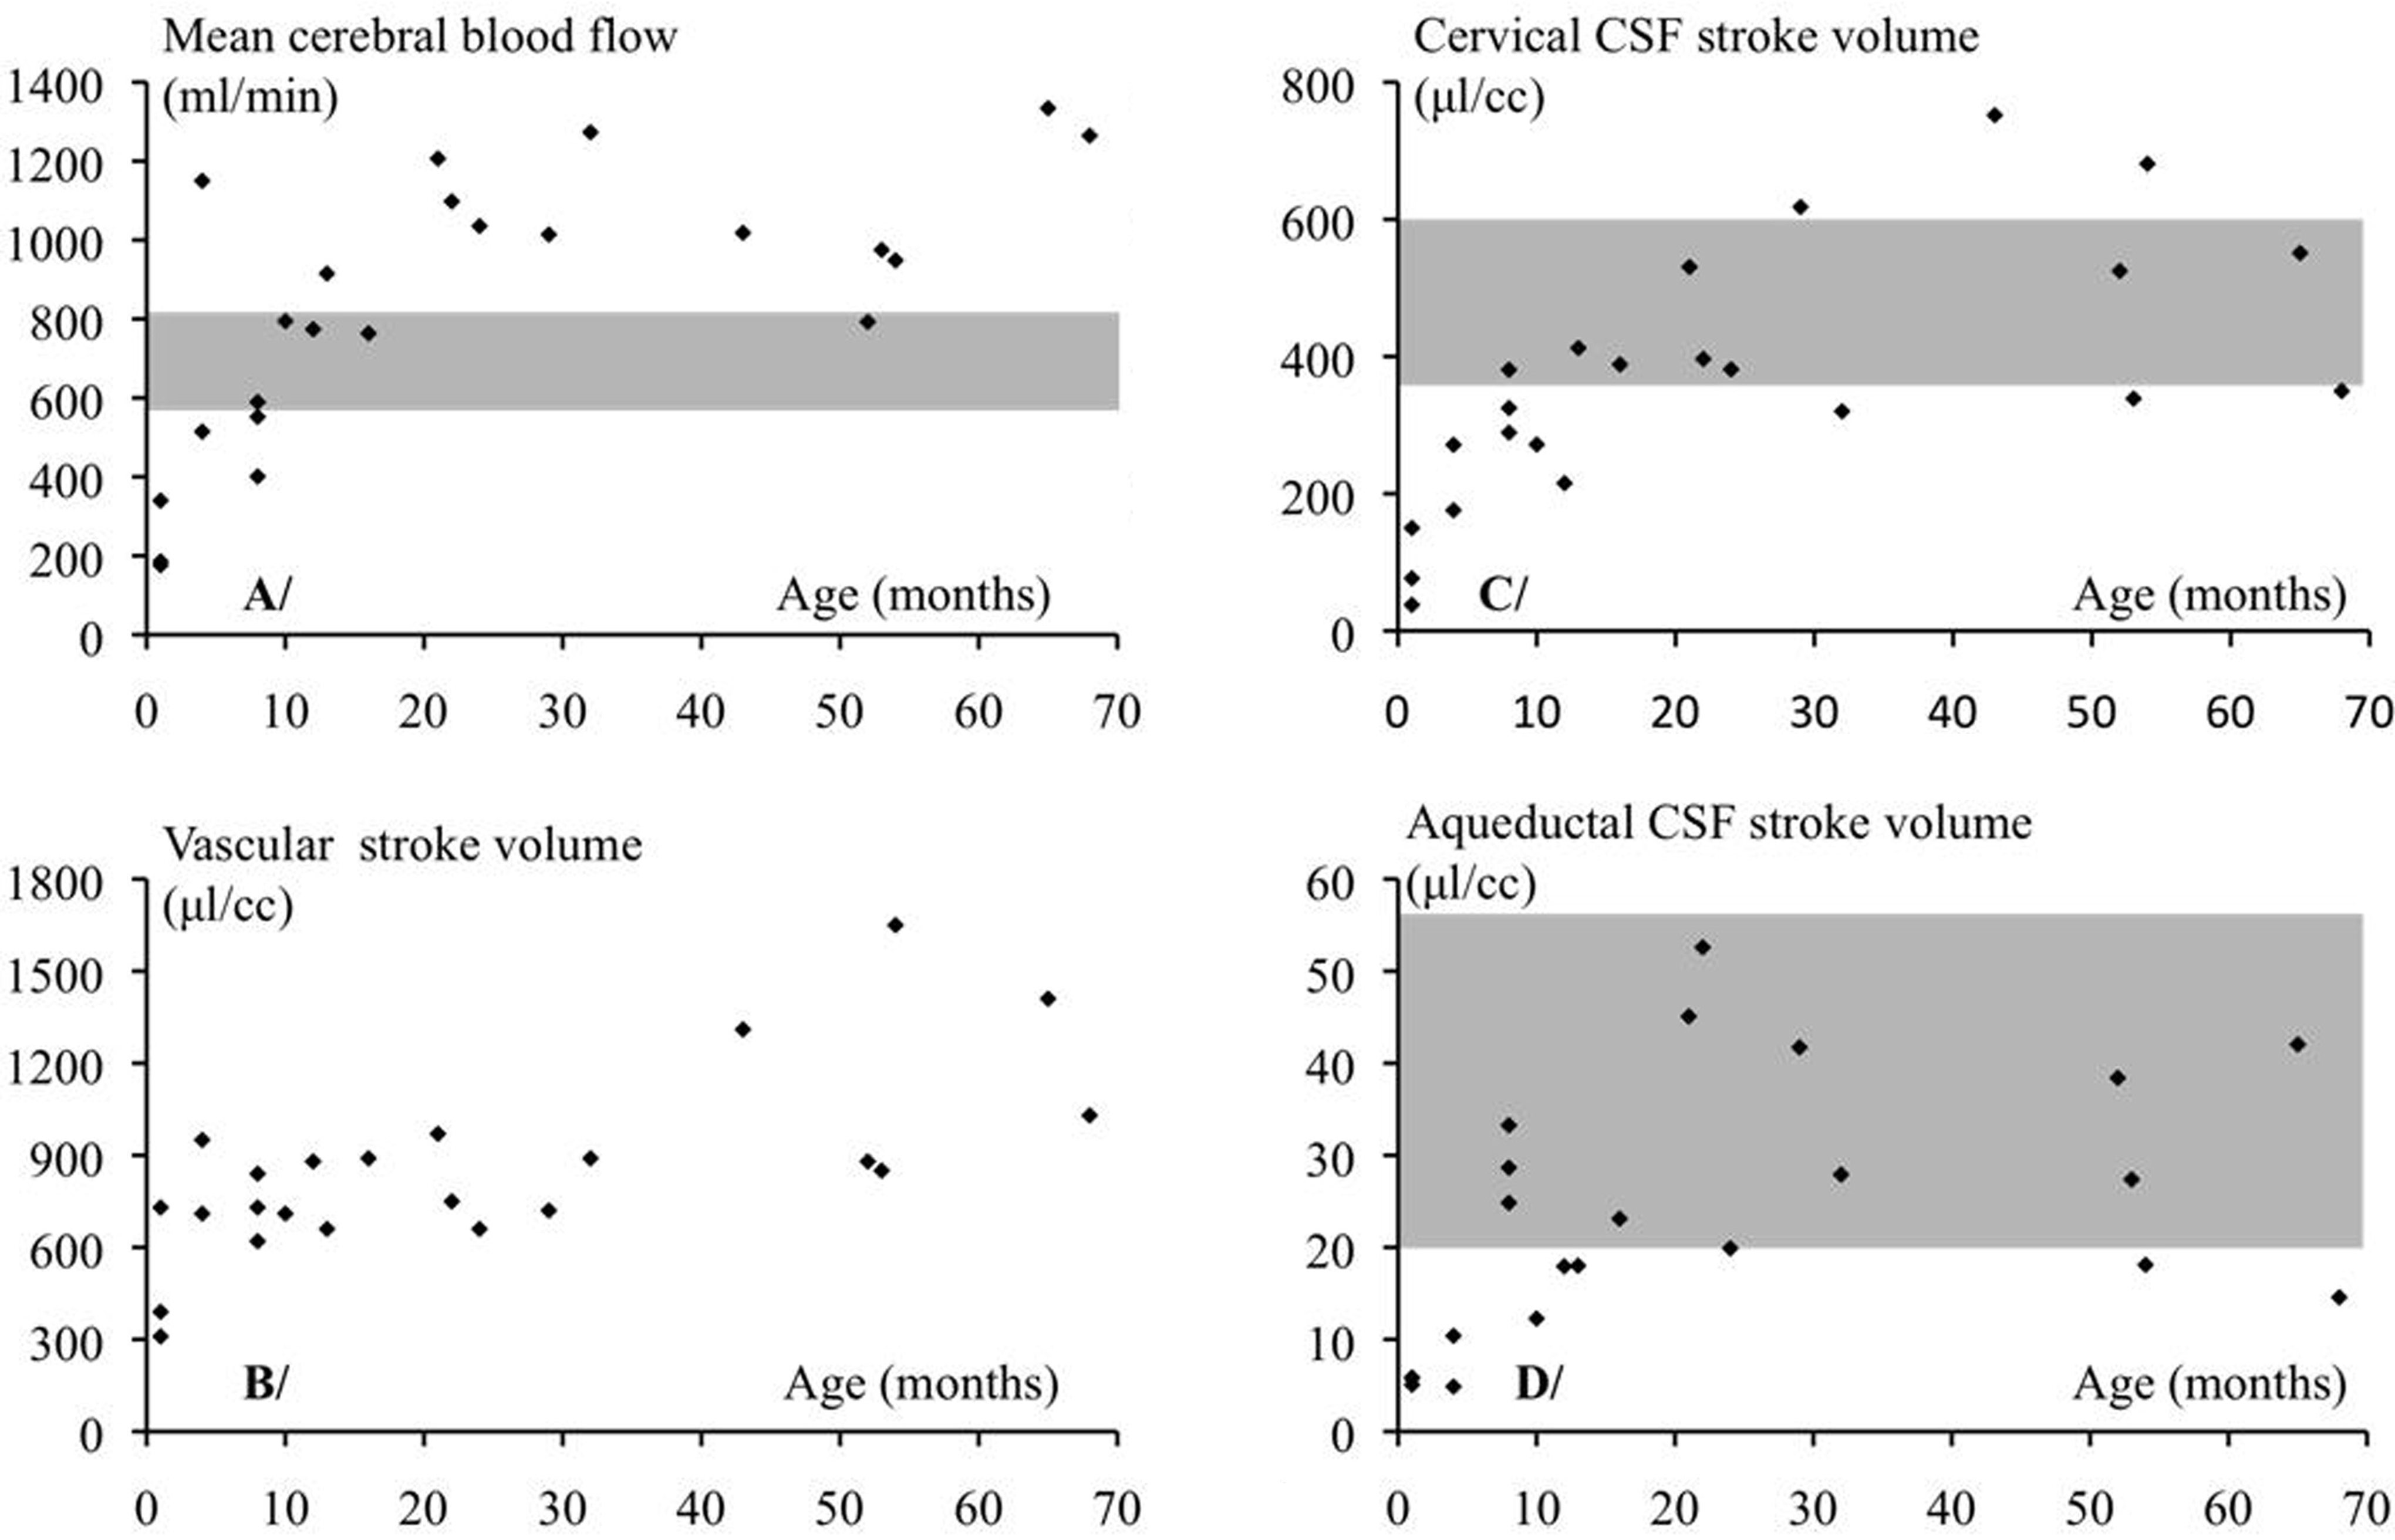
Curves showing the pattern of mean cerebral arterial flow (vertebral and internal carotid artery flows in milliliters per minute) and vascular stroke volume (milliliters per cardiac cycle [CC]) with age (mo). These flows increase with age. At 12 mo, these values are higher than those of adults with 1 standard deviation (gray area). Cerebrospinal fluid stroke volumes increase with age and are similar to adults’ values (gray area): cervical (C) and aqueductal (D).
Cerebrospinal Fluid Flow
Cerebrospinal fluid flows have been calculated individually at 2 levels during the cardiac cycle (Figure 5B). Cervical cerebrospinal fluid stroke volume increased from 38 × 10–3 mL per cardiac cycle in neonates to 752 × 10–3 mL per cardiac cycle in young children. Aqueductal cerebrospinal fluid stroke volume increased from 5 to 53 × 10–3 mL per cardiac cycle (Figure 6C and D). Cervical stroke volume was 16 ± 9 times higher (P < .01) than aqueductal stroke volume in the whole pediatric population.
Temporal Analysis
Whatever the age of these children, the chronology of cerebrospinal fluid, arterial, and venous blood flow peaks, which were normalized as percentage of cardiac cycle, was the same (P < .001) during the cardiac cycle (Figure 7). Following the rise of the cervical internal carotid systolic peak flow, we observed an intracranial internal carotid peak flow (3% of the cardiac cycle), followed by the cervical cerebrospinal fluid peak outflow (4% of the cardiac cycle), then the venous peak outflow (10% of the cardiac cycle), and finally the aqueductal cerebrospinal fluid peak outflow (23% of the cardiac cycle) (Figure 7). The diastolic phase showed minimum internal carotid flow rate at 69% of the cardiac cycle, followed by the cervical cerebrospinal fluid peak inflow (70% of the cardiac cycle), the venous minimum flow rate (78% of the cardiac cycle), and finally the aqueductal cerebrospinal fluid peak inflow (81% of the cardiac cycle) (Figure 7).
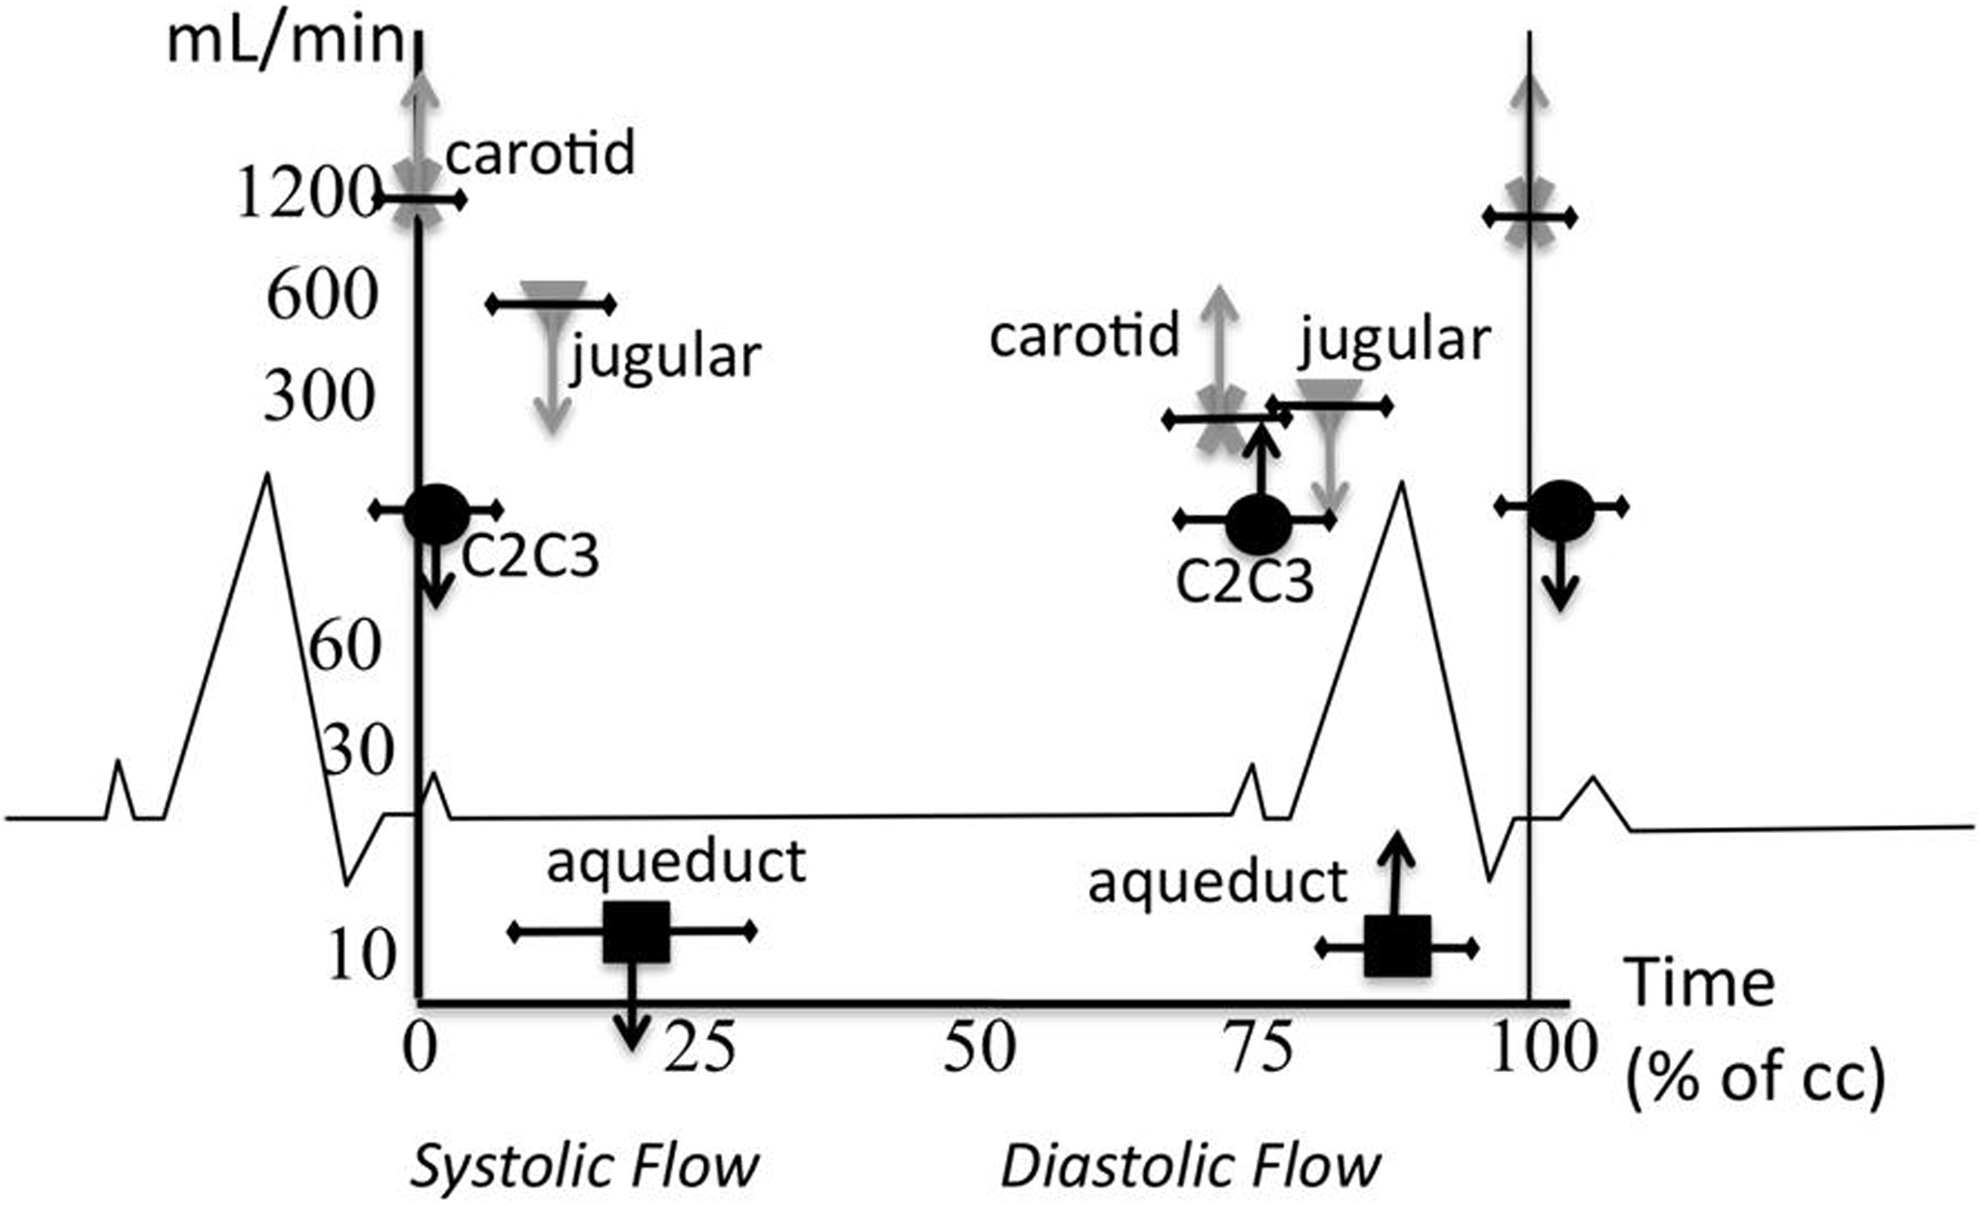
Chronology of maximum and minimum flows of cervical carotid (cross); cervical cerebrospinal fluid (circle); aqueductal cerebrospinal fluid (square); and jugular vein (triangle). Flow values are represented on a logarithmic scale. Downward arrows show craniospinal flow direction, and upward arrows show caudocranial flow direction. The chronology is the same in all our subjects. First we notice cervical internal carotid flow at 0%, followed by cervical cerebrospinal fluid (4% ± 4%), then jugular veins (10% ± 7%), and finally aqueductal cerebrospinal fluid (23% ± 17%). Diastole showed the same chronology.
Discussion
Using phase-contrast MRI, we reliably quantified the intracranial arterial and venous blood flows, the cervical blood flow, and the cervical and intracranial cerebrospinal fluid flows. We also assessed the peak velocities and stroke volumes per cardiac cycle. Finally, we reported the chronologic events of brain hemo- and hydrodynamics and their interactions.
Vascular Analysis and Cerebrovascular Expansion
The mean arterial cerebral blood flow measured at the cervical level was not statistically different than that measured at the intracranial level and hence was not affected by cerebellar blood distributions by the vertebrobasilar system. For this reason, we recommend using cervical-level images at C2C3 where the internal carotid arteries have a straight path unlike their intracranial portion with a tortuous path, which makes it difficult for perpendicular slice acquisition.
In our experiment, we observed increases of cerebral blood flow until 24 months of age, followed by a plateau around 1100 mL/min (Figure 6). Considering the brain after birth weights 350 g and 1400 g after 3 years of age, the conversion demonstrates an increase from 51 mL/min/100 g to 95 mL/min/100 g, which is comparable to single-photon emission computed tomography 19 and sonographic data. 20 This increase was explained by brain perfusion and postnatal adaptive response of the cerebral circulation 21 –23 and later with myelination and brain maturation. 24 Previous studies have shown that cerebral blood flow, normalized with cerebral volume, increased during the first 3 to 4 years of life. 25 The difference in the age limit of this increase was probably due to the fact that in our study cerebral blood flow was not normalized by cerebral volume generally applied in positron emission tomography (PET) studies.
The jugular blood flow represented 86% of the total arterial blood flow, whereas it was only 68% in the adult population. 11,26 The path of intracranial venous drainage is mainly due to the jugular veins in newborns because the posterior internal vertebral venous plexus are very small in the fetus and newborn. 27 Several authors pointed out the potential role of venous drainage in intracranial pressure regulation 28 that takes part in ventricular dilation genesis 26 during the cardiac cycle. Nevertheless, other investigators suggest that intracranial pressure regulation has nothing to do with ventricular dilation. In general, jugular drainage is dominant, except in many pathologies, 25 and auxiliary veins contribute significantly to cerebral drainage. Posture changes, intrathoracic pressure, and positive-pressure breathing promoted modification of venous drainage. 29 –31
The cranium is a closed box with limited compliance that induces an interaction between cerebrospinal fluid and blood volumes. Arterial blood expansion has to be balanced by venous outflow to maintain a pressure equilibrium. This means that during the cardiac cycle, brain vascular volume changes and is compensated by modifications of cerebrospinal fluid volume and generates intracranial pressure amplitude changes due to craniospinal compliance. 11,26
Delay between arterial systolic peak flow and jugular peak flush-out was used by few authors to characterize brain compliance. 14,28 It was reported that intracranial pressure waveform results from an interaction between arteriovenous and cerebrospinal fluid flow. 26 Alperin et al 18 had already proposed a method for intracranial pressure measurement in baboon using phase-contrast MRI. This method was not validated in human with the gold standard intracranial pressure monitoring. Interaction between cerebrospinal fluid, cerebral blood flow, intracranial pressure, and craniospinal compliance is now accepted by all investigators. A recent study has shown a positive correlation between MR-intracranial pressure and ventriculoperitoneal shunt valve opening pressure setting in hydrocephalic children. 32 Nevertheless, the methodology used to measure intracranial pressure by MR is mainly based on intracranial volume change during the cardiac cycle. This value is too small (∼1 mL) and is subject to variability due to limitations of phase-contrast MRI. 11
Arteriovenous flow curve was composed of flush-in and flush-out periods (Figure 5). The flush-in period was short and salient and was composed of one large positive bump (Figure 5). This demonstrates that the fundamental and harmonics model applied for adults 33 is not valid for newborns because of these differences in intracranial pressure patterns. We also noted that vascular flow (Figure 6) increased with age and is approximately twofolds that of adult values. 11 These results suggested a modification of intracranial flow due to changes in the metabolic and/or cardiovascular functions. Wintermark et al 31 have shown that there is an increase in cerebral blood fraction of cardiac output between 10% and 60% in the first 2 years of life. The increase of cerebral blood flow is not only a consequence of an increase of global aortic flow but also a consequence of a specific fraction of brain flow due to metabolic increases. 25,34,35
Cerebrospinal Fluid Dynamics and Contributions to Cerebrospinal System Homeostasis
Stroke volumes of cervical and aqueductal cerebrospinal fluid increased with age, and cerebrospinal fluid flow oscillation in the aqueduct was less than 5% of cerebrovascular expansion. This value highlights the weak contribution of the ventricular system in response to vascular expansion, and its alteration was observed in hydrocephalus. 14 Noteworthy to add that small cerebrospinal fluid volume displacement in the ventricular compartments highlighted the limited compliance of the ventricular system and its minor contribution to the instantaneous regulation of intracranial pressure. Cervical cerebrospinal fluid flow oscillation represented 43% ± 16% of cerebrovascular expansion, without significant difference with regard to fontanels closure. Newborn and child brains presented a cerebrovascular expansion during the systolic phase that was offset by both the compliance of the fontanels and the intracranial subarachnoid cerebrospinal fluid flushing out to the spinal subarachnoid space. A delay of venous outflow, preceded by cerebrospinal fluid flushing through the spinal canal was reported in adults, 36 but never on child brain. Newborn and child brain presents a cerebrovascular expansion during the systolic phase and was offset by both the compliance of the fontanels and the intracranial subarachnoid cerebrospinal fluid flushing out to the spinal subarachnoid space. The reason might be related to blood viscosity (3 times higher than that of cerebrospinal fluid) and blood flow that follows a pathway with more resistive compliance before reaching the rigid intracranial sinus and ending up in compliant jugular veins. This might explain the lag observed between arterial and venous flows. These results demonstrated the crucial role of good communication between the intracranial and spinal compartments of the cerebrospinal fluid during the cardiac cycle to avoid large increases of intracranial pressure amplitude. Alteration of these spinal spaces might cause hydrocephalus development often seen in newborns with intraventricular hemorrhage.
Temporal Analysis
Although the cranial compartment is not always rigid in the pediatric population because of fontanels, the chronology of blood and cerebrospinal fluid peak flows during the cardiac cycle was preserved (Figure 7). Fontanels add a complementary mobile compliance, and we found that cervical cerebrospinal fluid oscillation occurs at the same time as in adults. This means that the craniospinal system requires an oscillation of the cerebrospinal fluid in the spinal canal, which suggests that fontanels are not the only intracranial compliance. Furthermore, in young infants, the normalized volume shift represents about 11% of the stroke volume against 50% in more mature children; hence, the “elasticity” of the fontanel remains an important parameter of cerebrospinal fluid dynamics in the young infant. We hypothesize that cervical cerebrospinal fluid flushing out to the dural sac via the spinal subarachnoid spaces represents the main craniospinal compliance in front of fontanels.
The arterial inflow of blood is associated with parenchyma expansion and caused a transient increase of intracranial pressure. Increased intracranial pressure generates blood drainage thru the cortical veins. It probably takes part in delayed venous peak outflow. This might explain why blood flow waveforms and cervical cerebrospinal fluid flow waveforms are closely correlated. We hypothesize that following blood outflow from the cortical venous system, a pressure gradient appears between the intraventricular and infratentorial spaces. Consequently, we observe a flush of cerebrospinal fluid venting by intraventricular spaces to infratentorial spaces.
Limitations
The sample size is one of the major limitation in this study. For ethical considerations, we were unable to recruit healthy infants, but our subjects were considered healthy because of their clinical outcome. Another limitation is that craniospinal fluid dynamics depends on many factors such as fontanel size, heart rate, cerebral blood flow, and resistance to cerebrospinal fluid flow in the aqueduct and subarachnoid space areas. These parameters are different in our population and might explain the difficulty to achieve higher accuracy like adult studies. For this reason, the results were presented versus age (Figure 6). Phase-contrast MRI has also few limitations and cannot be acquired during a single cardiac cycle but averages several cardiac cycles to reconstruct these flows. Finally the pixel size (∼0.55 mm2) is still a limitation for aqueduct acquisition (∼10 pixels).
Conclusion
Some neurologic neonate and infant pathologies result from an alteration of the compliance. Phase-contrast MRI gives a new noninvasive approach of intracranial volume changes during the cardiac cycle and could help to understand intracranial pressure and craniospinal compliance alteration.
The preliminary values obtained for newborn aqueducts represented a model of ventricular cerebrospinal fluid movement and should be accurate enough in pathology to show whether there is a blockage or hyperdynamic cerebrospinal fluid in hydrocephalus patients.
This is the first phase-contrast MRI study presenting global cerebrospinal fluid and blood flow interactions during newborns’ and children’s growth. Normal values are proposed and could be used as reference and compared to pathologic patients to help understand the pathophysiology of cerebrospinal fluid and blood disorders in the pediatric population.
Footnotes
Acknowledgments
The authors thank the anesthesiology and radiography staff for their contributions to this study.
Author Contributions
CC processed and analyzed the images and prepared the paper. CG-J selected the patients, read and reported the magnetic resonance images (MRIs). MM discussed the findings and wrote the paper. RB discussed the findings. VC and BK processed the PC images. OB was the principal investigator and coordinator of this research.
Declaration of Conflicting Interests
The authors declared no potential conflicts of interest with respect to the research, authorship, and/or publication of this article.
Funding
The authors received no financial support for the research, authorship, and/or publication of this article.
Ethical Approval
This study was approved by the regional ethical committee: Comité de protection des personnes, Nord-Ouest 2, France (DGS-2006/0114).