
Abstract
Status epilepticus is a common neurologic emergency in children. Pediatric medical centers often develop protocols to standardize care. Widespread adoption of electronic health records by hospitals affords the opportunity for clinicians to rapidly, and electronically evaluate protocol adherence. We reviewed the clinical data of a small sample of 7 children with status epilepticus, in order to (1) qualitatively determine the feasibility of automated data extraction and (2) demonstrate a timeline-style visualization of each patient’s first 24 hours of care. Qualitatively, our observations indicate that most clinical data are well labeled in structured fields within the electronic health record, though some important information, particularly electroencephalography (EEG) data, may require manual abstraction. We conclude that a visualization that clarifies a patient’s clinical course can be automatically created using the patient’s electronic clinical data, supplemented with some manually abstracted data. Future work could use this timeline to evaluate adherence to status epilepticus clinical protocols.
Status epilepticus is a neurologic emergency, associated with a mortality rate ranging from 2.7% to 5.2% in pediatric patients. 1 Status epilepticus is characterized by unremitting seizures, and affects 41 patients per year per 100 000 population. 2 In children, more than half of the episodes of status epilepticus occur in individuals with no previous history of epilepsy. When an etiology can be determined, common causes include low antiepileptic drug levels in epilepsy patients, prolonged febrile seizures, metabolic derangement, or central nervous system infections. 3
The risk of neurologic injury is proportionate with seizure duration; therefore, immediate medical treatment is indicated to abort ongoing seizures. 4 To provide efficient and coordinated treatment, many hospitals have integrated best available clinical evidence into detailed treatment protocols. The evidence is unclear on the effectiveness of protocol adherence. A retrospective chart review of children presenting with seizures to the emergency department found that adherence to a protocol successfully treated 55 episodes in 46 patients, 5 although there was no comparison group in the study. Conversely, a prospective study of 54 adults with status epilepticus found that patient outcomes at an academic hospital, which followed a status epilepticus protocol closely, were not different from outcomes at regional hospitals, which often deviated from the status epilepticus protocol. 6
Evaluating adherence to treatment protocols can be valuable for quality improvement, to identify systematic gaps that limit protocol effectiveness. However, routinely conducting such an evaluation requires review of a large amount of clinical data. 7 An automated tool to extract and display the data would allow clinical teams to regularly conduct reviews and continuously improve care, as recommended by evidence-based quality improvement strategies. 8
Recent innovations in health care may address the challenge of data collection to support evaluation of clinical protocols. For example, the recent increase in adoption of electronic health record systems 9 may allow hospitals to automate collection of the necessary data. In addition, freely available software 10 may allow clinical teams to rapidly assess protocol adherence through well-designed visualizations.
Given the complexity of electronic health record data, the feasibility of extracting such data is unclear. The goal of this study was to determine the feasibility in developing an automated evaluation of adherence to a status epilepticus protocol by (1) determining the degree of difficulty in extracting key data elements from an electronic health record and (2) demonstrating how such data elements could be visualized by the clinical team.
Methods
Study Design
We conducted a retrospective chart review on a convenience sample of pediatric patients admitted for status epilepticus who received treatment per our institution’s pediatric status epilepticus protocol. The clinical coinvestigators of the study provided a list of pediatric patients who were treated for status epilepticus. We extracted the clinical data from the charts in the electronic health record system, qualitatively described the process, and created a graphic timeline to display the data.
The study was approved by the Weill Cornell Institutional Review Board.
Subjects and Settings
The clinical coinvestigators of the study provided a list of 7 pediatric patients who were treated for status epilepticus from 2012 to 2013 in the pediatric intensive care unit at an academic, urban, tertiary care hospital. These children were a subset of the status epilepticus patients at Weill Cornell, selected based on physician memory of notable cases. The pediatric status epilepticus protocol was not finalized until the end of 2013, and thus we did not expect care of the study patients to adhere to the protocol.
Data Source
Patient charts were accessible through the hospital’s inpatient electronic health record, Allscripts (Chicago, IL), also known as Sunrise Clinical Manager and previously known as Eclypsis.
Data Extraction
Clinical data
We manually extracted the following data elements from the electronic health record, based on the specifications of the clinical protocol, for the first 24 hours of care. Date and time of patient admission. Medications, specifically antiepileptic drugs, mode of administration, and time of administration. Lab values, specifically glucose, phenytoin, and phenobarbital levels. Time of first vital sign recordings, oxygen saturation, heart rate, and blood pressure. Procedures, including arterial line placement, central line placement, endotracheal intubation, and electroencephalography (EEG). Time of transfer to the pediatric intensive care unit. Abbreviated clinical history, including etiology, length of stay, and outcome (death, discharge, or transfer).
Cognitive work
We measured the cognitive work required to obtain each data element in 2 ways. First, we recorded the number of mouse clicks required to access each data element. Mouse clicks have been shown to cause mental fatigue due to the repetitive nature of the task. 11 On average, it would take 6 clicks to open the patient chart; we report the number of additional clicks needed to reach each data element. Second, we indicated if a physician’s expert opinion was needed to determine the value of each data element.
Qualitative Analysis
Data validity
The validity of the extracted data elements was verified with practicing clinicians (ZG, SP, JP, JH). We qualitatively summarized our observations on the validity of the data.
Degree of difficulty
We describe the degree of difficulty in extracting the data points along a 4-tiered scale, using the following criteria. Note that our rubric uses a quantitative threshold to distinguish “very easy” from “somewhat easy,” but that the remaining criteria are qualitative. A very easy data element was consistently recorded in all patients, required few clicks (5 or fewer), and required no expert review. A somewhat easy data element could be reliably found in all patients and did not require expert review, but was either recorded inaccurately in some places or required a lengthy search. A somewhat difficult data element was inconsistently recorded in different patients or needed proxy measures to identify, though no expert review. A very difficult data element required expert review. Two reviewers (BH and ZG) assessed the degree of difficulty via discussion and consensus.
Visualization
Visualizations compress data to enhance understanding, illustrate trends, and emphasize aspects of highest interest to the user. 12 Our approach was to visually separate medication administrations from other events, but present both along a common time scale (ie, a timeline). 13 Medications administered by continuous infusion were colored in a gradient to demonstrate differences in dosage.
Following the manual data extraction, we compiled the data and then used the R software 10 with the “timeline” package 14 to create timelines for all 7 patients to visualize the first 24 hours of care. We also illustrate how the timeline might look if the protocol were followed exactly for a theoretical patient requiring aggressive therapy.
In order to create the timelines, we separated the data into 2 main categories: medications data and “events” data. The medications data consisted of the medication name, dose, time given, and (for infusions) time stopped. Medications were given abbreviations to avoid crowding the final visualization output. The events included the first recorded measure of the vital signs, lab results, the time the EEG recording began, and therapeutic procedure times.
Results
Patient Characteristics
We reviewed the histories of 7 children with status epilepticus (Table 1). Ages ranged from 3 months to 12 years. There were 3 boys and 4 girls. Length of stay ranged from 7 to 62 days. Etiologies included viral, metabolic, autoimmune, and traumatic. Medications included benzodiazepines, barbiturates, other antiepileptics, anesthetics, or vitamins. Three patients were discharged home, one was transferred to an acute care hospital close to the child’s home, one was transferred to a skilled nursing facility, and two died.
Summary of Patient Information.
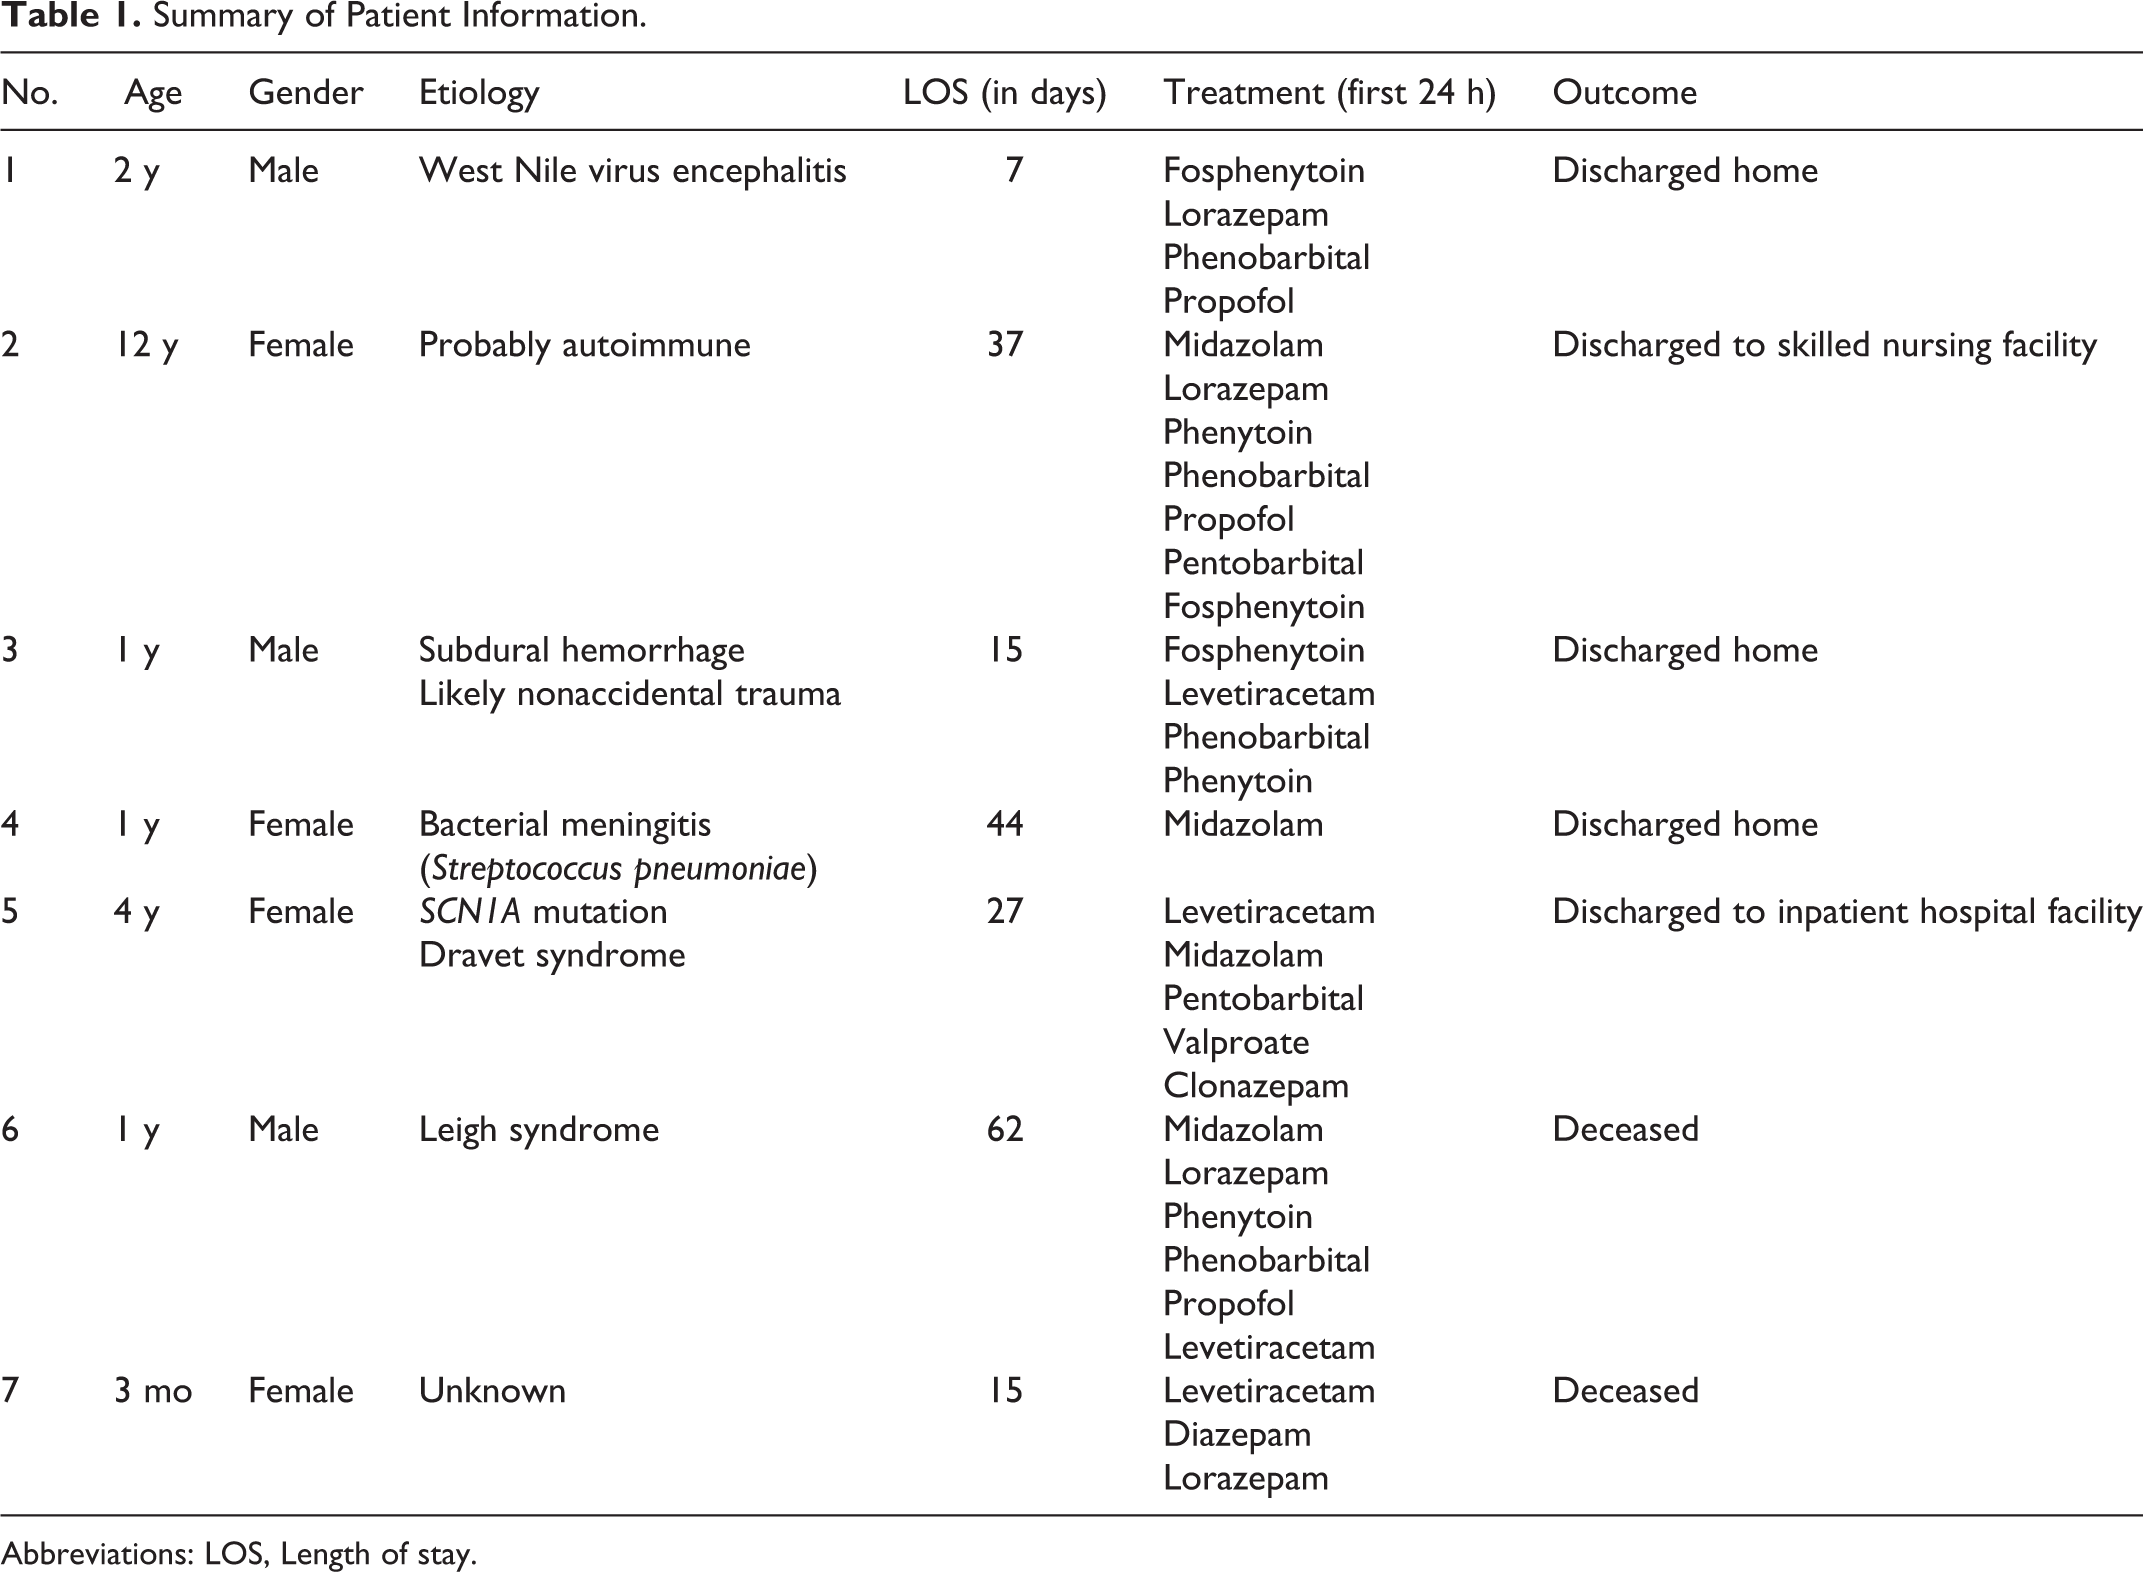
Abbreviations: LOS, Length of stay.
Data Extraction
The process and degree of difficulty in extracting the data points is qualitatively described below and summarized in Table 2.
Data Extraction.
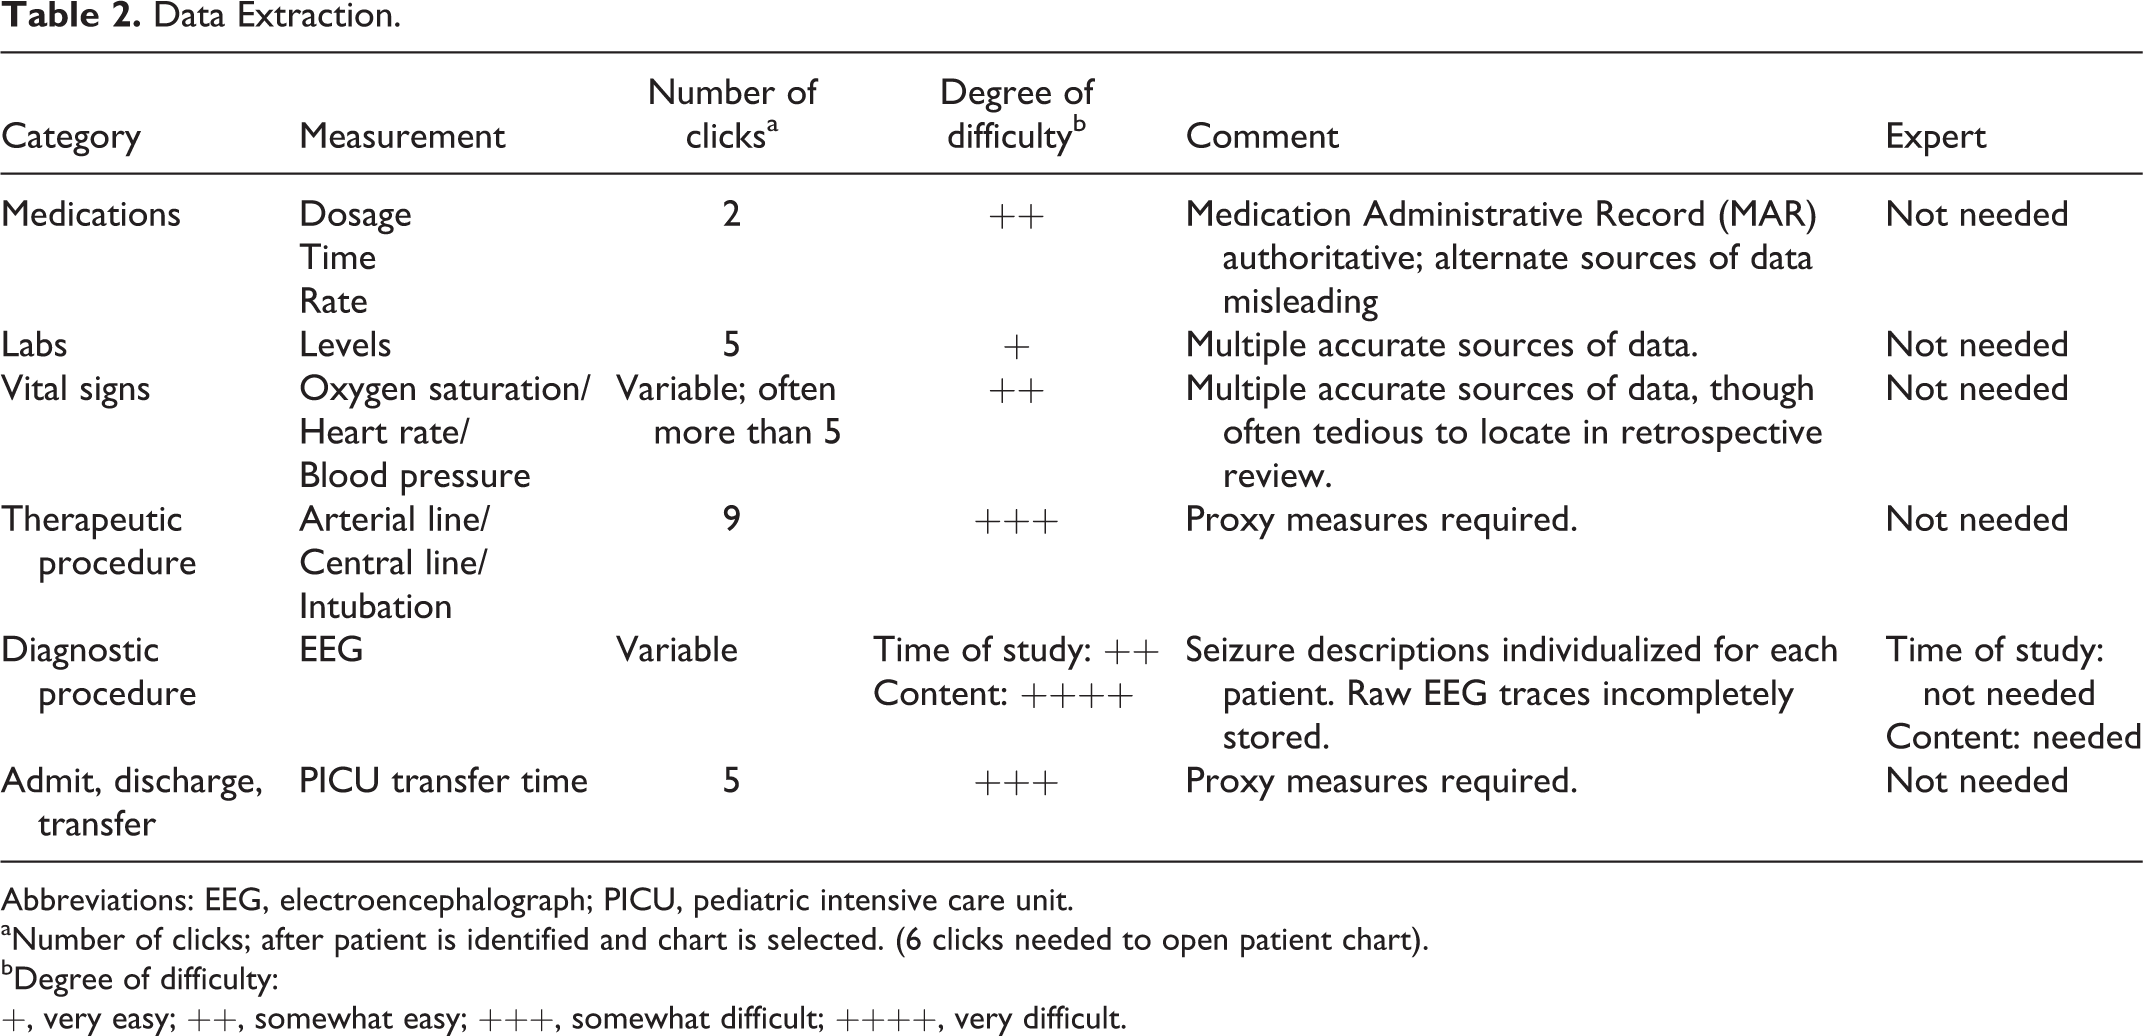
Abbreviations: EEG, electroencephalograph; PICU, pediatric intensive care unit.
aNumber of clicks; after patient is identified and chart is selected. (6 clicks needed to open patient chart).
bDegree of difficulty:
+, very easy; ++, somewhat easy; +++, somewhat difficult; ++++, very difficult.
Medication
Medication administration data was recorded in 2 locations in the electronic health record. First, a digital medication administration record (MAR) included times of administration and nursing notes in a matrix (medications listed vertically, times listed horizontally, and symbols and notes indicating if and when the medication was administered). Second, a tool called “DoseHx” listed each ordered medication. The data in these 2 locations did not agree. The clinical coauthors (ZG, SP, JP, JH) indicated that the MAR most accurately recorded medication administration. The DoseHx tool, though convenient to review, listed medications that were cancelled or not given, and often did not include all medication administrations. Obtaining the data from the MAR was straightforward; however, because of the potentially misleading “DoseHx” tool, we qualified the degree of difficulty in extracting medication data as somewhat easy.
Labs
Lab results were clearly noted in the “Results” section of the electronic health record, including (1) time the sample was sent, (2) the time it was received in the lab, and (3) the time at which the results were displayed in the system. Thus, we qualified the degree of difficulty in extracting lab data as very easy.
Vital signs
Blood pressure, heart rate, and oxygen saturation measurements were recorded in numerous places in the electronic health record, including sections called “Documents,” “Flowsheets,” and “Clinical Summary.” Searching through the large amounts of data in the Flowsheets and Documents sections was often tedious. Also, the Clinical Summary section listed blood pressure and heart rate in a different place from oxygen saturation. Furthermore, in the Documents section, the document titles did not indicate if vital signs were contained within. However, the data were reliably and consistently recorded in all patients. Thus, we qualified the degree of difficulty in extracting vital signs as somewhat easy.
Therapeutic procedures
Three therapeutic procedures (arterial line, central line, and endotracheal intubation) are described in the protocol. Each was recorded differently in different charts. In some cases, there was a standardized procedure note that included the time and date. However, these were not consistently present, and the notes were often submitted several hours after the procedure had occurred and did not include the actual time of the procedure. Thus, we used proxy measures. We approximated the time of arterial line placement based on the time continuous blood pressure recordings first appeared in the vital signs flowsheet. We identified intubation times based on when ventilator data first appeared in a respiratory care flowsheet.
Because of the inconsistent recording of procedure times and the use of proxy measures, we qualified the degree of difficulty in extracting therapeutic procedure data as somewhat difficult.
Diagnostic procedure (EEG)
EEG data can be found in 2 places, the physician’s written interpretation of the data, and the raw EEG itself. The time at which the EEG begins recording is clearly identified in the raw EEG. There are other potential sources for this data element—the time documented in the text of the EEG note or the time at which the EEG note was written. However, these times were often approximate. Thus, we qualified the difficulty in extracting the time of the EEG as somewhat easy.
At our center, EEG interpretations are written in a clinical note with a clear label. Nonexperts can read and understand these reports. However, seizure descriptions are individualized to each patient, and thus not easily extracted by a computer. The raw EEG traces, when available, can be reinterpreted via expert review. However, because of storage limitations, EEGs are pruned to reduce file sizes within a few weeks of recording, leaving only subsections of data for rereview. For these reasons, we qualified the degree of difficulty in extracting the clinical content of EEG as very difficult.
Admit, discharge, or transfer (ADT)
Arrival time to the emergency department and transfer time to the pediatric intensive care unit were documented with inconsistent accuracy in the electronic health record. For example, when a patient arrives in the emergency department in acute distress, the registrar may not process the admission until after critical care has begun. Instead, we used proxy measures. The time of a patient’s first recorded vital sign in the emergency department or in the pediatric intensive care unit closely approximated the times of arrival to these units. Thus, we qualified the degree of difficulty in extracting ADT data as somewhat difficult.
Timeline
Graphic timelines were created for all 7 children based on the data extracted for each patient. We provide an example of a patient who received nearly all initial treatment at our center (Figure 1) and another who was initially treated and intubated in the field before arriving at our center (Figure 2). The visualizations focused on clinical events, and the choice and timing of medication administration. Medication infusions were separated from single bolus doses, in order to distinguish 1-time events from continuous events. Clinical events, such as labs, times of the therapeutic procedures, and time of transfer to the pediatric intensive care unit were recorded across the lowest portion of the timeline. These timelines can be compared to an idealized timeline based on a theoretical patient who require treatment with high-dose pentobarbital to control seizures (Figure 3).
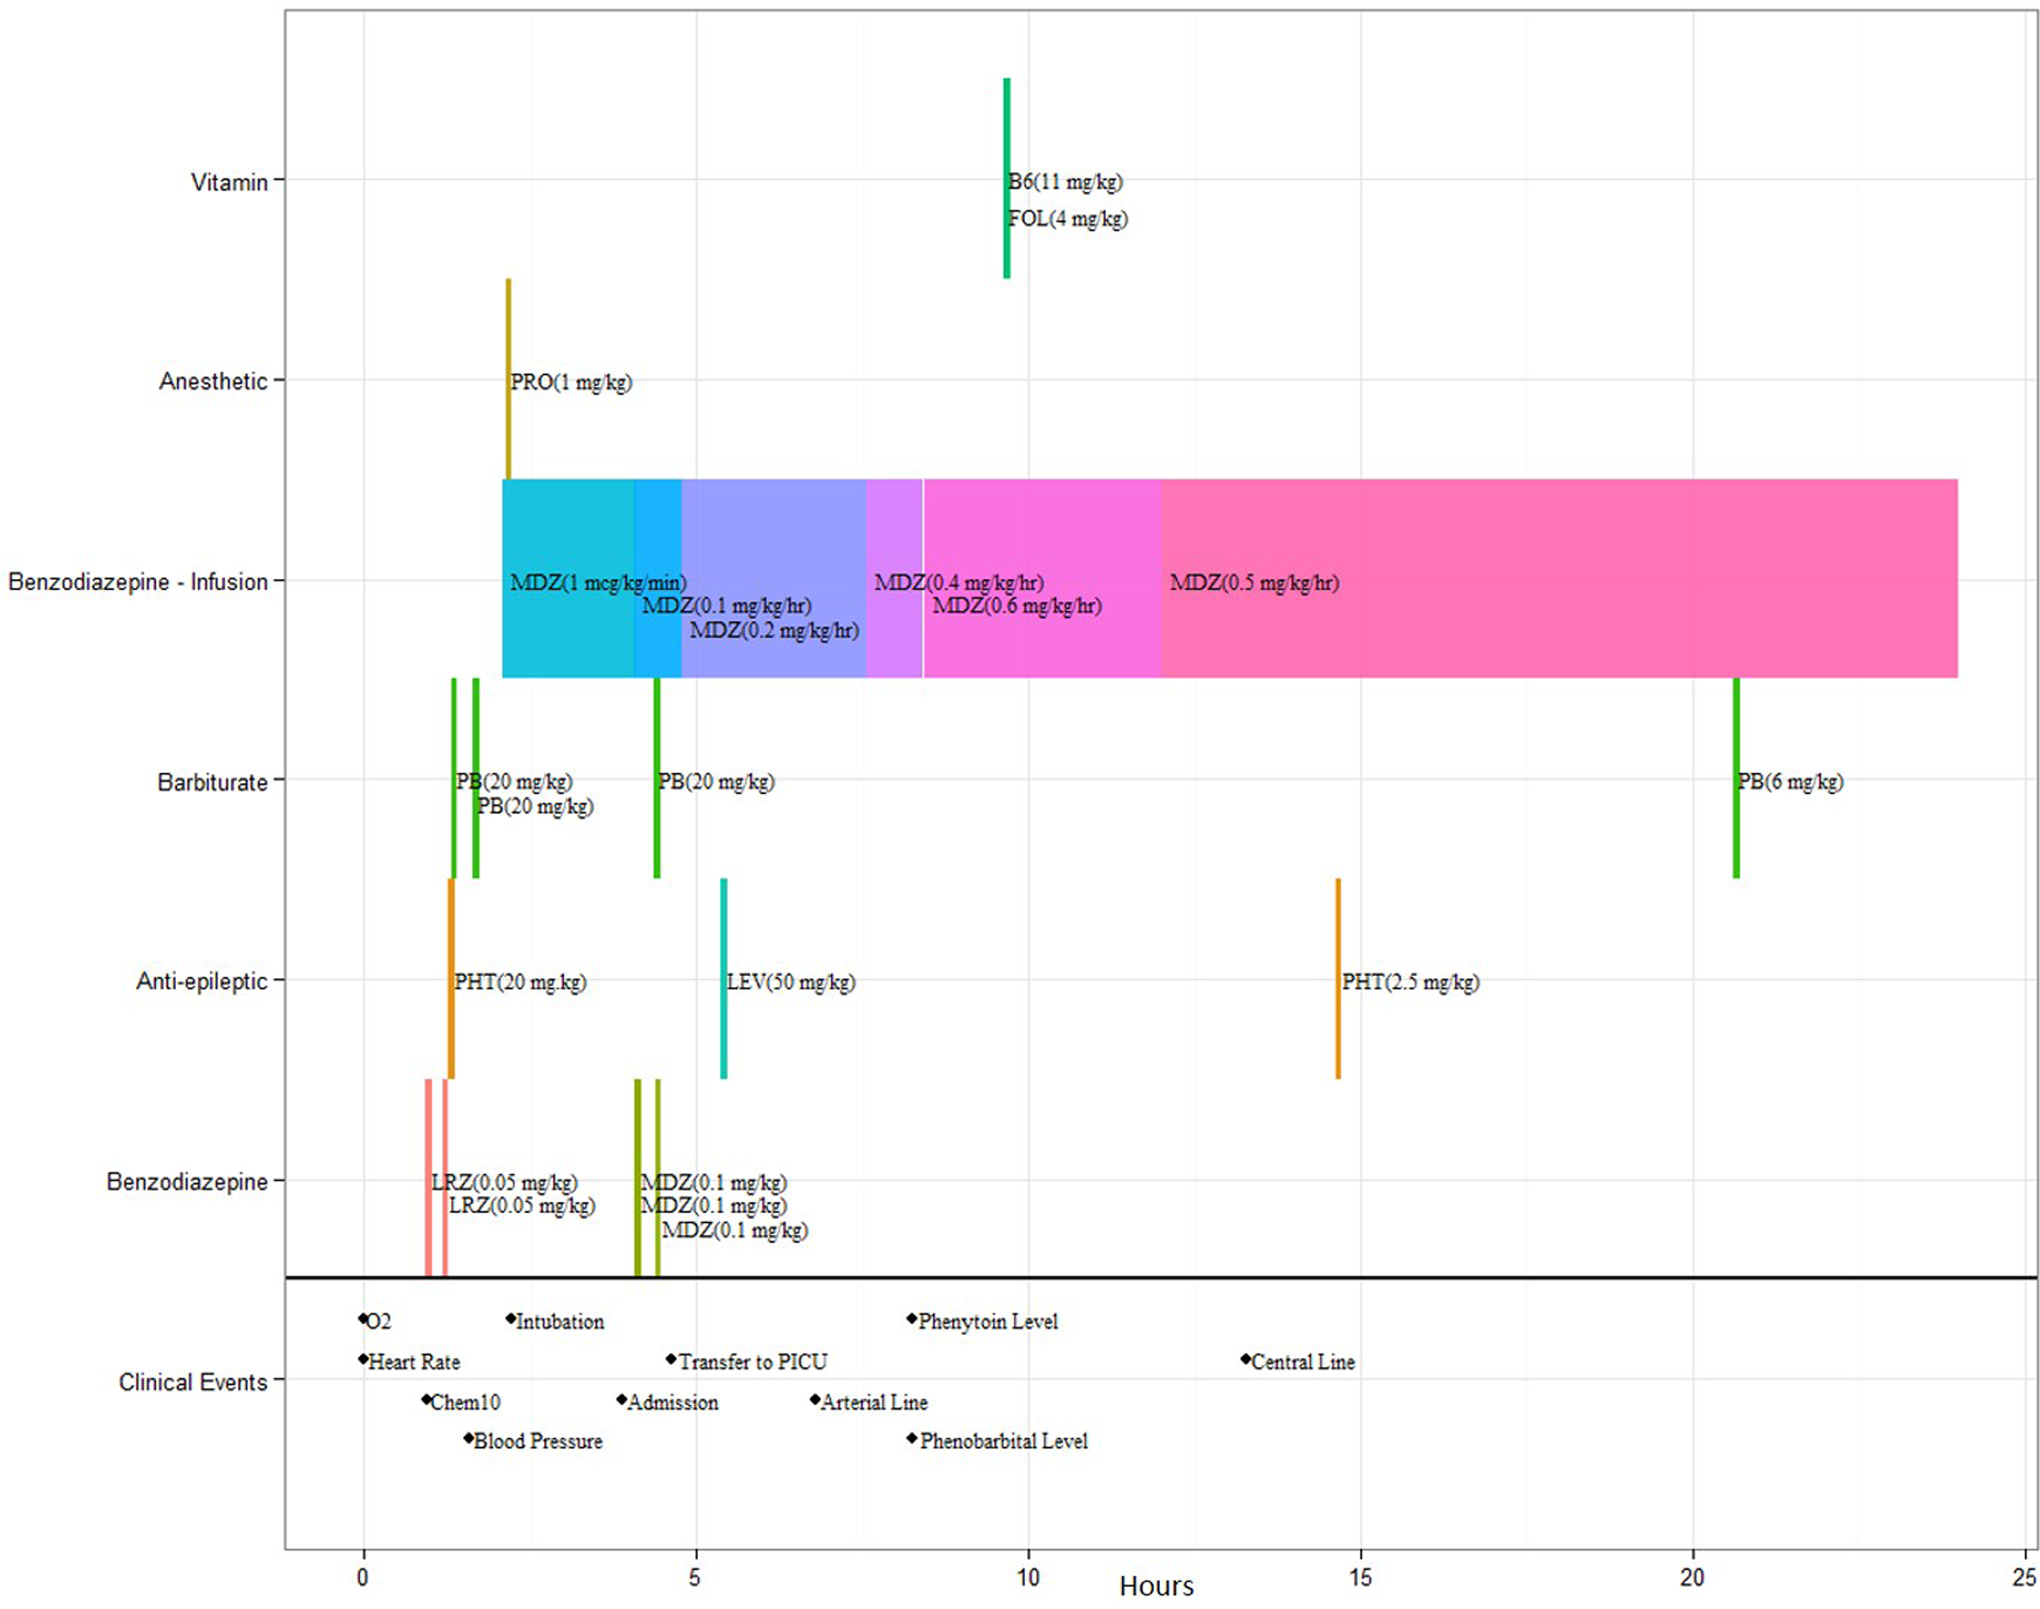
Timeline representation of a 1-year-old boy who presented with Leigh syndrome. FOL, folinic acid; LEV, levetiracetam; LRZ, lorazepam; MDZ, midazolam; PB, phenobarbital; PHT, phenytoin; PRO, propofol; B6, vitamin B6. (The color version of this figure is available in the online version at http://jcn.sagepub.com/.)

Timeline representation of a 12-year-old girl whose etiology was probably autoimmune. FPT, fosphenytoin; LRZ, lorazepam; MDZ, midazolam; PB, phenobarbital; PHT, phenytoin; PRO, propofol; PT, pentobarbital. (The color version of this figure is available in the online version at http://jcn.sagepub.com/.)
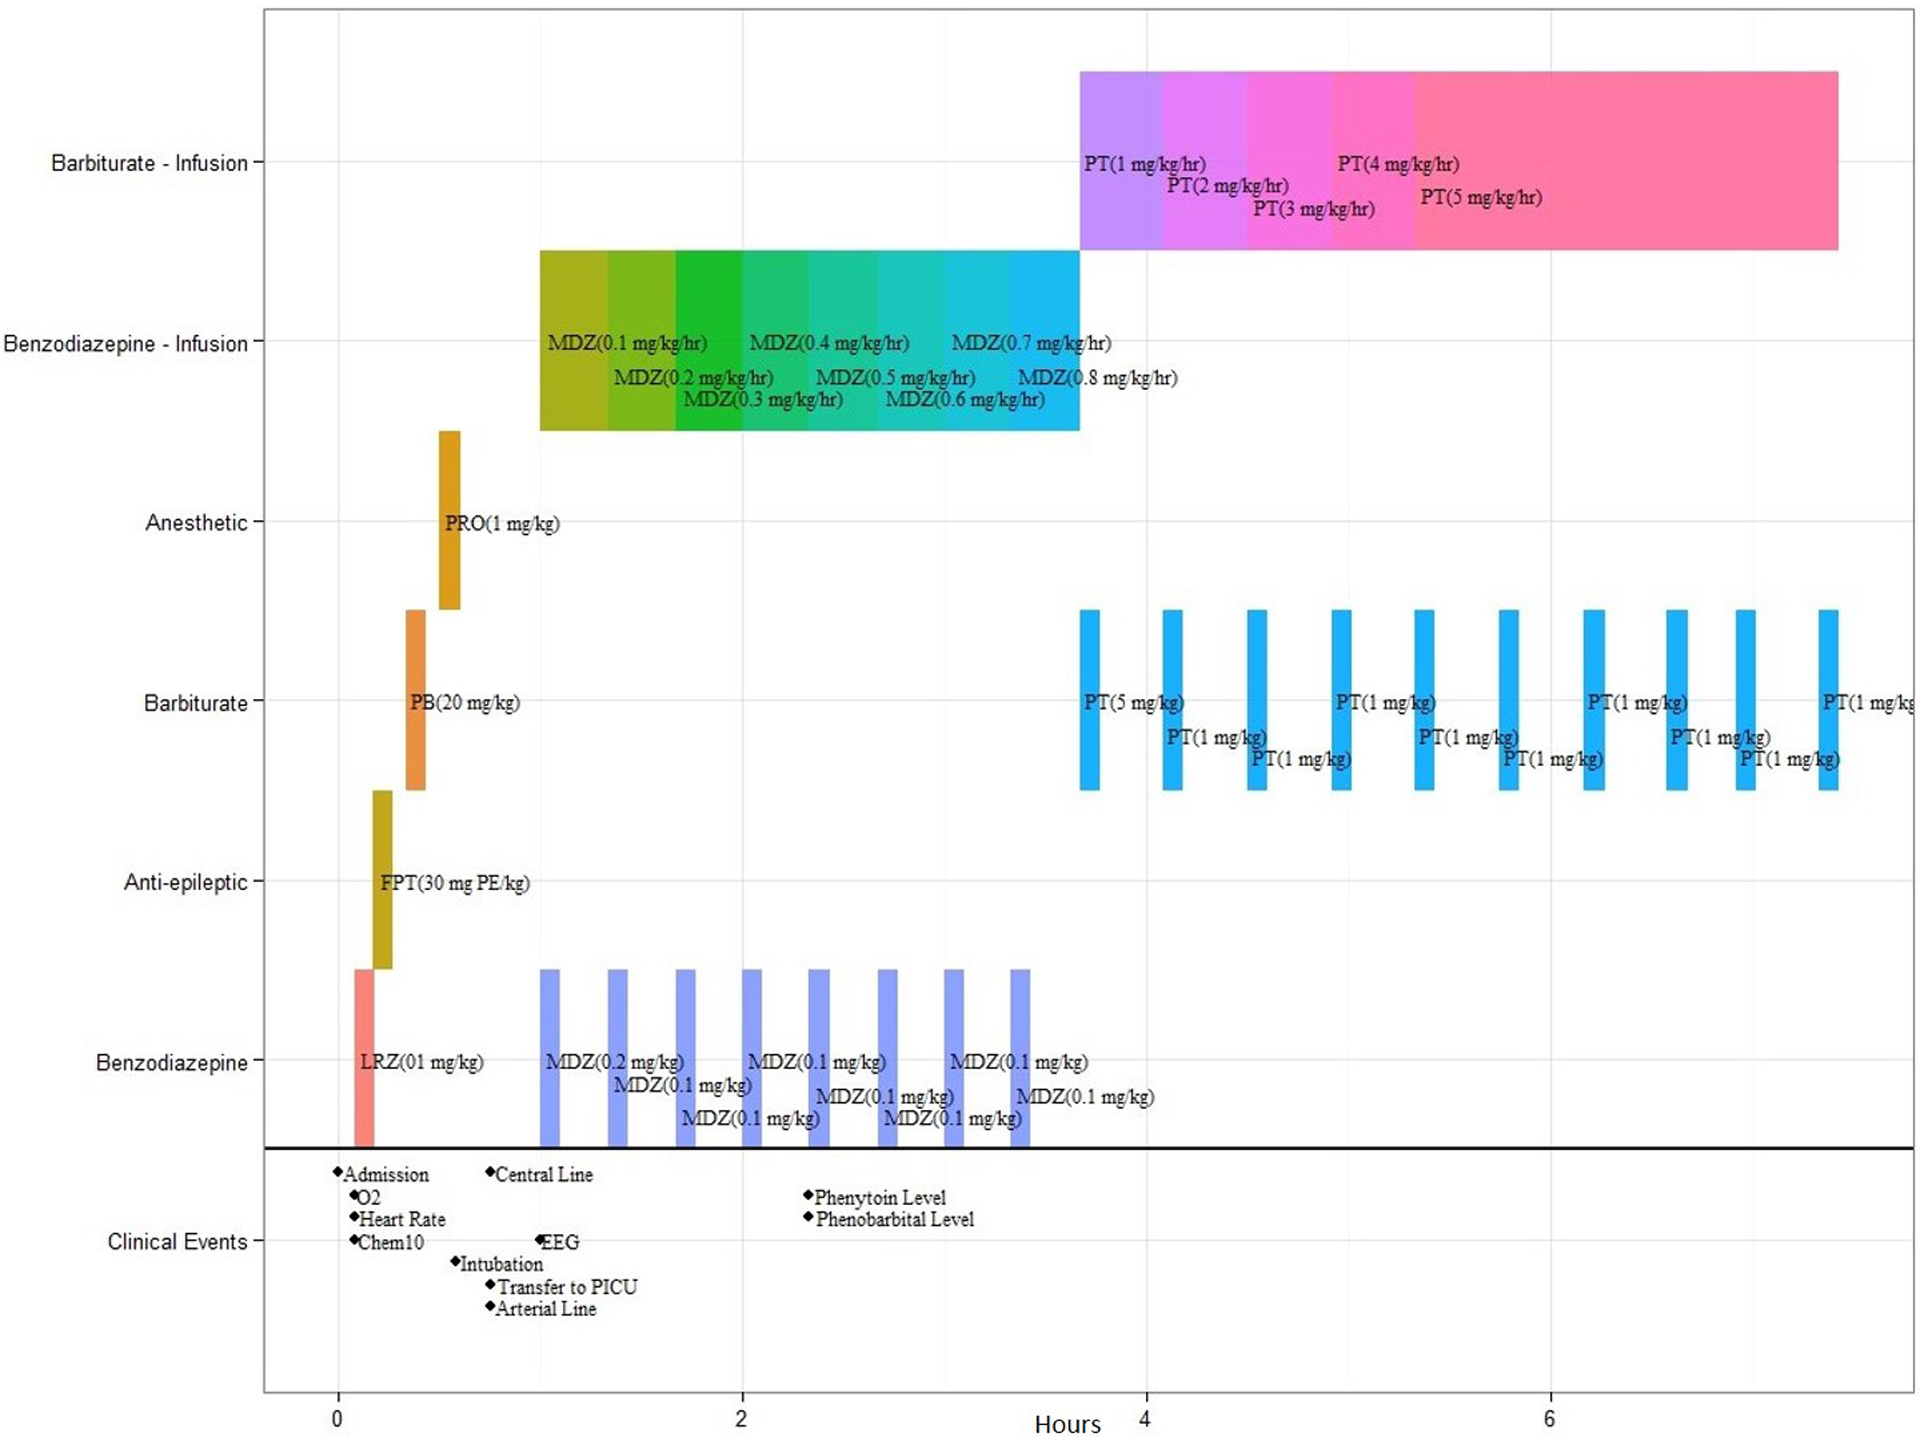
Timeline representation of ideal care requiring aggressive therapy according to the protocol in a theoretical patient. FPT, fosphenytoin; LRZ, lorazepam; MDZ, midazolam; PB, phenobarbital; PRO, propofol; PT, pentobarbital. (The color version of this figure is available in the online version at http://jcn.sagepub.com/.)
Discussion
Summary of Findings
We qualitatively assessed the feasibility of extracting relevant patient information from an electronic health record system in order to track adherence to a pediatric status epilepticus protocol. Certain discrete and structured elements, such as vital signs and lab results were easily extractable. However, other types of information were more challenging to obtain, such as the times of procedures and transfers, or the duration of seizures. Our observations indicate that key elements of a protocol evaluation could be automated and visualized; however, manual chart review (including expert review of EEG data) may still be necessary to obtain all the relevant data.
Relevance to Data Quality in EHRs
Electronic health record data are primarily recorded for clinical care, and thus may not necessarily be well suited for retrospective assessment of adherence to a protocol. One of our key observations was that the quality of the data varied for different data elements. Here, we more formally discuss data quality using a framework developed by Weiskopf and Weng. They outline 5 main components of data quality: (1) completeness; (2) correctness; (3) concordance; (4) plausibility; and (5) currency. 15
Data are “complete” if there are no missing values. The most important incomplete piece of information was the EEG data. The idiosyncrasies of the written EEG interpretations made it difficult to assess when a patient had seizures based on electronic health record data alone. Looking at the raw EEG data provided some additional information, but due to storage limitations, not all recordings are saved. We also recognize that some of our patients receive their initial treatment in the field. These details are often not in our electronic health record.
Data are “correct” if they accurately record the patient’s history. Two data types were variably correct. First, our inpatient electronic health record recorded medication administration in 2 places, which did not always agree. Only after careful review were we able to validate that the electronic “medication administration record” was the most reliable source for this information. Second, we required proxy measures in order to estimate the time of certain procedures, such as arterial line placement.
Data are “concordant” if information recorded in multiple places have the same values. Some data with poor concordance had the potential to be misleading in a clinically significant way. For example, a medication administration record is a critically important source of information about a patient’s clinical course. The poor concordance of medication administration data triggered an intensive review to identify the most correct source of data, and devalued the “Dose Hx” tool for the clinicians in this study. On the other hand, the time at which a resident writes a procedure note might be hours after the procedure—but there is little clinical consequence of this discrepancy.
Data are “plausible” if the values have face validity to a practicing clinician. Occasional values in our data were implausible—for example, when the time of admission occurred after the time clinical care began.
Data are “current” if information about an event is available shortly after it occurs. Some data elements had poor “currency.” For example, procedure notes were frequently written many hours after the procedure was performed.
Helping EHRs Achieve Their Potential
In the intensive care unit setting, there is a high volume of information recorded on each patient—as many as 1300 pieces of data per day. 16 Prior to the development of EHRs, clinicians had to sift through numerous documents and flowsheets to understand a patient’s clinical course. Electronic health record systems have consolidated patient data by recording and storing all the information in one location; however, this has not necessarily simplified the process of understanding it all. For example, EHRs have also made it easier to record a larger number of data elements, adding additional complexity to each patient’s history. Visualization tools, such as the one we have described, may help EHRs live up to their promise and allow physicians to rapidly process large amounts of information through an appropriate display.
Limitations
This study is a pilot analysis of clinical data extracted from the electronic health record system to determine adherence to a pediatric status epilepticus protocol. The study involved a small number of patients, and involved only one medical center.
Our work has limited external validity. The details of health data storage vary by center and sometimes within the same electronic health record system. However, we believe our work has value to other institutions, particularly our observation that specific kinds of data elements are more difficult to extract from an electronic health record than others, and our overall approach to the visualization.
Future Directions
In ongoing work, we are implementing and further developing the tool at our center. Future studies are needed to evaluate the effectiveness of the tool to identify gaps in care and the feasibility of implementing the tool at other centers for quality improvement. Future work might also investigate use of the tool in active clinical care, to help summarize the previous days’ events, and support ongoing clinical decision making.
Should the display prove useful, extending to other interested centers could be accomplished with moderate effort, by coordination among clinical services (pediatric neurology and critical care) and clinical informatics. Of key importance, United States federal policies require EHRs to be certified to perform basic tasks, including review of laboratory, medication, and vital sign data. 17 Therefore, although we expect the details of implementation would vary from center to center, depending on (1) the particular electronic health record in use and (2) the availability of visualization software within a center’s informatics infrastructure, we believe the core concepts in our visualizations will be digitally present at any center using a certified electronic health record.
Conclusion
Electronic health record data can be automatically extracted to help physicians visualize the course of care over the first 24 hours after a child is admitted for status epilepticus; however, the ease of extraction varies widely by data type. Some data elements may continue to require manual chart review pending further advances in epilepsy clinical informatics.
Footnotes
Acknowledgments
This manuscript was the result of a master’s thesis in Health Informatics completed by the first author at Weill Cornell Graduate School of Medical Sciences. We would like to thank Drs Jessica Ancker, Joshua Vest, Stephen Johnson, Barry Kosofsky, and Rainu Kaushal for their ongoing support on the project. We would also like to thank Mark Sturm and Artem Ervits for helping us extract the data from the electronic health record.
Author Contributions
BH and ZG conceptualized the study, performed the bulk of the research, and drafted the manuscript. JP, SP, and JH each contributed to the development of the study (they drafted and clinically implemented the status epilepticus protocol), and provided ongoing consultation. JP, SP, and JH each provided critical revisions of the manuscript for important intellectual content.
Declaration of Conflicting Interests
The authors declared no potential conflicts of interest with respect to the research, authorship, and/or publication of this article.
Funding
The authors received no financial support for the research, authorship, and/or publication of this article.
Ethical Approval
The research was approved by the Weill Cornell Medical College Institutional Review Board (No. 1204012299).