






Abstract
Children with myelomeningocele have a high prevalence of obesity and excess fat accumulation in their lower extremities. However, it is not known if this is subcutaneous or intramuscular fat, the latter of which has been associated with insulin resistance and metabolic disorders. This study quantified lower leg bone, muscle, and adipose tissue volume in children with myelomeningocele, classifying adipose as subcutaneous or muscle-associated. Eighty-eight children with myelomeningocele and 113 children without myelomeningocele underwent lower leg computed tomographic scans. Subcutaneous and muscle-associated adipose were classified based on location relative to the crural fascia. No differences were seen in subcutaneous adipose. Higher level disease severity was associated with increased muscle-associated adipose volume and decreased muscle volume. Bone volume tended to decrease with higher levels of involvement. Increases in lower leg adiposity in children with myelomeningocele are primarily attributable to accumulation of muscle-associated adipose, which may signify increased risk for metabolic disorders.
Myelomeningocele is the most common and severe type of spina bifida, and the impact on patients’ health extends beyond the characteristic neurologic deficits. Although folic acid fortification has reduced the incidence of myelomeningocele, this condition is estimated to affect about 3.4 per 10 000 live births in the United States. 1 The incidence of myelomeningocele is even higher among certain subpopulations, including Hispanic Americans. 2,3 In addition to direct neurologic deficits, patients with myelomeningocele also have an increased risk for other adverse health outcomes including osteopenia, pathologic fractures, and obesity. 4
Recent work has shown that even in the absence of obesity, children with myelomeningocele accumulate excess fat in their lower extremities. 5,6 It is not well understood, however, whether this fat is subcutaneous, within and between muscles or both. This distinction is important as the specific health risks of adiposity depend largely on its location. Although total leg fat content has been correlated with favorable insulin sensitivity, 7 adipose tissue within the deep fascia of leg muscles has been associated with insulin resistance. 8 Indeed, total lower extremity fat may be neutral or even protective with regard to metabolic markers, whereas adipose tissue within and between leg muscles has been associated with unfavorable lipid profiles, insulin resistance, and increased fracture risk. 7 -12 With increasing life expectancy for those with myelomeningocele, it is important to understand the patterns of excess adipose accumulation in this group and the associated long-term health risks.
Conventional methods of assessing adipose distribution, such as dual-energy x-ray absorptiometry and skin fold measurement, fail to distinguish between subcutaneous and deep adipose tissue. In contrast, computed tomography (CT) allows for effective 3-dimensional tissue segmentation based on signal attenuation. 13 CT is widely used to quantify abdominal and extremity adipose tissue volumes, as well as to distinguish between subcutaneous and internal adipose tissue. 8,13 Estimates of tissue volume by CT segmentation are highly correlated with tissue volumes measured physically on cadaver limb dissection, 14 and CT and magnetic resonance imaging (MRI) have comparable utility in differentiating subcutaneous and visceral adipose tissue. 15,16
The purpose of this study was to quantitatively assess bone, muscle, and adipose tissue distribution in the lower legs of children with myelomeningocele. Adipose was classified as either subcutaneous or muscle associated according to its location relative to the crural fascia. It was hypothesized that children with myelomeningocele would have more adipose tissue, both subcutaneous and muscle-associated, and less muscle and bone compared with typically developing controls and that these patterns would be accentuated at higher neurosegmental levels.
Methods
This cross-sectional study included convenience samples of both ambulatory and nonambulatory children with myelomeningocele between the ages of 6 and 14 years who were seen at a tertiary children’s hospital from 2010 to 2012, as well as a convenience sample of children without disability (control group) in the same age range. Children with myelomeningocele were recruited from spina bifida clinics and medical therapy units. Children in the control group were recruited by word of mouth. The control group was screened for any medical conditions or medication use that could affect growth or development. Children with myelomeningocele were excluded if they had bilateral metal implants in the lower legs, currently used glucocorticoid or seizure medications, or had additional chronic conditions other than myelomeningocele and hydrocephalus. Participants with myelomeningocele were classified according to the International Myelodysplasia Study Group (IMSG) criteria to determine functional neurosegmental level based on manual muscle testing. 17 All study procedures were approved by our institutional review board, and written informed assent and consent were obtained from all participants and their guardians.
Demographic data including age, sex, and ethnicity and clinical data including height, weight, body mass index, and Tanner stage of sexual development were obtained by a physician or physical therapist. Height was measured either standing or supine depending on the participant’s ability to stand. Participants underwent CT imaging of the lower legs while lying supine. All CTs were acquired on the same scanner (Philips Gemini GXL; Philips Medical Systems Inc, Cleveland, OH) using the same mineral reference phantom for simultaneous calibration (Model 3 CT Calibration Phantom; Mindways Software, Inc, Austin, TX). The following scanning parameters were used in order to minimize radiation exposure while acquiring contiguous 1 mm slices along the entire length of the tibias: 90 kVp, 32 mA (100 mA for scout scan), and 1 second rotation time. The effective radiation dose was estimated to be <0.05 mSv; the time required to complete each CT examination, including positioning, was less than 5 minutes.
Tissue volumes for adipose, muscle, and bone were computed along the entire length of both tibias using custom scripting implemented in MATLAB (The MathWorks, Inc, Natick, MA). The length of the tibia was demarcated by the proximal surface of the intercondylar eminence and the distal surface of the medial malleolus. Tissue volumes were quantified by a semi-automated, threshold-based method using previously validated attenuation ranges of [–190, –30], [–29, 150], and [151, 1000] Hounsfield units (HU) for adipose tissue, muscle, and bone, respectively. 14
For the purpose of this study, classification of adipose tissue as subcutaneous or muscle-associated was based on work by Shen et al, which defined subcutaneous adipose tissue as that found between the dermis and the aponeurosis and deep fascia. 16 We then defined muscle-associated adipose tissue as total adipose minus subcutaneous adipose and bone marrow. Thus, muscle-associated adipose included adipose within the deep (crural) fascia as well as that between muscles and between muscle and bone (Figure 1). 16 The boundary of the crural fascia in healthy controls was determined using Sobel operator based edge detection. 18 In patients with myelomeningocele, the crural fascia was manually delineated in slices at intervals of 20 mm, and the fascial boundaries in the intervening slices were estimated using shape-base interpolation of the manually delineated boundaries. Both semiautomated methods were found to have mean single user error of <3% compared to manual delineation on a variety of sample images (1.2% for edge detection in control participants and 2.9% for shape-based interpolation in myelomeningocele subjects). Tissue volumes in each leg were quantified separately with subsequent analyses using the sum of both legs for each subject.

Sample segmented images. CT slice from (A) control participant and (D) myelomeningocele patient (low lumbar level) with (B, E) crural fascia highlighted and (C, F) with bone in blue, muscle in pink, muscle-associated adipose in dark yellow and SC adipose in light yellow. Purple denotes masked pixels not included in the analysis (bone marrow and calibration phantom). (The color version of this figure is available in the online version at http://jcn.sagepub.com/.)
Patients with myelomeningocele were divided into neurosegmental groups based on motor level of disease (IMSG classification). These groups were sacral (S1-S3), low lumbar (L4 to L5-S1), midlumbar (L3 to L3-4), and high lumbar level and above (T10-L2). First, differences in demographic and clinical characteristics among controls and neurosegmental groups were assessed using chi-square tests for categorical variables and analysis of variance (ANOVA) with Bonferroni post hoc tests for continuous variables. Because of some variables, such as ethnicity, not being equally distributed among groups, we then conducted univariate regression analysis of muscle-associated adipose volume on demographic and clinical variables for control and myelomeningocele participants separately. Demographic and clinical variables showing a significant association with muscle-associated adipose tissue in univariate regression were considered for inclusion in a multivariate model using a step-down approach. Muscle-associated adipose, subcutaneous adipose, muscle, and bone volumes were then compared among the neurosegmental groups using ANOVA with Bonferroni post hoc tests. Lastly, body mass index was evaluated as a predictor of muscle-associated adipose volume in stratified analyses of each neurosegmental group using multivariate regression. All statistical analyses were performed in Stata 12 (StataCorp, College Station, TX).
Results
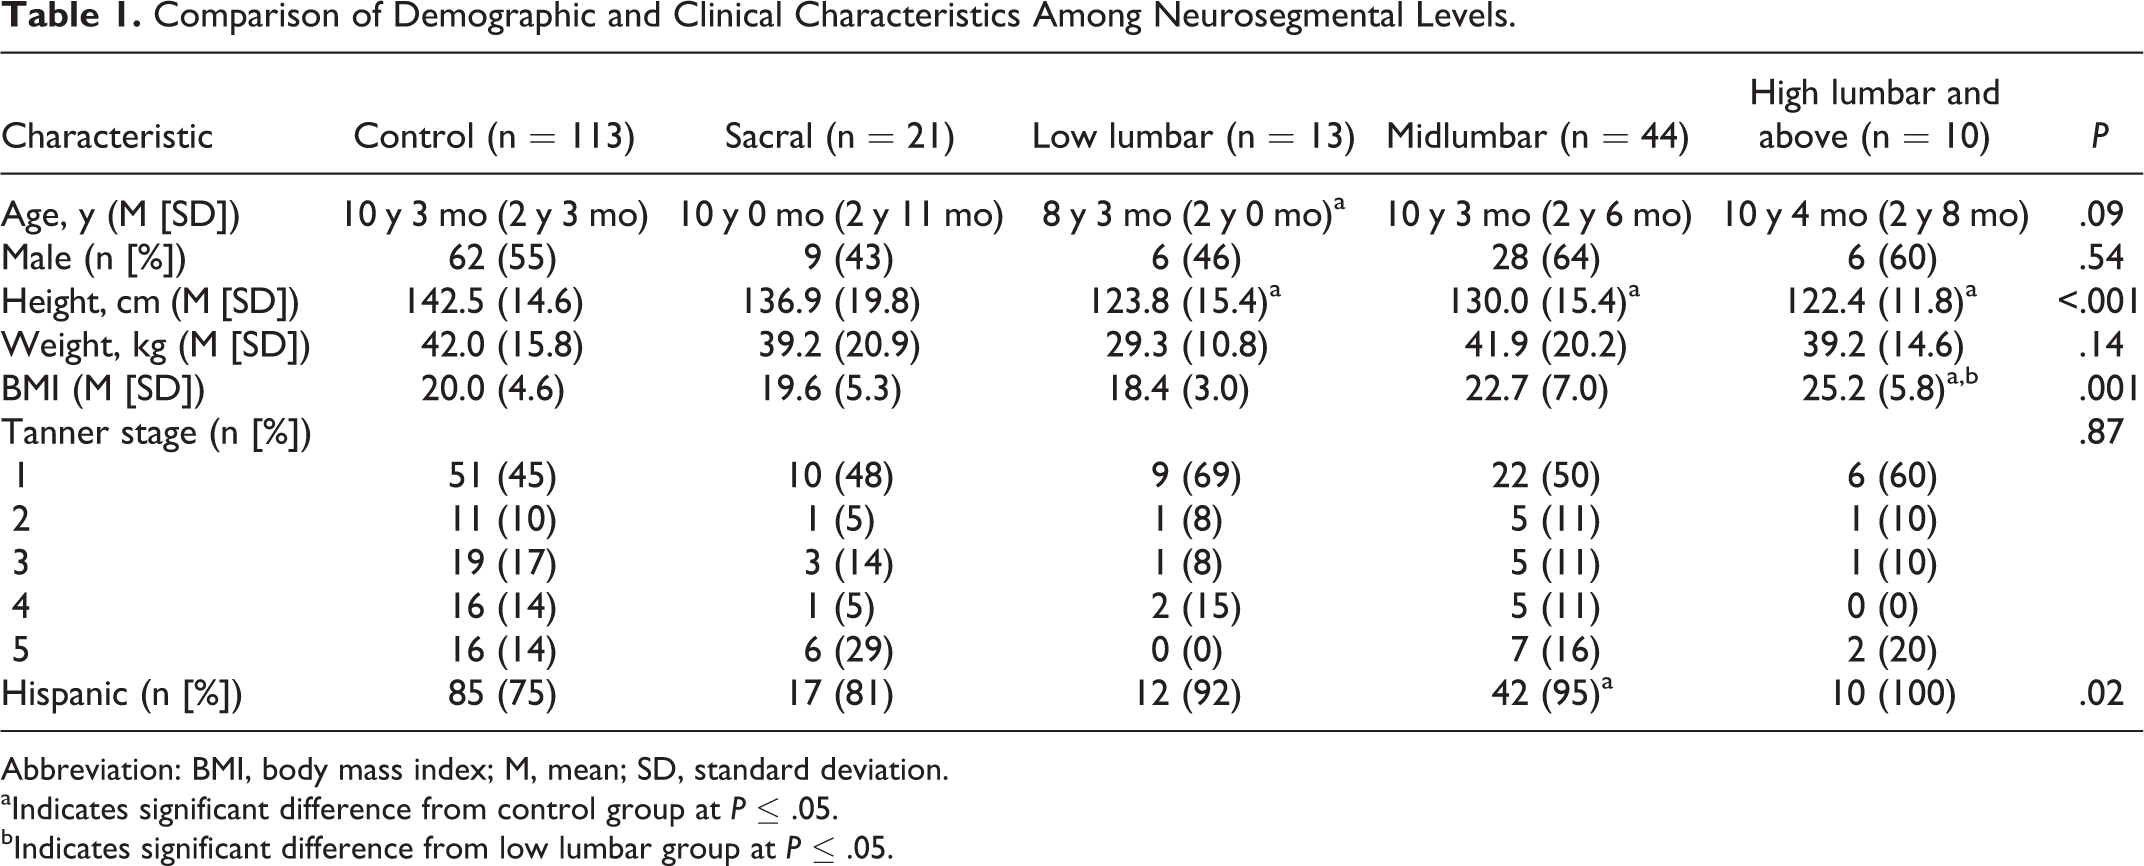
The study sample included 88 children with myelomeningocele (49 males; 10 years 0 months, SD 2 years 8 months) and 113 children without disability (62 males; 10 years 3 months, SD 2 years 3 months). Among the 88 children with myelomeningocele, 21 were classified as sacral level, 13 as low lumbar level, 44 as mid lumbar level, and 10 as high lumbar level or above (Table 1). All children in the control, sacral, and low-lumbar groups were ambulatory; 1 child in the midlumbar group was nonambulatory, and all children in the high lumbar and above group were nonambulatory. The study groups were well matched for sex distribution (P = .54), weight (P = .14), and Tanner stage (P = .54). The study groups were also of similar age, except that the low-lumbar group was significantly younger than the control group (P = .04). The low-, mid-, and high-lumbar groups were significantly shorter than controls (P < .001). The high-lumbar group had a greater body mass index than the control group (P = .01) and the low lumbar group (P = .02). There was also a higher proportion of Hispanic patients among the midlumbar than the control group (P = .03).
Comparison of Demographic and Clinical Characteristics Among Neurosegmental Levels.
Abbreviation: BMI, body mass index; M, mean; SD, standard deviation.
aIndicates significant difference from control group at P ≤ .05.
bIndicates significant difference from low lumbar group at P ≤ .05.
When considering the control and myelomeningocele participants separately, with the exception of sex (P ≤ .32) and ethnicity (P ≤ .11), all demographic and clinical variables, including age, height, weight, body mass index, and Tanner stage, were found to have significant predictive capacity in univariate regression with muscle-associated adipose tissue (P ≤ .001). These variables were considered for inclusion in the multivariate model, and the final model included height, age, and body mass index as covariates. It is worth noting that in multivariate analysis stratified by neurosegmental group, body mass index was found to be a significant predictor of muscle-associated adipose volume in control subjects (P < .001) and all neurosegmental groups (P < .01) except for the high lumbar group (P = .14).
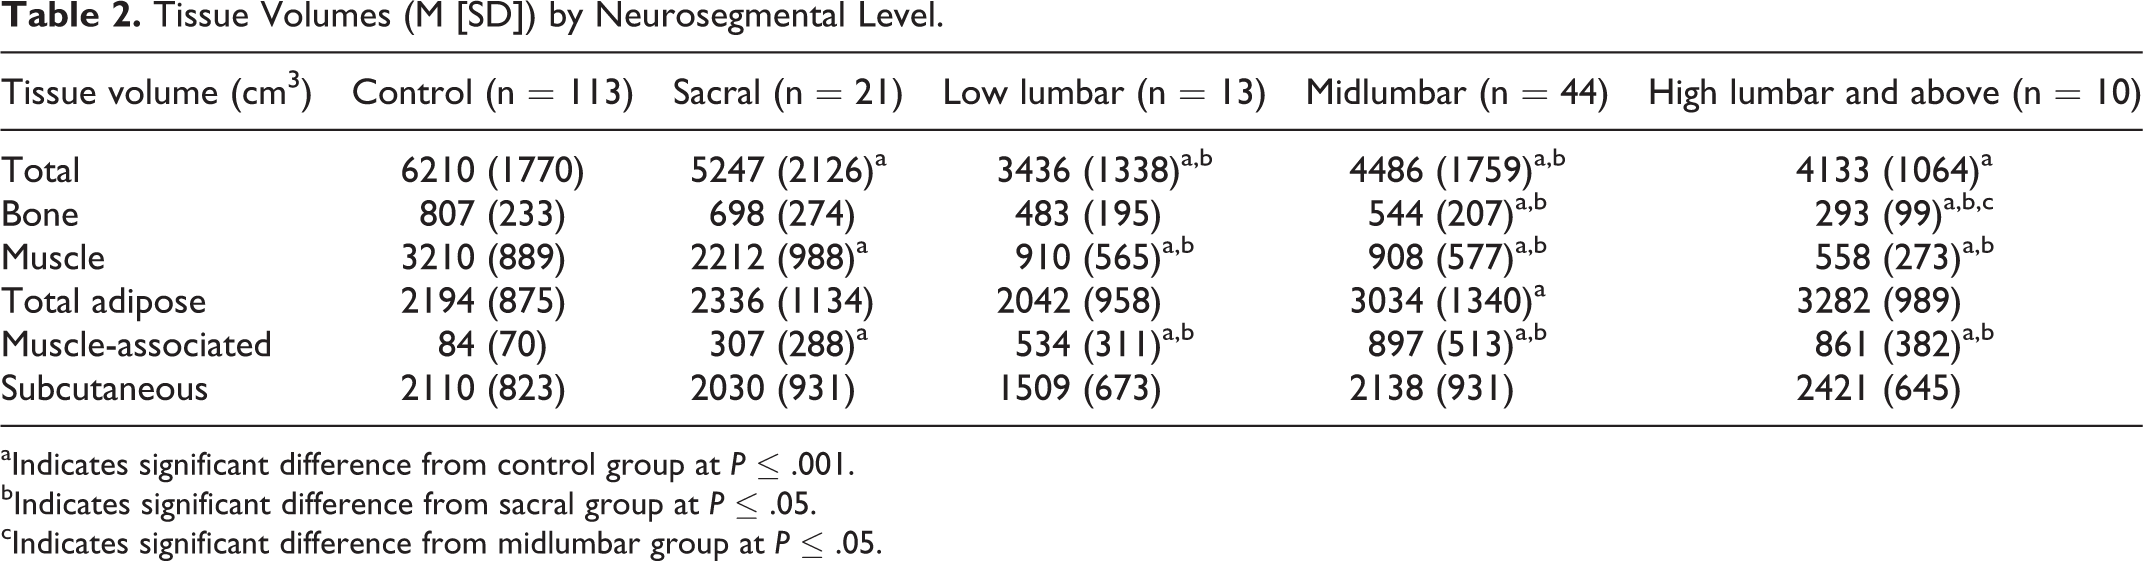
In general, total tissue volume decreased with greater disease severity as did muscle and bone volume (Table 2). After including age, height, and body mass index in the model, muscle volume was significantly lower in all neurosegmental groups compared to the control group (P < .001) and was significantly decreased in all lumbar groups compared to the sacral group (P < .001). The midlumbar and high-lumbar groups had lower bone volume than control and sacral groups (P < .01).
Tissue Volumes (M [SD]) by Neurosegmental Level.
aIndicates significant difference from control group at P ≤ .001.
bIndicates significant difference from sacral group at P ≤ .05.
cIndicates significant difference from midlumbar group at P ≤ .05.
Total adipose volume generally increased with disease severity but only the mid- and high-lumbar groups had significantly more total adipose tissue compared to controls (P < .001), and only the high-lumbar group had more adipose than the sacral group (P < .05). The increase in total adipose tissue volume was primarily attributable to more muscle-associated adipose, which generally was associated with increasing disease severity (P < .05) though the lumbar groups did not differ significantly from each other (P > .99). There was no significant difference in subcutaneous adipose among any of the groups (P ≥ .16).
The proportion of total tissue volume composed of muscle was lower, and muscle-associated and subcutaneous adipose proportions were higher with each increasing neurosegmental level (Figure 2). These differences were significant between the control, sacral, and lumbar groups (P < .05), except for between the low lumbar and sacral groups for subcutaneous proportion (P = .38). Proportions did not differ significantly among the lumbar groups (P ≥ .11).

Proportional tissue volumes by neurosegmental level. The size of each pie chart is proportional to the mean total lower leg volume.
Discussion
Past studies have shown that children with myelomeningocele are more likely to be overweight or obese compared to peers without myelomeningocele, and more recent work has shown that children with myelomeningocele accumulate a disproportionate amount of body fat in their lower extremities regardless of body mass index. 5,6,19,20 The results of the current study indicate that this excess adipose is muscle-associated rather than subcutaneous. This previously unknown finding may impact our understanding of long-term health risks in this population.
Muscle-associated adipose has been associated with type 2 diabetes mellitus, insulin resistance, and increased serum cholesterol levels, whereas there have been no similar relationships seen for subcutaneous adipose. 21 -23 Several studies have found leg muscle–associated adipose specifically to be strongly associated with abnormal glucose metabolism. 8,24 -26 In both diabetic and nondiabetic adults, Goodpaster et al 8 found that leg muscle–associated adipose was associated with increased insulin resistance while subcutaneous adipose had no association, based on data from a single mid-thigh CT slice. A later study by Goodpaster et al 25 also found a similar association in a study of more than 2000 elderly adults. Boettcher et al 26 found that adipose within the deep fascia of the calf was associated with insulin resistance in nondiabetic adults using quantification from magnetic resonance images. Also using MRI, Elder et al 24 found that thigh muscle–associated adipose accounted for about 70% of plasma glucose variance in adults with complete lower extremity paralysis from spinal cord injury. The same study also found that there was a strong correlation between lower muscle volume and elevated blood glucose. The present study found that muscle-associated adipose tended to be higher and muscle volume lower in more severe myelomeningocele, which raises the concern for dysregulation of glucose and lipid metabolism in this population.
The findings of this study may have important implications for long-term health management in persons with myelomeningocele. First, these findings suggest that persons with myelomeningocele may be at increased risk for type 2 diabetes mellitus, which, to our knowledge, has not yet been studied in the spina bifida population. This study also found that higher body mass index was a significant predictor of more muscle-associated adipose in all groups except for high lumbar, which demonstrated the same trend despite a small sample size. This suggests that lowering body mass index through dietary and exercise interventions might decrease muscle-associated adipose volumes and associated disease risks.
The findings of more muscle-associated adipose tissue and less muscle volume are not unexpected given that myelomeningocele results in some degree of denervation of the lower extremity, which has been previously associated with decreased muscle volume as well as increased adipose tissue within and around muscles. 27,28 Interestingly, prior studies of obesity in spina bifida and paralyzed limbs have found higher skinfold thickness, indicating higher volumes of subcutaneous adipose, in the legs of children with myelomeningocele. 29,30 In contrast, this study found comparable subcutaneous adipose volumes between children with and without myelomeningocele. The cause of this discrepancy is not immediately clear. One contributing factor may be a higher percentage of body fat among our control group compared to contemporary comparisons for Hayes-Allen and Tring’s 1973 study, inferred from population trends. It was also noted that subcutaneous adipose comprised a greater proportion of total tissue volume in more severe disease, which might plausibly lead to a thicker layer of subcutaneous adipose for the same absolute volume. We also noted that total bone volume tended to be lower in more severe myelomeningocele, although only the mid- and high-lumbar groups had significantly lower bone volume after accounting for differences in height, body mass index, and age. While decreased total bone volume does not directly address bone strength, this finding is consistent with the increased risk of lower extremity fracture in this population. 31
We note some limitations on the present study. Relatively small samples of children with low lumbar– and high lumbar–level myelomeningocele may have limited our ability to detect differences involving these groups. These 2 groups included lower proportions of patients at Tanner stages 4 and 5, which may suggest that some differences in tissue volumes may be attributable to an earlier developmental stage. Our technique of manual demarcation coupled with automated interpolation, although a widely used method of volume estimation, may result in some amount of error. We attempted to minimize measurement variability by having a single user perform manual demarcation. Limitations of CT imaging included limited visualization of muscle fascia and dermis, as well as limitations of resolution including edge effects and inability to detect scattered adipocytes. Although this study included a high proportion of Hispanic patients that may limit the generalizability of the results to other populations, it should be noted that myelomeningocele has a high prevalence in Hispanics. 32,33 Lastly, height was measured standing or supine, which may underestimate height for some myelomeningocele subjects and thus overestimate body mass index.
Conclusions
The results of this study suggest that greater lower leg adipose tissue volume in children with myelomeningocele is primarily attributable to higher volumes of muscle-associated adipose, particularly in patients affected at higher neurosegmental levels. In contrast, subcutaneous adipose volumes were comparable in all groups examined. Because muscle-associated adipose is more strongly associated with negative health outcomes than subcutaneous adipose, children with myelomeningocele may have an increased risk of adverse health effects. It may be possible to reduce muscle-associated adipose through diet and exercise interventions, and it may be beneficial to monitor and tailor treatment protocols to consider the anatomic distribution of adipose tissue when treating children with myelomeningocele.
Footnotes
Declaration of Conflicting Interests
The authors declared no potential conflicts of interest with respect to the research, authorship, and/or publication of this article.
Funding
The authors disclosed receipt of the following financial support for the research, authorship, and/or publication of this article: Support provided by NIH-NICHD grant 5R01HD059826 from the National Institutes of Health–Eunice Kennedy Shriver National Institute of Child Health and Human Development.
Ethical Approval
This study was approved by Children’s Hospital Los Angeles Internal Review Board (# CCI-09-00317). All study procedures were conducted in accordance with approved protocols and follow appropriate Health Insurance Portability and Accountability Act standards.