
Abstract
Purpose:
Tuberous sclerosis complex is a multisystem genetic disorder characterized by multiorgan hamartomas, seizures, and developmental delay. Current consensus recommendations for tuberous sclerosis complex include brain magnetic resonance imaging (MRI) without and with contrast every 1 to 3 years until age 25 years for subependymal giant cell astrocytoma screening, and more often in patients with known subependymal giant cell astrocytoma. Recent reports in the literature regarding gadolinium deposition have prompted us to investigate the added value of intravenous contrast in this setting.
Materials and Methods:
Thirty-nine MRI examinations from 12 tuberous sclerosis complex patients with known subependymal giant cell astrocytoma were retrospectively reviewed for all caudothalamic groove lesions larger than 1 cm. Lesions were measured in 2 planes on both noncontrast and contrast-enhanced axial 3-dimensional (3D) T1-weighted imaging in a randomized fashion by 2 attending pediatric neuroradiologists. Differences in lesion measurements were compared to zero using a 1-sample t test.
Results:
On average, radiologist A measured lesions 1.1 mm larger in long-axis diameter without contrast (P = .0003), whereas radiologist B measured lesions 0.1 mm larger without contrast (not significant). Differences in lesion measurement were smaller when comparing noncontrast to contrast-enhanced 3D T1-weighted imaging than when comparing radiologist A to radiologist B.
Conclusions:
Noncontrast axial 3D T1-weighted imaging is similar to contrast-enhanced axial 3D T1-weighted imaging for subependymal giant cell astrocytoma size measurement. It has high accuracy and may be a safer and more efficient imaging method for tuberous sclerosis complex patients who commonly undergo numerous MRI examinations throughout their lifetime. Further studies may be appropriate to determine whether contrast material could be beneficial in certain situations.
Subependymal giant cell astrocytoma (SEGA) has been reported to occur in up to 24% of patients with tuberous sclerosis complex. 1 If large, lesions can obstruct the foramen of Monro, leading to hydrocephalus. Rarely, large subependymal giant cell astrocytomas can demonstrate local brain invasion. The 2012 International Tuberous Sclerosis Complex Consensus Group recommended brain magnetic resonance imaging (MRI) without and with contrast in asymptomatic tuberous sclerosis complex patients every 1 to 3 years until age 25 to screen for subependymal giant cell astrocytoma and associated complications. 2 MRI is recommended more often in pediatric patients with known subependymal giant cell astrocytoma, adult patients who developed subependymal giant cell astrocytoma in childhood, and in the setting of lesion growth and/or neurologic deterioration. 3 However, the added value of gadolinium administration in patients with intracranial manifestations of tuberous sclerosis complex has not been systematically established. According to the 2012 consensus group, subependymal giant cell astrocytoma should be defined as any caudothalamic groove lesion larger than 1 cm or any subependymal lesion that has shown serial growth on imaging, regardless of enhancement characteristics. 2 Recent reports demonstrating that neurotoxic free gadolinium can disassociate from its safe chelated form and be deposited in tissues 4 warrant more thoughtful administration of gadolinium-based contrast agents to patients undergoing MRI.
Gadolinium deposition can occur in the brain after repeated intravenous administration of gadolinium-based contrast agents, especially in the dentate nuclei, posterior thalami, and globi pallidi. 5 This phenomenon has been observed with linear as well as macrocyclic agents, even in the setting of an intact blood-brain barrier and normal renal function. 6 Further, gadolinium deposition can occur in tissues outside the brain, including liver, skin, and bone. 7 A recent study of 24 tuberous sclerosis complex patients undergoing regular MRI screening with gadolinium-based contrast agents revealed evidence of brain gadolinium deposition in 13/20 patients with an estimated glomerular filtration rate >90 mL/min. 8 In this series, nearly all patients showed evidence of gadolinium deposition after 5 or more contrast-enhanced MRI examinations. The long-term clinical significance of gadolinium deposition remains unknown, but the theoretical potential for gadolinium toxicity is particularly concerning in pediatric patients because of their long life-expectancy and actively developing brains. Recent consensus recommendations by the International Society of Magnetic Resonance in Medicine (ISMRM) Safety Committee, Canadian Association of Radiologists, and others include exercising caution with gadolinium-based contrast agents, carefully considering risk/benefit ratios and avoiding contrast when not medically necessary. 5,9
The purpose of this study was to compare noncontrast to contrast-enhanced 3D T1-weighted imaging for subependymal giant cell astrocytoma size measurement. The goal of the study was to demonstrate equivalence between noncontrast and contrast-enhanced 3D T1-weighted imaging, and the hypothesis was that no statistically significant differences would be observed.
Methods
This retrospective study was approved by the institutional review board. Inclusion criteria were age under 18 years, an established diagnosis of tuberous sclerosis complex, at least 1 caudothalamic groove lesion measuring ≥1 cm, and at least 1 brain MRI including axial 3D T1-weighted imaging both before and after gadolinium-based contrast administration (original axial acquisitions and axial reformations were considered equivalent for the purposes of this study). A total of 39 MRI examinations from 12 patients were included in the study, including a mix of 1.5-tesla (T) and 3.0-T examinations.
All MRI examinations were retrospectively reviewed by 2 board-certified attending pediatric neuroradiologists (SP and JG). Radiologists independently measured every identifiable subependymal giant cell astrocytoma in long axis and short axis on each series (noncontrast axial 3D T1-weighted imaging and contrast-enhanced axial 3D T1-weighted imaging) in a randomized fashion using the manual measurement tool on the PACS workstation. All noncontrast images were evaluated first, followed by all contrast-enhanced images approximately 2 weeks later. Radiologists were instructed to review only the series of interest when identifying and measuring lesions, and not to compare to prior examinations.
The number of lesions identified by each radiologist (A and B) on each MRI sequence (noncontrast and contrast-enhanced 3D T1-weighted imaging) was totaled, and the results were compared using a 2 × 2 Z-test.
Differences in lesion size measurement due to contrast were evaluated using a “within-lesions” methodology: the diameter measured on contrast-enhanced 3D T1-weighted imaging was subtracted from the diameter measured on noncontrast 3D T1-weighted imaging. This difference was calculated for each lesion measured by that particular radiologist, and differences were averaged and compared to zero using a 1-sample, 2-tailed t test. Correlations between size measurements were also analyzed by calculating the Pearson correlation coefficient (r) of long-axis lesion measurements for noncontrast vs contrast-enhanced 3D T1-weighted imaging for both radiologist A and radiologist B. Lesions that were measured only on noncontrast or contrast-enhanced images (but not both) were excluded.
Differences in lesion size measurement due to interpreting radiologist (interobserver variability) were also evaluated using a “within-lesions” methodology: the diameter measured by radiologist B was subtracted from the diameter measured by radiologist A, and these differences were averaged and compared to zero using a 1-sample, 2-tailed t test. Correlations between size measurements were analyzed by calculating the Pearson correlation coefficient of long-axis lesion measurements for radiologist A vs radiologist B for both noncontrast and contrast-enhanced 3D T1-weighted imaging. Lesions that were measured only by radiologist A or radiologist B (but not both) were excluded.
Finally, the number of lesions measured ≥1, ≥2, and ≥3 mm larger or smaller in long-axis diameter was totaled for each group. Statistical significance was set at P < .05.
Results
Number of Lesions Detected
Radiologist A detected a total of 64 lesions on noncontrast 3D T1-weighted imaging and 59 lesions on contrast-enhanced 3D T1-weighted imaging (Table 1). Radiologist B detected 53 lesions on noncontrast 3D T1-weighted imaging and 55 lesions on contrast-enhanced 3D T1-weighted imaging. The number of lesions detected by radiologist A on noncontrast 3D T1-weighted imaging was statistically greater than the number of lesions detected by radiologist B (P = .003). All other differences were not statistically significant.
Number of Lesions Detecteda (Noncontrast vs Contrast-Enhanced 3D T1-Weighted Imaging).
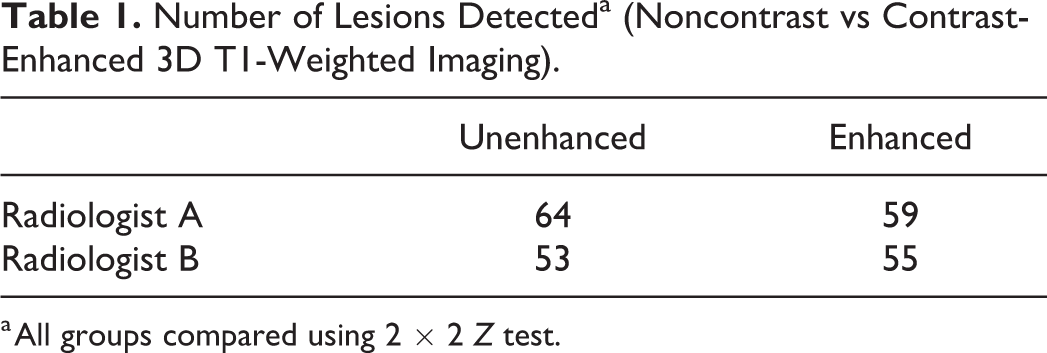
a All groups compared using 2 × 2 Z test.
Differences in Lesion Measurement Due to Contrast
Radiologist A measured lesions an average of 1.1 mm larger in long-axis diameter on noncontrast 3D T1-weighted imaging compared to contrast-enhanced 3D T1-weighted imaging (P = .0003) and 0.6 mm larger in short-axis diameter (P = .01) (Table 2). Fifty-five percent of lesions were measured ≥1 mm larger or smaller in long-axis diameter by radiologist A on noncontrast 3D T1-weighted imaging compared to contrast-enhanced 3D T1-weighted imaging. Thirty-one percent (31%) were measured ≥2 mm larger or smaller, and 17% were measured ≥3 mm larger or smaller (maximum 8.8 mm). The Pearson correlation coefficient (r) of long-axis lesion measurements for radiologist A when comparing noncontrast to contrast-enhanced 3D T1-weighted imaging was 0.704.
Long-Axis Size Difference Due to Contrast (Noncontrast vs Contrast-enhanced 3D T1-Weighted Imaging).
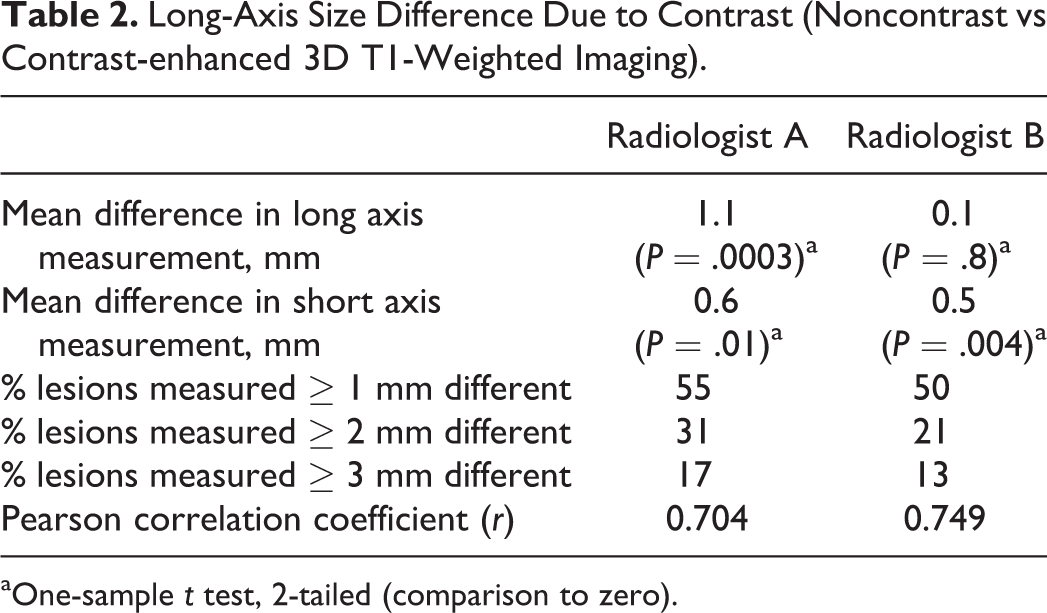
aOne-sample t test, 2-tailed (comparison to zero).
Radiologist B measured lesions an average of 0.1 mm larger in long-axis diameter on noncontrast 3D T1-weighted imaging compared to contrast-enhanced 3D T1-weighted imaging (not statistically significant) and 0.5 mm larger in short-axis diameter (P = .004). Fifty percent (50%) of lesions were measured ≥1 mm larger or smaller in long-axis diameter by radiologist B on noncontrast 3D T1-weighted imaging compared to contrast-enhanced 3D T1-weighted imaging. Twenty-one percent (21%) were measured ≥2 mm larger or smaller, and 13% were measured ≥3 mm larger or smaller (maximum 5.6 mm). The Pearson correlation coefficient of long-axis lesion measurements for radiologist B when comparing noncontrast to contrast-enhanced 3D T1-weighted imaging was 0.749.
Differences in Lesion Measurement Due to Radiologist
On noncontrast 3D T1-weighted imaging, radiologist A measured lesions an average of 1.7 mm larger than radiologist B in long-axis diameter (P = .0001) and 0.8 mm larger in short-axis diameter (P = .0005) (Table 3). Fifty-eight percent (58%) of lesions were measured ≥1 mm larger or smaller by radiologist A on noncontrast 3D T1-weighted imaging compared to radiologist B. Thirty-one percent (31%) were measured ≥2 mm larger or smaller, and 21% were measured ≥3 mm larger or smaller (maximum 6.5 mm). The Pearson correlation coefficient of long-axis lesion measurements for noncontrast 3D T1-weighted imaging when comparing radiologist A to radiologist B was 0.777.
Long-Axis Size Difference Due to Radiologist (Radiologist A vs Radiologist B).
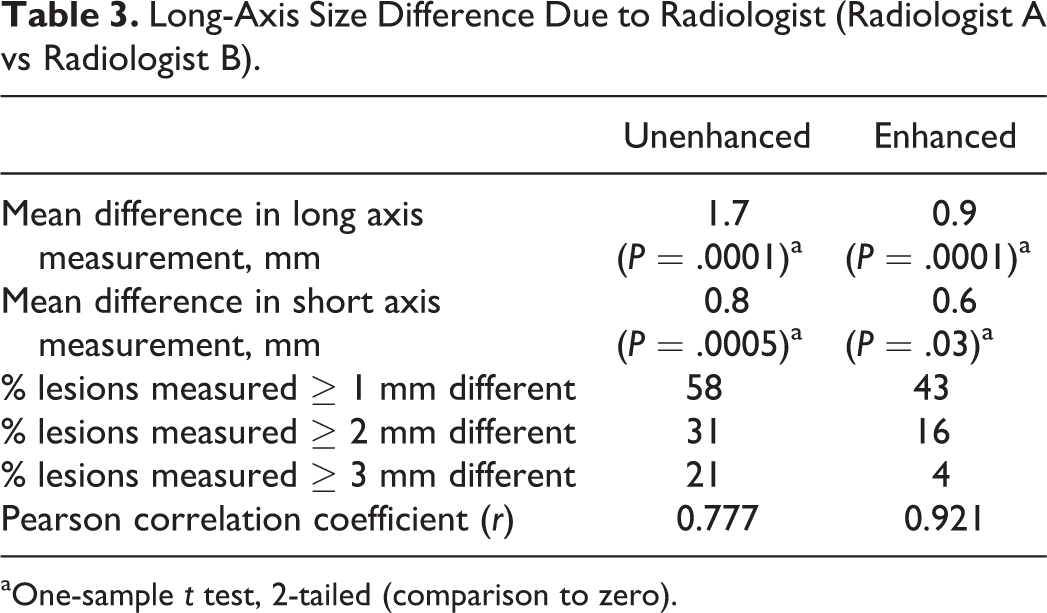
aOne-sample t test, 2-tailed (comparison to zero).
On contrast-enhanced 3D T1-weighted imaging, radiologist A measured lesions 0.9 mm larger than radiologist B in long-axis diameter (P = .0001) and 0.6 mm larger in short axis diameter (P = .03). Forty-three percent (43%) of lesions were measured ≥1 mm larger or smaller by radiologist A on contrast-enhanced 3D T1-weighted imaging compared to radiologist B. Sixteen percent (16%) were measured ≥2 mm larger or smaller, and 4% were measured ≥3 mm larger or smaller (maximum 3.9 mm). The Pearson correlation coefficient of long-axis lesion measurements for contrast-enhanced 3D T1-weighted imaging when comparing radiologist A to radiologist B was 0.921.
Discussion
Subependymal nodules and subependymal giant cell astrocytoma demonstrate overlapping histologic as well as MR imaging features. 10 The key differentiating feature between subependymal nodules and subependymal giant cell astrocytoma is lesion growth: subependymal giant cell astrocytoma classically grows over time whereas subependymal nodules do not. 11 Lesion size on MRI is the most important factor for clinical decision making in asymptomatic subependymal giant cell astrocytoma, 3 and most tuberous sclerosis complex patients with subependymal giant cell astrocytoma are asymptomatic. 1 Contrast-enhanced brain MRI is the current gold standard for measuring subependymal giant cell astrocytoma size and evaluating for growth. 2 Occasionally, subependymal nodules and subependymal giant cell astrocytoma can be difficult to differentiate from adjacent anatomical structures on MRI. This is where volumetric 3D T1-weighted imaging has proven to be a very useful sequence owing to its high spatial resolution, high inherent contrast between gray and white matter, and ability to be reformatted into any desired imaging plane. 12
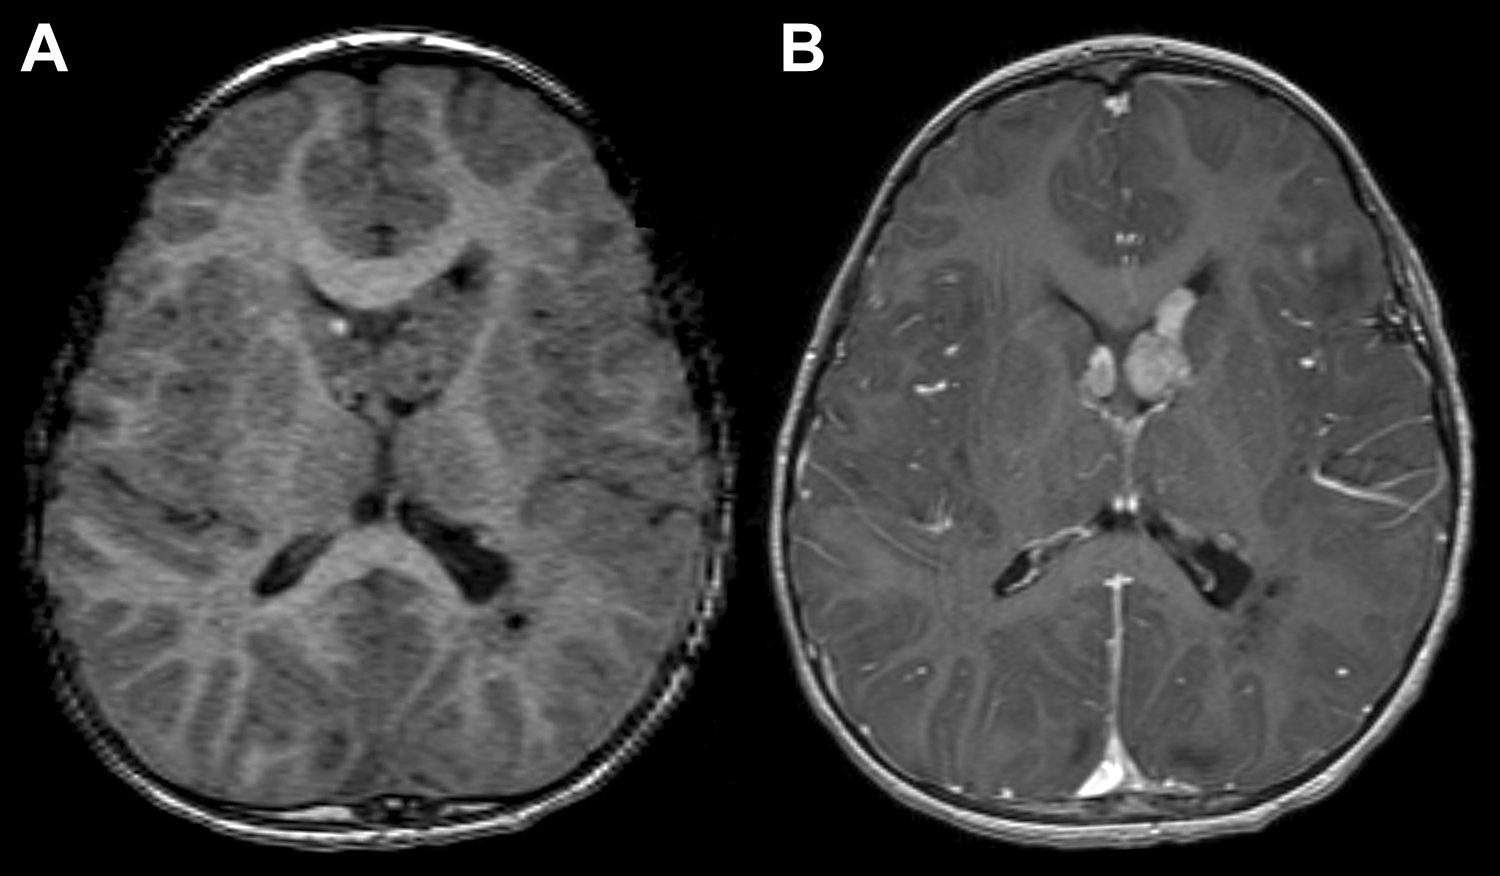
Recent safety concerns regarding gadolinium-based contrast agents prompted us to question the added value of contrast to high-resolution 3D T1-weighted imaging in children with tuberous sclerosis complex. Our present results suggest that noncontrast 3D T1-weighted imaging has a strong positive association with contrast-enhanced 3D T1-weighted imaging for measuring subependymal giant cell astrocytoma at the caudothalamic groove (Figure 1). On average, long-axis lesion measurements varied by 1.1 mm for radiologist A (P = .0003) and 0.1 mm (not significant) for radiologist B when comparing noncontrast to contrast-enhanced 3D T1-weighted imaging. Given expected minor discrepancies when manually measuring structures on any radiology study, differences in lesion measurement on the order of 1 mm are unlikely to be clinically meaningful, even if statistically significant. Long-axis lesion measurements varied by less than 2 mm in 69% (radiologist A) to 79% (radiologist B) of MRI examinations when comparing noncontrast to contrast-enhanced 3D T1-weighted imaging (Table 2), and mean differences in lesion measurement due to contrast were less than mean differences in lesion measurement due to interpreting radiologist (interobserver variability).
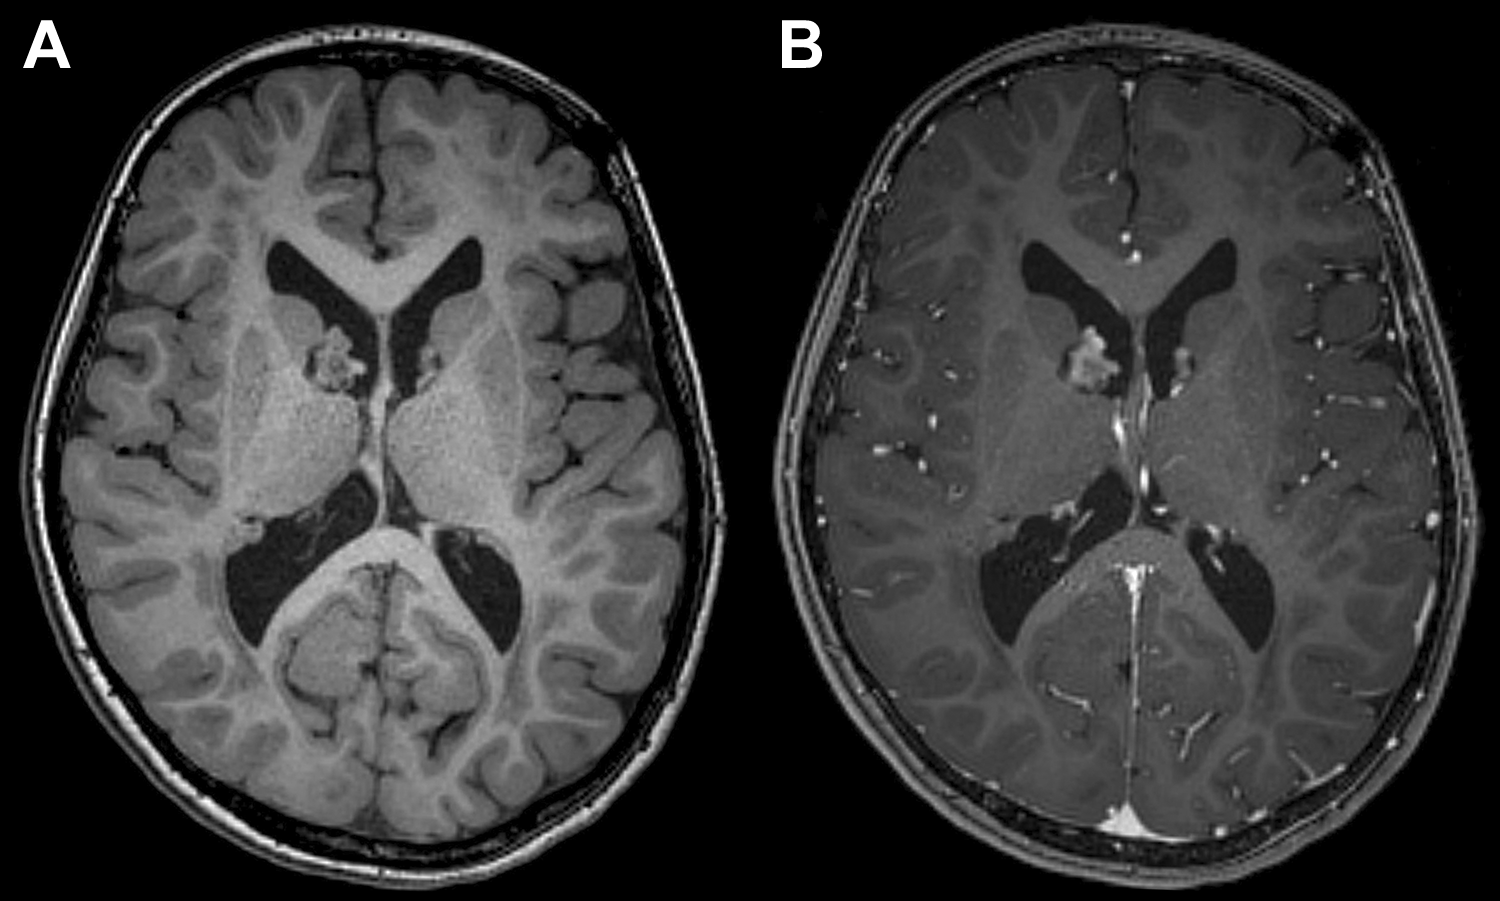
Noncontrast (A) and contrast-enhanced (B) 3D T1-weighted imaging of a right caudothalamic groove subependymal giant cell astrocytoma (SEGA). Both radiologists measured this lesion 0.9 mm larger on contrast-enhanced images. Radiologist A measured this lesion 1.7 mm larger than radiologist B on both noncontrast and contrast-enhanced 3D T1-weighted imaging. Qualitatively, this lesion appears nearly identical on both images.
In a few cases, striking differences in size measurement were observed when comparing noncontrast to contrast-enhanced 3D T1-weighted imaging, up to 8.8 mm for radiologist A and 5.6 mm for radiologist B, suggesting that caution should be exercised when comparing a noncontrast MRI examination to a contrast-enhanced examination (Figure 2). In addition, Pearson correlation coefficients were highest when comparing radiologist A to radiologist B on contrast-enhanced 3D T1-weighted imaging, and only 4% of lesions were measured ≥3 mm larger in long-axis diameter in this setting (Table 3). Further, the number of lesions detected by radiologist A on noncontrast 3D T1-weighted imaging was statistically greater than the number of lesions detected by radiologist B (P = .003). Caution should be exercised when comparing noncontrast to contrast-enhanced MRI. Increased variability in lesion measurement and/or detection may lead to spurious conclusions of lesion growth or reduction, which could influence treatment decisions.
Noncontrast (A) and contrast-enhanced (B) 3-D T1-weighted imaging of bilateral caudothalamic groove subependymal giant cell astrocytoma (SEGA). The right SEGA was measured 8.8 mm larger by radiologist A on noncontrast 3D T1-weighted imaging, and was not identified by radiologist B on noncontrast 3D T1-weighted imaging. Contrast-enhanced 3D T1-weighted imaging clearly reveals the presence of an enhancing caudothalamic groove lesion on the right, and that the apparent anterior component on noncontrast 3D T1-weighted imaging (A) represents caudate head. Of note, suboptimal image quality on noncontrast 3D T1-weighted imaging may have affected lesion measurement.
This study has several limitations. It is a retrospective study of tuberous sclerosis complex patients with known subependymal giant cell astrocytoma at the caudothalamic groove, and therefore might not be generalizable to other populations such as tuberous sclerosis complex patients with no known subependymal giant cell astrocytoma or tuberous sclerosis complex patients with subependymal giant cell astrocytoma at different locations. Further, only 1 MRI sequence was used (axial 3D T1-weighted imaging), whereas real-life examinations include multiple additional sequences (eg, T2 fluid-attenuated inversion recovery) that may improve subependymal giant cell astrocytoma detection (ie, subependymal giant cell astrocytoma is typically hyperintense to gray matter on T2 fluid-attenuated inversion recovery but isointense on T1-weighted imaging). In addition, each lesion was measured in isolation, without comparison to prior images or prior reports. However, these experimental parameters were intentionally chosen in order to maximize the sensitivity of the experiment for the detection of differences between experimental groups. This study also is limited by the lack of a true reference standard (MRI is the current gold standard for subependymal giant cell astrocytoma size measurement), which necessitated a complex group vs group analysis. However, such an experimental design should be adequate to establish equivalence if no differences are shown and statistical power is sufficient.
Lesions that were not measured on noncontrast as well as contrast-enhanced 3D T1-weighted imaging, and lesions that were not measured by both radiologists were excluded from their respective statistical calculations, which may have introduced error. This methodology was chosen based on the assumption that real-life radiologists will do their due diligence and read prior MRI reports when interpreting MRI examinations for subependymal giant cell astrocytoma follow-up, therefore making themselves aware of the existence of any known subependymal giant cell astrocytoma. Finally, all noncontrast lesions were measured first followed by all noncontrast lesions approximately 2 weeks later. This theoretically could have introduced bias into our observation that lesions may appear larger on noncontrast 3D T1-weighted imaging. Larger prospective studies will likely be necessary to more fully understand the risks vs benefits of withholding contrast in this clinical setting.
Conclusion
Noncontrast axial 3D T1-weighted imaging appears to be a safe and effective means of monitoring children with tuberous sclerosis complex for changes in subependymal giant cell astrocytoma size. Our study showed that noncontrast axial 3D T1-weighted imaging is strongly correlated to contrast-enhanced axial 3D T1-weighted imaging, allowing for the inherent variability of the manual measurement technique. Benefits of noncontrast MRI include decreased scanner time and decreased risk of gadolinium deposition, which is particularly important for children undergoing serial MRI examinations. Although imaging protocols that alternate unenhanced with contrast-enhanced MRI have become increasingly popular, caution should be exercised in this situation to prevent spurious conclusions of lesion growth.
Footnotes
Author Contributions
All 3 authors contributed fully to data gathering, manuscript writing and editing, etc.
Declaration of Conflicting Interests
The authors declared no potential conflicts of interest with respect to the research, authorship, and/or publication of this article.
Funding
The authors received no financial support for the research, authorship, and/or publication of this article.
Ethical Approval
This study had institutional IRB approval via IRB#17-169.