
Abstract
Neonatal hypoxic-ischemic encephalopathy (HIE) contributes to perinatal morbidity and mortality. The influence of racial, ethnic, and socioeconomic factors on long-term outcomes is not well understood. This single-center retrospective study examined associations between these factors and long-term neurodevelopment in infants with HIE. Demographic and clinical data were obtained via chart review. Racial and ethnic minority (REM) status was self-reported. Socioeconomic factors included Social Vulnerability Index (SVI) and insurance type. Motor and language delays were determined by physician assessment or standardized testing. Logistic regressions assessed associations between development, REM, and socioeconomic factors while controlling for clinical covariates. Among 211 infants, 117 (56%) were REM. Motor delay occurred in 49 (23%) and was not associated with REM, SVI, or insurance. Language delay occurred in 59 (28%) and was associated with REM status although the association lessened when insurance was included. These findings suggests that societal factors may underlie language developmental disparities after HIE.
Keywords
Introduction
Despite overall improvement in infant mortality, neonates born to racial and ethnic minority (REM) parents and parents with lower socioeconomic status (SES) have higher mortality rates in the neonatal and postpartum period.1,2 Black neonates and neonates born to parents with low income are more likely to be born prematurely and have a lower birthweight.3,4 These differences in birth outcomes may be one of many reasons that REM children and children who come from low SES backgrounds are more likely to have developmental delays. 5 Improved access to health care decreases but does not eliminate disparities, suggesting that more complex societal factors may play a role and prevention may require a broader approach. 6
Neonatal hypoxic-ischemic encephalopathy (HIE) is a common cause of perinatal brain injury and causes subsequent neurobehavioral problems and cerebral palsy 7 that often require substantial and lifelong medical care. 2 To date, there has been limited research into racial, ethnic, and SES disparities in neonatal HIE. A 2023 population-based study assessing birth outcomes in immigrants to Sweden found that children of women from lower-income countries had an elevated risk of HIE. 8 A second study found that low SES was associated with poorer language development at 2 years of age in children with neonatal HIE. 9 Studies of racial inequity have focused on factors that increase the risk for HIE, such as a low 5-minute Apgar score, 10 or combine HIE with other conditions when examining adverse neurodevelopmental outcomes. 11 Given the potential for HIE to cause lasting developmental and financial consequences for children and families, it is critical to understand the additional effects of HIE on more vulnerable populations. In this study, we aimed to identify racial, ethnic, and socioeconomic factors that predict neurodevelopmental outcomes after neonatal HIE.
Methods
Ethics
The study was approved by the Children's Hospital of Philadelphia Institutional Review Board. Individual consent was waived as the study was retrospective, did not require direct patient contact, and had minimal risk. Part of the cohort has been described previously. 12
Subject Identification and Data Collection
This was a single-center retrospective study conducted at a quaternary care medical center. Subjects were identified using a comprehensive database of consecutive infants with HIE receiving therapeutic hypothermia and had at least 1 outpatient follow-up visit within the health care network over a 10-year period (June 2010 through December 2020). Neonates were excluded if they had additional genetic diagnoses (n = 2) given the potential independent influence on neurodevelopment or if data were incomplete regarding race (n = 1), ethnicity (n = 0), or basic clinical information (n = 8). Clinical and demographic data were extracted from the electronic health record using previously published methodology. 12
Infants underwent whole-body therapeutic hypothermia within 6 hours of birth if they were deemed to meet criteria by a neonatologist. The majority of the children in this study were born at local hospitals and transferred to our institution for therapeutic hypothermia. For this reason, a subset of children was determined to meet hypothermia criteria by an outside neonatologist, with some aspects of the evaluation (such as initial encephalopathy score) not available for our review. Therapeutic hypothermia candidacy was determined based on standard cooling criteria: a gestational age >35 0/7 weeks, a birth weight >1800 g, and (1) either a blood gas within first hour of life with a pH ≤7 or a base deficit ≤16 OR a 10-minute Apgar score ≤5 and supportive ventilation at birth continued for ≥ 10 minutes, and (2) either have seizures or a moderate/severe encephalopathy score. Degree of encephalopathy was established by the admitting neonatologist using a standardized clinical examination based on Sarnat staging. 13 The encephalopathy score used in this study was performed by the admitting neonatologist at our institution, as the initial encephalopathy score after birth was not consistently available for all patients. Neonates underwent continuous electroencephalographic (EEG) monitoring throughout therapeutic hypothermia and rewarming. Continuous EEG was discontinued after rewarming or 24-48 hours after the end of their last seizure, depending on which event was later. Continuous EEG was performed with Grass-Telefactor or Natus video EEG equipment and used a standard 10-20 electrode montage. EEGs were clinically interpreted by pediatric electroencephalographers. For the purpose of this study, EEG findings were extracted from clinical reports in the electronic medical record. Based upon the first 24 hours of the EEG recording, EEG background was categorized as (1) mildly abnormal if the record had discontinuity with either interburst amplitudes <25 microvolts or a duration that was prolonged for corrected age 14 ; (2) moderately abnormal if the record showed discontinuity with both interburst amplitudes less than 25 microvolts and an interburst interval that was prolonged for gestational age, but with a duration of less than 30 seconds; or (3) severely abnormal if the background was severely attenuated, featureless, or if there was severe discontinuity defined by interburst intervals that were greater than or equal to 30 seconds or consistent with burst-suppression. We defined electrographic seizures based upon standardized neonatal EEG terminology from the American Clinical Neurophysiology Society. 14 Electrographic seizure exposure was dichotomized into high seizure exposure and low seizure exposure based upon a threshold analysis performed previously (high electrographic seizure was ≥4 for motor delay prediction and ≥3 for language delay prediction). 12
If infants were medically stable, then magnetic resonance imaging (MRI) was usually performed within 24-48 hours of rewarming. If MRI was not available during this period, then we used the first MRI after birth. MRI findings were abstracted and scored from reports in the electronic medical record. If the reports were not sufficient for scoring, then the MRI images were reviewed. MRI reports and images were reviewed by 1 clinician (W.F.) blinded to clinical and EEG data. MRI injury distribution was scored using published methods, 15 modified to include diffusion-weighted imaging signal abnormality in addition to abnormalities on T1- and T2-weighted images in the scoring system. The basal ganglia/white matter score was used for analyses. 15
Race and ethnicity information was abstracted from the electronic medical record. Information was self-reported by parents. Because 49 individuals (23%) identified as multi-racial or as “other” race and there were small numbers of several racial groups, we grouped individuals who identified as an REM into a single category. For the purpose of this article, we looked only at race and ethnicity (which are socially constructed variables) and not at ancestry (which has a biological basis). 16 Although race and ethnicity do not have a biologic basis, they are important in understanding health inequities given that historically they have been tied to access to resources such as education, employment, and health.
Socioeconomic information was inferred through the Social Vulnerability Index (SVI) 17 and insurance type. The SVI is a composite of 16 variables obtained from the US census combined to assess the overall degree of vulnerability of a population. These variables assess socioeconomic need, household characteristics, housing type, and race and ethnicity composition of a given census district. 17 SVI was converted into a 4-point ordinal scale of social need (1 = lowest; 4 = highest) based on their national quartile rank. Insurance type was categorized into private insurance, public insurance (Medicaid), or no insurance. Although insurance type does not perfectly categorize individuals by income, 18 most individuals on Medicaid fall below or close to the federal poverty line. Therefore, prior studies have used insurance type as a proxy for income. 19 Additionally, insurance type may affect individuals’ ability to follow up and access care, making it an important marker for health care disparities. Because of concerns that children with multiple medical comorbidities might acquire secondary Medicaid, only the primary insurance type was included. Only 1 child had no insurance in our cohort and was excluded from further analysis.
Neurodevelopmental outcomes were extracted from clinic notes from follow-up appointments in Neurology, Pediatrics, and the Neonatal Neurodevelopmental Follow-up Clinic. The Neonatal Neurodevelopmental Follow-up Clinic is a structured clinic that conducts follow-up appointments with developmental assessments at 3, 6, 12, 18, and 24 months of age using clinical interviews. A subset of children in the Neonatal Neurodevelopmental Follow-up Clinic were assessed using the Bayley Scales of Infant Development Third Edition (BSID-III). Neurology and pediatrics clinic visits used the routine clinical developmental screening questions performed by clinicians as part of follow-up. Neurodevelopmental outcomes from the most recent follow-up visit assessment were used in the analyses. A subject was categorized as having either motor or language delay if identified through the BSID-III or clinician assessment. As a secondary analysis, we assessed only subjects with BSID-III assessments and delay was considered a score <85, consistent with recommended cutoffs. 20
In our BSID-III secondary analysis, we used our previously established seizure thresholds for motor delay and language delay (≥4 seizures for motor delay and ≥3 seizures for language delay). 12 We performed the same threshold analysis for the cognitive subsection of the BSID-III and found that a threshold of ≥3 seizures were the minimum necessary to demonstrate an effect. This threshold was included in the BSID-III cognitive models.
Analyses
Summary statistics described baseline characteristics of the cohort. Categorical variables were described using proportions. Continuous variables were described with mean and SD (for normal distributions) or median and IQR (for skewed distributions).
To evaluate for any potential survivorship bias, we performed a bivariate analysis comparing the demographic and clinical factors of subjects with and without follow-up appointments.
Bivariate analyses examined baseline demographic and clinical differences between subjects with and without motor delays and language delays for both the full cohort and the subset with a BSID-III scores. Categorical variables were assessed using the Fisher exact test (fewer than 5 observations) or the χ2 test. Continuous variables were assessed with t tests and Wilcoxon rank sum tests.
A stepwise multivariate logistic regression was performed in which variables were sequentially added to the model to verify the significance of each variable. The analysis included variables with a P <.2 in univariate analyses, as well as preselected variables considered likely to be associated with developmental outcome based on prior studies (sex, gestational age, 5-minute Apgar score, imaging findings, EEG background, seizures, and SVI). The same variables were included for both the language and motor models, even if they were only significantly associated with one of those outcomes.
Results
There were 298 infants diagnosed with HIE, 282 infants underwent therapeutic hypothermia, 252 infants survived to discharge, 220 infants had at least 1 follow-up appointment, and 211 infants had sufficient data to be included in the cohort (Figure 1). The majority of children who did not survive to discharge had care withdrawn for either poor neurologic prognosis (n = 20), poor medical prognosis (n = 5), or both (n = 3). In addition, 6.2% (n = 13) families had a preferred language that was not English; however, information regarding the primary language spoken at home was not available. There were 98 patients with at least 1 BSID-III assessment for the sub-analysis. Table 1 provides demographic and clinical characteristics of the cohort. A higher percentage of REM individuals had public insurance than non-REM individuals (64% vs 34%, P < .001) and were from an area with higher social vulnerability than non-REM individuals (median SVI quartile 3 vs 2, P < .001). There were no other baseline differences between REM and non-REM individuals. The median time to MRI was 5 days (IQR 4-7). MRIs were obtained in 77% of infants (n = 162) in the first week following birth and later in 23% of infants (n = 49). The baseline clinical characteristics of REM and non-REM individuals were similar.
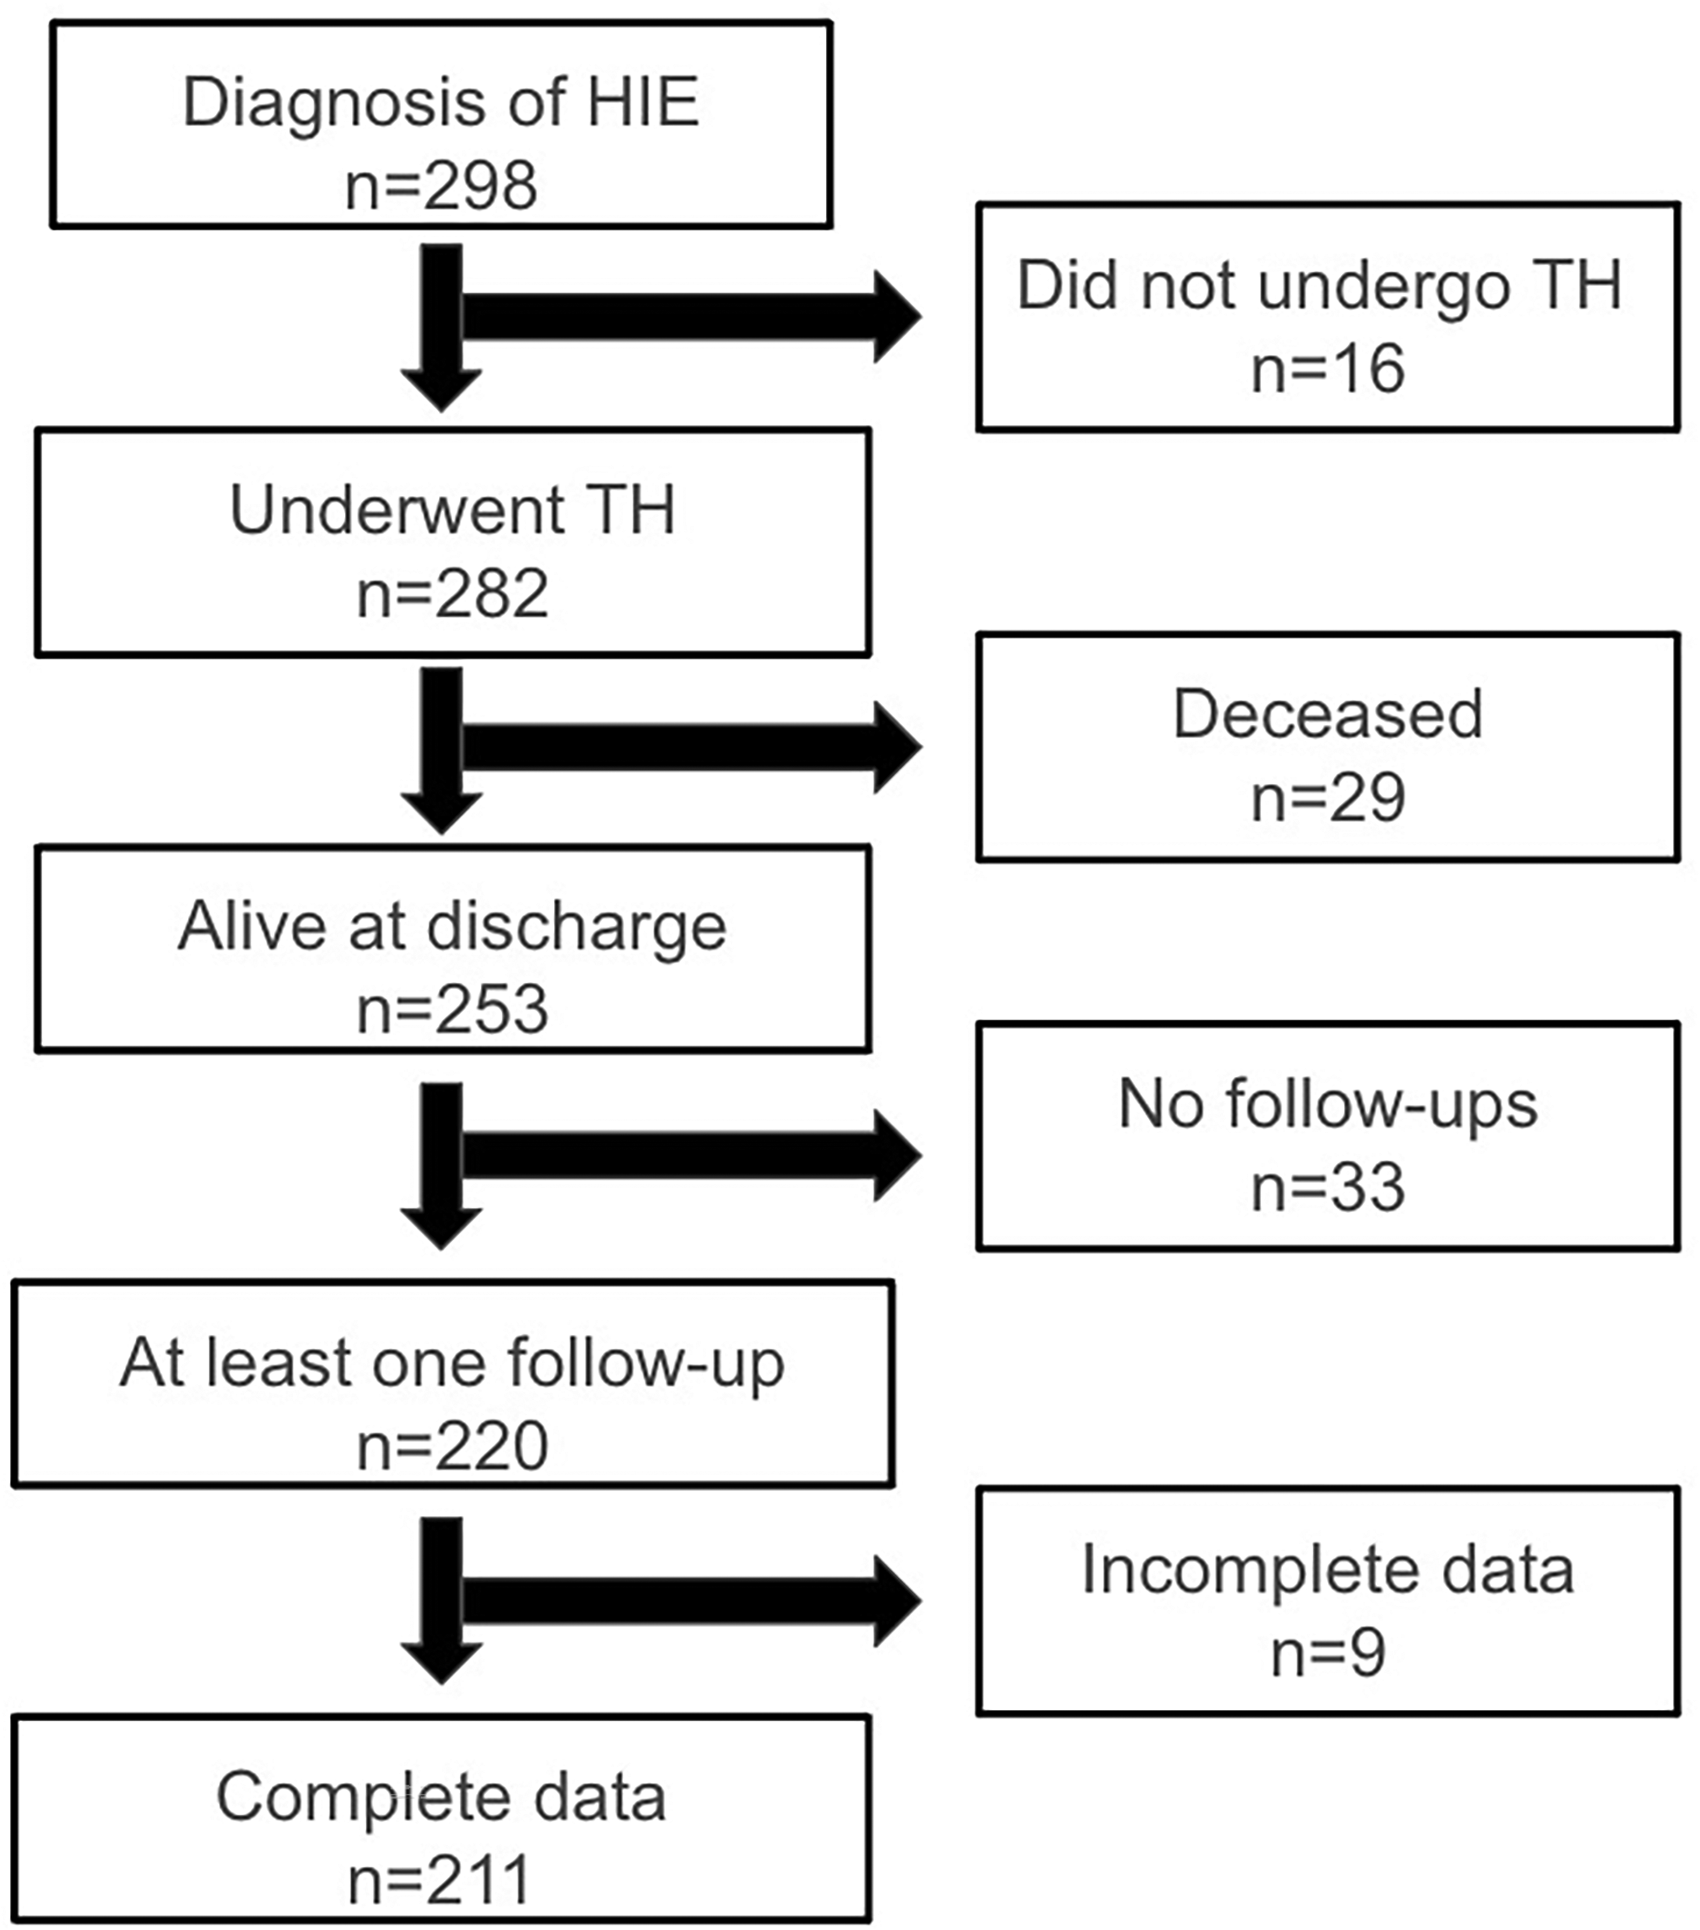
Flowchart of subject selection. HIE, hypoxic-ischemic encephalopathy; TH, therapeutic hypothermia.
Demographic and Clinical Characteristics in Racial and Ethnic Minority (REM) and Non-REM Individuals.a
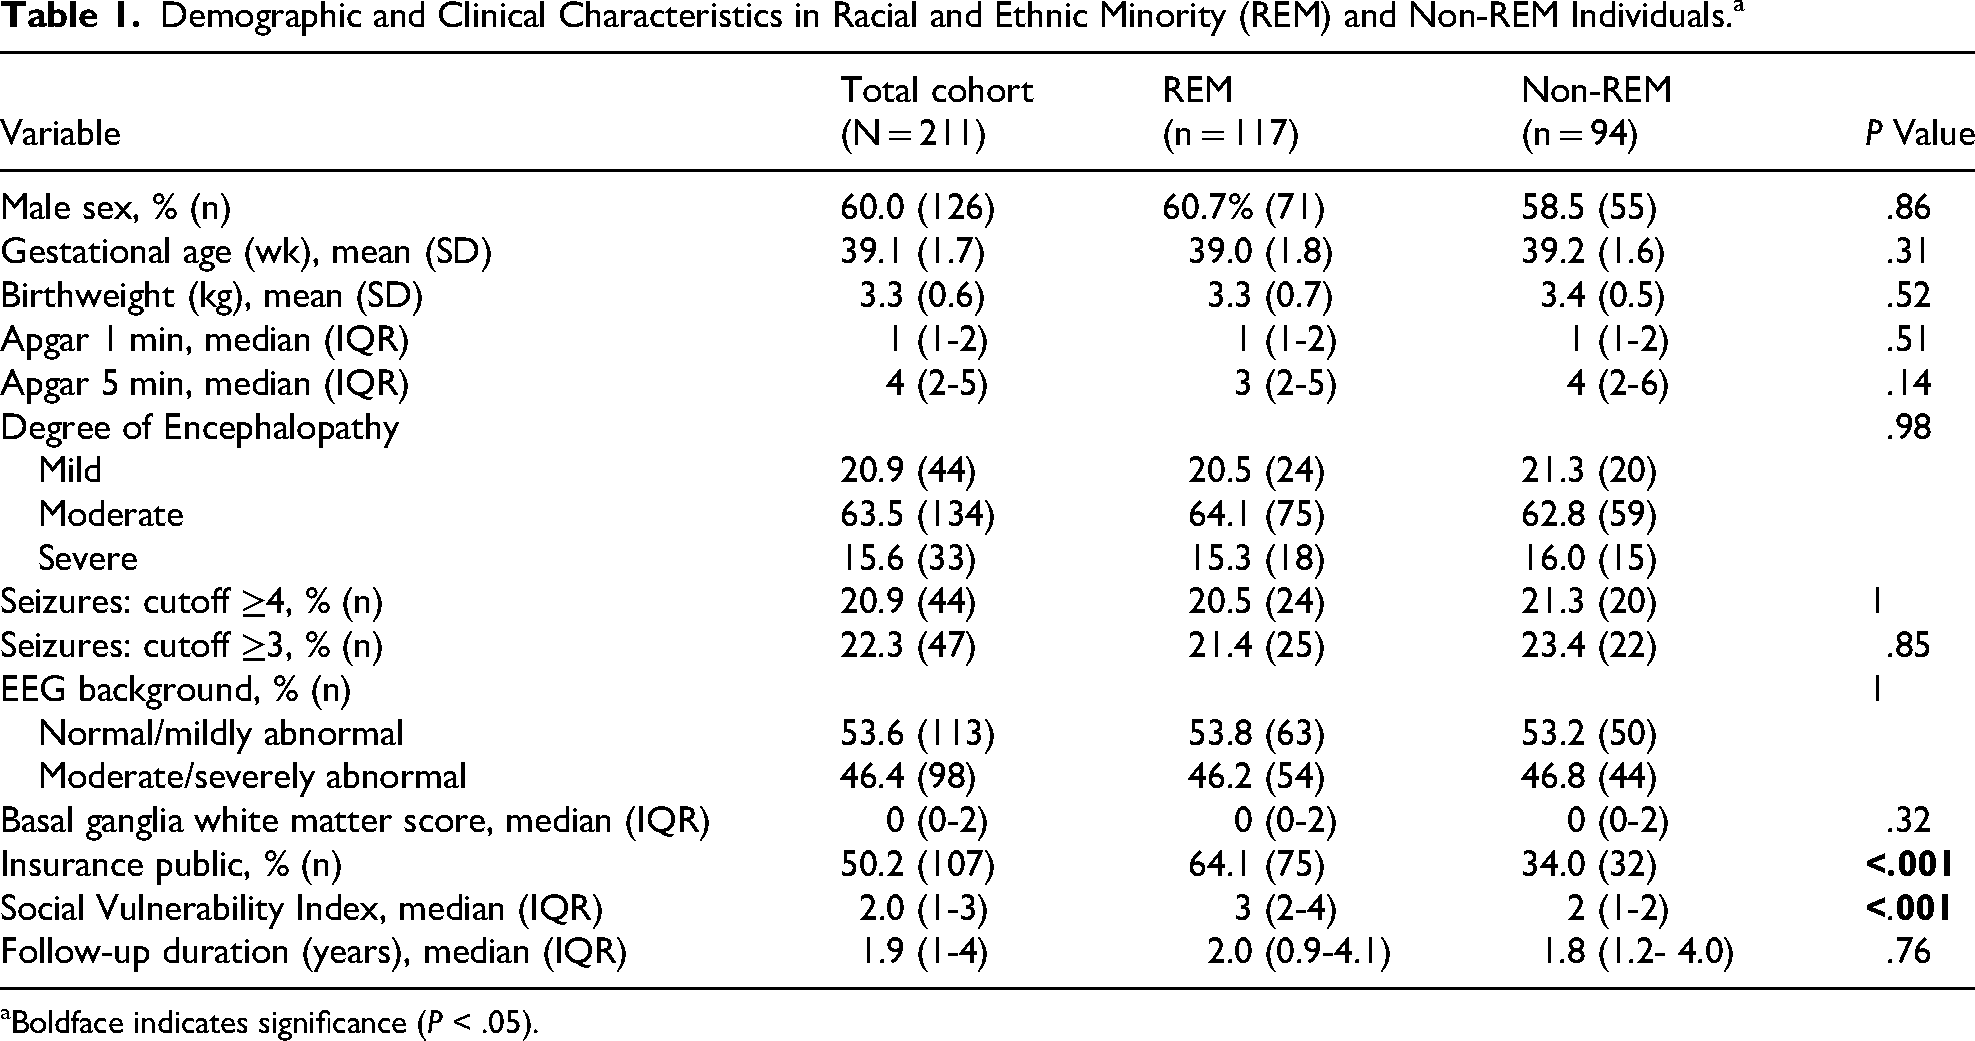
Boldface indicates significance (P < .05).
The median duration of follow-up was 1.9 years (IQR 1.1-4.1) for the full cohort and 1.7 years (IQR 1.1-2.1) for the subset with a BSID-III score. At the most recent follow-up visit, motor delay was present in 49 neonates (23%) and language delay was present in 59 neonates (28%). This included 32 neonates (15%) with both motor and language delay. Table 2 provides the bivariate analyses. The only SES variable significantly associated with motor delay was public insurance (65% with motor delay had public insurance vs 41% without motor delay had public insurance; P = .03). There were no significant differences between SVI or REM identity in children with motor delay. Children with motor delay had a significantly lower 1-minute Apgar score (median 0 vs 2; P < .001), more severe encephalopathy score (25% severe for children with motor delay vs 15% severe for children without motor delay; P = .04), more seizures (35% of children with motor delay with ≥4 seizure vs 15% of children without motor delay; P = .01), more abnormal EEG background (65% of children with motor delay with moderate/severe background vs 41% of children without motor delay; P < .001), and more severe abnormalities on MRI imaging (median BGW score 2 vs 0, P < .001). Children with language delay were more likely to identify as REM (70% with language delay identified as REM vs 50% without language delay identified as REM; P = .02) and have public insurance (64% with language delay had public insurance vs 45% without language delay with public insurance; P = .02). There was not a significant difference in SVI between children with and without language delay. Children with a language delay had a lower 5-minute Apgar score (median Apgar 3 with language delay vs 4 without language delay; P = .006), more severe encephalopathy score (25% of children with language delay with severe encephalopathy vs 12% of children without language delay; P = .02), and longer duration to follow-up (median 2.1 years for children with language delay vs 1.7 years for children without; P = .001).
Bivariate Analysis Comparing Subjects With and Without Delays at Follow-Up.a
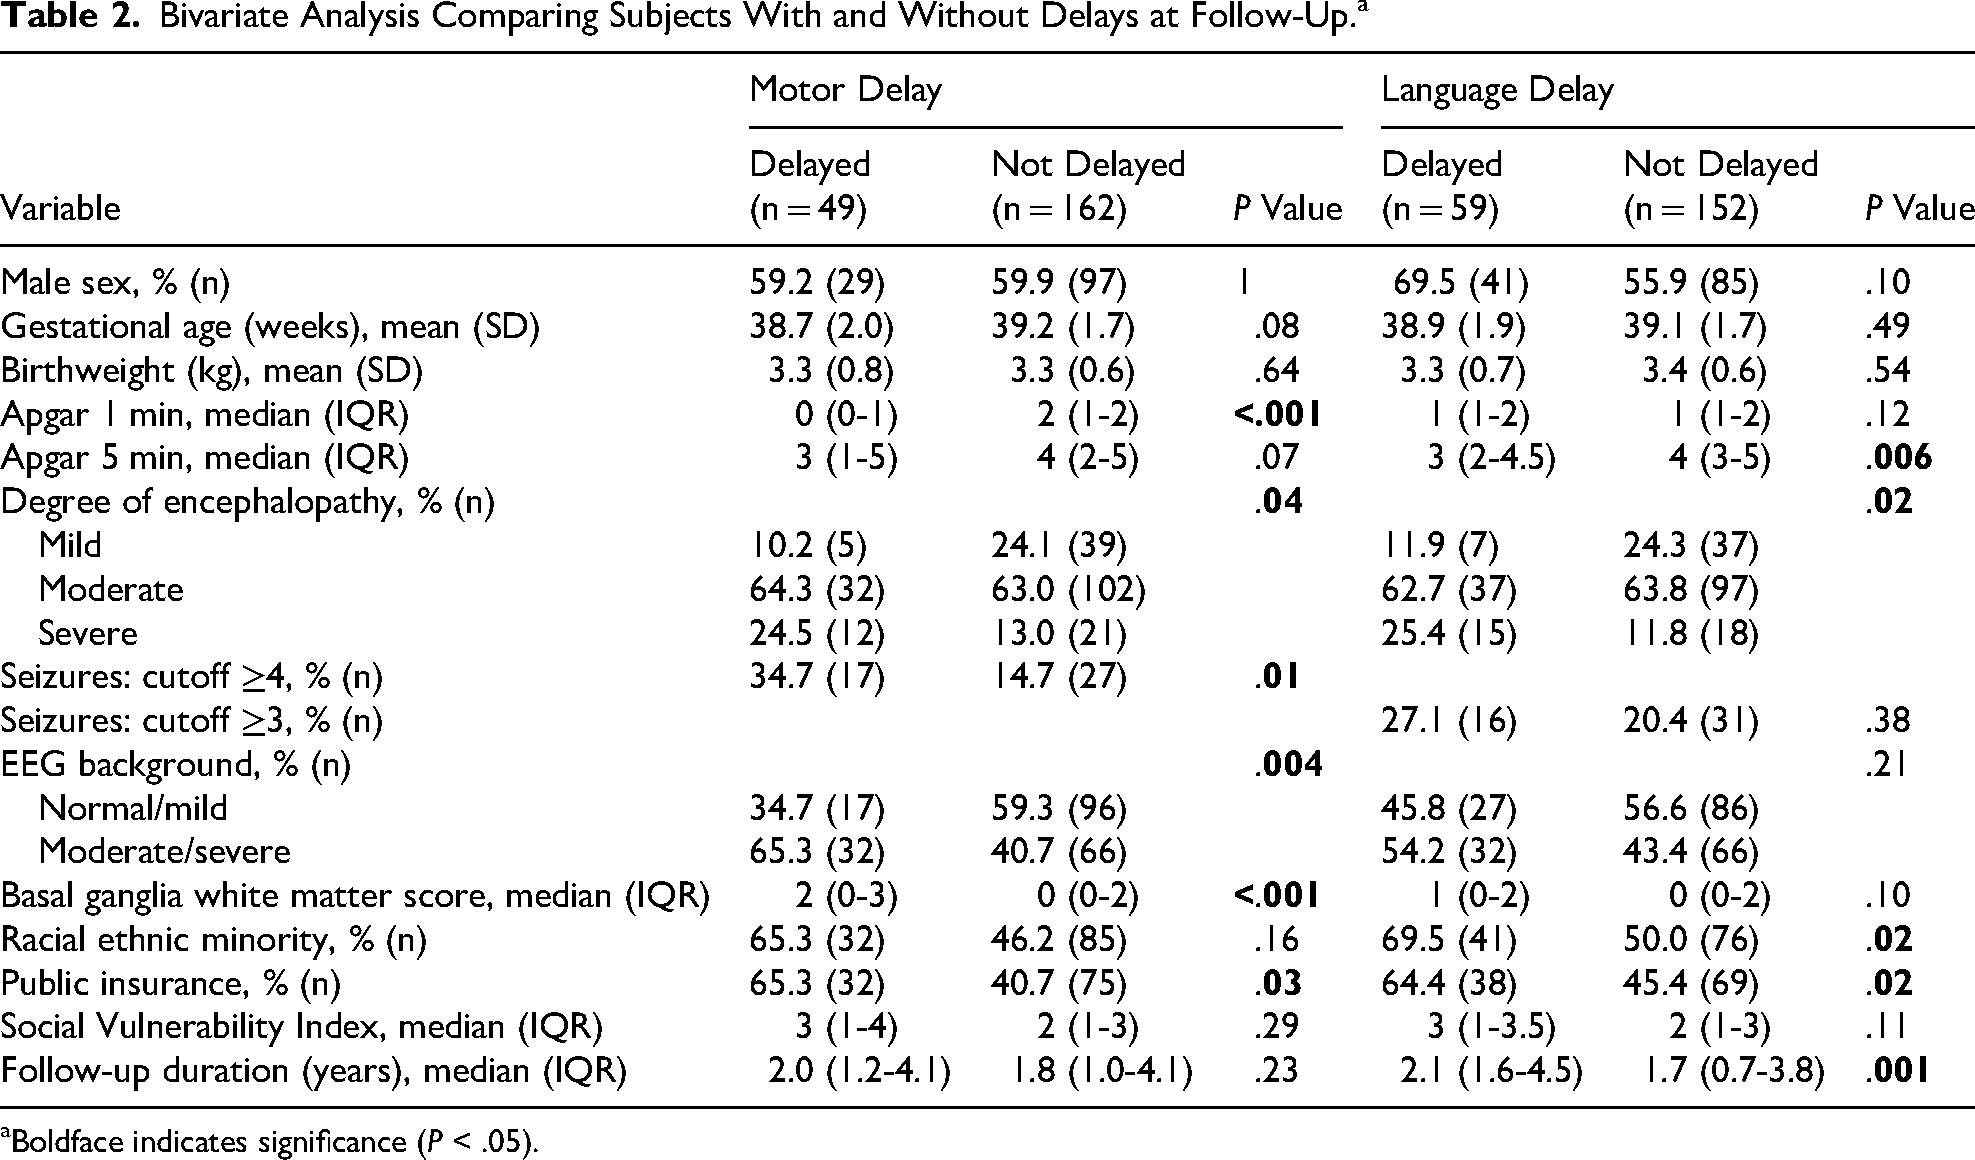
Boldface indicates significance (P < .05).
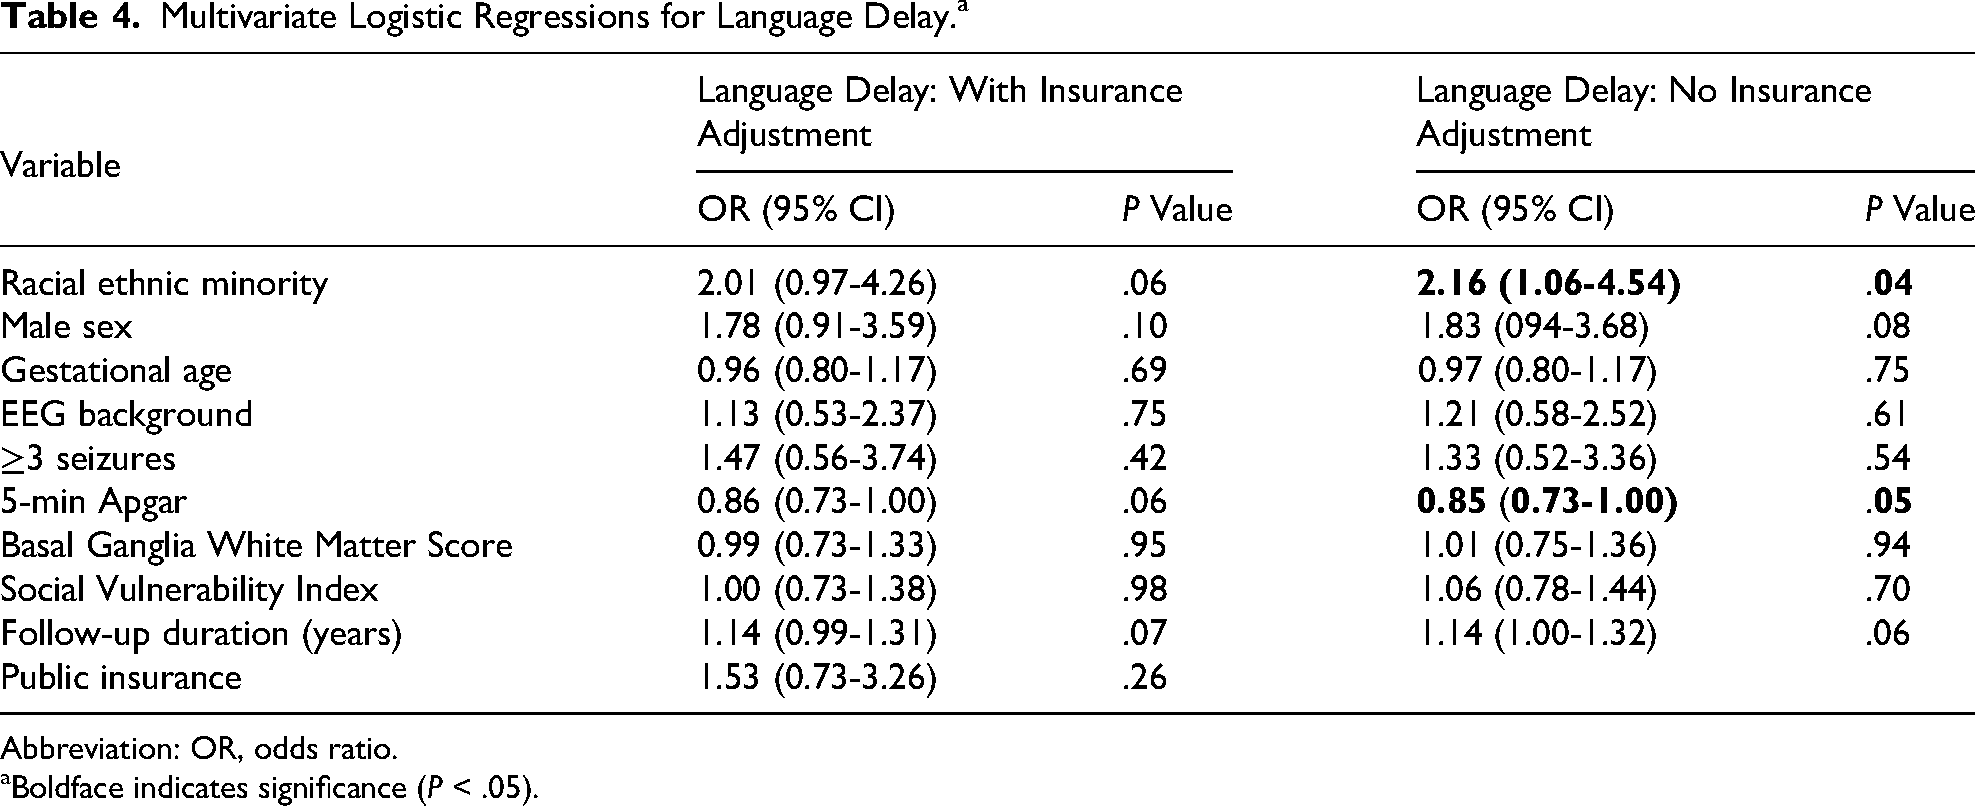
Variables with P < .2 in either the motor delay or language delay bivariate analysis were included in multivariate analyses, including sex, gestational age, 5-minute Apgar score, EEG background, seizure exposure, basal ganglia white matter score, SVI (divided into quartiles), insurance type, and years to most recent follow-up visit. All of the a priori variables preselected to be included in the model had P values of <.2 in either the language delay or motor delay bivariate analyses. One-minute Apgar score was not included in the model as 5-minute Apgar score has been previously shown to be associated with neurodevelopmental outcome. 21 For motor delay, no socioeconomic or clinical variables were statistically significant predictors of delay, although public insurance was marginally associated with motor delay (OR 1.99, 95% CI 0.89-4.58; P = .10) (Table 3). For language delay, identifying as REM (OR 2.16, 95% CI 1.06-4.54; P = .04) and 5-minute Apgar score (OR 0.85, 95% CI 0.73-1.00; P = .05) were significant predictors of delay until insurance type was added into the model (Table 4). After introduction of insurance type, an association of a similar magnitude remained between language delay and both REM status (OR 2.01, 95% CI 0.97-4.26; P = .06) and 5-minute Apgar score (OR 0.86, 95% CI 0.73-1.00; P = .06) although these associations were no longer statistically significant. There were no other significant demographic or clinical associations with language delay, although years to follow-up appointment approached significance, with children with language delays trending toward more years of follow-up (OR 1.14, 95% CI 1.00-1.32; P = .06).
Multivariate Logistic Regressions for Motor Delay.a
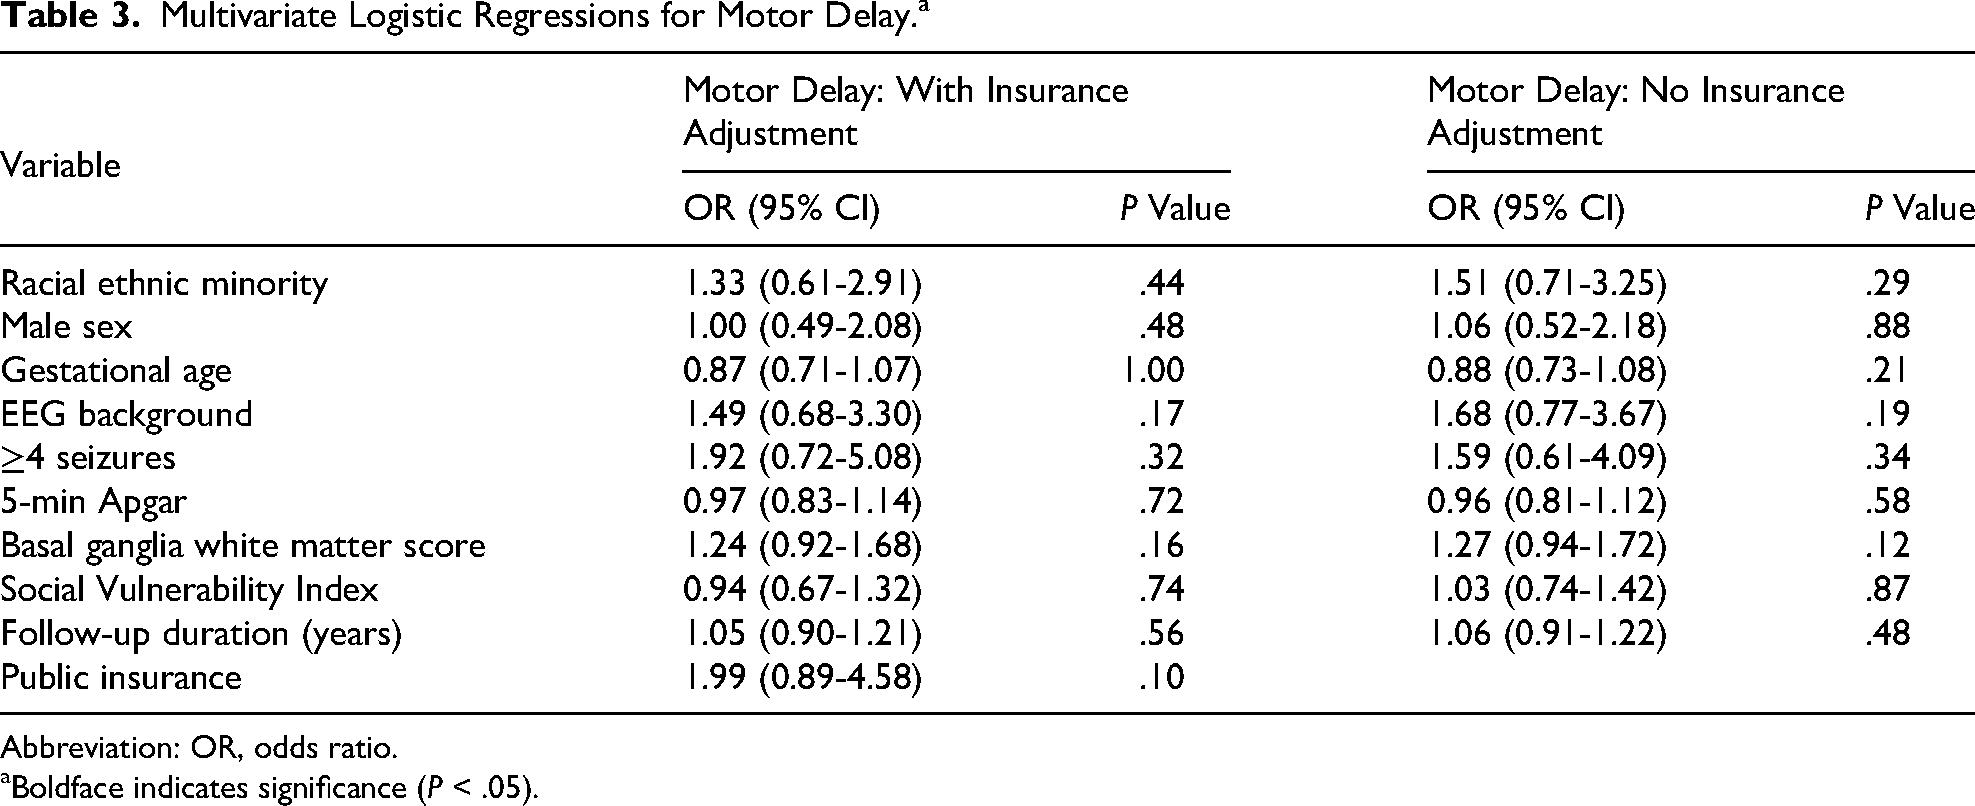
Abbreviation: OR, odds ratio.
Boldface indicates significance (P < .05).
Multivariate Logistic Regressions for Language Delay.a
Abbreviation: OR, odds ratio.
Boldface indicates significance (P < .05).
Among the 98 children who had a BDSI-III, motor delay was present in 11 neonates (11%), language delay was present in 28 neonates (29%), and cognitive delay was present in 17 neonates (17%). There were not significant differences in the number of children who had a documented BDSI-III between REM and non-REM individuals (52% of non-REM vs 42% of REM; P = .18) or between children with private or public insurance (49% for private insurance vs 44% for public insurance; P = .54). Supplemental Table 1 provides the bivariate analysis. No socioeconomic or clinical variables were associated with motor delay. Children with language delay were more likely to identify as REM (68% with language delay identified as REM vs 40% without language delay; P = .04) and have higher encephalopathy score (29% children with language delay had severe encephalopathy vs 7% without language delay; P = .03). Children with cognitive delay were more likely to identify as REM (77% with cognitive delay identified as REM vs 42% without cognitive delay, P = .02), have a higher BGW score on MRI (median 2 vs 0, P = .007), and were more likely to have a higher number of seizures (53% with cognitive delay had more than 4 seizures vs 16% without cognitive delay, P = .003). Multivariate logistic regressions were performed with the same variables that were used in the overall cohort analysis. For both motor delay and language delay, there were no socioeconomic or clinical factors that remained significant in the multivariate models. REM identity remained associated with the language delay, though the association did not achieve statistical significance (OR 2.63, 95% CI 0.87-8.41, P = 0.09). Having 3 or more seizures was significantly associated with cognitive delay at follow-up (OR 6.47, 95% CI 1.23-37.71, P = .03) and REM identity was marginally associated with cognitive delay at follow-up (OR 4.90, 95% CI 1.04-30.69), P = .06). Multivariate models with the BDSI-III are summarized in Supplemental Table 2.
We attempted to repeat the Bayley analysis using a cutoff of <70, which has previously been used to suggest moderate delays. 20 With this cutoff there were very few delayed individuals. There were a total of 5 with motor delay, 12 with language delay, and 6 with cognitive delay, precluding a multivariate analysis. In bivariate analysis, examining associations between delay and REM identity were not significant (Supplemental Table 3). However, because of the small sample size we cannot determine if this result is due to a lack of statistical power or a true absence of an association.
In the analysis comparing subjects with and without follow-up visits, more subjects without follow-up visits had moderate encephalopathy (83% with follow-up visits vs 64% without follow-up visits; P = .01). There were no significant differences in other clinical or socioeconomic variables (Supplemental Table 4). REM identity was not associated with likelihood of follow-up (75% of individuals without follow-up appointments identified as REM vs 55% of individuals with follow-up appointments; P = .11).
We performed 2 exploratory analyses to evaluate infants who may have been borderline for traditional cooling criteria. First, we compared outcomes in those with mild encephalopathy scores compared to those with moderate and severe encephalopathy scores. Infants with a mild encephalopathy score did have a trend toward less language delay (15.9% vs 31.1%, n = 0.07) and motor delay (11.4% vs 26.3, P = .06) at follow-up. Multivariate linear regression could not be performed given the small sample size.
Second, we compared outcomes in infants born before 36 weeks’ gestation to those born at 36 weeks’ gestation or later. There were 14 infants born prior to 36 weeks’ gestation who received therapeutic hypothermia. There were no significant differences in the rates of motor delay (28.6% vs 29.6%, P = .74) or language delay (28.6% vs 38.7%, P = 1) in the infants born before or after 36 weeks’ gestation.
Discussion
In this large study of neonates with HIE treated with therapeutic hypothermia, we determined that REM identity was associated with language delay but not motor delay after controlling for other clinical and socio-economic variables. These findings suggest that children of REM identity have a disproportionate risk of language delay after neonatal HIE, even when controlling for factors such as HIE severity, EEG background abnormalities, and seizure exposure. Importantly, when insurance status was added to the model, REM identity remained associated with language delay, though it was no longer statistically significant. Although the main study assessed outcome through clinician impression, the findings were similar in a smaller subcohort evaluated with a standardized neurodevelopmental inventory (BSID-III). In this smaller cohort, we were also able to examine cognitive delay, which was marginally associated with REM identity.
The fact that the association between REM identity and language delay was only slightly attenuated by adding insurance type to the model suggests that there are societal barriers at play outside of strict insurance access. However, the fact that adding insurance to the model lessened the association may suggest that access to specific providers or out-of-pocket costs may play a role in this disparity. Although the retrospective nature of this study prevented more nuanced assessment of the association between REM identity and language delay, the finding is in line with the prior literature on racial and ethnic disparities in developmental delay. Prior studies looking at higher-risk children, such as children with cerebral palsy and autism, determined that children of REM background were more likely to have higher degrees of impairments.22,23
Several factors may contribute to the racial and ethnic disparities found in language delay. First, prior studies have shown biased referral practices by medical providers.24-26 One study found that children from families who identify as Black or Hispanic were less likely to receive a developmental assessment from a health care provider. 24 Other studies indicated that Black children were referred later to early intervention than White children 27 and that providers were less likely to refer children from REM backgrounds to early intervention therapies after a positive developmental screening test. 28 Once children were referred to therapies, children of REM background face barriers in accessing therapies. Children who identified as Black or Hispanic were less likely to have established care with a speech therapist within 1 year of a referral being placed. 26 Further, compared with White children, Black children who qualified for early intervention were 5 times less likely to receive services. 29 Given early referral and facilitation of early access to therapies is important in children at risk for developmental delay,30,31 these gaps in referring and establishing services in high-risk groups, such as those with HIE, may contribute to disparities at follow-up.
Beyond barriers in accessing appropriate health care, there are several other social determinants of health that may disproportionally affect children from REM backgrounds. Adverse childhood experiences have been associated with an increased risk of developmental delays.32,33 Importantly, adverse childhood experiences are more common in children with an REM background, 34 making this a potential mechanism for disparities. One study showed that 61% of non-Hispanic Black children and 51% of Hispanic children reported at least 1 adverse childhood experience. 35 In contrast, only 40% of non-Hispanic White children and 23% of Asian children reported 1 or more adverse childhood experience. 35 Similarly, numerous developmental toxins, such as lead, have been associated with an increased risk of developmental delays. 36 Like adverse childhood experiences, these toxins are frequently found at higher rates in REM communities. 37 Numerous studies have shown that REM background as well as lower family income were both independently associated with increased lead levels.37-39 These disparities have persisted over time despite increased lead screening and increasing national regulation surrounding lead. 37 Finally, there are likely other unmeasured societal factors related to a longstanding history of structural racism for which our retrospective study cannot account.
In addition to the racial and ethnic disparities, studies have shown strong associations between socio-economic status and developmental differences.40,41 This finding is not specific to the United States and has been replicated in countries throughout the world.42–45 The exact reason for this association is unknown; however, numerous theories have been investigated, including increased child and parental stress causing hormonal changes, lack of adequate nutrition, and inability to focus on learning experiences given the demands to focus on basic needs. 46
Interestingly, the association between socio-economic status and developmental differences was not clearly seen in our analysis. SVI, which was our primary marker of socio-economic status, was not associated with either motor delay or language delay after neonatal HIE. Importantly, we did see an effect of insurance type (public vs private), which has also been used as a marker of socio-economic status. 47 We have 2 hypotheses regarding the lack of relationship with SVI despite the association with insurance type. First, SVI is a census tract level variable developed by the Center for Disease Control to categorize the vulnerability of a region to adverse effects from natural and man-made disasters. 48 As such, SVI is less specific to a particular individual than insurance status. Thus, our cohort may have been too small to identify a statistical difference using a geographically-based rather than individually-based measure of income. Although other studies have identified socio-economic differences using census track measures with relatively small sample sizes, there are unique factors about our data that lead to greater variability. One of the zip codes neighboring our hospital (19146) was rated as one of the 10 zip codes with the greatest gentrification using the 2000 census and 2016 American Community survey. 49 Although fewer than 5 individuals from our cohort came from this zip code, 2 of the 10 most rapidly changing zip codes in the country were in the city of Philadelphia during our study period, suggesting a time of rapid economic and demographic change, potentially yielding greater variability in how accurately a census tract level variable predicts an individual family's socio-economic background.6,50 A second possibility is that there is something specific about insurance type—such as ability to access specific services, that is related to the associations seen in our sample.
It is not clear why we identified an association between REM identity and language delay but not motor delay. It is possible that language development is more affected by external factors. Previous studies showed that children from lower SES background have slower language development than those from higher SES backgrounds, disproportionate to differences seen in other cognitive domains. 51 The factors contributing to this disparity in language development may be similar to factors contributing to differences in global development that are influenced by SES, including nutritional deficits and lack of access to educational resources, 46 although it is not clear why language is more vulnerable than other domains. We identified this association with REM status and not SES; however, it is possible that similar factors are at play given the relationship between REM status and insurance type (a surrogate of income) in our study. Further investigation is warranted to better understand these factors because some could be amenable to interventions, such as nutritional supplementation or targeted educational or developmental supports.
In our subset analysis of children who received the BDSI-III, there also was a marginal association between REM identity and cognitive delay. As it is difficult to determine cognitive delay based on clinical notes, we could not examine this in our overall analysis. Like language delay, there is some evidence that cognitive delay is more affected by environmental factors than motor delay. 52 However, the CI for this finding was large (1.23-37.71), suggesting less precision and more uncertainty in this finding, likely owing to the small sample size. Further research is needed to confirm this finding.
Finally, the number of years of follow-up was significant in bivariate analysis for language delay but not motor delay. Years of follow-up remained marginally associated with language delay in the multivariate analysis. This may reflect the difficulty in measuring language delay in young children and the need to follow children more longitudinally to track subtle delays. However, it is also possible that this reflects the fact that over time there are more environmental factors that accumulate and lead to later onset of delays.
In addition to our primary analysis, we performed an exploratory analysis examining differences among children presenting with mild encephalopathy at the time of transfer to our institution, as well as infants born at less than 36 weeks’ gestation. Clinical equipoise currently exists for both groups regarding the long-term benefits of therapeutic hypothermia.53,54 Although we did not observe significant differences, our study was underpowered to draw definitive conclusions. Further research is therefore needed to understand these populations and the potential impact of treatment.
This study has several limitations. First, we grouped all REM individuals together for analyses since the cohort included small numbers of several racial groups, as well as many individuals who identified as multirace. Excluding individuals who identified as 2 or more races, especially given the high percentage in our sample, would oversimplify the data and overlook intersectionality. Individuals of different races have different challenges, historical contexts, experiences of discrimination, and interactions in our health system, and ideally should not be grouped together. Additionally, in grouping all REM individuals together the data do not allow examination of differences between racial groups and risks masking inequalities, as different racial groups may have different disparities. Although our data and analysis do not provide the nuance to discuss the different experiences and challenges of different racial groups in the United States, it does indicate that individuals of color may have factors that lead to a greater likelihood of language delays. Given this study at a large quaternary care institution with more than a decade of data could not generate a sufficiently large cohort to analyze without grouping, larger multicenter studies may be required to better assess these important questions.
Second, the study was retrospective and thus limited to assessment of variables that were documented as a part of clinical care. For this reason, we chose to define variables in ways that were more likely to be included in a routine visit, such as a physician assessment of motor and language delay based on neurodevelopmental milestone acquisition, rather than a formalized scale. This may lead to more variability in our outcome measures. However, analysis of a subcohort with more formal assessment (BSID-III) yielded similar findings, suggesting that physician assessment of the presence or absence of delays is a reliable measure. Similarly, we were limited assessing sociodemographic variables we could determine based upon pre-existing information. Therefore, we included medical insurance type, which could be obtained from the medical record, and SVI, which could be assigned based on home address. Although these variables are important, they may miss some aspects of individual sociodemographic variables such as income and education.
In addition, retrospective longitudinal studies have the inherent risk of survivorship bias. To evaluate for this, we compared the patients from our cohort with and without follow-up visits. We saw a significant difference in encephalopathy score, with individuals with moderate encephalopathy less likely to have a follow-up visit, as well as a marginal difference in REM status, with REM individuals less likely to follow-up than non-REM individuals. It is difficult to interpret the clinical significance of more individuals with a moderate encephalopathy score not undergoing follow-up and whether this affected the results. However, the finding that REM individuals were less likely to follow-up could potentially affect our results in different ways. The most likely possibility is that those who did follow-up had overall better access to care and services, and therefore disparities were underestimated in the sample. Alternatively, it is possible that REM individuals were more likely to follow-up if they had impairments. This would mean that the results demonstrated difficulty accessing care for patients with no or minor impairments, leading to a sample enriched with delays, rather than higher rates of language delays overall.
Conclusion
Despite these limitations, this study is an important first step in examining disparities in developmental outcomes after neonatal HIE. The large but single-center cohort indicated that REM identity was associated with language delay but not motor delay. Given this association was attenuated slightly by the addition of insurance type into the model, complex societal factors may be at play, given that insurance type is correlated with household income. Future studies are needed to evaluate disparities prospectively, which would allow for more exact measures of development and enable more detailed evaluation of the effect of survivorship bias. Our hospital has a diverse patient population. We serve as a community hospital for Philadelphia as well as a large referral center. This improves the representativeness of our finding; however, studies in different samples, including other urban and rural populations, would also help confirm the generalizability of our finding. Additionally, evaluating the reason for greater rates of language delay, such as access to speech and language therapy, is important as this would allow clinicians to target interventions that would allow for more equitable and improved outcomes in all children with HIE.
Supplemental Material
sj-docx-1-jcn-10.1177_08830738261456908 - Supplemental material for Racial, Ethnic, and Socioeconomic Associations with Outcomes in Neonatal Hypoxic Ischemic Encephalopathy: A Retrospective Cohort Study
Supplemental material, sj-docx-1-jcn-10.1177_08830738261456908 for Racial, Ethnic, and Socioeconomic Associations with Outcomes in Neonatal Hypoxic Ischemic Encephalopathy: A Retrospective Cohort Study by Whitney Fitts, Amanda G. Sandoval Karamian, Marissa M. Anto, Shavonne L. Massey, France W. Fung, Nicholas S. Abend and Mark P. Fitzgerald in Journal of Child Neurology
Supplemental Material
sj-docx-2-jcn-10.1177_08830738261456908 - Supplemental material for Racial, Ethnic, and Socioeconomic Associations with Outcomes in Neonatal Hypoxic Ischemic Encephalopathy: A Retrospective Cohort Study
Supplemental material, sj-docx-2-jcn-10.1177_08830738261456908 for Racial, Ethnic, and Socioeconomic Associations with Outcomes in Neonatal Hypoxic Ischemic Encephalopathy: A Retrospective Cohort Study by Whitney Fitts, Amanda G. Sandoval Karamian, Marissa M. Anto, Shavonne L. Massey, France W. Fung, Nicholas S. Abend and Mark P. Fitzgerald in Journal of Child Neurology
Footnotes
ORCID iDs
Ethical Considerations
This study was approved by the Children's Hospital of Philadelphia Institutional Review Bord
Consent to Participate
Individual Consent was waived given that the study was retrospective, did not require direct patient contact, and had minimal risk.
Consent for Publication
Not applicable
Author Contributions
W. Fitts contributed to study conception/design, data acquisition, analysis, and interpretation, and manuscript drafting and revision. A. Sandoval Karamian contributed to data acquisition, analysis and interpretation and critically revised the manuscript. M. Anto contributed to data analysis and interpretation and critically revised the manuscript. S. Massey contributed to data acquisition, analysis, and interpretation and critically revised the manuscript. F. Fung contributed to data acquisition, analysis, and interpretation and critically revised the manuscript. N. Abend contributed to study conception and design, data analysis and interpretation, and critically revised the manuscript. M Fitzgerald contributed to study conception and design, data, acquisition, analysis, and interpretation, and critically revised the manuscript.
Funding
The authors received no financial support for the research, authorship, and/or publication of this article.
Declaration of Conflicting Interests
The authors declared the following potential conflicts of interest with respect to the research, authorship, and/or publication of this article: AGSK is supported in part by the Pediatric Epilepsy Research Foundation (PERF) Elterman Research Grant.
Data Availability
Data will be made available upon request.
Supplemental Material
Supplemental material for this article is available online
References
Supplementary Material
Please find the following supplemental material available below.
For Open Access articles published under a Creative Commons License, all supplemental material carries the same license as the article it is associated with.
For non-Open Access articles published, all supplemental material carries a non-exclusive license, and permission requests for re-use of supplemental material or any part of supplemental material shall be sent directly to the copyright owner as specified in the copyright notice associated with the article.