
Abstract
Artificial tissue constructs require vehicles for controlled release of growth factor to induce cellular signaling in vivo conditions. The objective of this study was to develop a three-dimensional porous tissue engineering scaffold with the capability of carrying nanoparticles for their controlled release. Epidermal growth factor and fibroblast growth factor were encapsulated into chitosan nanoparticles of an average diameter of 50–100 nm. Porous collagen–chitosan scaffolds were prepared by freeze-drying method. The pores of the scaffolds were well interconnected, with a mean diameter of 75–150 µm. The in vitro release kinetics data indicated that nanoparticle impregnated scaffolds released epidermal growth factor and fibroblast growth factor in a sustainable manner. The cytocompatibility, proliferation, and cell attachment characteristics of the biopolymeric scaffolds were evaluated through 3-(4,5-dimethylthiazol-2-yl)-2,5-diphenyl tetrazolium bromide assay, flow cytometry, and scanning electron microscope. The results demonstrated that the dual delivery of epidermal growth factor and fibroblast growth factor from chitosan nanoparticles of collagen–chitosan scaffolds significantly enhanced the cellular viability and activity. The in vitro data clearly confirmed that the growth factors incorporated in chitosan nanoparticles and placed in hybrid scaffolds have favorable characteristics for drug delivery and tissue engineering application.
Introduction
Tissue engineering is a promising technology that uses cells and biomaterials to replace damaged tissues or organs.1,2 Collagen (COL) and chitosan (CS) have been used as biomaterials in the fields of bioengineering and drug delivery. They both have intrinsic properties that provide a strong but manipulatable scaffold structure for multicellular organisms. One of the most promising features of these two biomaterials is the capability to form porous scaffold structures for use in cell transplantation and tissue regeneration.3,4 The three-dimensional (3D) structure of these scaffolds provides physical support, allows interaction between cells, and acts as a substrate regulating cell growth, adhesion, and differentiation. 5
A porous scaffold in itself is insufficient to induce rapid tissue regeneration at the initial stages of healing. 6 However, a combination of the use of growth factors added to the porous scaffold substantially improves tissue-forming efficacy. Growth factors can be introduced into tissue-engineered systems, by various methods, for example, by addition to the culture, by genetically engineering cells to over express growth factors, and by constructing polymeric systems that provide controlled release of growth factors. 7 The epidermal growth factor (EGF) plays critical roles in cellular processes, such as in proliferation, migration, differentiation, and survival of different types of cells, especially fibroblasts and epithelial cells. EGF is a proangiogenic biomolecule with chemotactic properties on endothelial cells. 8 Fibroblast growth factor (FGF), another well-studied angiogenic factor, elicits diverse biological effects on numerous cell types, including endothelial cells, and has been used in clinical trials to induce angiogenesis. 9 Combining these multiple types of factors into a single biomaterial 10 could replicate the multifunctional nature of the native extra cellular matrix (ECM) to regulate tissue regeneration and engineering. For instance, combinations of vascular endothelial growth factor (VEGF)–platelet-derived growth factor (PDGF) and FGF–PDGF have synergistically induced stable vascular networks with dramatic increase in the maturity of engineered vessel networks.11,12
EGF/FGF-loaded scaffolds release growth factors for only 14 days. 13 We wanted to extend this delivery period by modifying the scaffold system. Therefore, the incorporation of EGF- and FGF-loaded nanoparticles into the scaffold to improve tissue-forming efficacy by using a combination of multiple growth factors to mimic the environment during the cell differentiation process was considered. Among the various natural polymers, CS, a widely used biopolymer for the preparation of nanoparticles, was adopted for the project.14,15
Zhou et al. 16 have reported the preparation of a fibrin gel loaded with chitosan nanoparticles (CNP) for local delivery of recombinant human epidermal growth factor (rhEGF) in vitro. Earlier, we had encapsulated EGF and FGF into CNP for controlled delivery in vitro, and the growth factor release was evaluated by using mouse 3T3 fibroblasts cells. 17 In the present study, a versatile system consisting of CNP impregnated COL–CS scaffold to create an efficient vehicle for EGF and FGF release in a sustained manner with enhanced neovascularization and tissue regeneration to support further cell differentiation with adequate nutrient and oxygen supply was pursued.
Methods and materials
Preparation and characterization of CNP
Growth factor–loaded CNP was formed by incorporating either FGF-loaded 0.1% tripolyphosphate (TPP) to 0.2% CS solution in 1% acetic acid or EGF-loaded CS to TPP. 18 Dual growth factor–loaded CNP was formed spontaneously upon addition of TPP, containing FGF, to CS solution, containing EGF, under stirring. Appearance of turbidity was taken as an indicator for the formation of nanoparticles. The solution was centrifuged at 20,000 rpm for 20 min to separate the supernatant and nanoparticles. The supernatant was used to quantify the unbound free growth factor by the enzyme-linked immunosorbent assay (ELISA) method using human EGF and FGF Quantikine ELISA kit as per manufacturer’s instructions (R&D Systems, USA).
The morphological characteristics of the nanoparticles were examined using high-resolution transmission electron microscopy (HRTEM) (JEM 3010; JEOL, USA). The aqueous dispersion of the particles was drop cast onto a carbon copper grid, and the grid was air-dried. The sample was then stained with 1% uranyl acetate solution for 5 s at 7°C before viewing on the HRTEM.
Preparation of CNP incorporated COL–CS scaffolds
COL used in this work was extracted from rat tail tendon (RTT). 19 CS and purified RTT COL were dissolved separately in 0.5 M of acetic acid to form 1% solutions. The CS solution was slowly added to the COL to form a 1:1 COL–CS solution, which was stirred at 4°C for 12 h. CNP (1 mg/mL) with (or without) growth factor was then added. The mixture was then transferred into Petri dishes and frozen at 4°C, −20°C overnight, and −80°C for 2 h. The samples were then lyophilized to obtain the scaffold. The pore size in the horizontal and vertical cross sections of the lyophilized scaffolding was observed on Hitachi SCM, and the average diameters of 30 pores from different scaffold areas were recorded.
Immunofluorescent analysis
To visualize the distribution of EGF and FGF in the CNP impregnated COL–CS scaffolds, the scaffolds were treated with respective primary antibodies, anti-EGF, anti-FGF (R&D systems, USA) diluted (1:200) with 0.1 M phosphate buffer solution (PBS) for 12 h. After washing with PBS, the scaffolds were incubated with fluorescence isothiocyanate-conjugated secondary antibody (1:100 dilution) for 1 h at room temperature. 20 The scaffolds were stained and then washed with PBS and distilled water. The images were observed with a fluorescent microscope.
In vitro release study
The release of EGF and FGF from the EGF–CNP and FGF–CNP impregnated COL–CS scaffolds was determined by suspending each of the scaffolds in 1 mL of 0.1 M PBS, incubated at 37°C under gentle agitation. At specific time intervals, the samples were removed, centrifuged, and the amount of growth factor released in the medium was quantified with an ELISA kit. All measurements were carried out in triplicates.
Characterization of scaffolds
The dried samples were used for the characterization studies. Fourier transform infrared (FTIR) spectra of COL, CS, or the combination of COL–CS (1:1) were obtained using PerkinElmer FTIR spectrometer (Perkin-Elmer Co., USA). Thermodynamic characteristics of scaffolds containing COL, CS, or COL–CS were carried out by differential scanning calorimeter (Perkin-Elmer, DSC Q200 V23.10 Build 79) instruments, and thermogravimetric analysis was performed using (Perkin-Elmer, TGA Q50 V20.6 Build 31) instruments at a uniform heating rate of 10°C/min.
Cell culture
Murine NIH 3T3 fibroblast cells were obtained from National Centre for Cell Science (NCCS; Pune, India) and cultured in Dulbecco’s modified Eagle’s medium (DMEM) supplemented with 10% fetal bovine serum (FBS), penicillin (100 IU/mL), and streptomycin (100 µg/mL). The cells were maintained at 37°C in a 5% CO2 incubator. The adherent cells were detached by trypsinization using 0.25% trypsin-ethylenediaminetetraacetic acid (EDTA) solution after 90% confluence was obtained.
Cytocompatibility tests
The biocompatibility of different scaffolds with mouse 3T3 fibroblast cell line was tested by 3-(4,5-dimethylthiazol-2-yl)-2,5-diphenyl tetrazolium bromide (MTT) assay. The 3T3 fibroblast cells were cultured in 24 well plates with scaffolds of COL, COL–CS, EGF–CNP–COL–CS, FGF–CNP–COL–CS, dual growth factor–CNP–COL–CS at an initial seeding density of 5 × 10⁴ cells/well. After 24 h, the growth medium was removed and replaced with fresh medium; thereafter, the supernatant was removed on days 4, 8, 11, and 15. The cells were assayed by MTT using 900 µL of DMEM and 100 µL of MTT solution, followed by incubation for 4 h at 37°C in 5% CO2 atmosphere. The insoluble purple formazan granules obtained were dissolved in 1 mL of acidified isopropanol, and optical density was read using a spectrophotometer at 570 nm. The number of cells on the scaffolds was determined using a standardized MTT absorbance curve.
Cell viability
The cell viability was studied using fluorescent dyes that intercalate DNA: acridine orange (AO), stains DNA bright green; and ethidium bromide (EtBr), stains DNA orange. The scaffolds with 3T3 fibroblast cells were stained with 1.5 mL 1:1 v/v solution with 100 µg/mL of AO and EtBr in PBS and then examined with a fluorescence microscope after 11 days.
Cell morphology
After incubation for 11 days with fibroblasts, the scaffolds were washed with PBS and fixed in glutaraldehyde (2.5% v/v) in 0.1 M PBS for 30 min at 4°C. After fixation, the scaffolds were dehydrated in increasing concentration of ethanol (50%, 70%, 90%, and 100%) and vacuum dried. After the scaffolds were gold coated, the morphology of the adhered cells was examined by scanning electron microscope (SEM).
Histological evaluation
The 11-day scaffolds with seeded cells were fixed with 5% formaldehyde in PBS for 2 h at room temperature. After fixation, the specimens were dehydrated with an ethanol series and were embedded in paraffin. The 5- to 8-µm-thick specimen sections were stained with hematoxylin and eosin (H&E).
Flow cytometry studies
Cells cultured for 48 h on the scaffold were washed twice using PBS and incubated at 37°C with 0.5 mL of 0.25% trypsin-EDTA solution. After 5 min, the action of trypsin was stopped with the addition of culture medium. The cells were centrifuged at 300 × g for 10 min and then washed twice with PBS. After the cells were resuspended in the binding buffer, 500 µL of the cell suspension was taken and mixed with 5 µL of Annexin V FITC conjugate and 10 µL of propidium iodide (PI) solution and incubated for 10 min at room temperature. The fluorescence of the cells was determined in a BD FACSCalibur flow cytometer (FACSCalibur, Becton Dickinson, USA).
Statistical analysis
The experimental results were expressed as mean ± standard deviation (SD). Analysis of variance (ANOVA) was performed by one-way ANOVA procedures (SSPS 11.5 for Windows). Significant differences between means were determined by Duncan post hoc test. A p value of <0.05 implies a statistical significance.
Results and discussion
An ideal scaffold for tissue engineering must have excellent biocompatibility, controllable biodegradability, cytocompatibility, suitable microstructure (pore size and porosity), and suitable mechanical properties. It must also be capable of promoting cell adhesion and allowing the retention of metabolic functions of attached cells.21,22 The transmission electron microscope image of CNP (Figure 1(a)) exhibits a spherical shape ranging from 50 to 100 nm. The SEM of the COL–CS scaffold pores were 75–150 µm in diameter, with a homogenous structure of regular pores and good interconnections (Figure 1(b)). The distribution of CNP, incorporated with growth factors, and their impregnation into the scaffold is shown in Figure 1(c). After treatment with antibodies, the distribution of EGF and FGF in the scaffolds was established along with the entrapment of the growth factors in the nanoparticles. In the present study, 3D porous scaffolds with large surface-to-volume ratios were obtained, which provide space for cell intrusion and proliferation for new tissue formation. The use of the freeze-dryer gave uniformly distributed pore structures even with the addition of growth factor–incorporated CNP. Freyman et al. 23 also reported that scaffold pore sizes in the range of 100–200 µm were ideal for enhanced cellular activities.
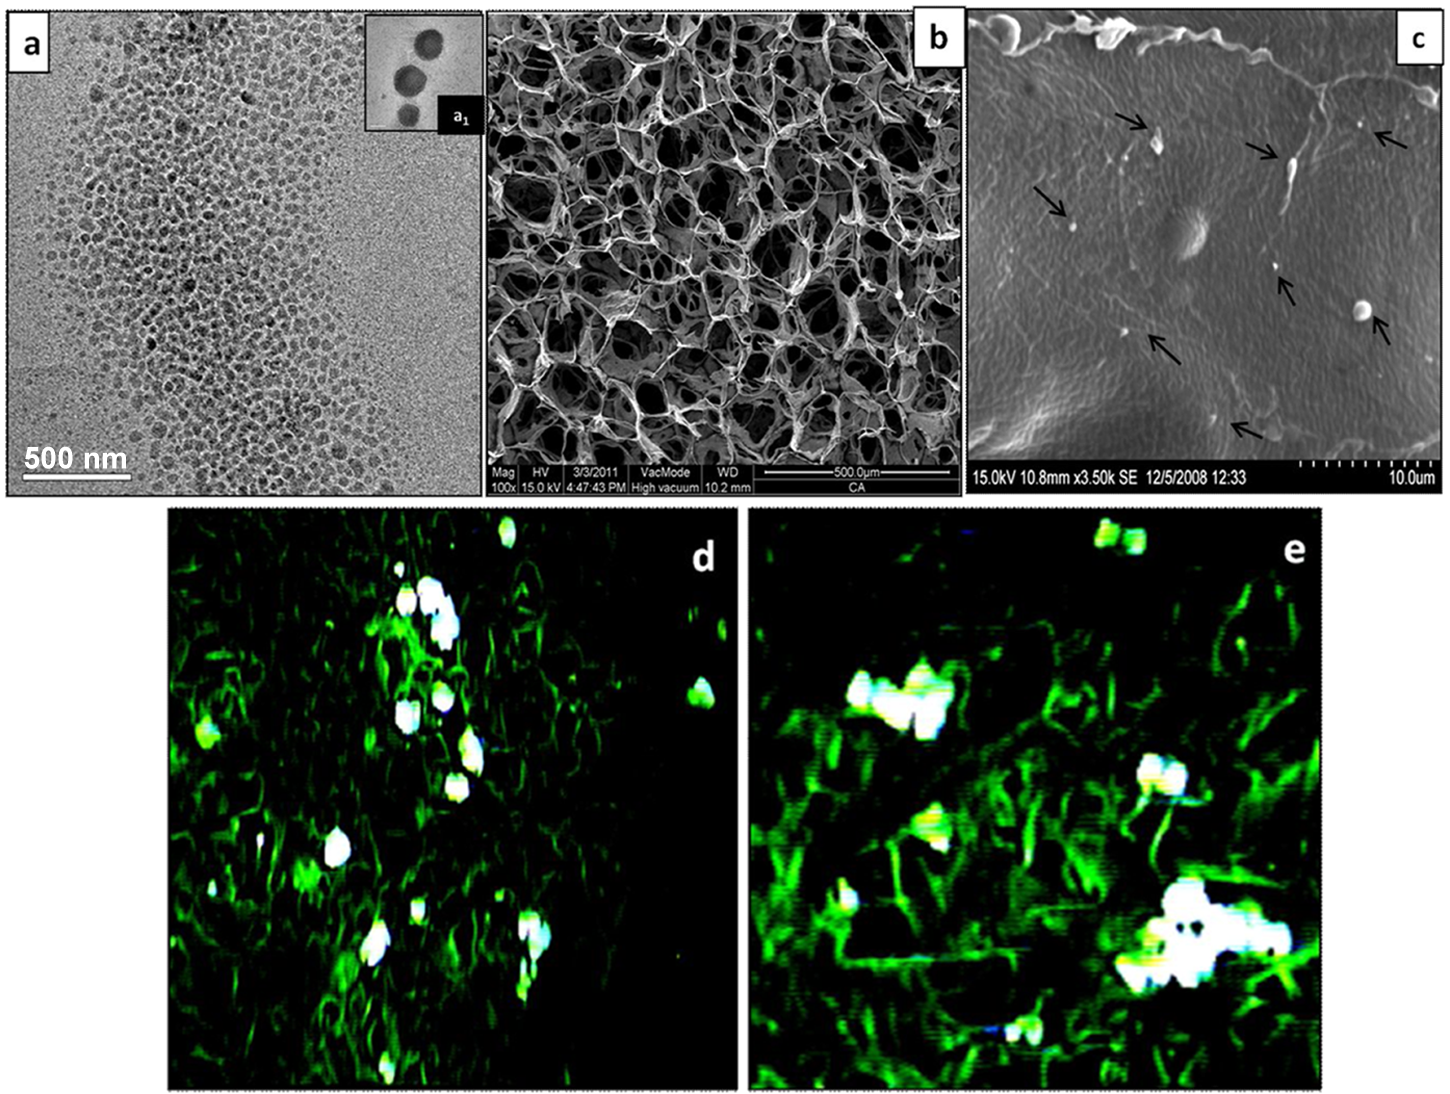
TEM image of CNP: (a) the insets show magnified view of CNP (a1), SEM images of COL–CS scaffold: (b) cross section, (c) higher magnification: arrows indicate the CNP impregnated scaffold, and fluorescent image of growth factors incorporated CNP on COL–CS scaffold: (d) EGF and (e) FGF.
In vitro release of growth factors
The growth factors have short half-life period, 24 and hence, therapeutic applications using growth factors require repeated injection with higher doses. Therefore, nanoparticles incorporating growth factor were implanted in the scaffolds to provide controlled release over an extended period of time in close proximity to the seeded cells. The growth factor–loading efficiency of nanoparticles and their entrapment efficiency were calculated using the following equations 25


Based on the release kinetic data for EGF in Figure 2(a) and FGF in Figure 2(b), the growth factors were released in a sustainable manner for 35 days with no burst release. The cumulative release of EGF and FGF was 30% and 26%, respectively, after 1 week of incubation and 70% and 68%, respectively, at the end of the fifth week. Generally, a drug is released by several mechanisms: (a) Fickian diffusion through the polymer matrix, (b) diffusion through pores in the matrix, and (c) drug liberation by polymer erosion. In this study, the sustained release of bioactive peptides was achieved by diffusion through the pores of CNP onto the scaffold matrix and then into the medium through the scaffold. Approximately, 50% of the entrapped EGF and FGF were released by the 20th day, followed by a constant slow release, which confirmed the sustained and prolonged delivery by diffusion through pores in the nanoparticles. The ionic complexes formed between CS and growth factor may be an advantage for the accumulation and sustained release.
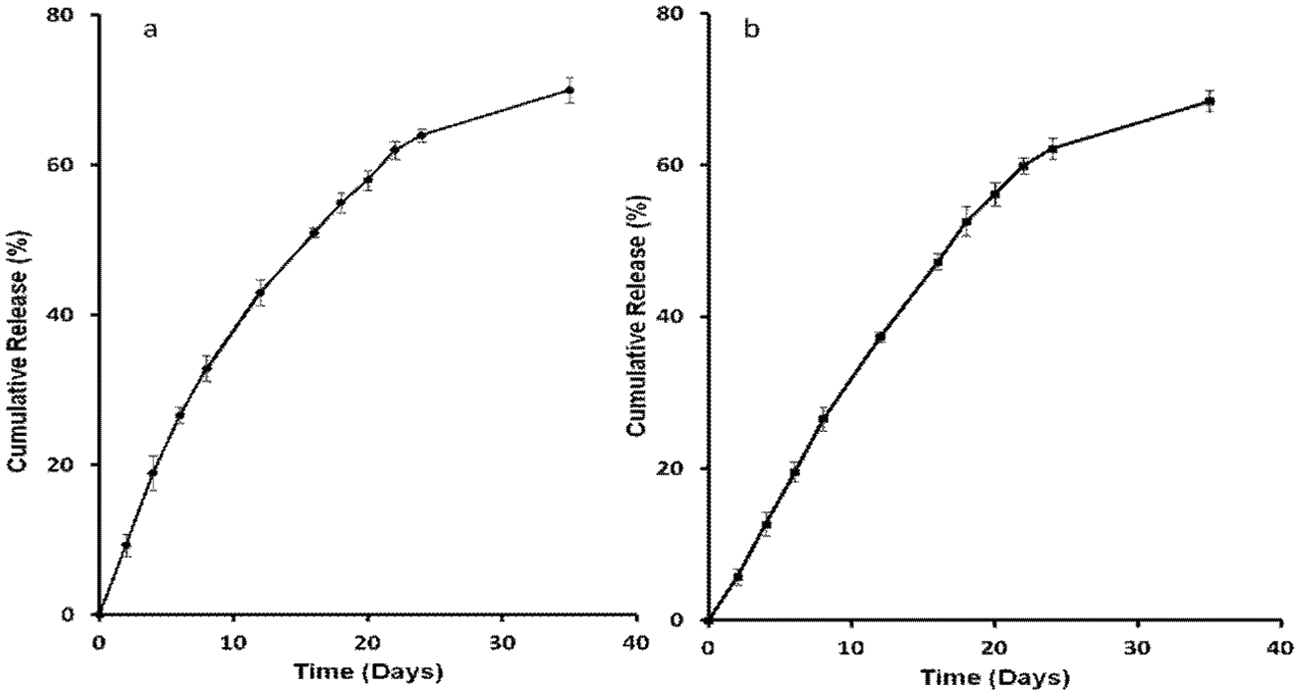
Release profile of (a) EGF and (b) FGF from CNP impregnated COL–CS scaffold in 0.1 M PBS buffer (pH 7.4). Each data point represents a mean ± standard deviation (n = 3).
Infra-red spectroscopy of the scaffolds
The FTIR spectrum of COL scaffold in Figure 3 displayed distinct absorption bands characteristics of protein/COL. The amide I band at 1659 cm−1 designated C=O stretching vibrations coupled to N–H bending vibration. The band at 1550 cm−1 indicated the N–H bending vibration coupled to C–N stretching vibration, and the band at 1238 cm−1 represented the amide III band. In the spectrum of CS, scaffold characteristic absorption bands were seen for five groups: the vibration of –OH and free –NH2 groups appeared between 3300 and 3440 cm−1; the absorption band at 1648 and 1376 cm−1 indicated C=O stretching and C–O stretching of primary alcohol groups, respectively; and a band at 1152 cm−1 represents C–O–C glycosidic linkage between the (glucosamine) monomer units of CS. The spectrum of the COL–CS blend (Figure 3(c)) had characteristic peaks similar to the parent molecules. However, some minor shifts of several wave numbers in the spectrum were observed, such as, the 1647 cm−1 band for amide I shifted to 1657 cm−1 in the case of the blend. Similarly, the amide III peak of the parent molecule at 1238 cm−1 disappeared in the blend and a new peak appeared at 1320 cm−1. Similarly, the spectrum of the blend containing EGF/FGF-incorporated CNP had some shifts/modification in the absorption band for C–O stretching of primary alcohol at 1073 and 1381 cm−1.
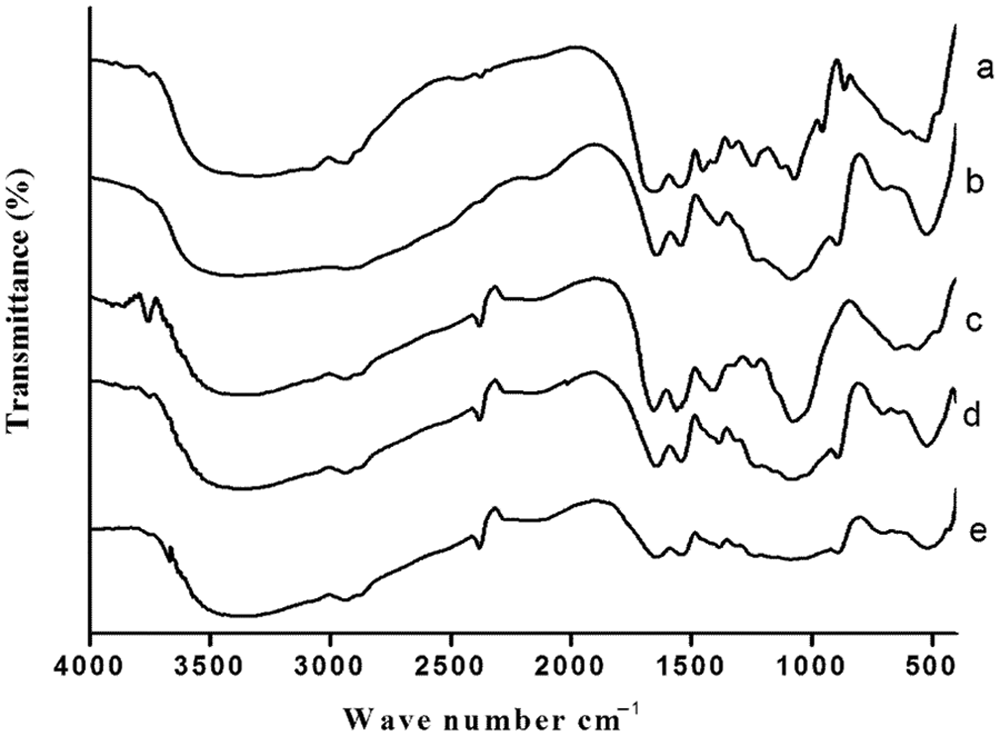
FTIR spectrum of (a) collagen, (b) chitosan, (c) COL–CS, (d) EGF–CNP–COL–CS, and (e) FGF–CNP–COL–CS scaffolds.
These data indicated significant ionic interaction between the COL and CS molecules, particularly in an acidic pH. These interactions were identified in the hybrid molecule by a shift of amide I band to 1657 cm−1 from 1647 cm−1. These interactions may have formed a polyanionic–polycationic complex as reported by Sionkowska et al. 26 in addition to covalent linkages. The latter is likely to change the physical and thermal properties, which was confirmed by a shift in the endothermic temperature at which the bound water was lost. The COL/CS favored the bound water retention in CS by contributing to ionic interaction, but at the same time, the COL seemed to weaken its architecture with respect to the bound water holding capacity. Therefore, COL–CS blend is considered thermally more stable and an excellent biomaterial with higher blood compatibility 27 than pure CS scaffolds.
Cell viability and proliferation
Fluorescent images of 3T3 fibroblasts, cultured on scaffolds with or without CNP containing growth factors, are shown in Figure 4(a). During the initial phase of culture, the cells adhered to the walls of the micropores (75–150 µm) of the scaffold (data not shown). Subsequently, the cell attachment and proliferation increased and formed multilayer cell cluster at the end of culture period (15 days). This observation was more pronounced in the scaffold containing EGF + FGF–CNP compared to other scaffolds. The viability of the cells was measured by the MTT assay to study the cytocompatibility of different scaffolds, with or without growth factor(s) incorporated CNP. In this study, the formazan produced by the proliferated cells grown on the COL–CS scaffolds after 4, 7, 11, and 15 days was monitored and presented as changes in the number of cells during this period (Figure 4(b)). The rate of proliferation varied with the composition of the scaffold system, where a 3-fold increase in cell population was observed with the dual growth factor containing scaffold followed by 2.63-, 2.19-, 1.63-, and 1.19-fold by the fluorescence and MTT assay that no cell death was found in any of the cultures, revealing the cytocompatibility of the scaffolds. However, the higher order of cell proliferation, where the cells attached to and penetrated the pores to form a 3D growth, was due to the synergic effect of dual growth factors. This may be attributed to the activation of both the EGF and FGF receptors for a longer time that resulted in high mitogenic effect as reported by Tigli and Gumusderelioglu. 28
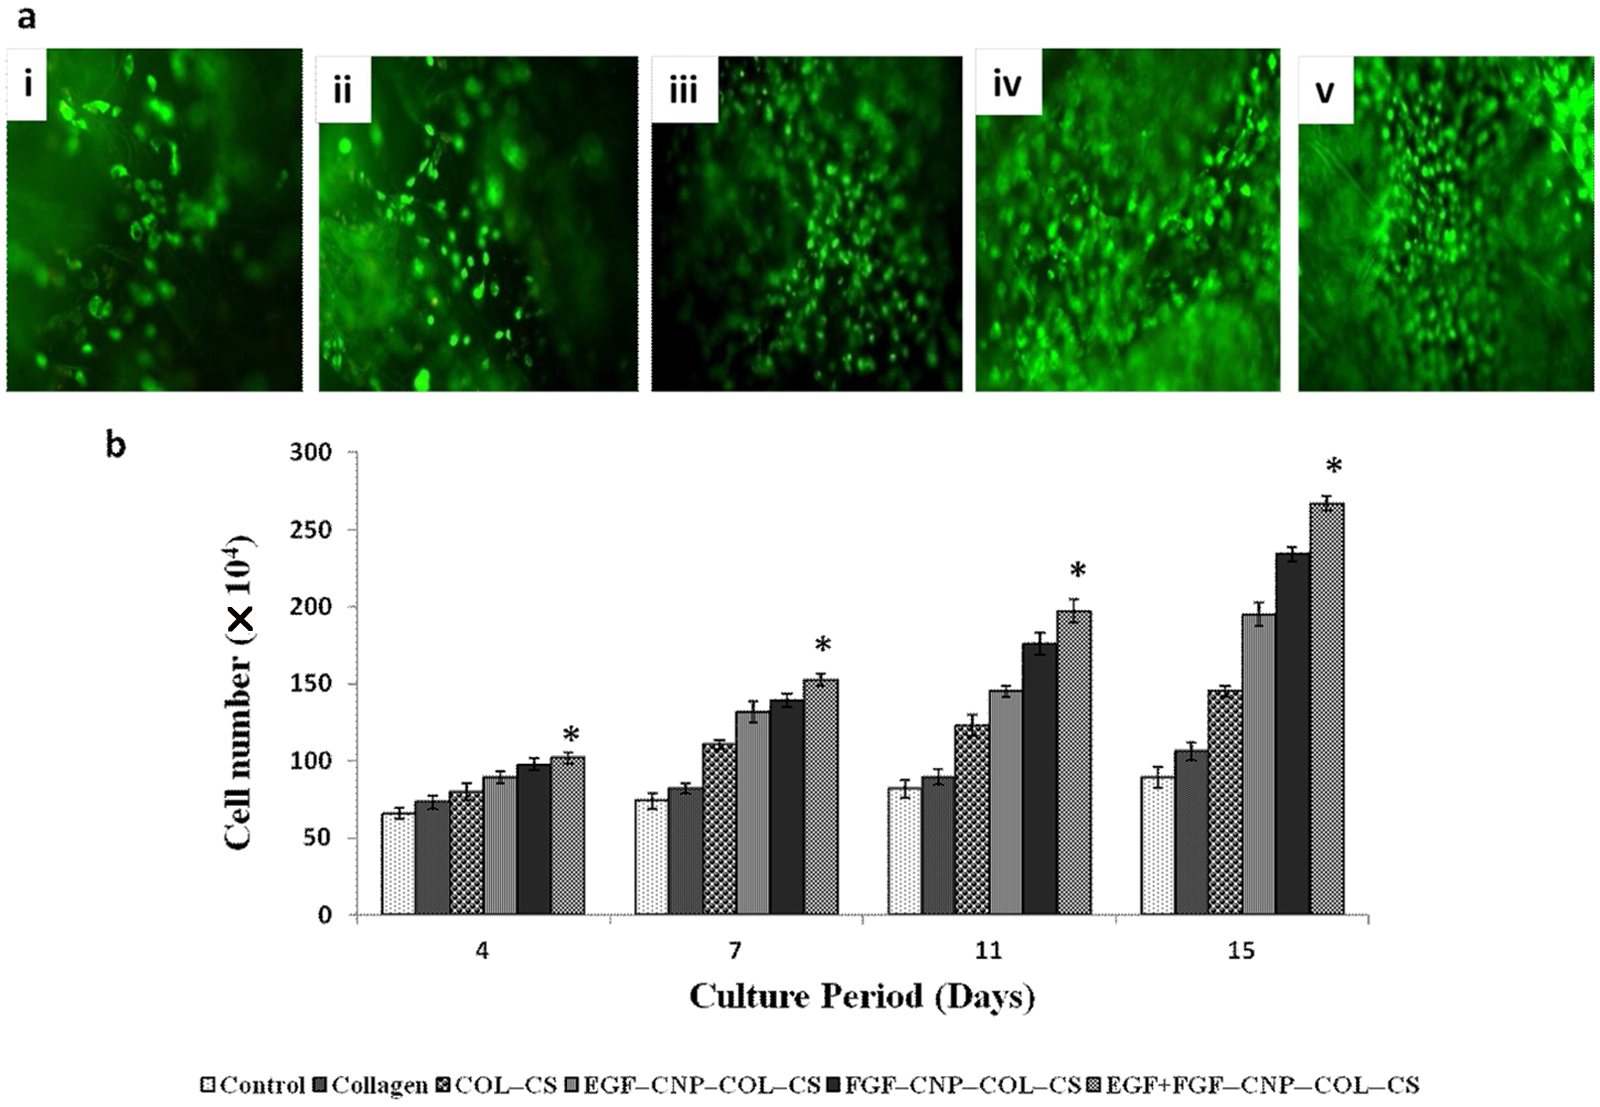
Fluorescent microscope image (a) of fibroblast cultured over the different types of scaffolds: (i) collagen, (ii) COL–CS, (iii) EGF–CNP–COL–CS, (iv) FGF–CNP–COL–CS, and (v) EGF + FGF–CNP–COL–CS (original magnification: 100×). (b) Proliferation of fibroblast cells on various scaffolds at different time intervals (control, collagen, COL–CS, EGF–CNP–COL–CS, FGF–CNP–COL–CS, and EGF + FGF–CNP–COL–CS). Each data point represents a mean ± SD (n = 3). *p < 0.01 compared with control.
Morphology of fibroblasts on the scaffolds
SEM was used to interpret cellular morphology and cell attachment on the scaffold surface, while H&E staining was used to study cell morphology, cellular proliferation, and cell distribution inside the 3D space of the scaffolds. 29 The SEM images of the scaffolds on day 11 of culture are shown in Figure 5; the cells distributed evenly along the fibers of the scaffolds, while interlaced fibrous networks formed around the cells. The ellipsoidal shaped cells were firmly attached and proliferated throughout the porous 3D scaffold surface and secreted ECM that joined the cells together. The porous scaffold containing EGF + FGF–CNP (Figure 5(e)) exhibited increased cell proliferation and cell adhesion. This was also seen in the histological images of the distribution of fibroblasts shown in Figure 6. The fibroblasts invaded the scaffold and subsequently elongated and spread by orienting their long axis parallel to neighboring fibroblasts. The cells contacted each other by their secreted ECM. More cells with increased intrusion were observed in the EGF + FGF–CNP–COL–CS scaffold (Figure 6(e)) compared to a scaffold with or without growth factor. The SEM and histology data indicated that the dual growth factor mediated fibroblast proliferation and ECM synthesis improved the mechanical property of the scaffolds. This implied that fibroblasts after culture were linked tightly with scaffolds by newly formed ECM to afford a bioactive composite of fibroblasts between the ECM and the scaffolds.
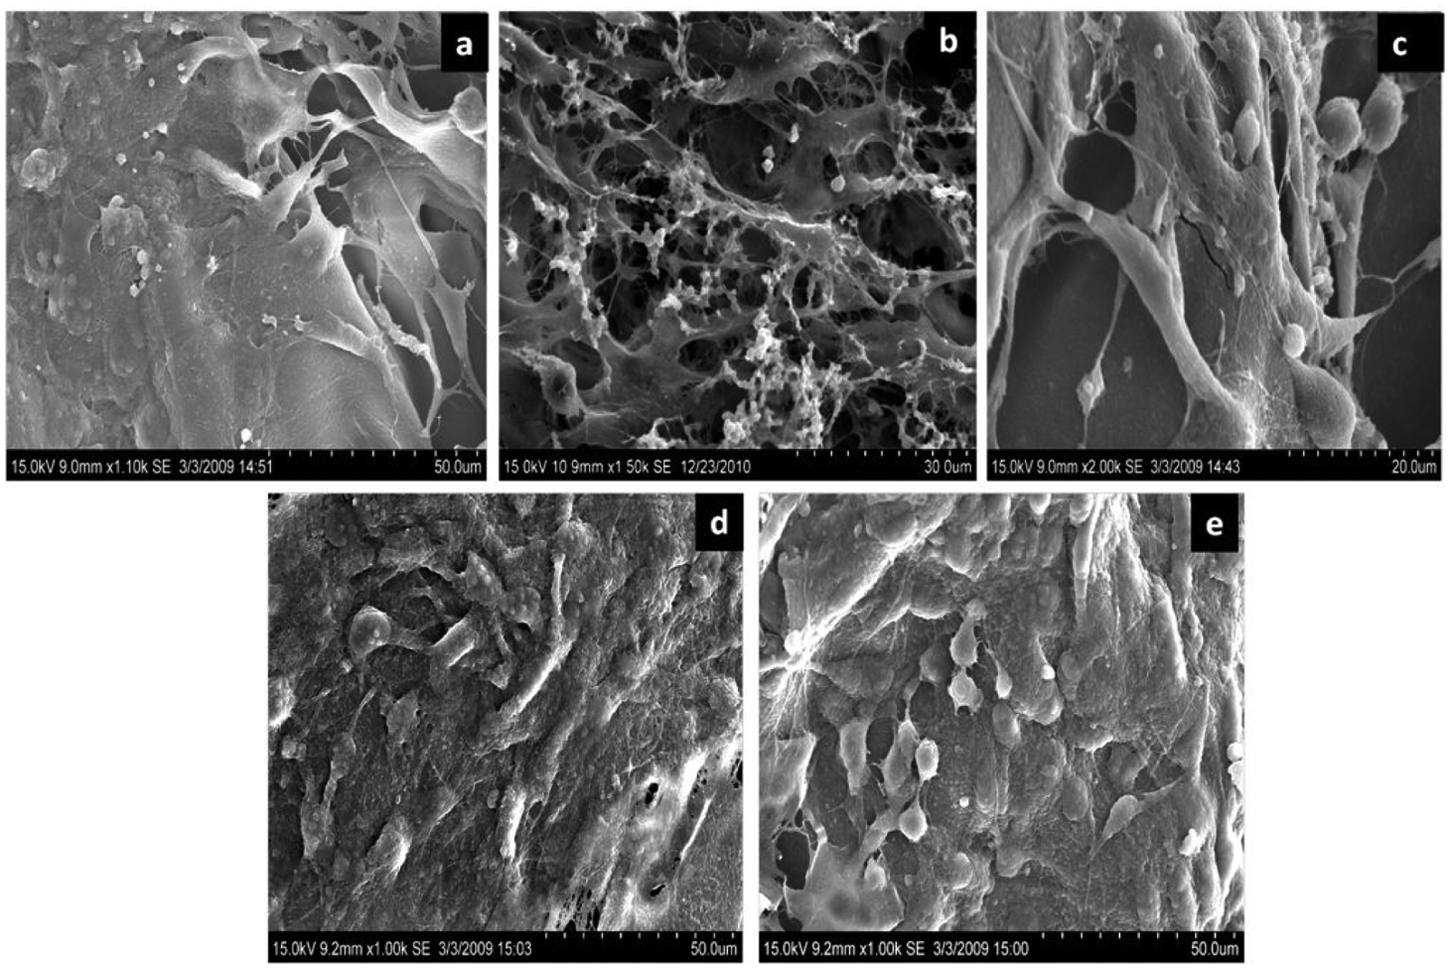
Scanning electron microscopic images of the scaffolds with fibroblast cells construct on day 11: (a) collagen, (b) COL–CS, (c) EGF–CNP–COL–CS, (d) FGF–CNP–COL–CS, and (e) EGF + FGF–CNP–COL–CS.
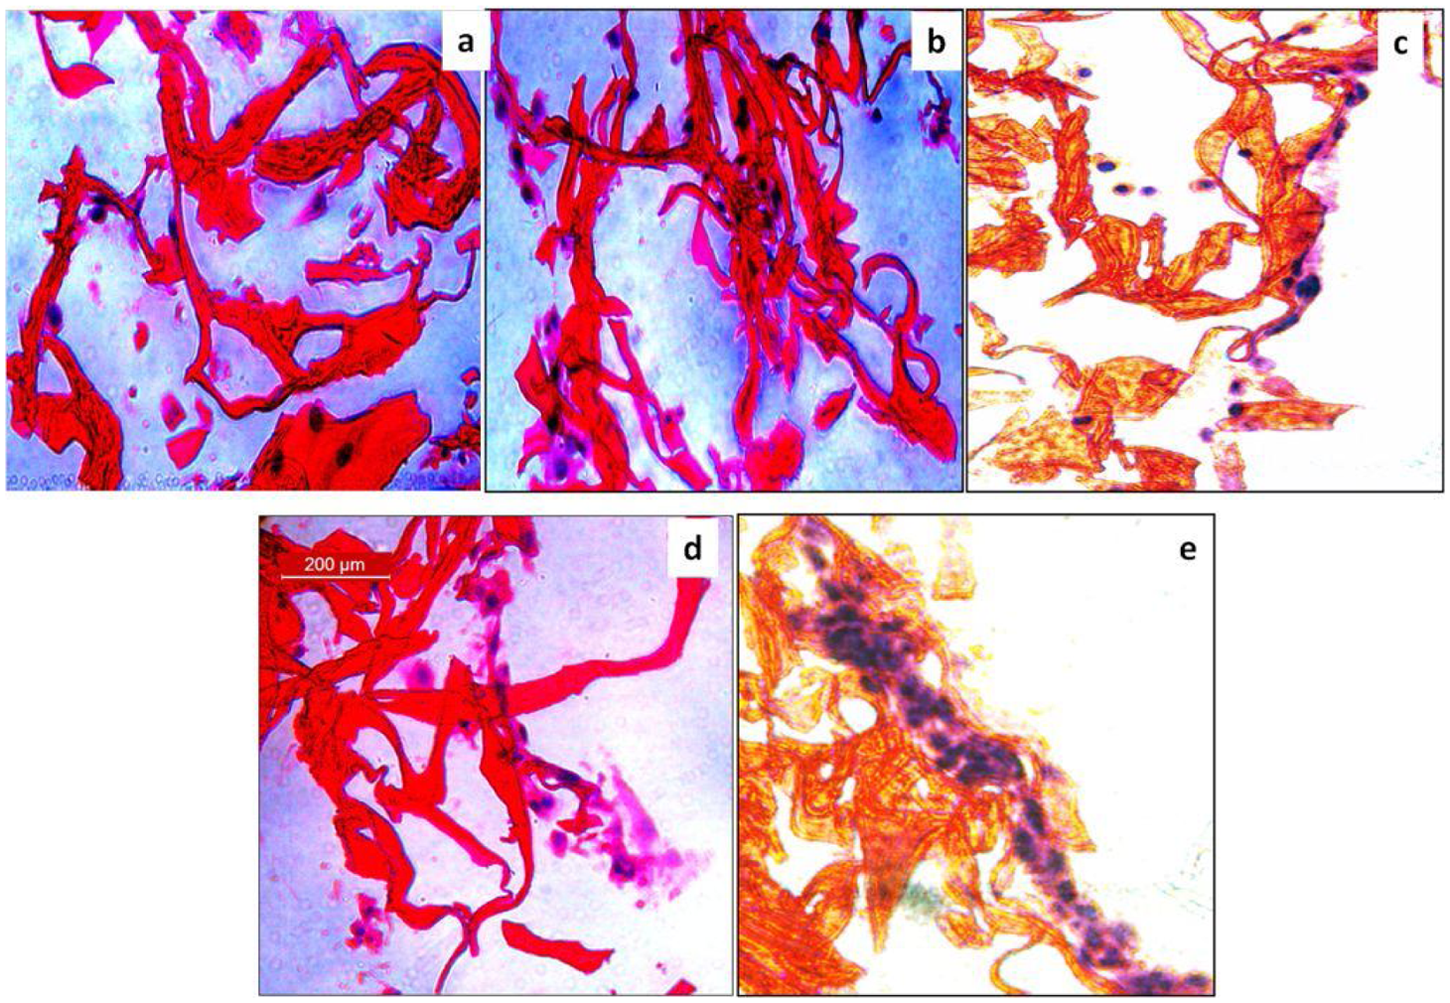
H&E images of fibroblasts in different scaffolds for a period of 11 days: (a) collagen, (b) COL–CS, (c) EGF–CNP–COL–CS, (d) FGF–CNP–COL–CS, and (e) EGF + FGF–CNP–COL–CS (original magnification: 100×).
Flow cytometry
The survival of the fibroblasts cultured on different scaffold systems, after double staining the cells using annexin V and PI, is shown in Figure 7. The fluorescent probe annexin was used to quantify the apoptosis, while PI was used to identify necrotic cells, based upon the loss of membrane integrity. The apoptotic cells were annexin V positive, while the necrotic cells were positive for both annexin V and PI. In a dot plot of green fluorescence (annexin V FITC) versus red (PI) fluorescence, four separate clusters were observed: surviving cells (lower left quadrant), apoptotic cells (lower right quadrant), and secondary necrotic plus necrotic cells (upper left and right quadrants). 30 The fibroblasts cultured on dual growth factor containing scaffold displayed very little apoptosis compared to other scaffolds. After incubating for 48 h, the rate of survival was in the following order: EGF + FGF–CNP–COL–CS > FGF–CNP–COL–CS > EGF–CNP–COL–CS > COL–CS > control (Figure 7). The adhesion of cells in the open pores of scaffold with maximum viability was attributed to the compatibility of the more hydrophilic COL–CS blend. The absence of necrotic cells in the scaffold culture system indicated that scaffolds were least toxic due to poor antigenicity. In addition, the growth factors with mitogenic activity promoted cell proliferation, viability, and strengthened the defense mechanism that protected the cells from apoptosis. This positive role of growth factor was more pronounced in the dual growth factor system compared to a single growth factor or growth factor–free scaffold system.
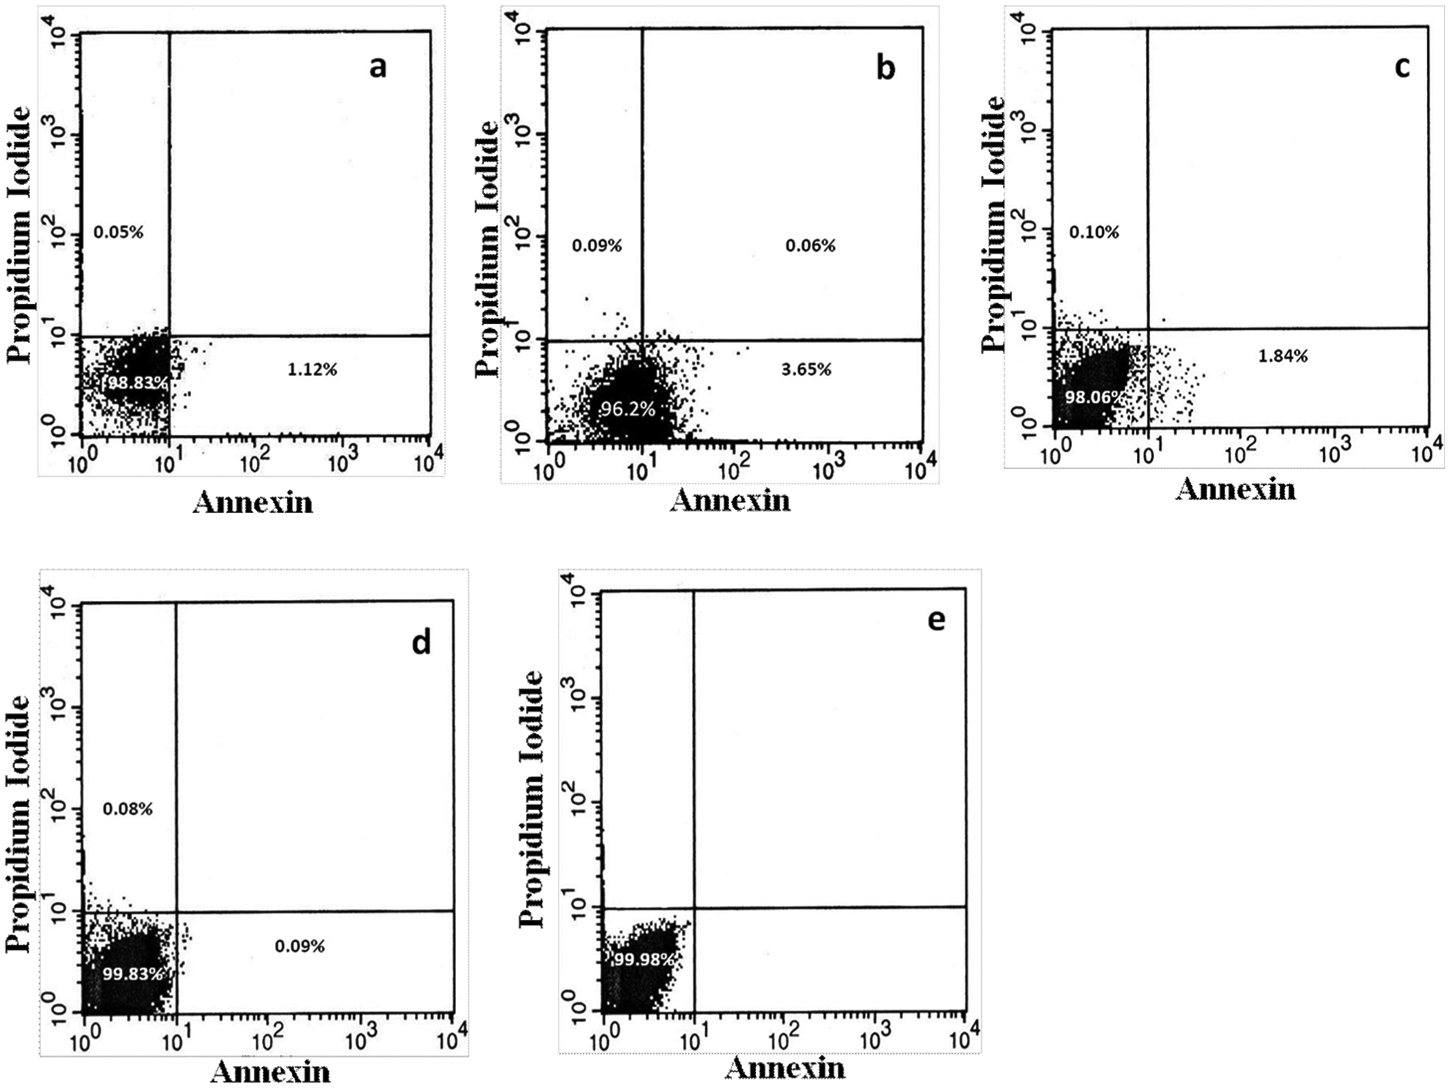
Viability of cells by flow cytometry assay of 3T3 fibroblast cells on various scaffolds (viable, apoptotic, and “apoptotic necrotic” or necrotic cells): (a) control, (b) COL–CS, (c) EGF–CNP–COL–CS, (d) FGF–CNP–COL–CS, and (e) EGF + FGF–CNP–COL–CS scaffolds.
Conclusions
EGF- and FGF-loaded CNP and impregnated COL–CS scaffolds were developed. The growth factors were released in a controlled manner, which induced cell proliferation and ECM synthesis by the fibroblast cells implanted in the scaffold. As a biodegradable delivery system for multiple growth factors, these COL–CS scaffolds could be used as an inductive tissue engineering system for various tissue regeneration applications.
Footnotes
Acknowledgements
The authors are thankful to the Director and the Research Council of Central Leather Research Institute for their kind permission to carry out this study and publish this article.
This research received no specific grant from any funding agency in the public, commercial, or not-for-profit sectors.