
Abstract
Objective:
The impact of chronic exposure to air pollution on mortality in patients with sepsis is unknown. We attempted to quantify the relationship between air pollution, notably excess ozone, and particulate matter (PM), with in-hospital mortality in patients with sepsis nationwide.
Methods:
The 2011 Nationwide Inpatient Sample (NIS) was linked with ambient air pollution data from the Environmental Protection Agency for both 8-hour ozone exposure and annual mean 2.5-micron PM (PM2.5) pollution levels. A validated severity of illness model for sepsis using administrative data was used to control for sepsis severity.
Results:
The records of 8 023 590 hospital admissions from the 2011 NIS sample were analyzed. Of these, there were 444 928 patients who met the Angus definition of sepsis, treated in hospitals for which air pollution data were available. The cohort had an overall mortality of 11.2%. After adjustment for severity of sepsis, increasing exposure to ozone pollution was associated with increased risk of mortality (odds ratio [OR]: 1.04 for each 0.01 ppm increase, 95% confidence interval [CI]: 1.03-1.05; P < .01). Particulate matter was not associated with mortality (OR: 0.99 for each 5 µg/m3 increase, 95% CI: 0.97-1.01; P = .28). When stratified by sepsis source, ozone pollution had a higher impact on patients with pneumonia (OR: 1.06, 95% CI: 1.04-1.08; P < .01) compared to those patients without pneumonia (OR: 1.02, 95% CI: 1.01-1.03; P < .01).
Conclusion:
Exposure to increased levels of ozone but not particulate air pollution was associated with higher risk of mortality in patients with sepsis. This association was strongest in patients with pneumonia but persisted in all sources of sepsis. Further work is needed to understand the relationship between ambient ozone air pollution and sepsis outcomes.
Introduction
Sepsis is the sixth most common reason for hospitalization in the United States and is the leading cause of death for critically ill patients. 1 –3 Although the exact incidence and case mortality for sepsis are hard to determine due to varying definitions, sepsis is estimated to be responsible for over 5 million deaths worldwide every year. 4 Although advances in the early recognition and management of sepsis have decreased case rate mortality, the burden of mortality attributable to sepsis remains high.
Exposure to increased air pollution has been linked to poor health outcomes, especially in pulmonary diseases. 5 –8 Air pollution causes increased levels of inflammation and oxidative stress in humans. 9 Ozone, one of the most powerful known oxidants, causes damage to humans via multiple mechanisms including free radical formation, lipid peroxidation, loss of enzymatic activity, alterations in membrane permeability, and direct organ inflammation and damage. 10
We investigated the relationship between high levels of both ozone and particulate air pollution on outcomes in patients admitted to hospital with sepsis. The primary outcome for this study was in-hospital mortality for patients with sepsis. Based on prior animal research, 11 –13 we hypothesized that higher exposure to air pollution would be associated with worse outcomes in patients with sepsis from a pulmonary source.
Methods
The results of this retrospective cohort analysis are presented in accordance with the STrengthening the Reporting of OBservational studies in Epidemiology statement. 14 As this study utilized deidentified data, a waiver of consent was obtained from the institutional review board of University of British Columbia.
Data Set
The Nationwide Inpatient Sample (NIS) for the year 2011 was utilized for this analysis. The NIS, a national database, captures approximately 20% of all inpatient hospitalizations across 47 states. Through the use of complex survey techniques and weighting, the NIS is capable of estimating over 95% of all hospital care delivered across the United States. 15 The NIS is produced by the Agency for Health Care Research and Quality, a branch of the US federal government.
The 2011 NIS sample was the last year where detailed hospital location information was released in the NIS; after 2011 only the state of the treating hospitals was revealed. Unfortunately, even for the 2011 sample, some states refused to release detailed hospital location information and were therefore excluded from the analysis. Data from 28 states were used for the final analysis.
Air Pollution Data Linkage
The zip code of each treating hospital for all observations in the NIS was linked to the ambient air pollution data released by the Environmental Protection Agency for that county. In order to prevent patient identification, the zip code of residence for each patient is not released. We made the assumption that patients likely lived in the areas surrounding the hospital that they were treated in and were thus exposed to similar amounts of ambient air pollution. The county level data for both 8-hour ozone exposure and annual mean 2.5-micron particulate matter (PM2.5) pollution levels were cross referenced with the NIS. Counties with missing air pollution data were removed from the analysis.
Patient Cohort Selection
All patients >18 years of age who met the Angus definition of sepsis and were treated in a hospital located in a county that had detailed air pollution data available were included in the analysis. The Angus definition of sepsis has been widely used in administrative data research and has been shown to have a sensitivity of 50.4% and a specificity of 96.3% for identifying patients with sepsis. 16 –19 In order to be “Angus Positive,” a patient must have the International Classification of Diseases, Ninth Revision (ICD-9) code for severe sepsis (995.92) or septic shock (785.52). Patients may also be Angus Positive if they have an ICD-9 code for infection with an additional code for organ dysfunction. 16 A patient cohort selection flow diagram is displayed in Figure 1.
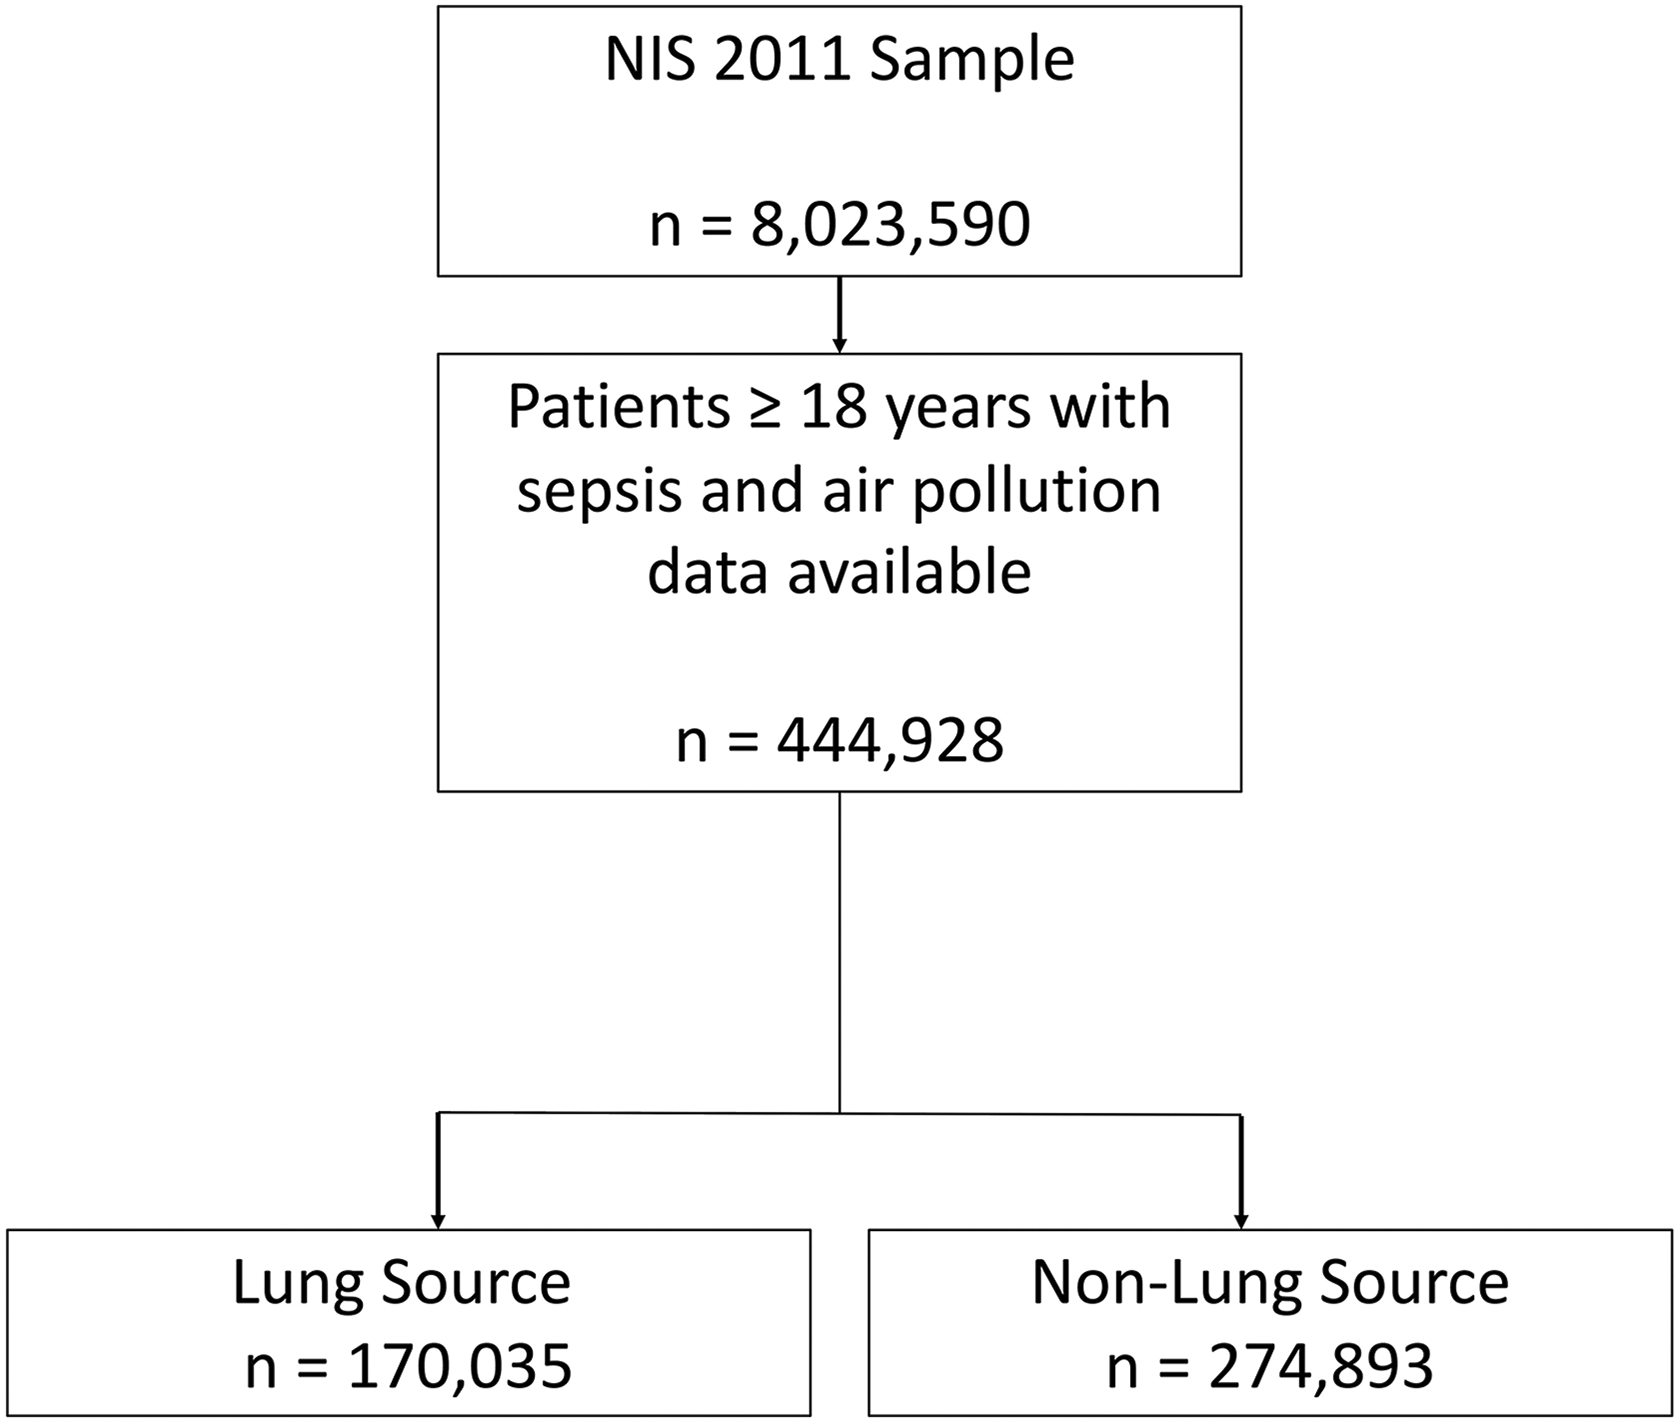
Patient selection flow diagram.
Severity of Sepsis
In an attempt to control for the severity of sepsis in our modeling, we followed the algorithm described by Ford et al. 20 This algorithm was validated as a method for adjusting for the risk of mortality in patients with sepsis while using administrative data sets. It would have been ideal to have utilized a more granular severity of illness marker such as the Sepsis-related organ failure assessment (SOFA) score; unfortunately, these detailed variables are not included in the NIS.
The following variables were obtained from the NIS for each patient: age, gender, in-hospital mortality, race (white, black, Hispanic, other), as well as the presence of the 24 Elixhauser comorbidity indices. 21 The use of early mechanical ventilation (<2 days since admission) and the presence of shock were collected from the NIS. Shock was defined as the presence of septic shock (785.52) or shock (785.50). In addition, admission to the intensive care unit (ICU) was obtained for each patient, as it was included in the model described by Ford et al. 20 As there is no ICU admission flag variable in the NIS, we defined ICU care as the presence of any of these procedures: mechanical ventilation (96.70, 96.71, 96.72, 93.90), vasopressor infusion (00.17), arterial line placement (38.91), or central line placement (38.97).
Source of Sepsis
Given the possibility that air pollution may have differential effects on mortality depending on the source of sepsis, we defined subgroups of patients by the primary source of their sepsis. For secondary analysis, patients were segregated by source of sepsis: pulmonary and nonpulmonary.
Statistical Analysis
All analysis was performed using SAS version 9.4 (SAS Institute, Cary, North Carolina) while employing complex survey techniques necessary to maintain the integrity of the NIS. Continuous variables were analyzed using the t test or Wilcoxon rank sum depending on their normality. Categorical variables were compared using the χ2 test.
Multivariate logistic regression models were built modeling the outcome of in-hospital mortality. Variables included in the final model were identical to those described by Ford et al and included age, gender, race, early mechanical ventilation, ICU admission, shock, acute respiratory distress syndrome, hemodialysis, and the 24 Elixhauser comorbidities. Multiple models were created in order to examine the impact of ozone air pollution and particulate pollution.
Results
The records of 8 023 590 hospital admissions from the 2011 NIS sample were analyzed. Of these, there were 444 928 patients who met the Angus definition of sepsis who were treated in hospitals for which air pollution data were available. The overall in-hospital mortality for the cohort was 11.2%. Patient demographic and clinical characteristics of the entire cohort are displayed in Table 1. The range for ozone exposure varied from 0.048 to 0.113 ppm with a mean value of 0.078 ppm (standard deviation [SD]: 0.012 ppm). The range for PM exposure was 3.5 µg/m3 to 22.4 µg/m3 with a mean value of 11.0 µg/m3 (SD: 2.39 µg/m3).
Baseline Demographic and Patient Characteristics for Patients With Sepsis, Broken Down by Lung Versus Nonlung Source.a
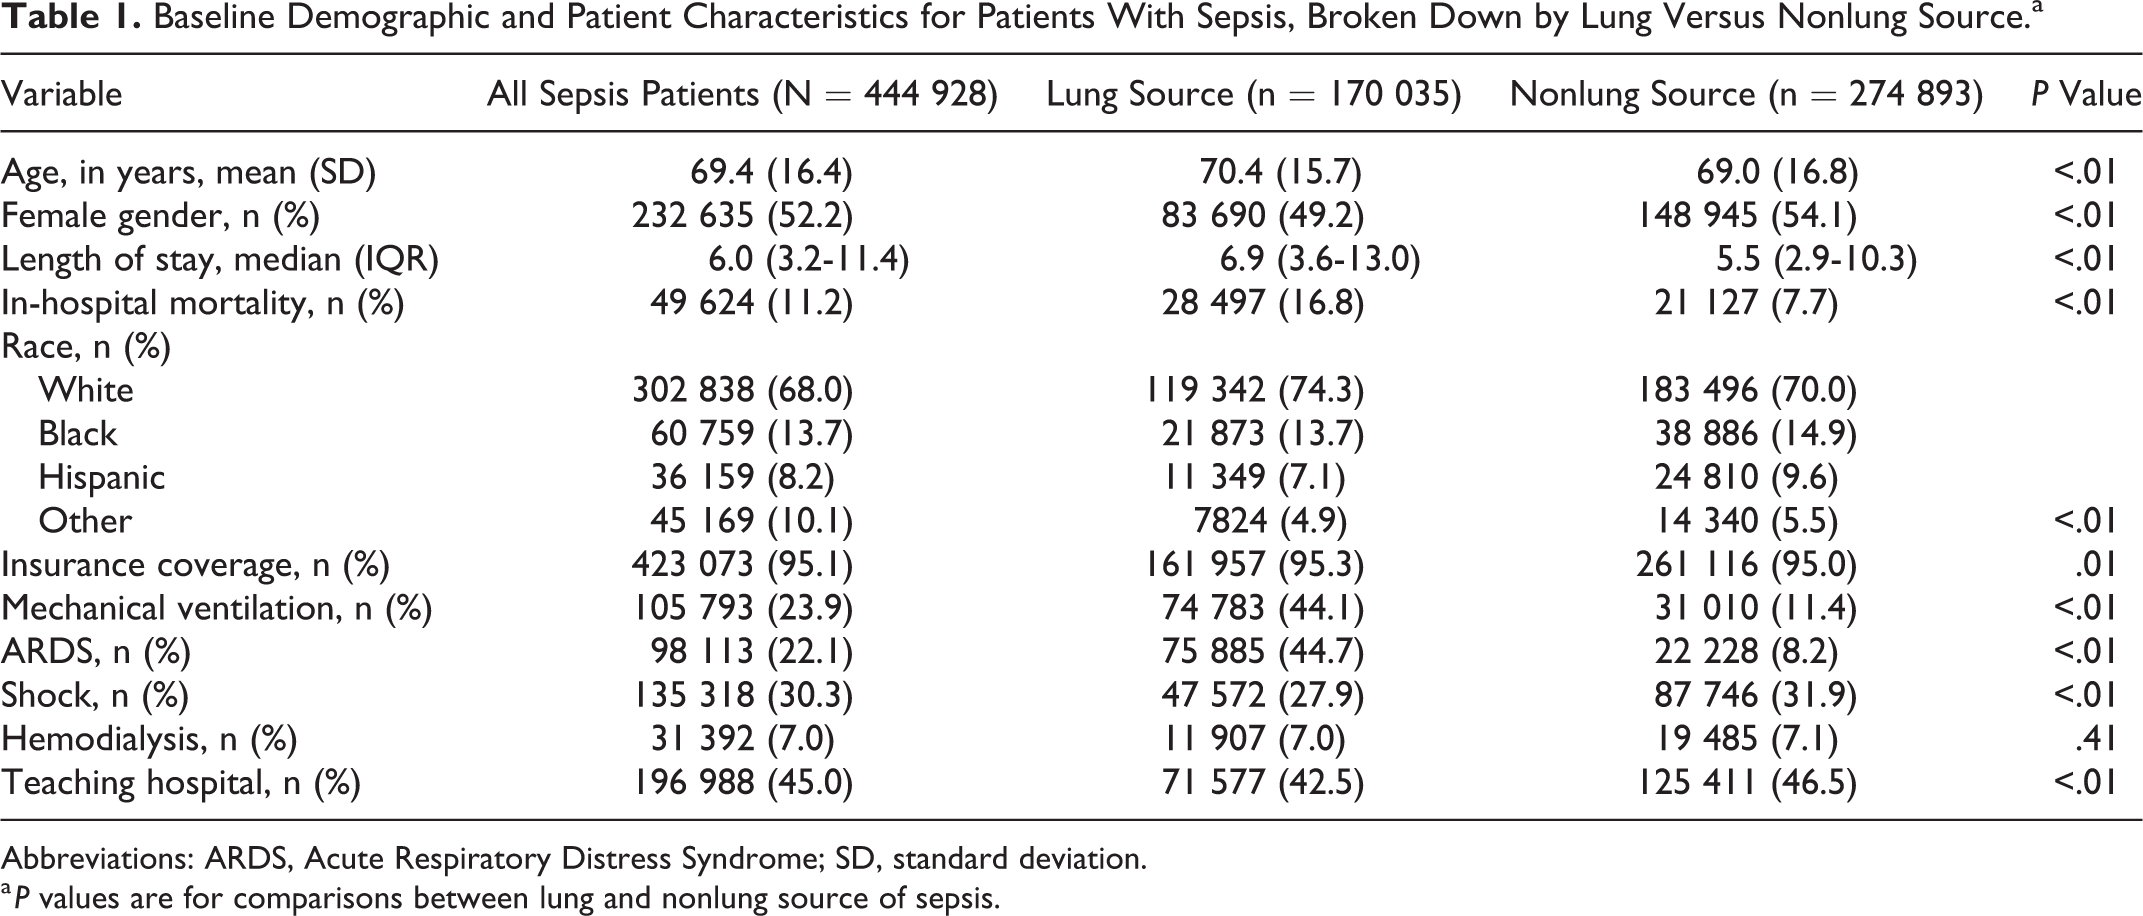
Abbreviations: ARDS, Acute Respiratory Distress Syndrome; SD, standard deviation.
a P values are for comparisons between lung and nonlung source of sepsis.
Ozone Air Pollution
When exposure to ozone air pollution as a continuous variable was added to the multivariate model predicting in-hospital mortality, there was a strong association between increasing ozone levels and risk of hospital mortality. For each 0.01 ppm increase in ozone pollution, the odds of death increased by 1.04 (95% confidence interval [CI]: 1.03-1.05; P < .01; model 1; Table 2).
Results of Multivariate Analysis Predicting In-Hospital Mortality for Patients With Sepsis of All Sources.a
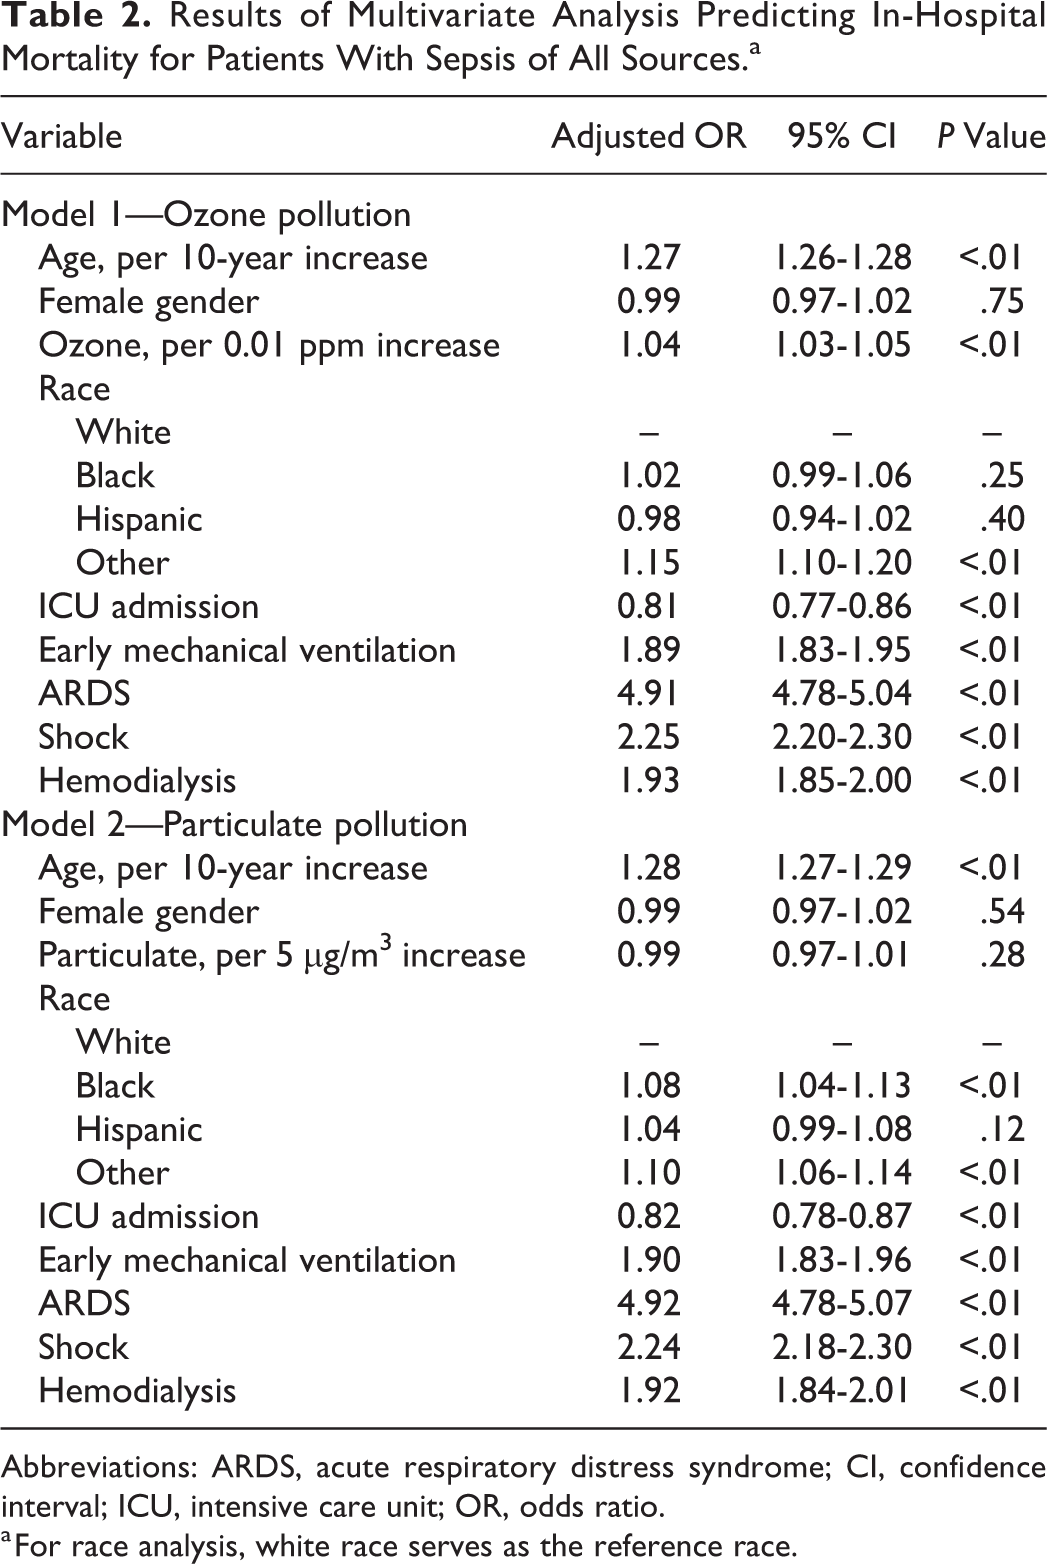
Abbreviations: ARDS, acute respiratory distress syndrome; CI, confidence interval; ICU, intensive care unit; OR, odds ratio.
a For race analysis, white race serves as the reference race.
Particulate Matter Air Pollution
The results of modeling incorporating PM pollution are displayed in Tables 2 and 3. There was no association between increased levels of PM pollution and in-hospital mortality in patients with sepsis (odds ratio [OR]: 0.99, 95% CI: 0.97-1.01; P = .28; model 2; Table 2).
Source of Sepsis
The breakdown of OR for both ozone and PM pollution for each subtype of sepsis is displayed in Table 3. In patients with pneumonia, the effect of ozone air pollution on mortality was higher than in the overall cohort (OR: 1.06, 95% CI: 1.04-1.08; P < .01; model 3). In patients with a nonpulmonary source of sepsis, ozone exposure was still associated with increased rates of mortality, though the effect was not as strong (OR: 1.03, 95% CI: 1.02-1.04; P < .01; model 3). Particulate matter was not associated with mortality for either subgroup of sepsis sources (pneumonia OR: 0.98, 95% CI: 0.93-1.03; P = .19 vs nonlung sources OR: 0.98, 95% CI: 0.94-1.02; P = .35; model 4).
Models Predicting In-Hospital Mortality for Patients With Sepsis.a
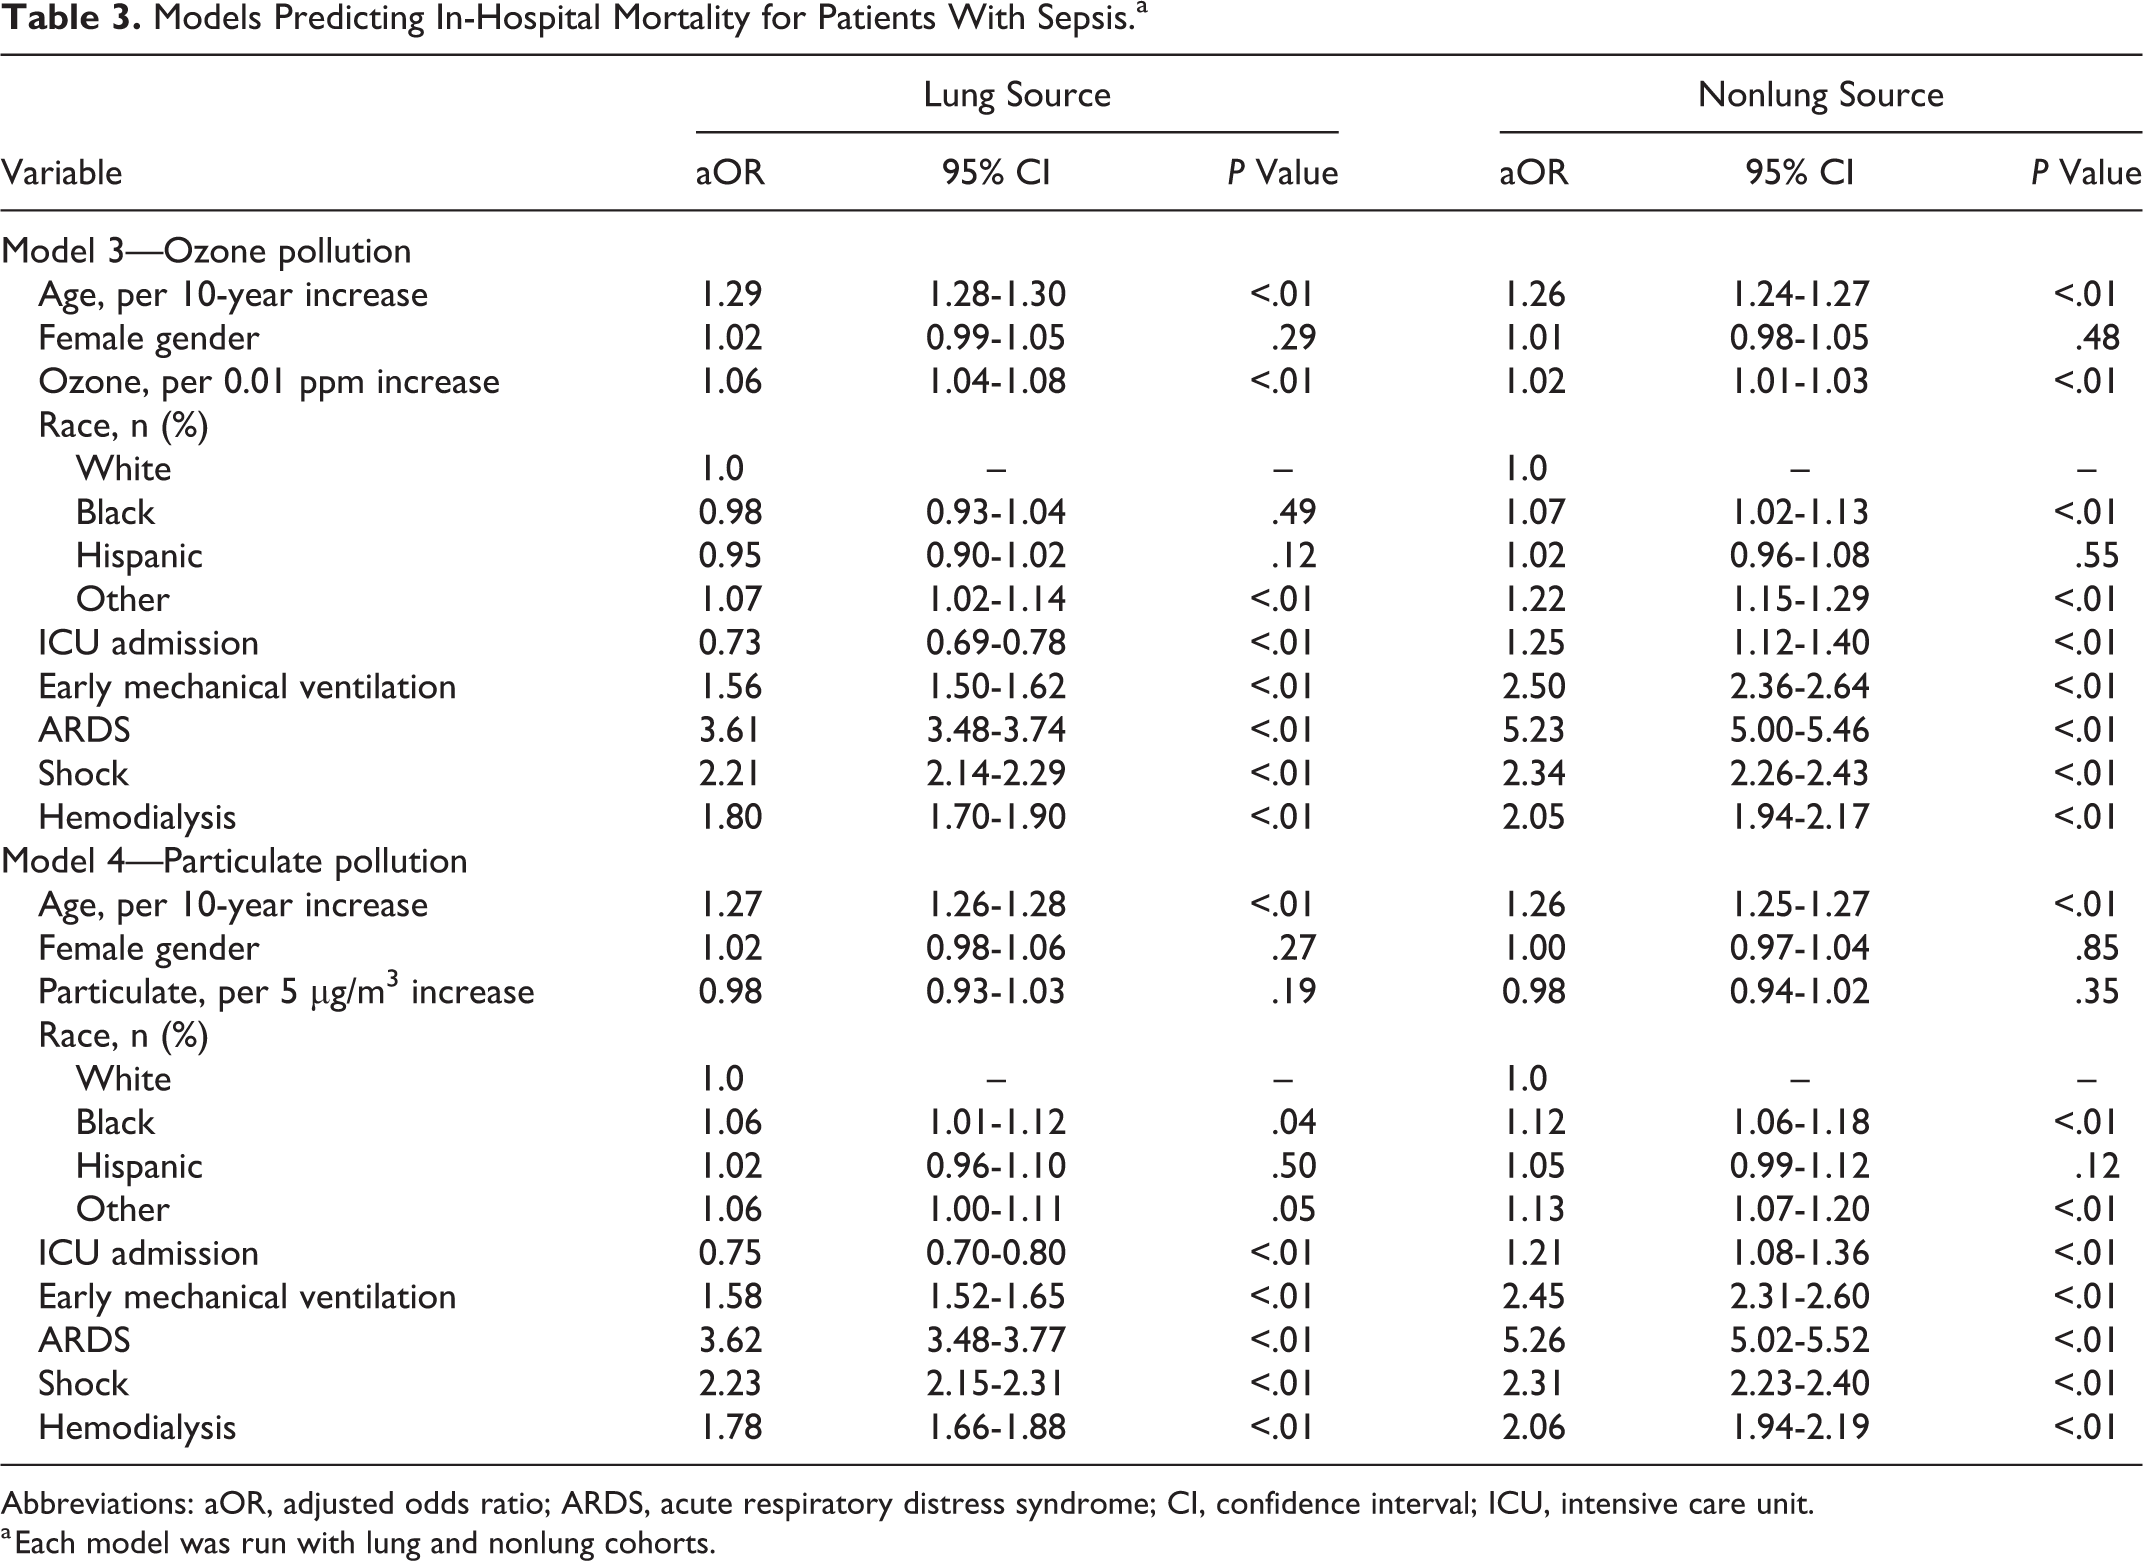
Abbreviations: aOR, adjusted odds ratio; ARDS, acute respiratory distress syndrome; CI, confidence interval; ICU, intensive care unit.
a Each model was run with lung and nonlung cohorts.
Discussion
In this nationwide analysis, we found that increasing levels of ozone air pollution were associated with higher rates of mortality in patients hospitalized with sepsis. This signal was seen in all sources of sepsis; however, it was stronger in patients with pneumonia as a source of sepsis. Particulate matter pollution was not associated with increased rates of mortality in sepsis, regardless of the source.
These results expand on the existing literature demonstrating adverse health effects of chronic exposure to elevated levels of air pollution. These are the first results demonstrating a relationship between ambient air pollution and outcomes in patients with sepsis.
Further work in exploring the role ozone pollution has in the pathophysiology of sepsis could focus on markers of inflammation. The exact mechanism underlying our findings of ozone exposure being associated with increased mortality is unknown. Ozone pollution exposure has been linked to increased levels of pulmonary oxidative stress and inflammation. 22 Additionally, inhalation of ozone pollution has been shown to activate many inflammatory signaling cascades that may have consequences on the host immune response in patients with sepsis. 23,24 There has been little work investigating the interaction between inflammation caused by air pollution and the host response in patients with sepsis.
The lack of an association between PM exposure and outcomes in patients with sepsis warrants investigation. Particulate matter pollution has been demonstrated to cause increased inflammation and oxidative stress in many organ systems. 7,8,25 Ozone pollution may cause higher levels of inflammation compared to PM pollution. 26 It is possible that different sizes of PM pollution may affect outcomes in patients with sepsis. We were only able to utilize the PM2.5 diameter for this study as many counties only gather information on this form of PM pollution. It is possible that ultrafine (<0.1 micron) or coarse particles (2.5-10 microns) may contribute differentially to sepsis outcomes. 27
Additionally, it also possible that the lack of granularity for the PM data may be contributing to the lack of an observed association with mortality. Whereas the ozone data are collected as 8-hour mean daily values, the particular matter data are an average of the entire year. Thus, it is possible that increased levels of PM on certain days may have caused worse sepsis outcomes and would be difficult to characterize in our analysis. Future analyses could attempt to characterize the PM exposure by patients on the days of their hospitalizations rather than relying on the average mean exposure for that area. Further detailed studies on the impact of all forms of PM on outcomes in patients with sepsis are needed.
The patients in this study had on average, levels of exposure to PM and ozone pollution that met or exceeded guidelines for the National Ambient Air Quality Standards (NAAQS). The primary mean level of exposure allowed for PM2.5 is 12 µg/m3, whereas the mean level of exposure in our cohort was 11.0 µg/m3. The average exposure for ozone pollution in our cohort was 0.078 ppm, exceeding the specified target of 0.070 ppm by the NAAQS. 28 It is striking that significant numbers of Americans continue to live in areas with high ambient air pollution. A recent analysis demonstrated that increased overall mortality for all patients occurs even at levels below the recommended standards of the NAAQS. 29 Our analysis lends further weight to the increasing body of literature that any increased levels of air pollution can lead to poor health outcomes.
The strengths of this analysis lie in the large number of patients studied across diverse treatment settings. The ability to capture patients from over 28 states allows for good external validity and generalizability. In addition, we were able to compare regions of the country with greatly different levels of ambient air pollution, which strengthens our findings.
The results of this study must be interpreted within the context of its study design. Studies employing administrative data are at inherent risk of bias from coding errors and misclassification. Additionally, we were unable to use more granular severity of illness scores, such as the SOFA score, in our adjustment models due to the lack of detailed clinical information in the NIS.
Another major limitation to the conclusions drawn from this analysis lies in the inability to accurately capture smoking status. Unfortunately, the fidelity of the NIS data set does not allow accurate characterization of smoking status. Future studies repeating similar analyses with data that incorporates smoking status would be helpful to determine whether the associations seen in this analysis are indeed accurate after adjustment for smoking.
The findings presented in this analysis are the first reported association between increased levels of ozone air pollution and worse outcomes in hospitalized patients with sepsis. Given the limitations of the analysis, these results should be interpreted as hypothesis generating rather than confirmatory. Future studies are needed to repeat this work with data sets that capture both smoking status and higher fidelity patient-level information about sepsis severity. The mechanisms underlying these findings must also be investigated. The complex interaction between the host immune response, air pollution, inflammation, and changes during sepsis must be further elucidated.
Conclusion
Increased levels of ozone air pollution but not PM pollution were associated with higher rates of mortality in patients with sepsis across the United States. Patients with pneumonia had a higher impact from ozone pollution; however, the association was still significant in patients with sepsis from a nonpulmonary source. Future research is needed to confirm these findings and explore potential mechanisms of the adverse effects of ozone pollution in patients with sepsis.
Footnotes
Declaration of Conflicting Interests
The author(s) declared no potential conflicts of interest with respect to the research, authorship, and/or publication of this article.
Funding
The author(s) received no financial support for the research, authorship, and/or publication of this article.