
Abstract

Keywords
We wish to thank Drs Ofoma and Kethireddy for expressing their interest in our research. 1 Their main criticism seems to focus on our choice of the 24-hour threshold as a definition of the discharge delay exposure. While we agree in principle, that using a hard threshold to define an exposure can hide potential effects of that exposure on the outcome, our use of 24 hours was neither arbitrary nor unjustified.
First you will note, as part of our laboratory’s standard practice, we have cited and published the data extraction and analysis code on GitHub. 2 This online repository also contains exploratory work accompanied by output, which explore the characteristics which Drs Ofoma and Kethireddy mention as being useful.
Second, during this project, we spent a great deal of time trying to understand the process by which patients are discharged from the intensive care unit. Some of this work is represented in the supplementary material. The factors which play a role in the length of discharge delay are complex and involve multiple interacting factors. Factors such as the hour of callout, shift changes, and day of week all play an important role. While only a careful analysis using a large sample size can probably come close to understanding the process in full, the 24-hour threshold was chosen in part because it reduces the effect of some of these factors. Every patient who has a delayed discharge of >24 hours has likely observed at least 2 shift changes, one morning round and one overnight stay. While we would be the first to admit that this does not eliminate these problems in entirety, in the absence of any standardized definition of discharge delay we believe it was the right choice which resulted in patient groups that were more homogeneous as to the reason discharge may have been delayed.
Drs Ofoma and Kethireddy referenced a study from Garland and Connors 3 that we also cite in the original publication which found a “U-shaped” curve describing the relationship between 30-day mortality and discharge delay. This is in contrast to our published work 1 and subsequent analysis initiated in response to this inquiry. Nonetheless, we reran the multivariable logistic regression analysis for in-hospital mortality using the same process as described in the paper 1 ; however, the discharge delay was modeled using binning (<6, 6-12, 12-24, 24-36, 36-48, >48 hours) and also in a similar fashion to Garland as a continuous function using natural cubic splines. As is evident in Figure 1, we did not find any statistically significant evidence that the length of discharge delay was associated with in-hospital mortality (P = 0.69 and 0.72 for the spline and binned analysis, respectively). Given the large effect estimates seen in Garland’s 3 study, it seems likely we would have been able to detect effects of this magnitude in our study. Although some of the differences in the results could be attributed at least in part to differences in processes of care at these hospitals, there could be other hidden variables which could be instrumental as well. This could potentially be an area of future research.
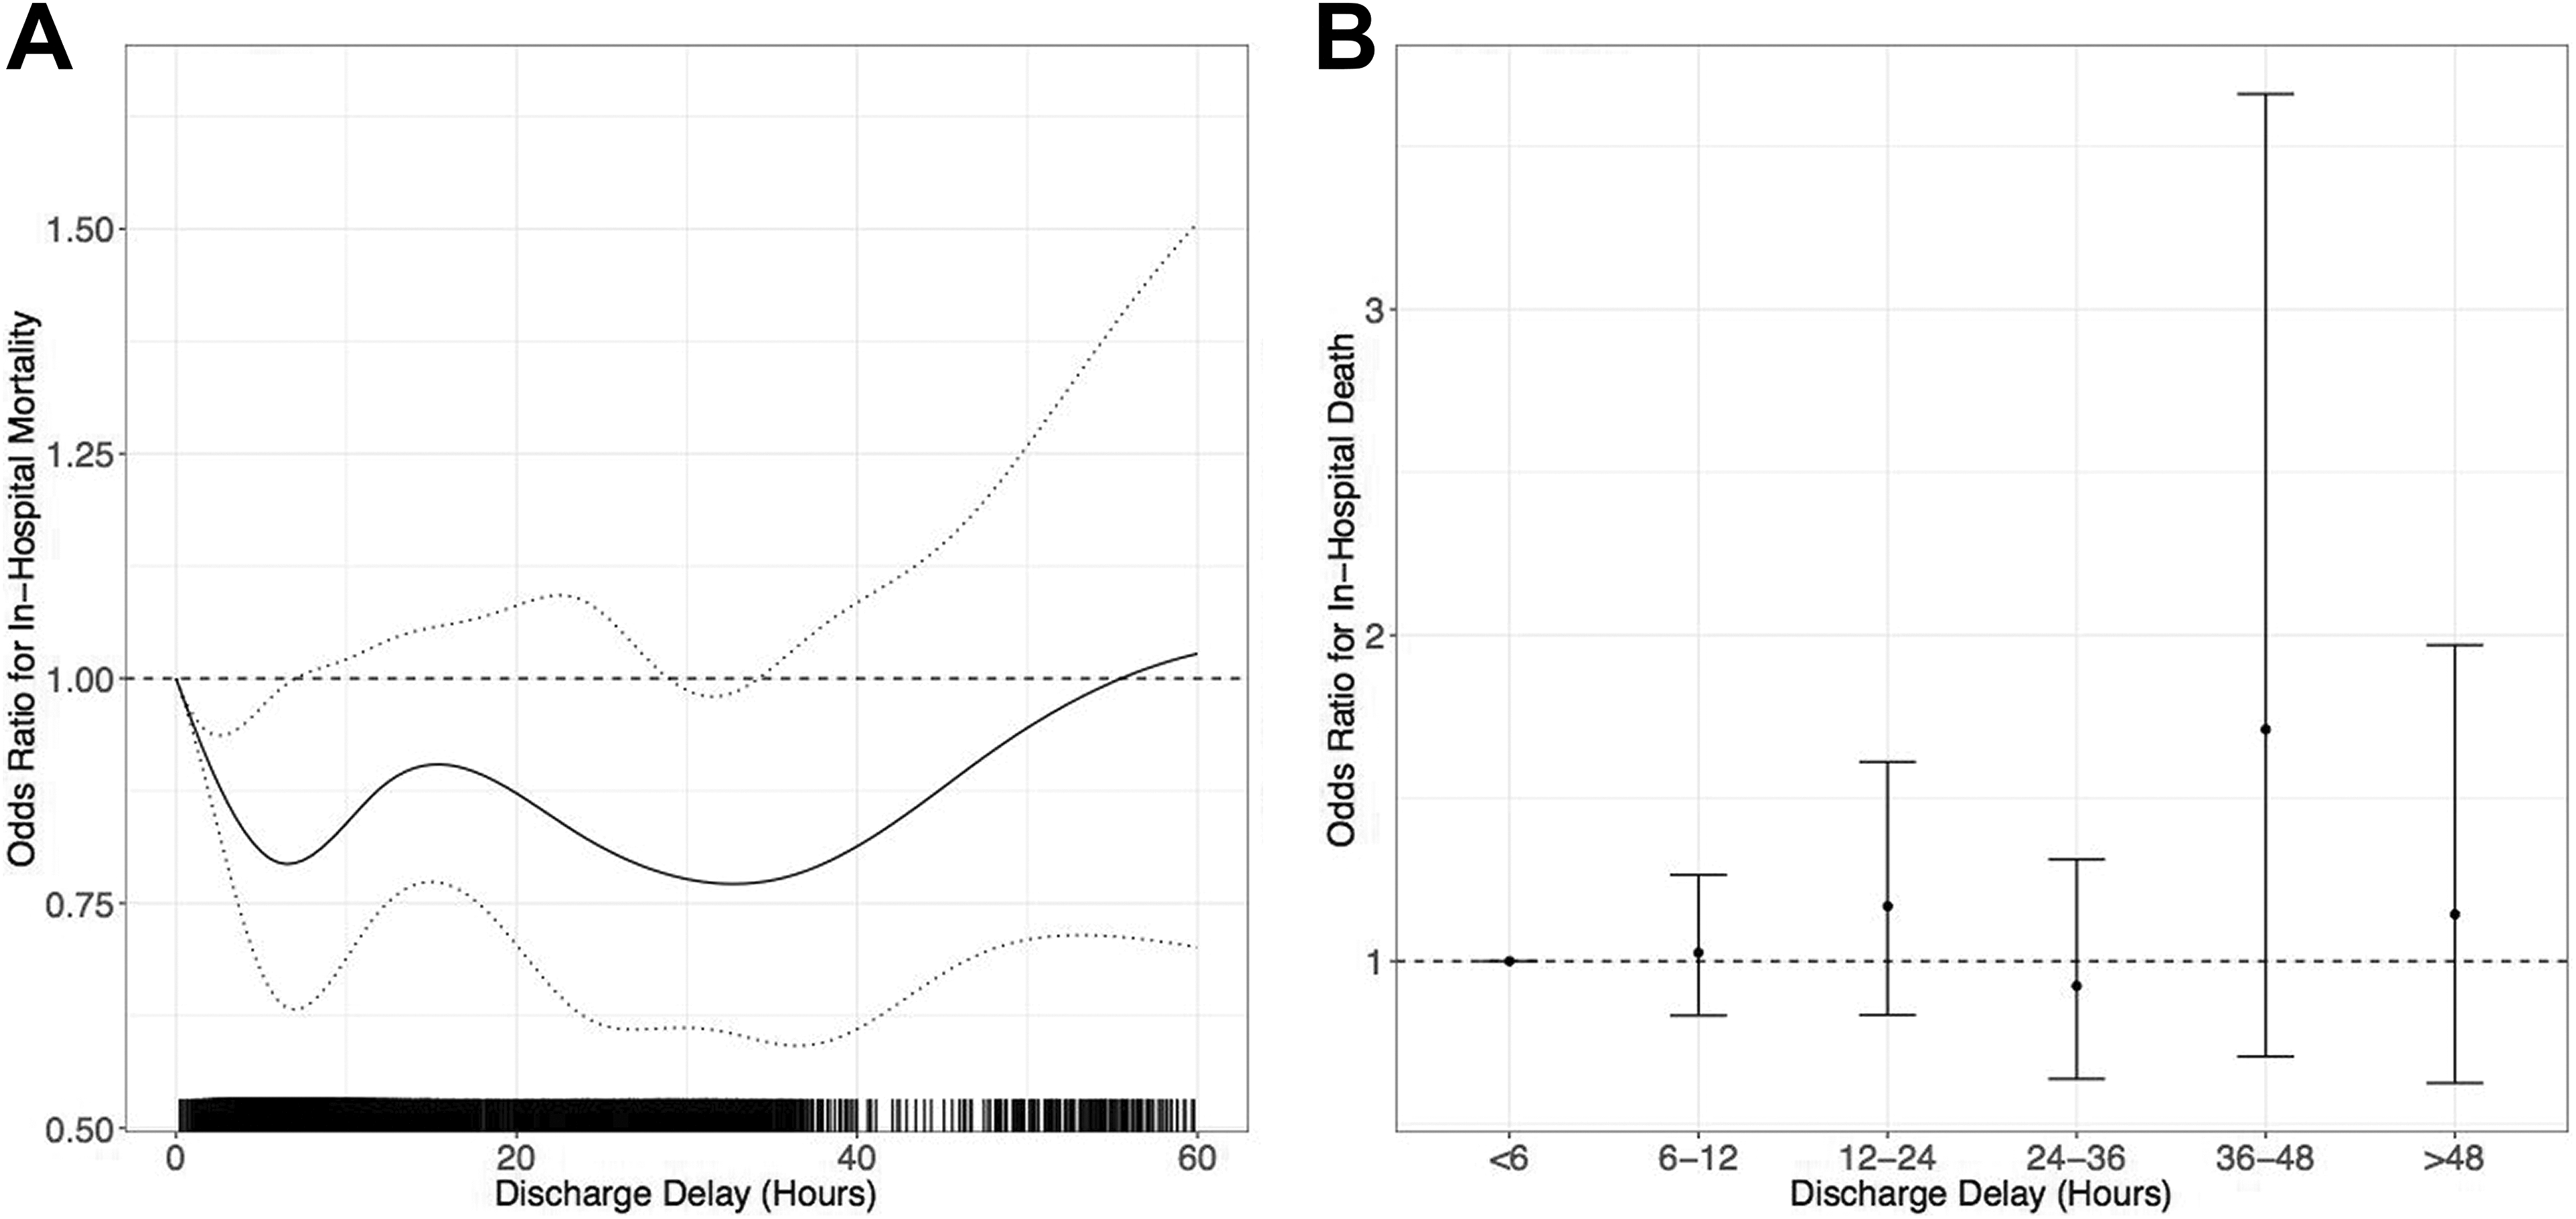
Spline-based (A, left) and binned (B, right) multivariable analysis of the association between discharge delay and in-hospital mortality adjusting for the same confounders in the original contribution. Odds ratios are relative to those with a 0-hour discharge delay (A) or having a <6-hour discharge (B). Dotted lines (A) and error bars (B) represent 95% pointwise (A) confidence intervals.
Footnotes
Authors’ Note
Dr Bose is currently supported in part by NIH/NHLBI (1U01HL123022-01). Drs Johnson, Celi, and Raffa are supported in part by NIH/NIBIB (R01-EB017205 and R01-GM104987). Dr Moskowitz is currently supported by NIH 2T32HL007374-37. The content is solely the responsibility of the authors and does not necessarily represent the official views of the National Heart, Lung, and Blood Institute, the National Institutes of Health.