
Abstract
Introduction:
We previously showed that a “10-hour daytime on-site” and “nighttime (NT) on-call” staffing strategy was associated with higher mortality for intensive care unit (ICU) patients admitted during NT than it was for patients admitted during office hours (OH). In here, we evaluated the clinical effects of a 24-hour intensivist staffing model.
Methods:
We formed an intervention group of 3034 consecutive ICU patients hospitalized from January 2013 to December 2015, and a control group of 2891 patients from our previous study (2009-2011). We applied propensity score matching (PSM) for whole and subgroup analyses adjusting for confounding factors. We compared clinical outcomes of patients under the 2 staffing models using multivariate logistic regression and survival analyses.
Results:
After PSM, we balanced the clinical data between the complete cohorts and the subgroups. Comparison of ICU survivals between the intervention and control cohorts yielded no significant differences. However, the intervention was significantly associated with a higher ICU survival in the NT (5:30
Conclusions:
The 24-hour intensivists staffing could significantly improve ICU outcomes, especially for NT-admission patients in high-acuity, high-volume ICUs with frequent NT admissions.
Introduction
The association between intensive care unit (ICU) admission time and ICU outcome remains controversial. Studies have shown increased mortality, 1,2 no risk effects, 3,4 or a protective effect 5,6 in patients admitted during nighttime (NT) compared to those admitted during the daytime. In 2013, we reported an association between NT admission and poor ICU outcomes for critically ill patients. 7 We speculated that this might be related to the shortage of onsite-qualified intensivists for NT coverage. Studies have indicated better outcomes for critically ill patients receiving intensivist-directed care than for those treated by nonintensivists. 8 –11 Similarly, the high risk for death in patients admitted to ICUs on weekends has been suggested to be due to the low availability of intensivists during these times. 12 Therefore, the different quality of care at different admission times seems to be the key for the patients’ outcomes, especially in high-volume and high-acuity ICUs. 13
In accordance with the recommendations from the American College of Critical Care Medicine and Leapfrog group, which advocated for continuous intensivist availability, 14 we updated the staffing model of the mixed ICU to a 24-hour/7-day model starting in 2012. Results from other studies have confirmed that 24-hour intensivist staffing models improve patient outcomes and reduce care costs sufficiently to offset the additional staff cost. 15,16 By contrast, the randomized trial by Kerlin et al did not show benefits for ICU length of stay (LOSICU), in-hospital mortality, or readmission numbers after implementation of the 24-hour model. 17
We carried out this historical-control study to explore the effects of the current intervention. While other studies have focused only on the clinical effects of the 24-hour intensivist coverage on all the patients, without conducting subgroup analyses according to the patients’ admission times. 17 –20 In here, we carried out subgroup analyses to explore the effects of the 24-hour intensivist coverage on critically ill patients with different admission times.
Materials and Methods
The department of Critical Care Medicine (CCM) of Zhongshan Hospital has 4 different units (mixed ICU, surgical ICU, cardiac surgery ICU, and hepatic surgery ICU). Our study was conducted with patients in the mixed ICU with 10 beds. Since 2012, the staffing model at this ICU has been upgraded to make the equipment, expertise, and staff available in the same quantity and quality at all times. For this study, we enrolled 3034 consecutive ICU patients from January 2013 to December 2015 for the intervention group and we used data from 2891 patients from our previous study 7 to form the control group. The decision to discharge patients from the ICU was based on our transferring protocol. 7 All patients, their relatives, or legal representatives signed informed consents prior to participation. The Review Board of the Ethics Committee of Zhongshan Hospital, Fudan University approved this study.
We collected clinical, physiological, and outcome data for each patient including age, gender, primary diagnosis, acute physiologic, and chronic health evaluation II (APACHE II) score at the time of admission, hospital length of stay (LOSHOS), LOSICU, type of admission (surgical or medical, emergency or nonemergency), transfusion requirement during the ICU stay, vasopressor use (Additional file 1: Table S1), and mechanical ventilation (MV) requirement.
Staffing Model
We defined 07:30
The nurse to patient ratio was 1:2.5 at all times, and all the nurses had critical care certifications. Professionals from other departments such as radiology and ultrasound were available around the clock.
Study Design and Statistics
First, we compared the cohorts between the control and intervention groups. Then, we compared the OH and NT admission subgroups within the intervention group, the NT admissions between the control and intervention groups, and the OH admissions between the control and intervention groups. We analyzed the data from each comparison using the SPSS version 15.0 software (SPSS, Chicago, Illinois). We used the Kolmogorov-Smirnov test to assess normality. We expressed continuous variables as means (SD) or as medians and full ranges (if the assumption of normal distribution was violated) and categorical variables as numbers and percentages. To compare continuous variables, we used the Mann-Whitney U and Wilcoxon tests, and we applied the χ2 or Fisher exact tests for categorical variables.
Because of baseline characteristic imbalances, we carried out propensity score matching (PSM) for each comparison 7 using the nearest neighbor technique and enforcing a caliper of 0.01 on the probability scale. In order to balance the covariates throughout the comparisons, we computed the propensity score as the conditional probability of ICU mortality using a logistic regression model that included baseline demographic and clinical characteristics—age, gender, emergency admission, surgical/medical patients, transfusion requirement, APACHE II scores, types of MV, admission day, and/or admission time. We used the Psmatch2 macro (one-one match) in the STATA version 11.0 software (StataCorp LP, College Station, Texas) for PSM. We applied multivariate logistic regression for ICU and 28-day mortality for each comparison before and after PSM. Moreover, we estimated the survival curves using the Kaplan-Meier method and compared them using the log-rank test. Next, we used the Cox regression model to perform the univariate and multivariate analyses. P values <.05 (2-tailed) were considered statistically significant.
Results
Whole Cohort Comparison
Before PSMs, we analyzed the distributions of major clinical data between the control and intervention groups (Table 1). Compared to the control group, the intervention group had older patients, higher APACHE II scores, higher emergency admission rates, more blood transfusions, more MV, more vasopressor use, and more medical patients. The distribution of admissions per hour was similar between the 2 groups as observed initially (Figure 1A); however, more patients were admitted during the NT in the intervention group than in the control group (11.8% vs 6.1%, P < .001). Interestingly, the LOSHOS, LOSICU, ICU mortalities, 28-day mortalities, and the MV duration in the intervention group were like those in the control group. On the other hand, the hospital and ICU expenses in the intervention group were significantly higher than those in the control group.
Distributions of Major Clinical Data and Study Variables of the Complete Cohorts.a
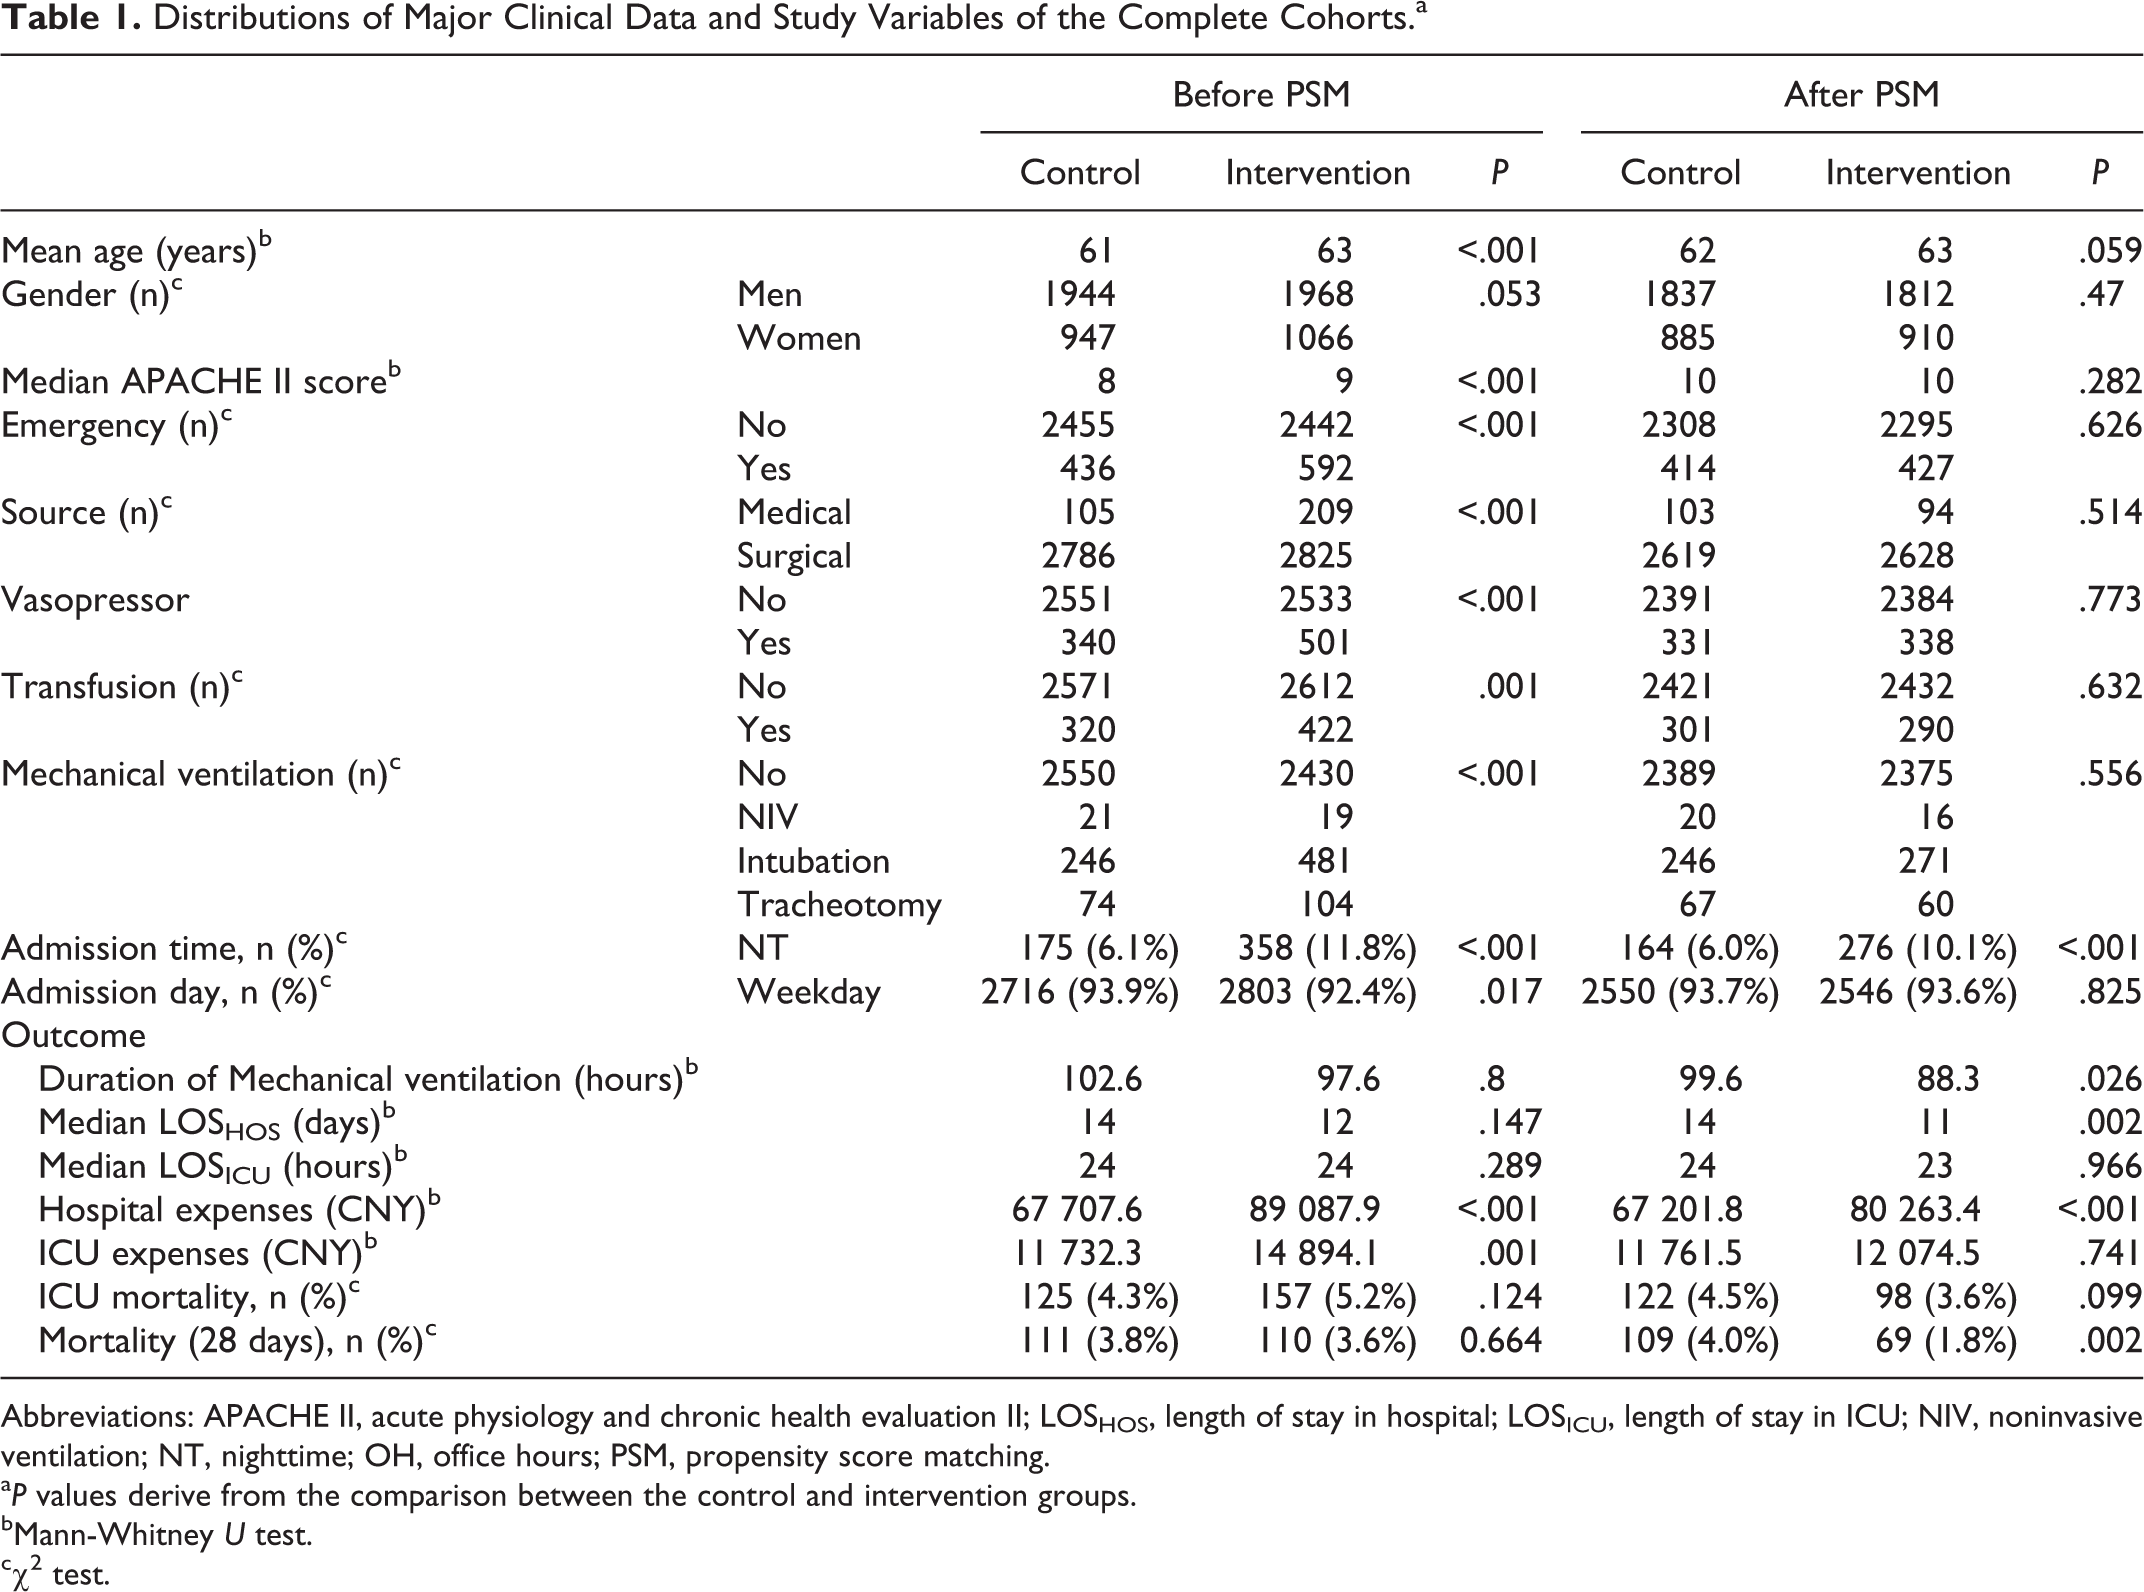
Abbreviations: APACHE II, acute physiology and chronic health evaluation II; LOSHOS, length of stay in hospital; LOSICU, length of stay in ICU; NIV, noninvasive ventilation; NT, nighttime; OH, office hours; PSM, propensity score matching.
a P values derive from the comparison between the control and intervention groups.
bMann-Whitney U test.
cχ2 test.
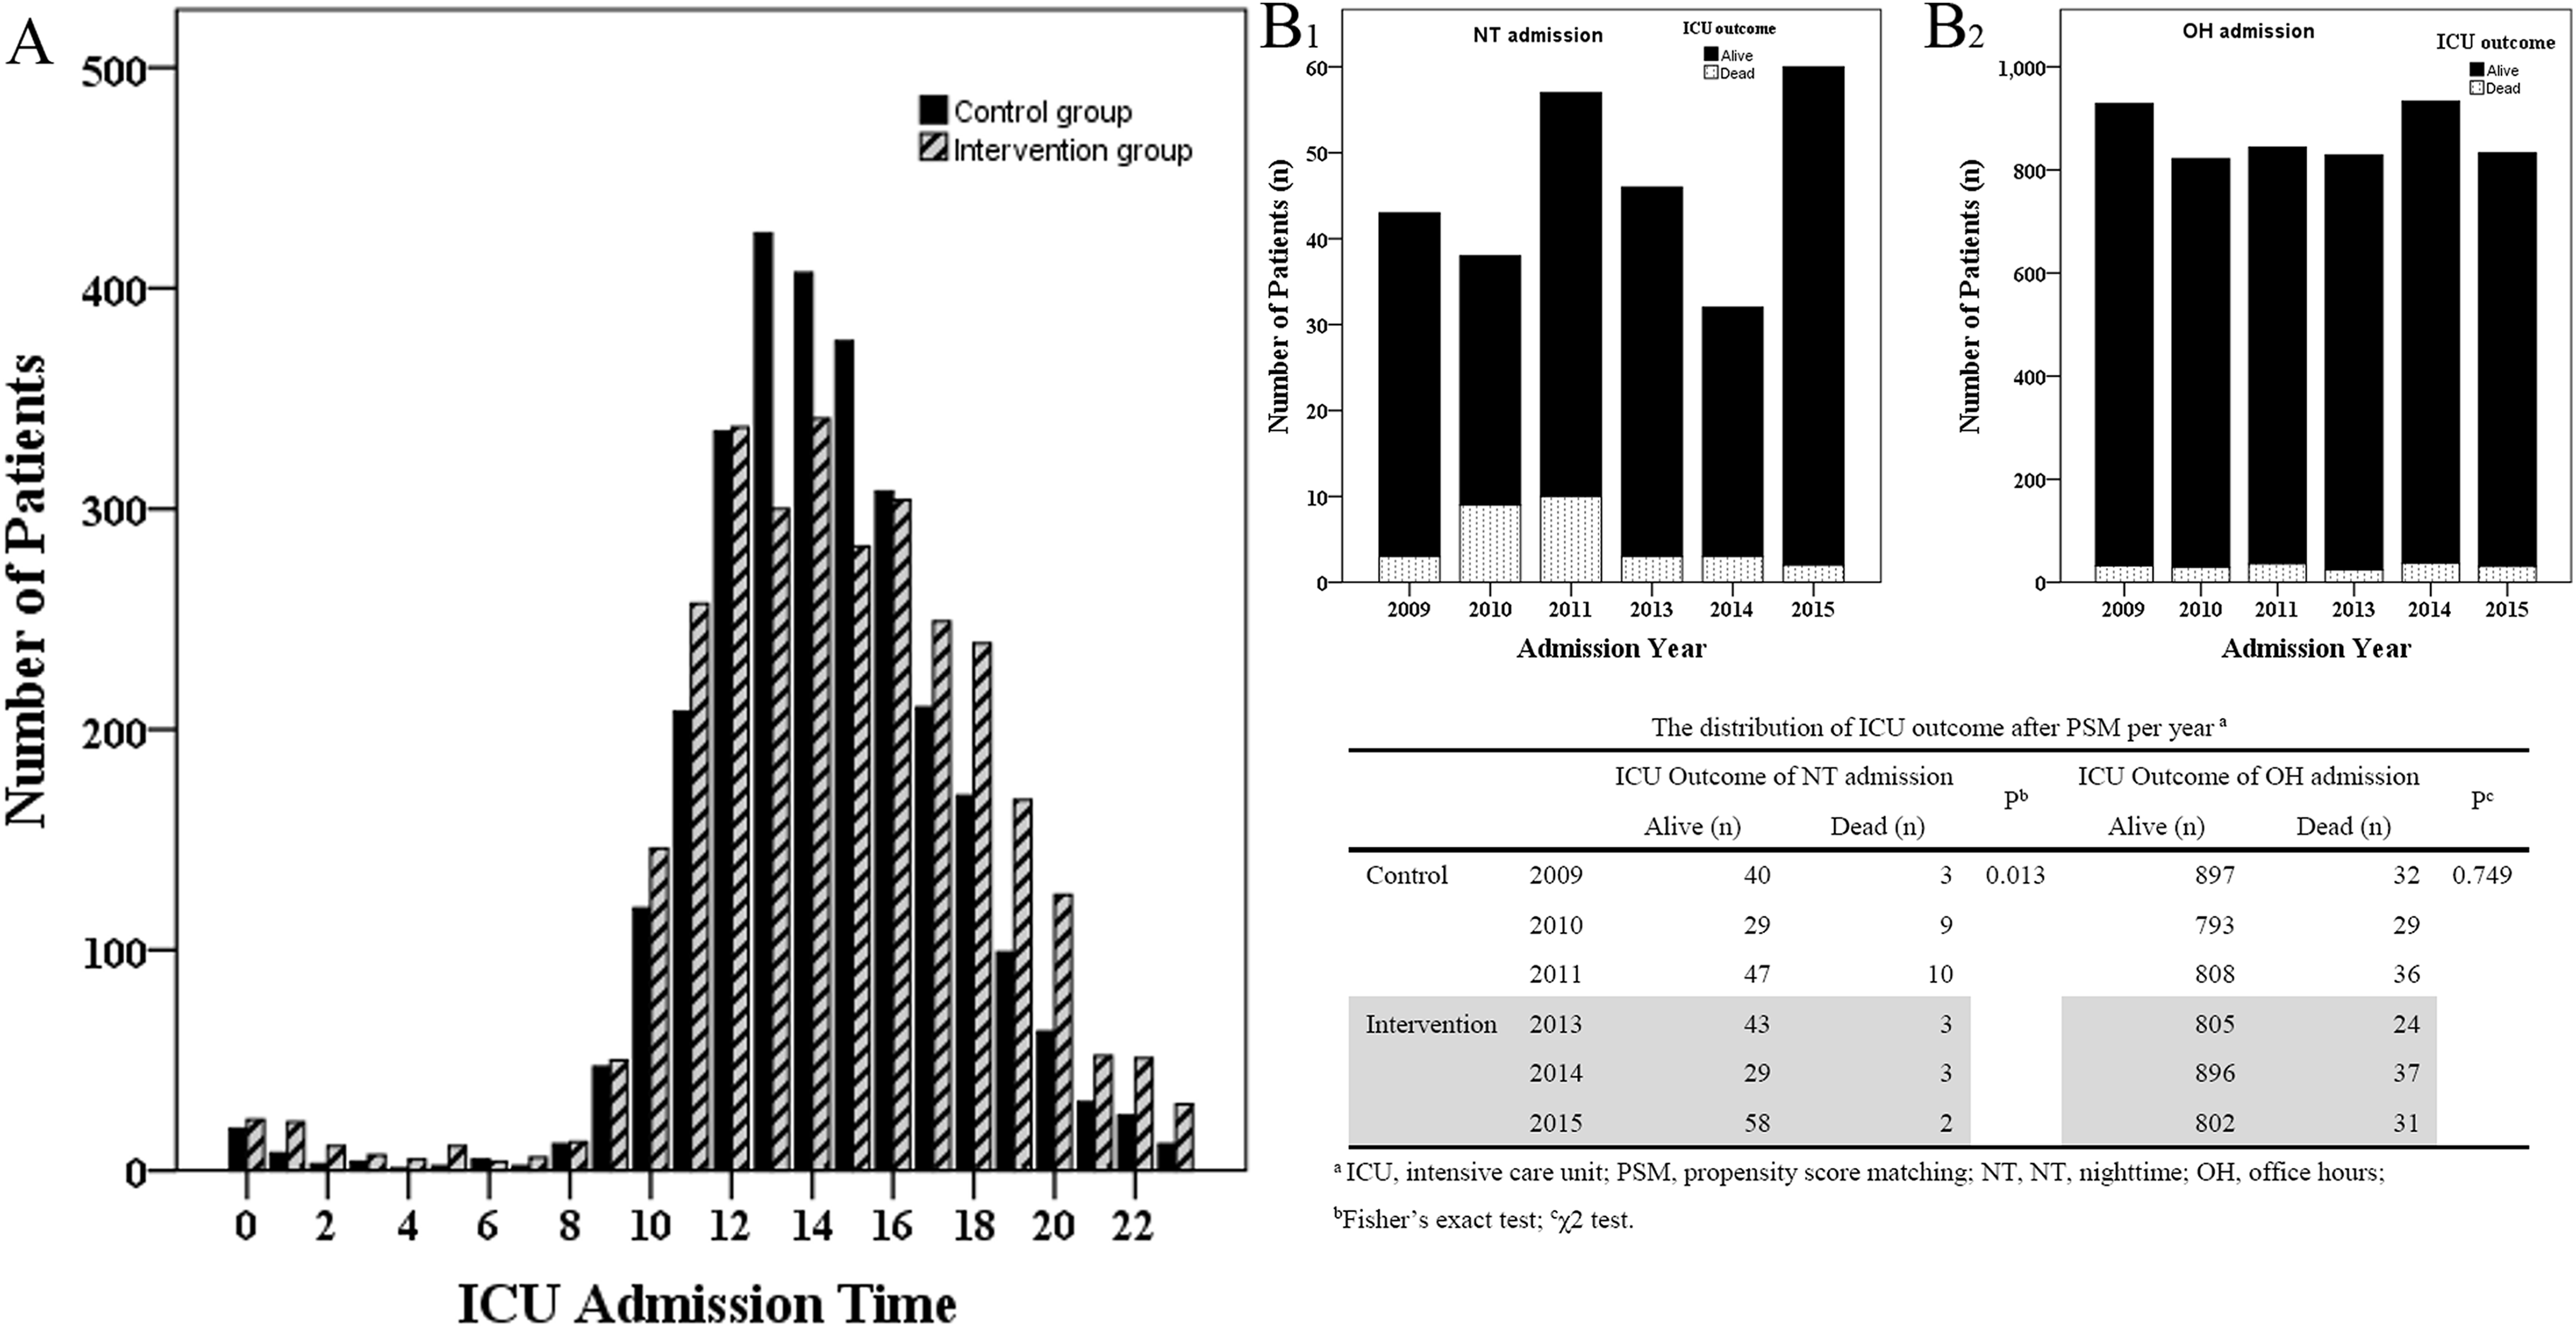
Distribution of admissions (per hour) and of ICU mortality (per year) after PSM. Distribution of admissions in both the control and the intervention groups (A). For nighttime (NT) admission patients, the per year ICU mortality from 2013 to 2015 was lower than that from 2009 to 2011 (B1). For office hours (OH) admission patients, the per year ICU mortality from 2013 to 2015 was like that from 2009 to 2011 (B2). PSM, propensity score matching.
After PSM, all the baseline variables were balanced except for the NT admission rate (intervention vs control, 10.1% vs 6.0%, respectively, P < .001). The 28-day mortality of the intervention group was significantly lower than that of the control group. Compared to the control group, the intervention group had shorter durations of MV and LOSHOS. The LOSICU, ICU expense, and ICU mortality were similar between the 2 groups (Table 1).
In the univariate survival analysis, the ICU survivals between the 2 groups were not different before or after PSM (P = .398 and .659, respectively; Figure 2A and B), while the admission times (OH vs NT admission) were associated with the ICU survivals before and after PSM (both P < .001; Additional file 2: Figure S1A and B). Next, we included all the clinical variables into the multivariate analysis. The intervention was not associated with greater ICU survival before or after PSM. The admission APACHE II score was an independent marker for ICU survival before and after PSM (P < .001), and the admission time was independently associated with the ICU survival after PSM (Table 2).
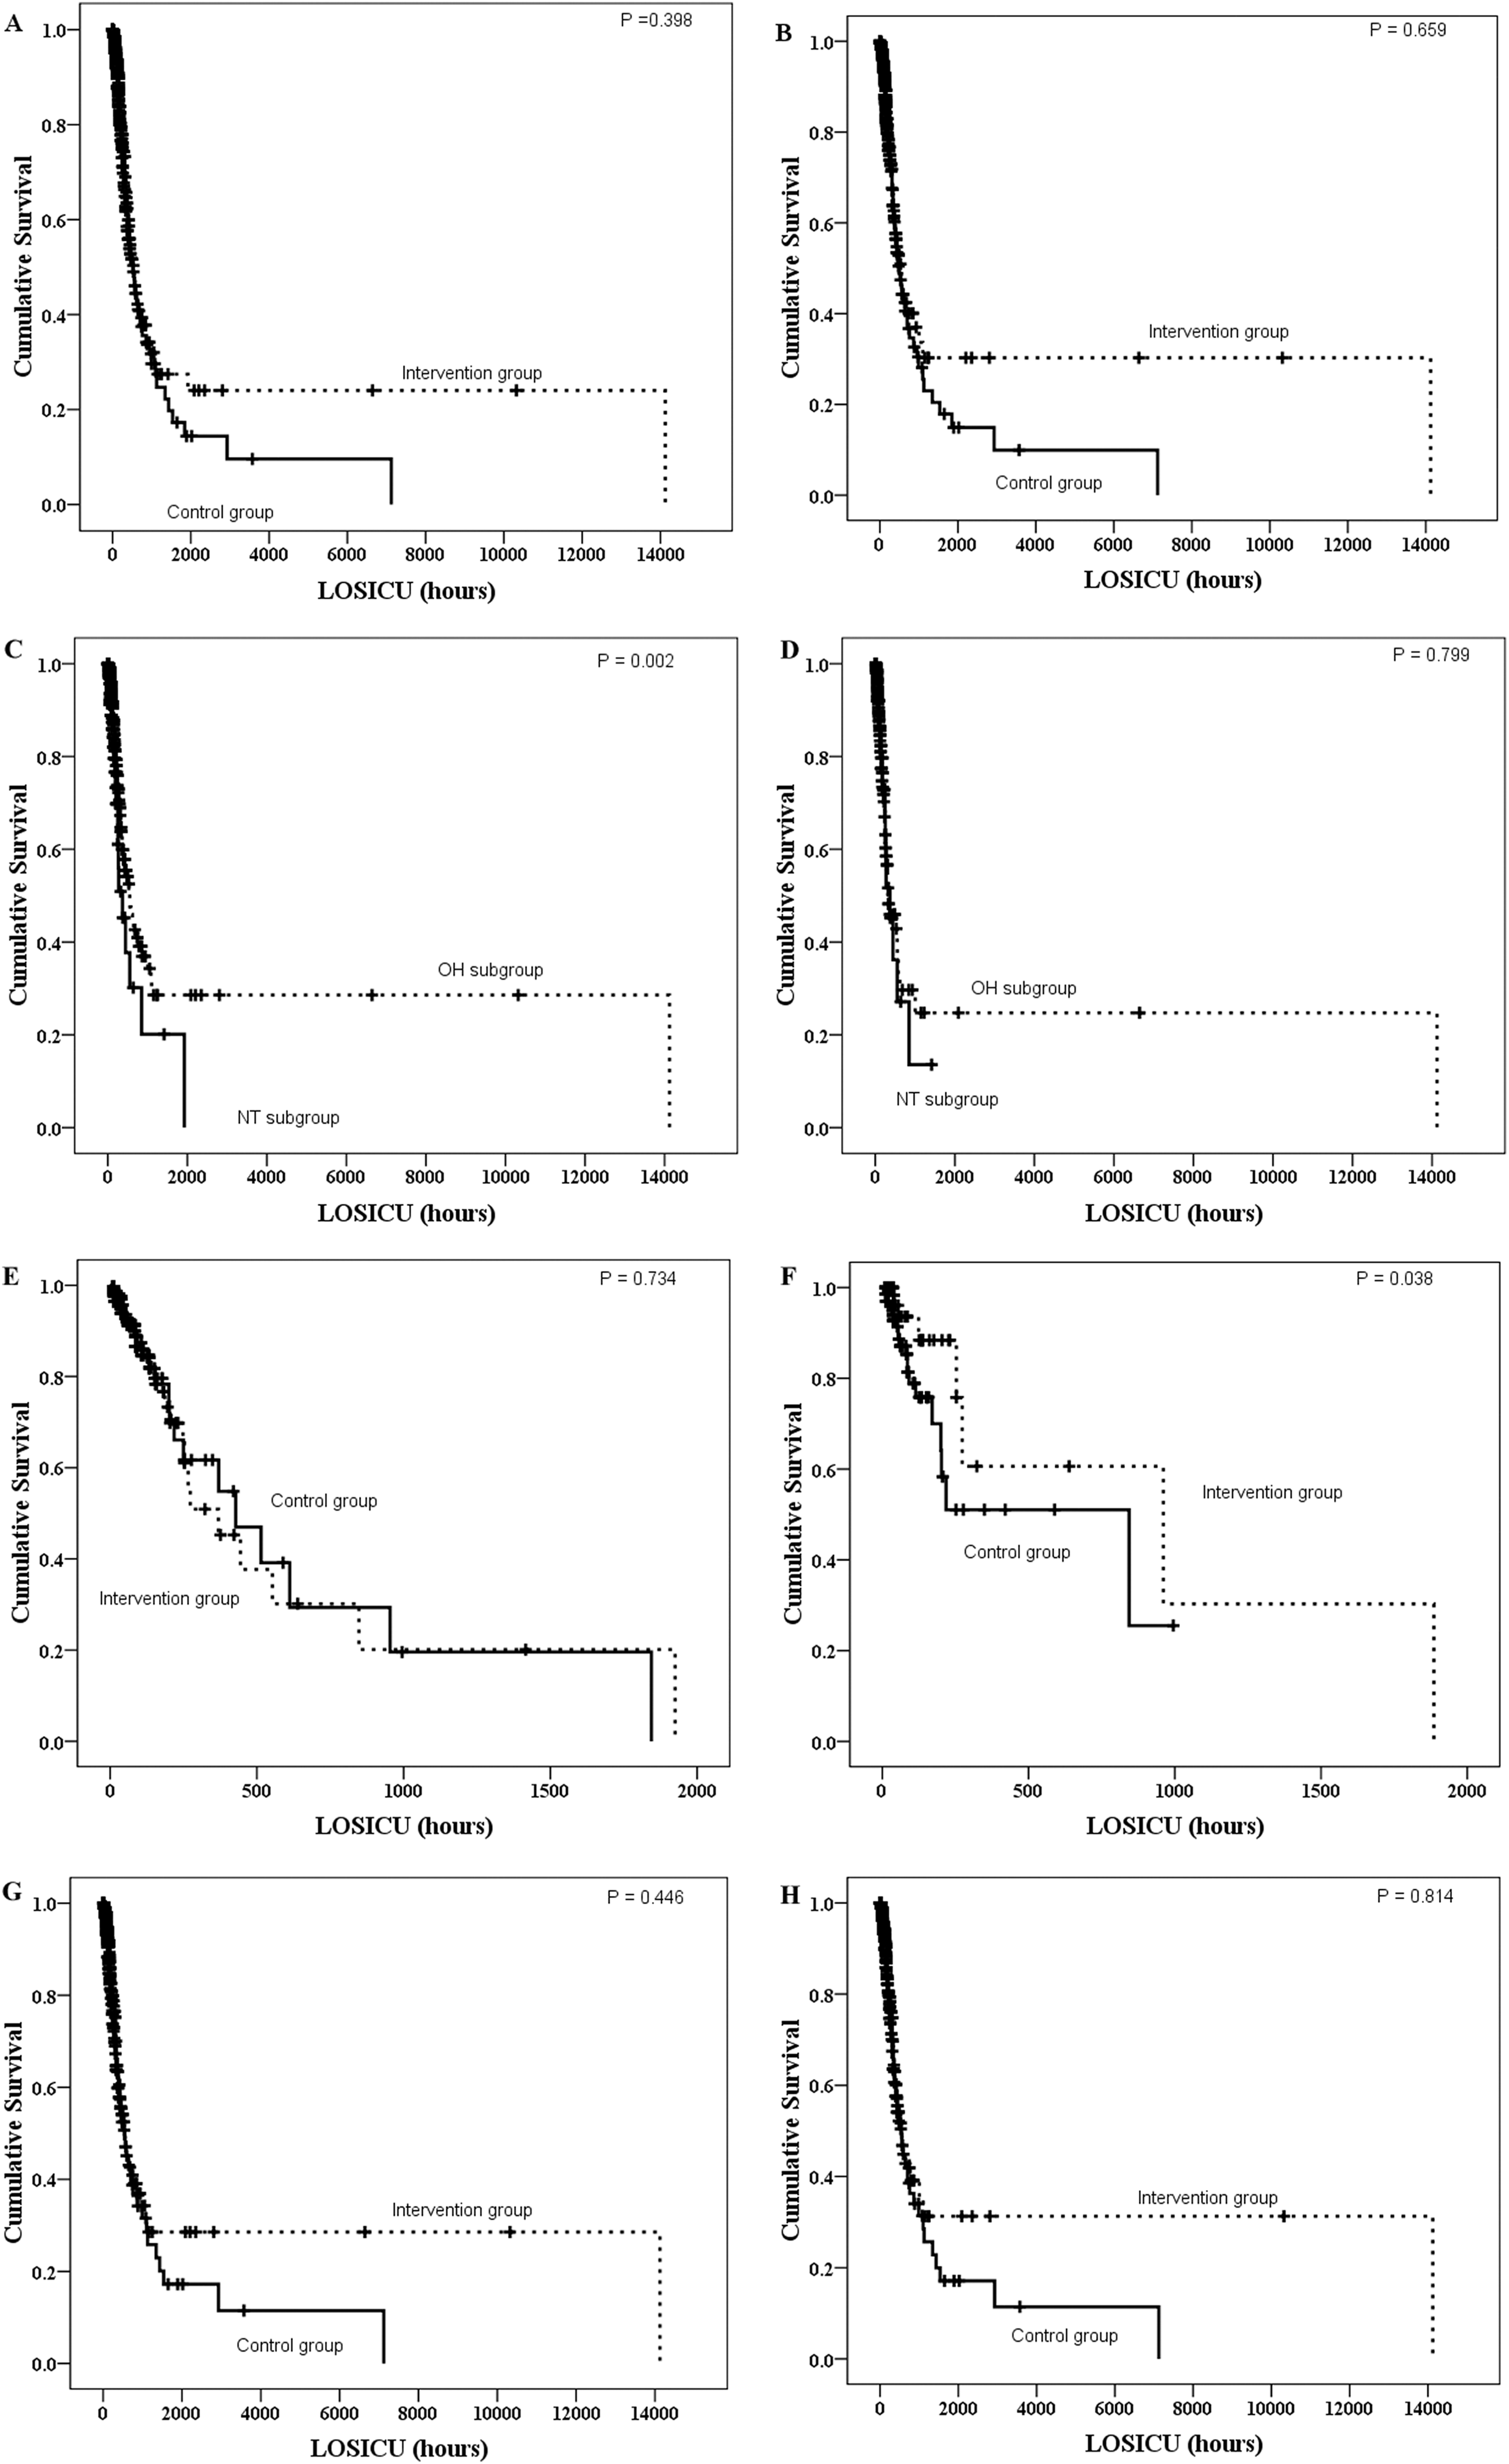
Kaplan-Meier curves of survival differences among ICU patients. In the whole cohort, the ICU survival of the intervention group was not significantly different from that of the control group, before (A) or after (B) propensity score matching (PSM) analyses. In the intervention group, the nighttime (NT) admission was associated with poor ICU survival before PSM (C) but not after PSM (D). In the NT admission subgroup, the intervention improved the ICU survival of the NT admission patients after PSM (F) but not before PSM (E). In the OH admission subgroup, the intervention was not associated with improvement in the ICU survival rates before (G) or after PSM (H). PSM, propensity score matching.
Multivariate Survival Analyses.a
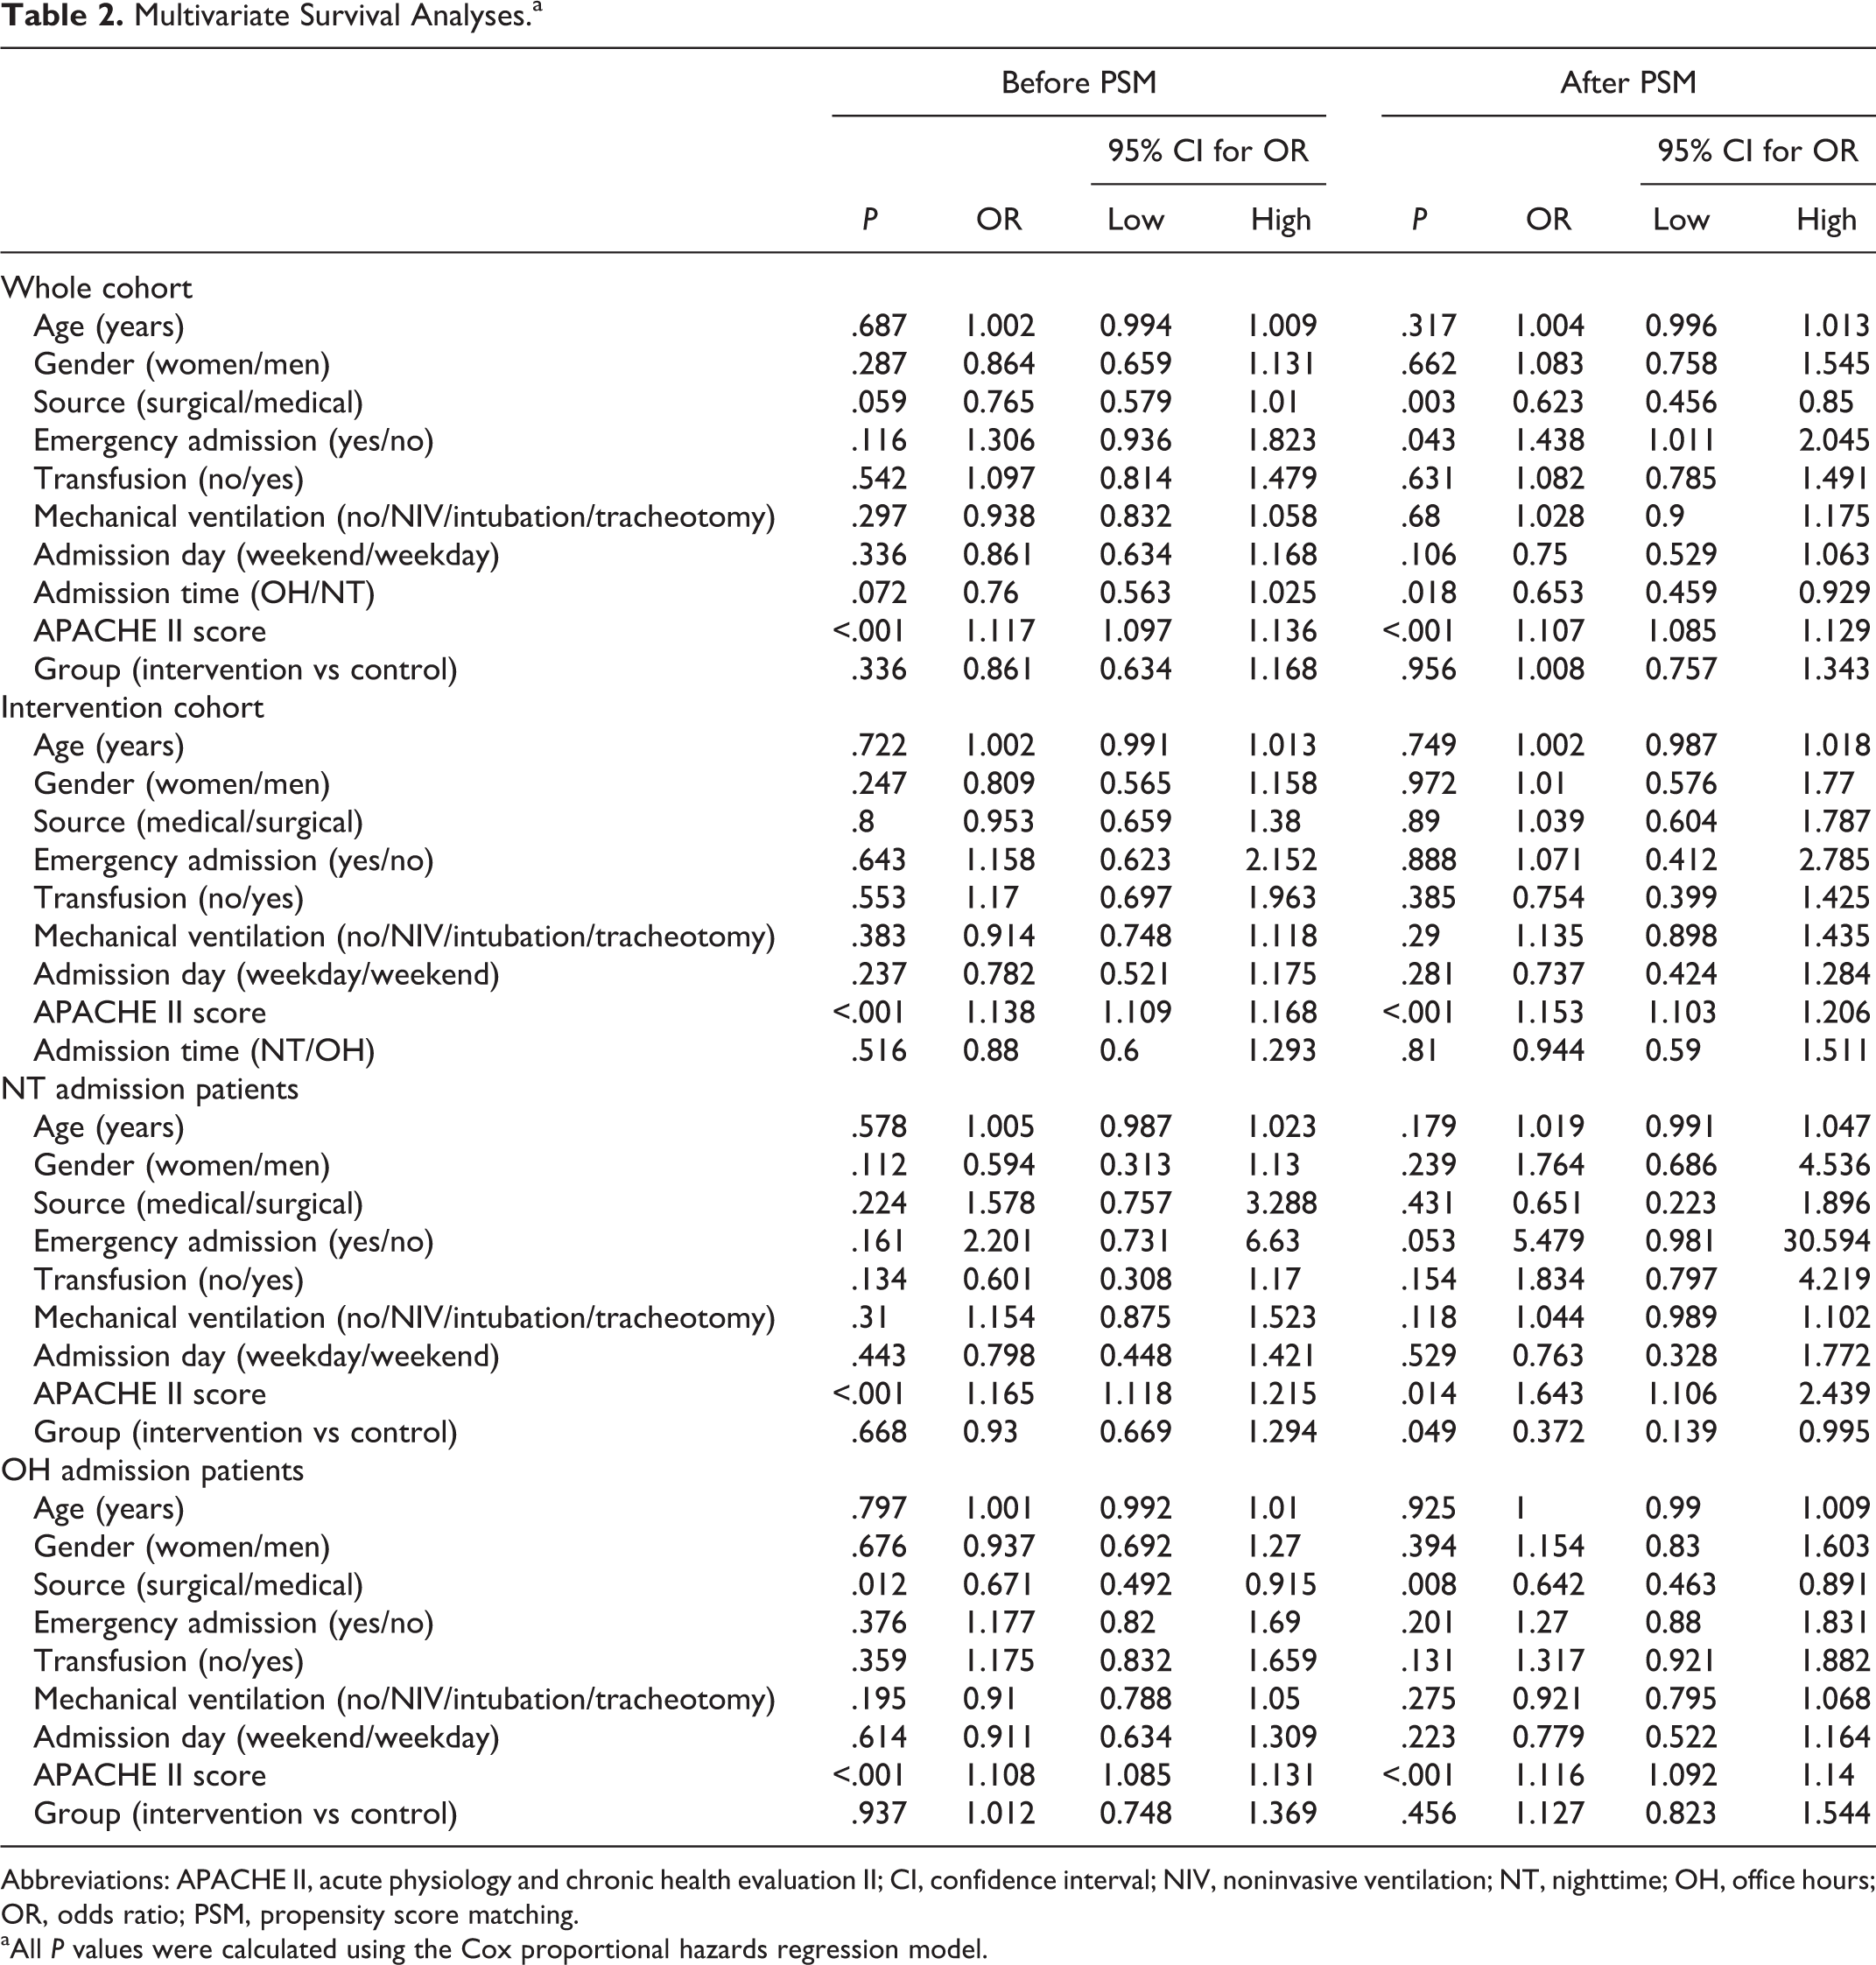
Abbreviations: APACHE II, acute physiology and chronic health evaluation II; CI, confidence interval; NIV, noninvasive ventilation; NT, nighttime; OH, office hours; OR, odds ratio; PSM, propensity score matching.
aAll P values were calculated using the Cox proportional hazards regression model.
On the other hand, the multivariate analyses showed that the intervention (before PSM, P < .001; and after PSM, P = .001) rather than the admission time (before PSM, P = .317; and after PSM, P = .121) was an independent indicator for a low 28-day mortality (Additional file 1: Table S2).
Intervention Cohort Intragroup Comparison (OH vs NT)
Before PSM, most of the basic clinical variables were distributed nonuniformly between the OH and NT subgroups in the intervention cohort. After PSM, all factors were equally distributed between the 2 subgroups (Additional file 1: Table S3).
Before PSM, NT admission was associated with prolonged LOSICU, higher hospital and ICU expenses, and ICU and 28-day mortality (Additional file 1: Table S3). But after PSM, the NT admission subgroup displayed superior outcomes than the OH admission subgroup, including reduced LOSHOS and LOSICU, lower hospital and ICU expenses, and lower ICU and 28-day mortalities (Additional file 1: Table S3).
Nighttime admission was associated with poor ICU survival (P = .002, Figure 2C) before PSM, but this changed after PSM (P = .799, Figure 2D). Subsequently, our multivariate analysis revealed that NT admission was not associated with the ICU survival before or after PSM (Table 2). In addition, we found no association between the NT admission and the 28-day mortality after the multivariate analysis before and after PSM (Additional file 1: Table S2).
Nighttime Subgroup Comparison Between Intervention and Control Groups
The distribution of the baseline clinical characteristics differed significantly between the NT subgroups of intervention and control groups (Additional file 1: Table S3). But after PSM, all these variables were balanced (Additional file 1: Table S3). With respect to the outcomes, the matched NT admission patients in the intervention group had shorter LOSHOS and LOSICU, lower ICU expenses, lower ICU mortalities, and lower 28-day mortalities than the NT admission patients in the control group (Additional file 1: Table S3). The per-year ICU mortality of the NT admissions in the intervention group was lower than that in the control group (P = .013, Figure 1B 1).
Moreover, intervention significantly improved the ICU survival after PSM (P = .038, Figure. 2F) compared to the same survival before PSM (P = .734, Figure 2E). Our multivariate analysis also confirmed that the intervention was an independent factor for enhanced ICU survival (Table 2). With respect to the 28-day mortality, the NT admission patients in the intervention group had a lower 28-day mortality than the same patients in the control group before and after PSM (Additional file 1: Table S2).
Office Hours Subgroup Comparison Between Intervention and Control groups
Before PSM, the distribution of the baseline clinical characteristics differed significantly in the OH subgroups between the intervention and control groups (Additional file 1: Table S3). After PSM, all the major clinical variables were balanced between the 2 groups (Additional file 1: Table S3). The intervention group exhibited shorter MV and LOSHOS durations. The hospital expenses of the intervention group were higher than those of the control group. We found no significant differences in the ICU or 28-day mortalities between the 2 groups. The per-year ICU mortality of the OH admission patients in the intervention group was like that in the control group (P = .749, Figure 1B 2).
For the OH admission patients, the intervention did not improve the ICU survival (before PSM, P = .446; after PSM, P = .814; Figure 2G and H). Further multivariate analyses also confirmed that the intervention was not associated with ICU survival before or after PSM (Table 2). The multivariate logistic analyses demonstrated that the intervention improved the 28-day mortality before but not after PSM (Additional file 1: Table S2).
Discussion
We showed the 24-hour intensivist coverage model in our ICU improved the survival of the NT admission patients (Figure 2F, Table 2, and Additional file 1: Table S2) rather than that of the OH admission patients (Figure 2G and H, Table 2 and Additional file 1: Table S2). Hence, the patients in the NT and OH admissions had similar survivals in the intervention group (Figure 2D, Table 2 and Additional file 1: Table S2).
However, in our whole cohort comparison, the intervention did not improve the ICU survival in either the univariate or the multivariate analyses, suggesting that the intervention was not entirely effective. Although several studies have had results similar to ours, 17 –22 the “24-hour intensivist coverage” model has improved patients’ outcomes in other studies. 8,23 Reasons including the acuity or the volume of the ICU 9 may help explain these disparities; we think a main advantage of our study is that we conducted subgroup analyses according to admission times on the clinical effects of the 24-hour intensivist coverage on the patients, unlike the analyses performed by others 17 –20
Comparative effectiveness data from observational databases of propensity matched cohorts can provide an alternative means to balance study groups to minimize bias when randomization is not possible. Our results after PSM indicate that compared to the control with a “10-hour daytime on-site and NT on-call” staffing, our intervention with a 24-hour intensivist on-bed coverage model was effective for improving the NT admission patients’ outcomes.
The fact that the intervention improved the outcome of the NT admission patients rather than that of the OH admission patients may be attributed to the following aspects: the key differentiating factor between the intervention and the control approaches was the personnel responsable for the NT rounds. Intensivists are more effective than residents at providing prompt and proper initial treatments to critically ill patients 24,25 and, therefore, could offer improved management to the NT admission patients.
On the other hand, intensivists in the “10-h daytime on-site and NT on-call” or in the “24-h intensivists on-bed coverage” model handled the initial treatment of the OH admission patients identically. However, the numbers of OH admissions were greater in both the intervention (n = 2676; 88.2%) and the control (n = 2716; 93.9%) groups. As a result, the global clinical effect of the intervention was not significantly different in the global comparison between the control and intervention groups (Figure 2A and B).
We also found more NT admissions in the intervention cohort than in the control cohort after PSM (10.1% [n = 276] vs 6.0% [n = 164], P < .001]. Consequently, the intervention was associated with a lower 28-day mortality (odds ratio [OR] 2.014; 95% confidence interval [CI], 1.355-2.992; P = .001) as compared to that in the control. This also supports the idea that the 24-hour intensivists on-bed coverage was effective for critically ill patients, especially for those admitted during the NT. However, this was different from studies showing that 24-hour intensivists on-bed coverage is not effective. 17,20 Structure-driven factors may explain the differences between studies. For example, the in-hospital NT resident physicians of the control groups were different between those in our study and those in other studies. In our previous work 7 (the control group in the current study), the in-hospital NT residents did not have integrated CCM trainings; while the in-hospital NT resident physicians of the control group from other studies were well trained. 17 Also, in the intervention group, our NT intensivists also participated in the patients’ care during the daytime. Thus, they provided a mature 24-hour coverage model with an integrated, continuous assessment and treatment rather than being present in-house on-call. 17,20 Therefore, our “24-hour intensivist on-bed coverage” was relatively more effective than the other “24-hour intensivists coverages.”
Consideration should also be given to the other outcome measures that can appropriately capture the overall patient benefits. Other studies have found a reduction in the adjusted total hospital cost estimates for the sickest group of patients admitted at night 15 In this study, the intervention ultimately shortened the duration of MV, LOSICU, and/or LOSHOS and reduced the hospital and/or ICU expenses, not only for the NT admission patients (Additional file 1: Table S3) but also for the OH admission patients (Additional file 1: Table S3) and for the whole cohort (Table 1). Taken together, the shorter length of ICU and hospital stays resulted in cost-effective patient care, thereby justifying the presence of the additional staff. 8
This is the first historical control study carried out in a tertiary hospital from a developing country like China. In contrast to western studies, we carried out subgroup analyses according to the admission time to evaluate the actual effect of the 24-hour intensivists on-bed coverage staffing after balancing for confounding factors. However, although we evaluated several outcomes, the presence of NT intensivists may affect other important outcomes such as physician burnout, staff satisfaction, patient and family experiences, and the incidence of malpractice claims, which we did not study. In addition, this was a single-center study, so its results should not be extrapolated to other ICUs before multicenter randomized controlled trial studies have been carried out.
Conclusions
Our study indicates that after implementing the 24-hour intensivist-staffing model, the outcome of NT admission patients improved significantly and that the durations of MV, LOSICU, LOSHOS, and the hospital and/or ICU expenses were reduced. These results complement and expand the existing evidence regarding the efficiency of NT intensivist staffing of ICUs with high-intensity daytime staffing and more NT admission patients.
Supplemental Material
Supplemental Material, Additional_file_1_1-12 - The 24-Hour Intensivists Staffing Model Improves the Outcome for Nighttime Admitted Patients: A Matched Historical Control Study
Supplemental Material, Additional_file_1_1-12 for The 24-Hour Intensivists Staffing Model Improves the Outcome for Nighttime Admitted Patients: A Matched Historical Control Study by Ju Min-Jie, Gu Zhun-Yong, Han Yan, Liu Yu-Jing, He Hong-Yu, Liu Yi-Mei, Tu Guo-Wei, Luo Jian-Feng, Zhu Du-Ming and Luo Zhe in Journal of Intensive Care Medicine
Supplemental Material
Supplemental Material, Additional_file_2_11-4 - The 24-Hour Intensivists Staffing Model Improves the Outcome for Nighttime Admitted Patients: A Matched Historical Control Study
Supplemental Material, Additional_file_2_11-4 for The 24-Hour Intensivists Staffing Model Improves the Outcome for Nighttime Admitted Patients: A Matched Historical Control Study by Ju Min-Jie, Gu Zhun-Yong, Han Yan, Liu Yu-Jing, He Hong-Yu, Liu Yi-Mei, Tu Guo-Wei, Luo Jian-Feng, Zhu Du-Ming and Luo Zhe in Journal of Intensive Care Medicine
Footnotes
Authors’ Note
Ju Min-Jie (JMJ), Gu Zhun-Yong (GZY) and Luo Zhe (LZ) were involved in the study design and manuscript preparation. Ju Min-Jie (JMJ), Han Yan (HY), Liu Yu-Jing (LYJ) and Luo Zhe (LZ) were involved in the data collection and analyses. Ju Min-Jie (JMJ), Liu Yi-Mei (LYM) and Luo Jian-Feng (LJF) were involved in the statistical design. He Hong-Yu (HHY), Tu Guo-Wei (TGW), and Zhu Du-Ming (ZDM) were involved in the manuscript preparation. All authors read and approved the final manuscript. Ju Min-Jie, Gu Zhun-Yong, Han Yan, and Liu Yu-Jing contributed equally to this work. All data generated or analyzed during this study are included in this published article and its online supplemental information files. The Review Board of the Ethics Committee of Zhongshan Hospital, Fudan University approved this study, which we carried out in compliance with the institutional requirements.
Declaration of Conflicting Interests
The author(s) declared no potential conflicts of interest with respect to the research, authorship, and/or publication of this article.
Funding
The author(s) disclosed receipt of the following financial support for the research, authorship, and/or publication of this article: This article was supported by grants from the Youth Foundation of Zhongshan Hospital, Fudan University (2015ZSGL09).
Supplemental Material
Supplemental material for this article is available online.
References
Supplementary Material
Please find the following supplemental material available below.
For Open Access articles published under a Creative Commons License, all supplemental material carries the same license as the article it is associated with.
For non-Open Access articles published, all supplemental material carries a non-exclusive license, and permission requests for re-use of supplemental material or any part of supplemental material shall be sent directly to the copyright owner as specified in the copyright notice associated with the article.