
Abstract
Background:
It has been suggested that COVID-19-associated severe respiratory failure (CARDS) might differ from usual acute respiratory distress syndrome (ARDS) due to failing autoregulation of pulmonary vessels and higher shunt. We sought to investigate pulmonary hemodynamics and ventilation properties in patients with CARDS compared to patients with ARDS of pulmonary origin.
Methods:
This was a retrospective analysis of prospectively collected data from consecutive adults with laboratory-confirmed severe acute respiratory syndrome coronavirus 2 patients treated in our ICU in 04/2020 and a comparison of the data to matched controls with ARDS due to respiratory infections treated in our ICU from 01/2014 to 08/2019 for whom pulmonary artery catheter data were available.
Results:
CARDS patients (n = 10) had ventilation characteristics similar to those of ARDS (n = 10) patients. Nevertheless, mechanical power applied by ventilation was significantly higher in CARDS patients (23.4 ± 8.9 J/min) than in ARDS (15.9 ± 4.3 J/min; P < 0.05). COVID-19 patients had similar pulmonary artery pressure but significantly lower pulmonary vascular resistance, as cardiac output was higher in CARDS vs. ARDS patients (P < 0.05). Shunt fraction and dead space were similar in CARDS compared to ARDS (P > 0.05) and were correlated with hypoxemia in both groups. The arteriovenous pCO2 difference (▵pCO2) was elevated (CARDS 5.5 ± 2.8 mmHg vs. ARDS 4.7 ± 1.1 mmHg; P > 0.05), as was the P(v-a)CO2/C(a-v)O2 ratio (CARDS mean 2.2 ± 1.5 vs. ARDS 1.7 ± 0.8; P > 0.05).
Conclusions:
Respiratory failure in COVID-19 patients seems to differ only slightly from ARDS regarding ventilation characteristics and pulmonary hemodynamics. Our data indicate microcirculatory dysfunction. More data need to be collected to assure these findings and gain more pathophysiological insights into COVID-19 and respiratory failure.
Keywords
Introduction
Severe acute respiratory syndrome-coronavirus 2 (SARS-CoV-2) causes a disease termed COVID-19. Symptoms range from mild upper airway symptoms to acute respiratory distress syndrome (ARDS). There are hints that some characteristics of respiratory failure in COVID-19 patients are different from acute respiratory distress syndrome, as we know it from other causes, e.g. viral or bacterial infection. We and others observed relatively normal respiratory mechanics 1 despite poor oxygenation. It has been suggested that in COVID-19-related ARDS (CARDS), this is in part due to defective pulmonary vasoregulation so that hypoxic pulmonary vasoconstriction does not occur, leading to ventilation/perfusion mismatch and consequently may lead to profound hypoxemia. 2 These findings and hypotheses led to the question of whether our present understanding of ARDS with regard to pulmonary hemodynamics and right heart failure can be transferred to CARDS.
Previous reports suggest that COVID-19 induces the massive release of cytokines, including interleukin 6 (IL-6), and hence, it has been suggested to treat COVID-19 by IL-6 blockade. Increased pulmonary vascular resistance is a consequence of various factors, including hypercarbia, acidosis, inflammation, vascular endothelial proliferation 3 and hypoxic pulmonary vasoconstriction. There is ample evidence that perivascular inflammation triggered by various mediators, including IL-6, contributes to pulmonary vascular disease resulting in pulmonary hypertension. Pulmonary hypertension due to increased pulmonary vascular resistance is a common finding in ARDS. 4,5 The exact prevalence of pulmonary hypertension in ARDS is not known 4,6 and varies considerably across studies. These differences may result from general differences between cohorts, cardiovascular comorbidities, etiology of ARDS and therapeutic interventions (e.g., permissive hypercapnia). ARDS is normally characterized by low-pressure pulmonary edema, shunt-related hypoxemia and reduced aerated lung volume, causing severely impaired lung compliance. It is widely accepted that ARDS patients with elevated pulmonary pressure are at risk of dying from right heart failure. 7
In the present study, we compared CARDS patients to ARDS patients with regard to hemodynamic and derived physiological parameters to elucidate whether there are distinct features in CARDS that separate CARDS and ARDS with regard to ventilation and pulmonary hemodynamics.
Methods
This observational case-control study describes data of extended hemodynamic monitoring via pulmonary artery catheterization of 10 consecutive patients with laboratory-confirmed COVID-19-related respiratory failure (CARDS) treated in our tertiary-care ICU in April 2020. Patients were mainly transferred for the possibility of ECMO support or for further management from hospitals under the surge of COVID-19 in near-by France. Furthermore, we gathered the characteristics of mechanical ventilation, arterial blood gas and laboratory findings in these patients. The characteristics of ventilation and pulmonary hemodynamics were 1:1 compared to patients with ARDS due to pneumonia (n = 10). Groups were matched according to disease severity using the simplified acute physiology score II (SAPS II), PaO2/FiO2 ratio, age, sex and body mass index (BMI).
The data of the ARDS group was collected from an electronic patient recording system. Measurements were part of routine intensive care therapy.
Ventilation was in pressure-controlled mode in all patients. Generally, we targeted a protective ventilation approach, aiming at driving pressures below 15 cmH2O. The mean arterial pressure target is mainly 60-65 mmHg if physiological aims are reached. These include capillary refill time (i.e. warm periphery), urinary output (≥0.5 mL/kg/h) or lactate levels (≤2.0 mmol/L). Norepinephrine was the vasopressor of choice in patients with pH ≥ 7.25. Inotrope use was initiated if ScvO2 was below 65% despite adequate hemoglobin levels. Nutrition in both groups was done according to the same standards.
Measurements and Data Recording
Extended hemodynamic monitoring was established synchronized with collection of blood gas analysis. Briefly, after inserting a sheath catheter, a 6F balloon-tipped Swan-Ganz catheter (Edwards Lifesciences Corp., Irvine, CA, USA) was advanced to the pulmonary artery until a curve characteristic of pulmonary artery occlusion pressure (PAOP) pressure could be derived. Calibration of the hydraulic monitoring system with zero-level at mid-thoracic line was done prior to each measurement. PAOP was measured at end-expiration (preferably at the beginning of QRS in the ECG). Values were averaged over 3 respiratory cycles. For the historical cohort of ARDS patients, no graphs were available to assess pulmonary hemodynamics.
Arterial and venous blood gases with parameters such as partial pressures of oxygen (pO2) and carbon dioxide (pCO2), hemoglobin, lactate, glucose, and pH were obtained via analysis on an ABL800 Blood Gas Analyzer (Radiometer, Copenhagen, Denmark).
The characteristics of ventilation correspond to the moment of data collection. Laboratory parameters have been collected on the same day as pulmonary artery catheterization. Protocols for hemodynamic measurement were identical for both cohorts.
Calculation of Hemodynamic and Physiological Parameters
Cardiac output (CO) was measured in thermodilution technique via the pulmonary arterial catheters. Patients were placed in the same position as during pulmonary pressure measurements. Three different measurements were accepted if there was a stable baseline and a regular curve. Further, the measurements were accepted, if the difference between cardiac output measurements was not greater than 0.5 L/min under stable conditions. In CARDS patients there was no use of positive inotrope substances, in ARDS patients 3 patients received dobutamine. The cardiac index (CI) relates CO to body surface area, calculated according to the Du Bois formula. The following variables were calculated: stroke volume (SV = CO/HR, mL); pulmonary pulse pressure (PP = sPAP-dPAP, mmHg); transpulmonary pressure gradient (TPG = mPAP-PAWP, mmHg); diastolic pressure gradient (DPG = dPAP-PAWP, mmHg); pulmonary vascular resistance (PVR = TPG/CO Wood units: mmHg*min/L, or mmHg*s/mL); pulmonary arterial compliance (CPA = SV/PP, mL/mmHg); and time constant (RC time, τ = CPA × PVR, s).
Furthermore, we calculated the ratio of the venous–arterial CO2 gap to arterial-venous oxygen content difference (P(v-a)CO2/C(a-v)O2) as (PvCO2 − PaCO2)/(CaO2 − CvO2) with CaO2 = (1.34 mL/g × SaO2 × Hb) + (0.003 mL/(dL*mmHg) × PaO2) and CvO2 = (1.34 mL/g × SvO2 × Hb) + (0.003 mL/(dL*mmHg) × PvO2). DO2 was calculated as CO × CaO2 and VO2 as CO × (CaO2 − CvO2). The P(v-a)CO2 gap was calculated as PvCO2 − PaCO2. The calculation of the estimated dead space fraction was performed using a rearranged alveolar gas equation VD/VT = 1 − [(0.86 mmHg × VCO2est)/(VE×PaCO2)], where VCO2est is the estimated CO2 production calculated gender specific from the Harris Benedict equation. 8 Minute ventilation (VE) is obtained from the ventilator rate times expired tidal volume and PaO2 and PaCO2 from arterial gas analysis. The ventilatory ratio (VR), as a measure of ventilator efficiency, was calculated as (VE × PaCO2) divided by (100 mL/min × predicted body weight (PBW; kg) × 40 mmHg (expected PaCO2)). 9 Predicted body weight was calculated according to the ARDSNet PBW calculator. 10 The pulmonary shunt fraction was calculated as QS/QT = (CcO2-CaO2)/(CcO2-CvO2). The alveolar-arterial O2 gradient (A-aDO2) was calculated as [FiO2 × (barometric pressure – 47 mmHg) – PaCO2/0.81] - [(PaO2 + age in years/4*mmHg) + 4]. Barometric pressure was recorded on the day of pulmonary artery catheterization.
Mechanical power applied by ventilation was calculated by multiplying each component of the equation of motion by the minute ventilation using the following equation: mechanical power = 0.098 × tidal volumes × respiratory rate × (Ppeak – 0.5 × driving pressure) in J/min.
Statistical Analysis
Data are reported as median (range) or median (range; mean ± SD), if not otherwise indicated. Statistical analysis was performed with GraphPad Prism 5.02 (GraphPad Software, Inc., La Jolla, CA). An unpaired t-test was used to test for differences between the groups, as all groups showed a Gaussian distribution in the Kolmogorov-Smirnov test. P-values <0.05 were considered significant.
Results
Baseline Demographics and Laboratory Findings
All patients in the CARDS group received mechanical ventilation as a result of SARS-CoV-2 infection with pneumonia and respiratory failure. These patients were matched to a historical cohort of ARDS patients treated in our ICU. The SAPS II score was 42 in the COVID-19 group (n = 10) and 41 in the ARDS group (n = 10). Patients in both groups had mild to severe ARDS, according to the Berlin classification of ARDS. 11 PaO2/FiO2 did not differ between the 2 groups (118 vs. 120 in median; P > 0.05). The median age in CARDS patients was 62 years (range 59-71) compared to 71 in ARDS patients (range 45-85), P > 0.05. Nine out of 10 CARDS and 8 out of 10 ARDS patients were male. Three of 10 COVID-19 patients had obesity I°, 3 had normal BMI and 4 patients had light overweight; however, there was no difference in ARDS patients. There was a statistically significant difference in body temperature during hemodynamic measurement. While ARDS patients had no fever (median 37.4°C), every CARDS patient showed a body temperature above 38.1°C (median 38.5°C).
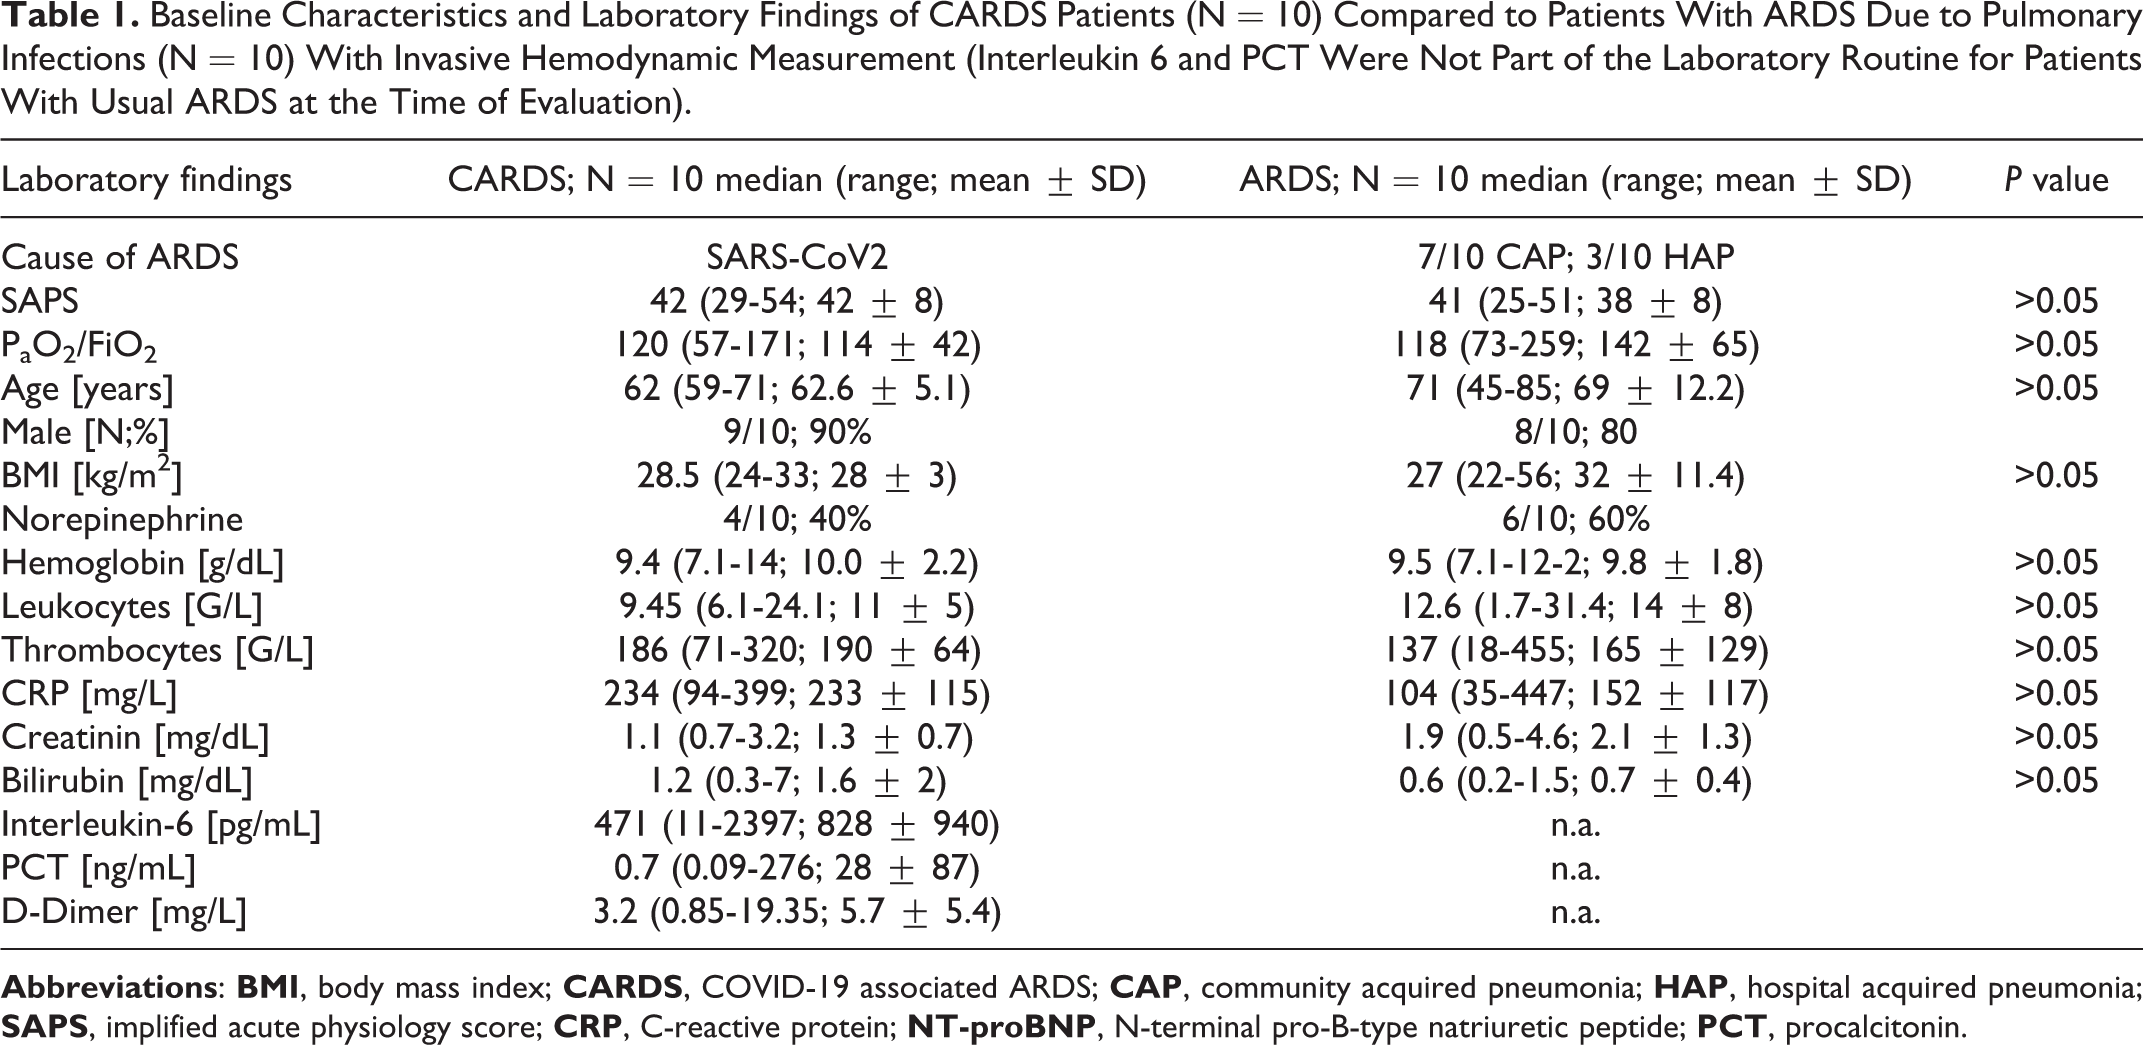
The clinical characteristics and laboratory findings of the patients are shown in Table 1 . In CARDS patients, CRP and interleukin-6 were elevated. The median procalcitonin level was 0.69 ng/mL (0.09-276 ng/mL). CRP in ARDS patients was slightly lower than in CARDS patients (104 vs. 234, P > 0.05). In CARDS, D-dimer levels were elevated at 3.2 mg/L (range 0.9-19.4 mg/L). Thrombocyte levels were in the normal range. Renal function (creatinine 1.13 mg/dL) and liver function (bilirubin 1.15 mg/dL) were slightly decreased in both groups.
Baseline Characteristics and Laboratory Findings of CARDS Patients (N = 10) Compared to Patients With ARDS Due to Pulmonary Infections (N = 10) With Invasive Hemodynamic Measurement (Interleukin 6 and PCT Were Not Part of the Laboratory Routine for Patients With Usual ARDS at the Time of Evaluation).
Characteristics of Ventilation and Blood Gas Analysis in COVID-19 and Comparison to ARDS Patients
All patients received ventilation in a pressure-controlled mode. The plateau pressure was 25 cmH2O (range 20-32) in CARDS and 23 cmH2O (range 20-28) in ARDS patients. PEEP and ΔP did not differ significantly between the 2 groups (CARDS PEEP: 10 cmH2O; ΔP 14 cmH2O vs. ARDS PEEP 12 cmH2O; ΔP 18 cmH2O; P > 0.05). Tidal volumes resulting from these pressure characteristics were 9 mL/kg in CARDS vs. 8 mL/kg in ARDS. None of the CARDS patients had tidal volumes less than 400 mL (median 613 mL; range 415 – 994 mL). Higher tidal volume in CARDS patients was a result of better dynamic compliance in these patients. Dynamic lung compliance was 42 mL/cmH2O (range 27-77 mL/cmH2O) in CARDS patients compared to 37 mL/cmH2O (range 23-67 mL/cmH2O) in ARDS patients (P > 0.05). Only in 4 COVID-19 patients dynamic lung compliance was less than 40 mL/cmH2O. Fifty percent of the patients needed a PEEP equal to or higher than 10 cmH2O to maintain adequate oxygenation. Gas exchange was different between groups CARDS and ARDS, with higher PaCO2 in the CARDS group (52 mmHg vs. 41 mmHg; P > 0.05), causing mild respiratory acidosis in CARDS (pH 7.33 vs. 7.46; P < 0.05) despite higher minute ventilation volume. The mechanical power applied by ventilation in CARDS patients was significantly higher than that in ARDS patients (P < 0.05). Table 2 shows the characteristics of ventilation in CARDS patients compared to patients with usual ARDS.
Mechanical Ventilation Characteristics of CARDS Patients (n = 10) Compared to Mechanical Ventilation Characteristics of Patients With ARDS (n =10).a
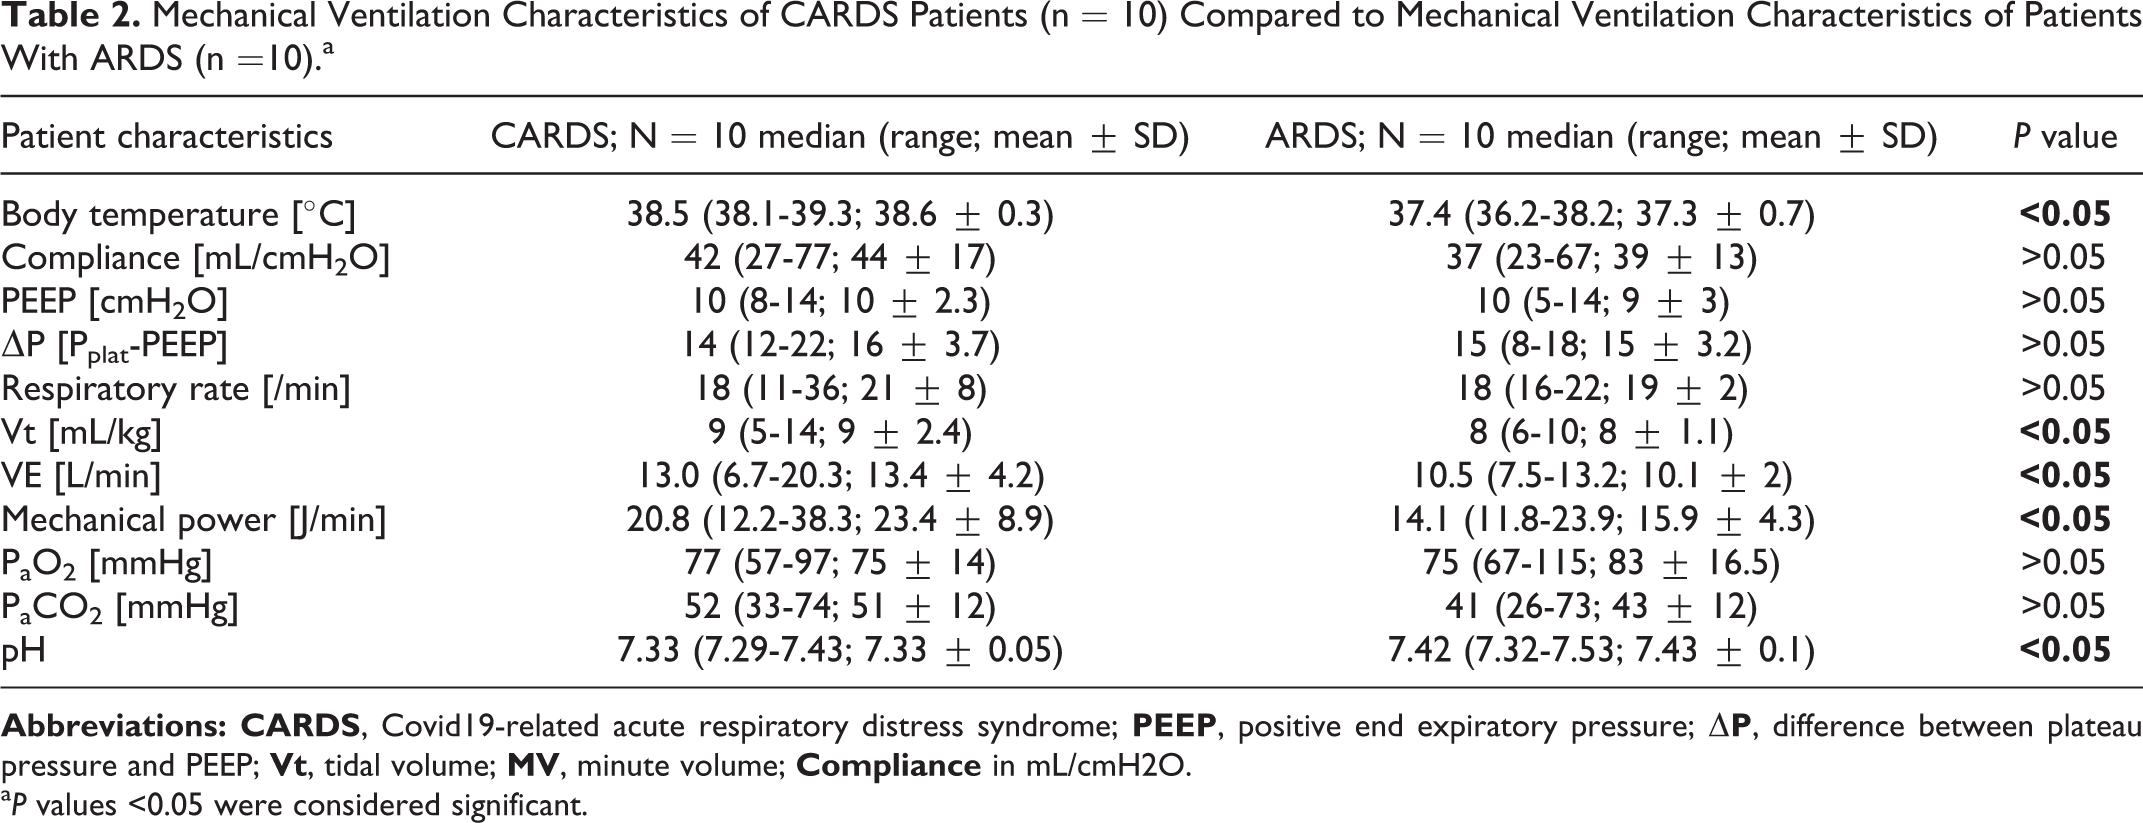
a P values <0.05 were considered significant.
Hemodynamic Monitoring in CARDS Vs. ARDS Patients
We compared pulmonary hemodynamics as assessed by pulmonary artery catheters in CARDS compared to ARDS patients ( Table 3 ). The median time between the diagnosis of respiratory failure and PAC insertion was 13 days in CARDS patients. ARDS patients received PAC insertion a median of 7 days from diagnosis. The time between intubation and PAC was 11 days (1 – 21 days) in CARDS patients and 3 (0-9 days) in ARDS patients (P < 0.05). This delay was mainly because most CARDS patients were diagnosed with respiratory failure, intubated, and transferred to our ICU from other hospitals.
Invasive Hemodynamics Acquired by Pulmonary Artery Catheterization of CARDS Patients (N = 10) Compared to ARDS of Other Causes. (N = 10) Differences in Time From Intubation to PAC Is Due to the Fact That Most Patients With CARDS Were Referred to Our Center.a
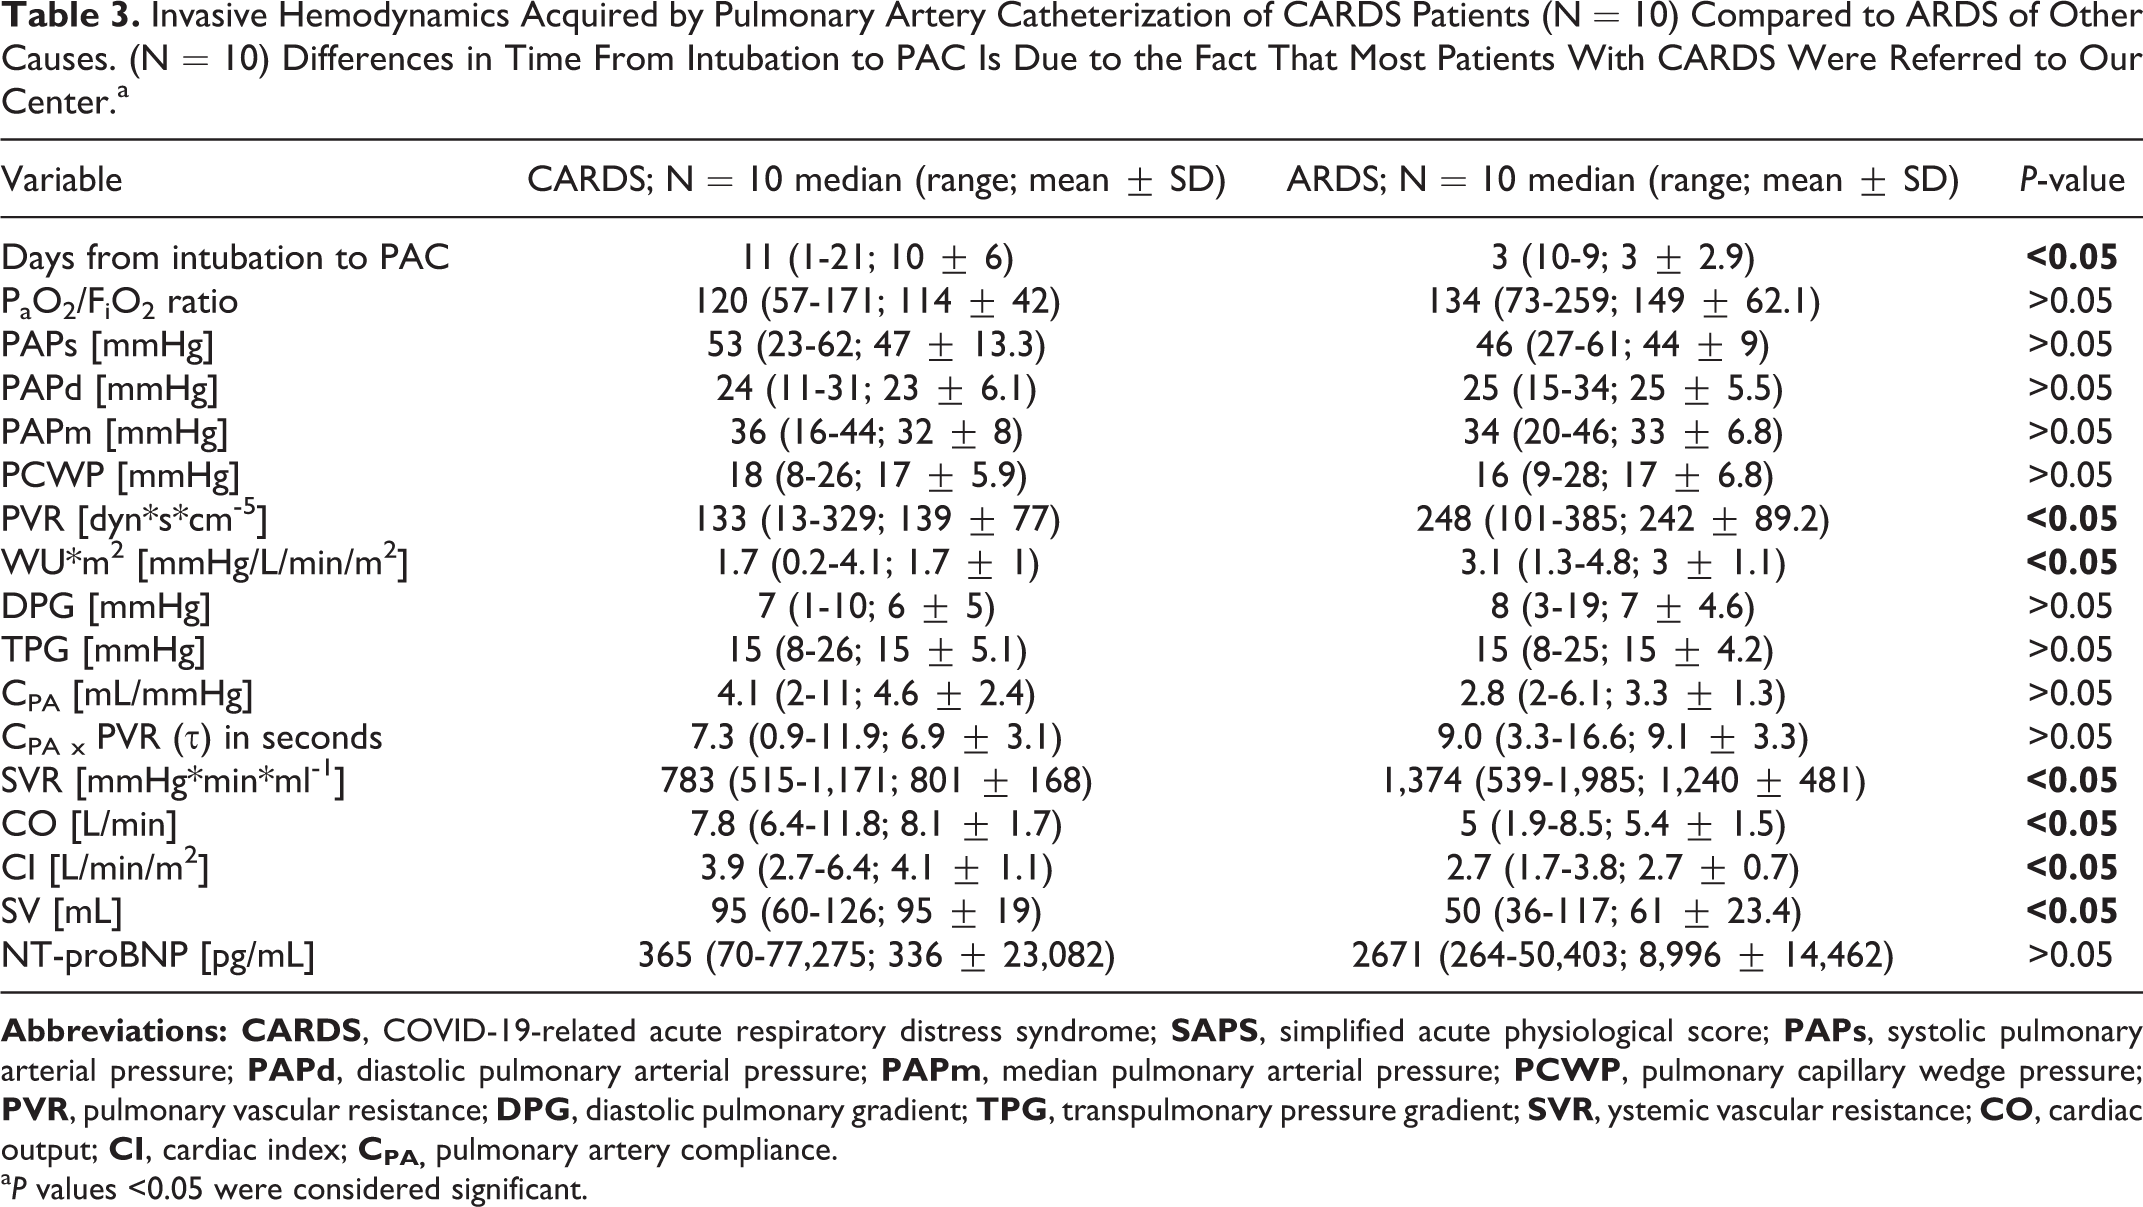
a P values <0.05 were considered significant.
Pulmonary arterial hypertension was common in both CARDS and ARDS patients. Nine out of 10 CARDS and ARDS patients had elevated mPAP values above 25 mmHg. Systolic and diastolic pulmonary arterial pressure did not differ between groups (P > 0.05). Both groups had partial post-capillary pulmonary hypertension with pulmonary artery occlusion pressures (PAOP) higher than 15 mmHg. ARDS patients had combined pre- and post-capillary pulmonary hypertension (PVR > 3 WU, DPG ≥ 7), while CARDS patients showed more isolated post-capillary pulmonary hypertension (median PVR ≤ 3 WU, median DPG = 7 mmHg). Only one patient in the CARDS group showed DPG ≥ 7 mmHg and PVR > 3 WU meeting the criteria of pre- and post-capillary pulmonary hypertension. 12 PEEP was not correlated with PVR in either group (P > 0.05). The pulmonary vascular compliance CPA as part of right ventricular afterload showed no significant difference, being 4.1 mL×mmHg-1 in CARDS patients vs. 2.8 mL × mmHg-1 in ARDS patients. There was a negative correlation between PVR and CPA. The product of PVR × CPA was thus similar between groups (P > 0.05); however, the higher CPA in CARDS patients indicated sufficient RV-PA coupling. Indeed, no CARDS patient had right heart failure.
In both groups, cardiac output was in a normal range. Patients with CARDS had significantly higher cardiac output (P < 0.05) and slightly higher stroke volume (P > 0.05) than ARDS patients. Systemic vascular resistance (SVR) was significantly higher in patients with ARDS than in patients with CARDS (P < 0.05). No CARDS patient received inotropes. In the CARDS group, 4 patients received norepinephrine during measurement, and in the ARDS group, 6 patients received norepinephrine during measurement.
Physiological Parameters Derived From Pulmonary Artery Catheter Measurements and Blood Gas Analysis in Patients With CARDS and ARDS
As patients with CARDS presented with elevated paCO2, we calculated the estimated CO2 production for both groups (VCO2est.). Indeed, patients with CARDS had a statistically significantly higher estimated CO2 production. Hence, the statistically significant higher minute ventilation noted in CARDS patients could not compensate for the higher production. The ventilatory ratio (VR) was higher in patients with CARDS, but the difference did not reach statistical significance. The same was true for physiological dead space (VD/VT). VD/VT was strongly correlated with VR in patients with CARDS (P < 0.05; Figure 1A ) but not in patients with ARDS. In CARDS patients, there was a negative correlation between PaO2/FiO2 and ventilatory ratio (P < 0.05; Figure 1 B ). The calculated shunt fraction was not different between groups.
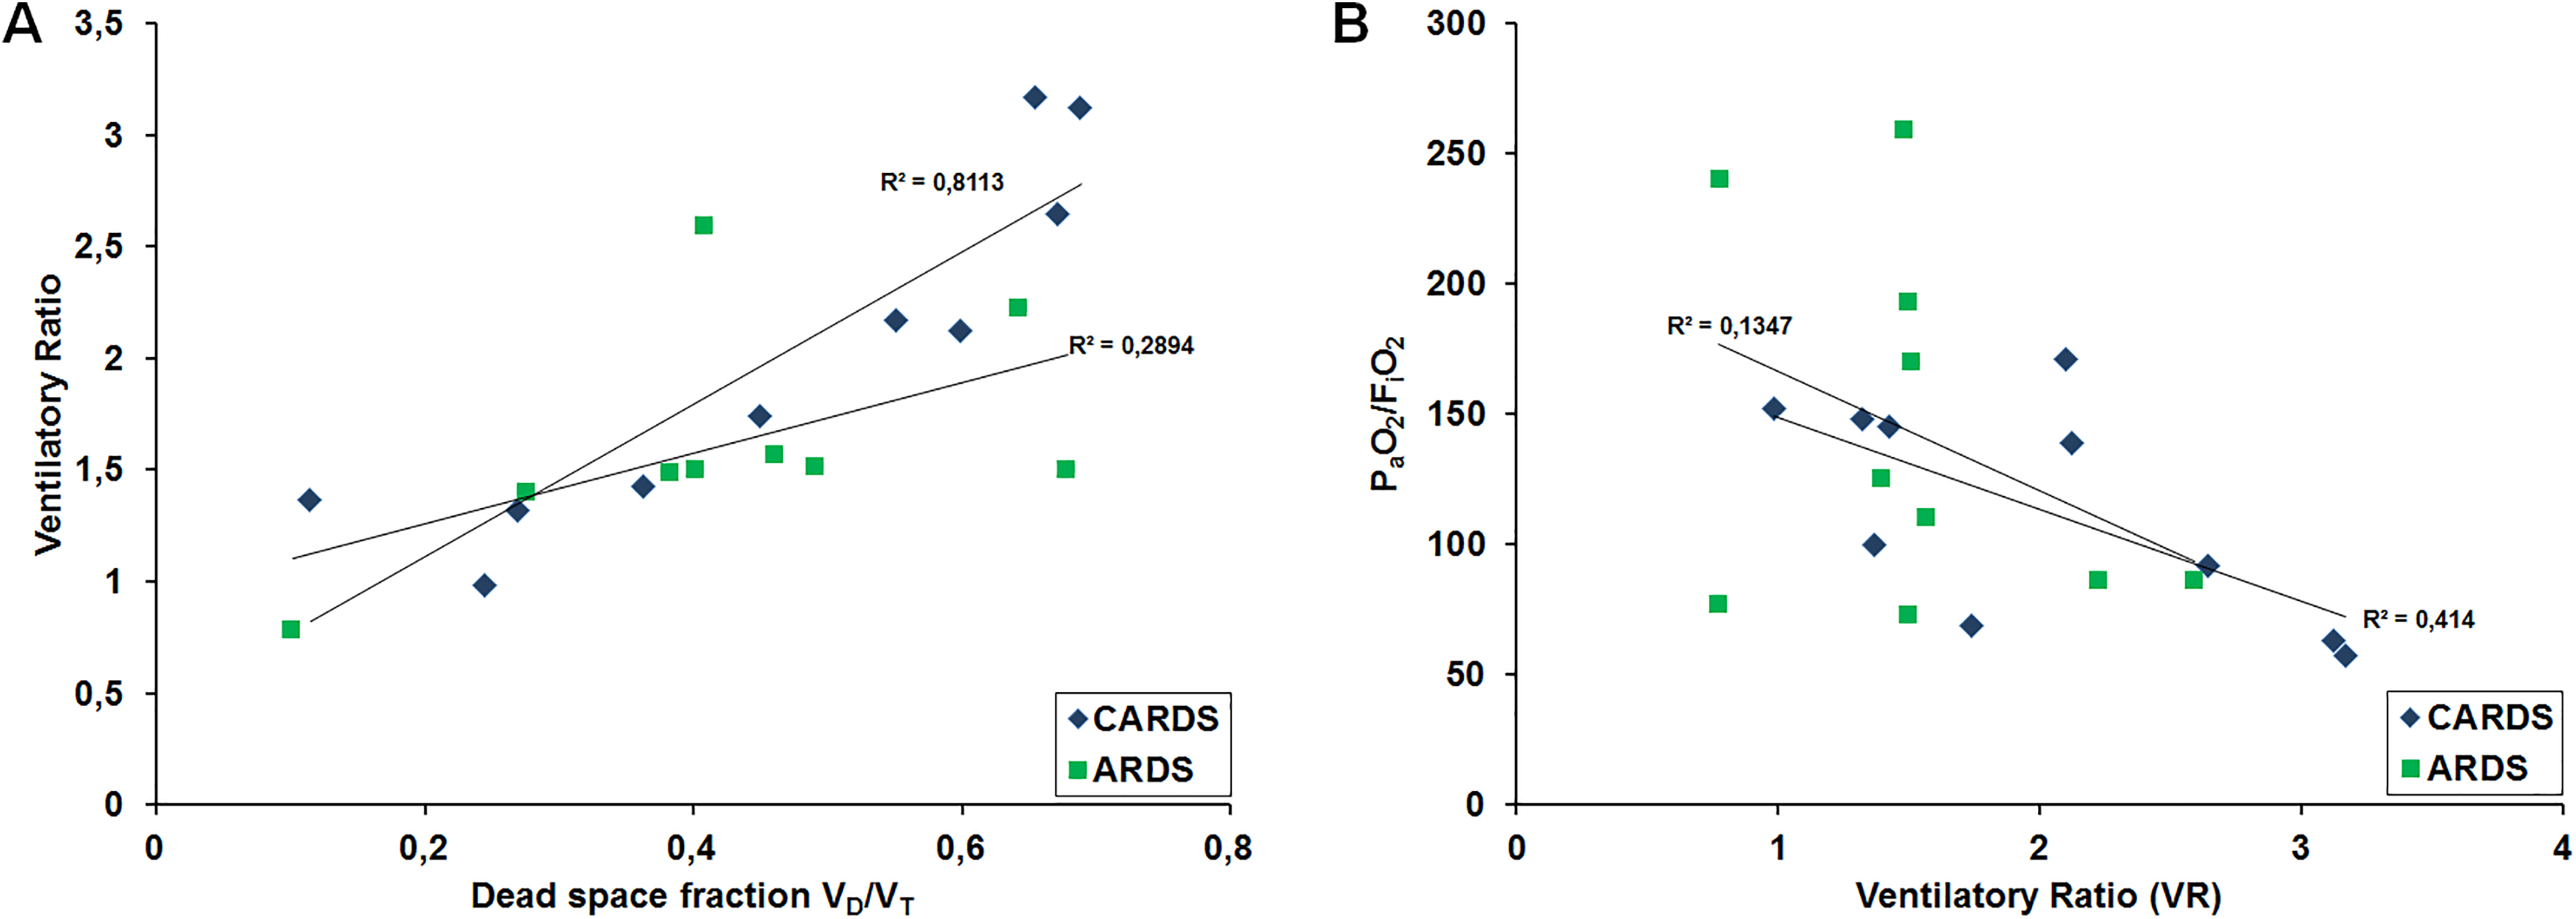
(A) Correlation between ventilatory ratio (VR) and dead space fraction (VD/VT). There was a statistically significant association between VR and VD/VT in CARDS patients (P < 0.05). (B) Correlation between PaO2/FiO2 ratio and VR.
The ratio of the venous–arterial CO2 gap to arterial-venous oxygen content difference (P(v-a)CO2/C(a-v)O2 ratio) was not different between groups; however, patients with CARDS had a higher ratio than patients with ARDS (2.0 vs. 1.6). Additionally, the difference between central-venous and arterial CO2 (▵pCO2) was different between groups, with a higher difference in CARDS patients (6.2 vs. 4.7 mmHg), but this difference did not reach statistical significance. Lactate levels, mixed venous oxygenation and alveolar-arterial oxygen difference (AaDO2) were similar in both groups. The parameters are summarized in Table 4 .
Physiological Parameters Derived From Measurements in CARDS Patients (N = 10) and ARDS of Other Causes (N = 10) Acquired Swan-Ganz Catheterization and Blood Gas Analysis. Barometric Pressure Was Recorded on the Day of the Actual Swan-Ganz Catheterization.a
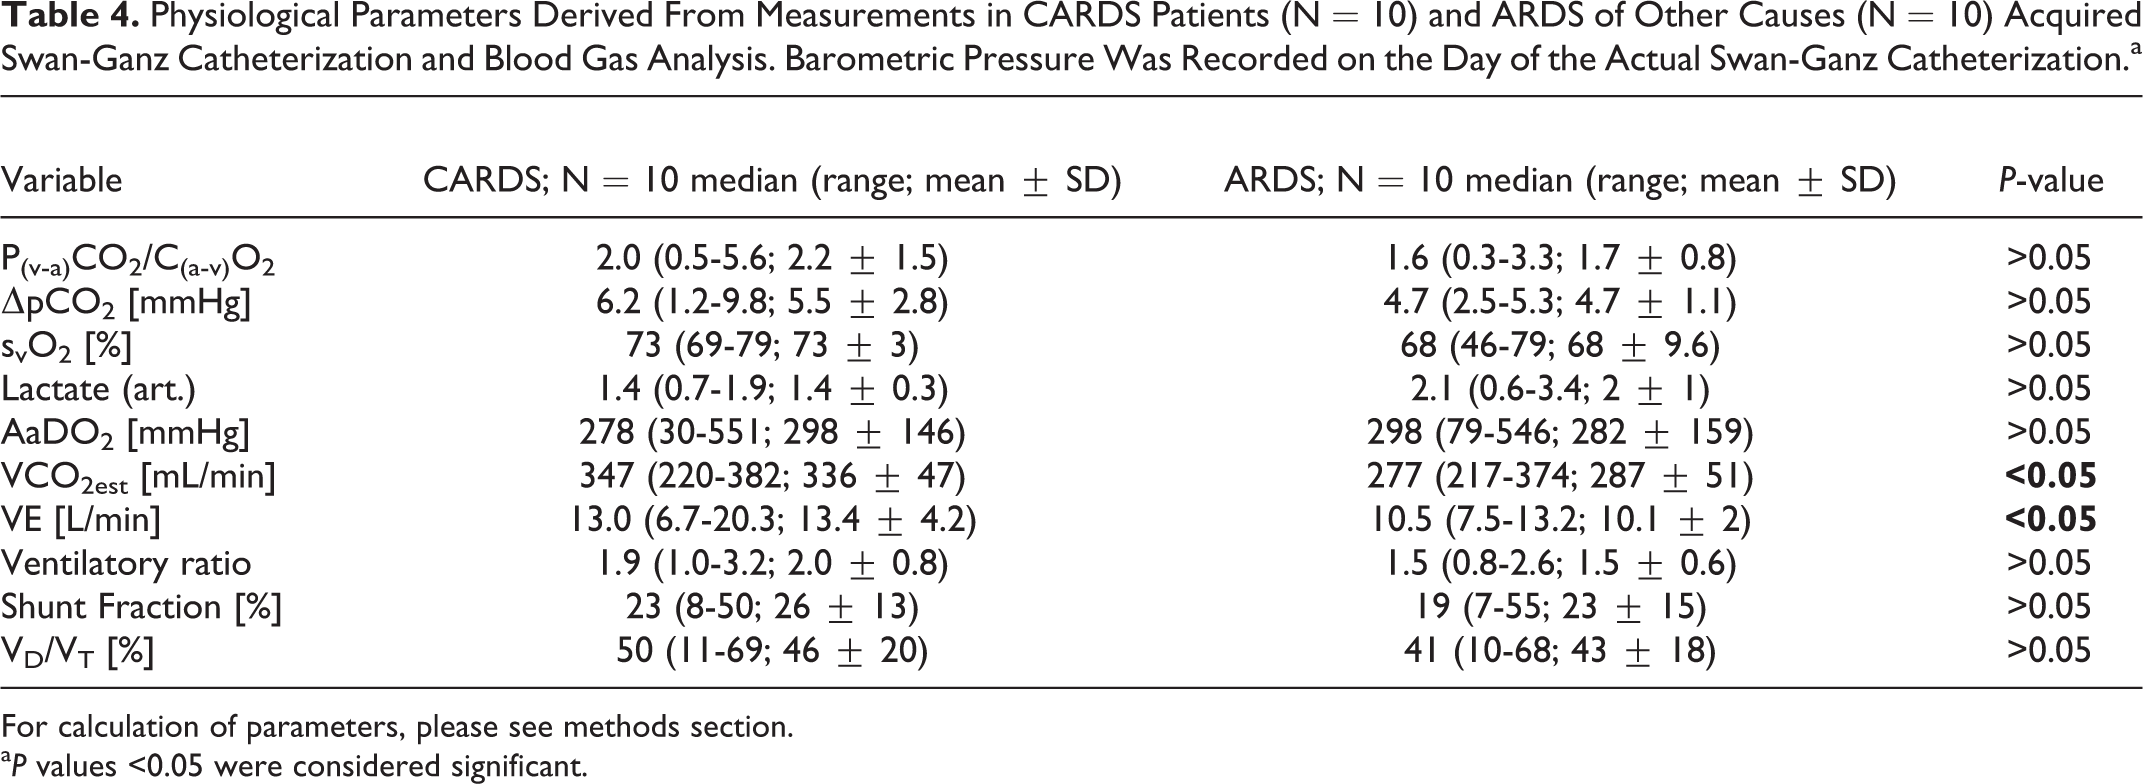
For calculation of parameters, please see methods section.
a P values <0.05 were considered significant.
Discussion
The present study compared patients with CARDS to patients with ARDS. The main findings of our study are as follows: (i) pulmonary hemodynamics are not profoundly altered in CARDS compared to usual ARDS, (ii) autoregulation of lung vessels seems to be largely intact in patients with SARS-CoV2-related lung failure, and (iii) mechanical ventilation intensity was significantly higher in CARDS compared to usual ARDS.
Usual ARDS is defined by decreased diffusion capacity and ventilation deficit as a consequence of inflammation and low compliance, 7 resulting in a “baby lung.” In addition, there is often pulmonary hypertension due to increased vascular resistance with the risk of consecutive right heart failure. 4 In COVID-19 patients admitted to our ICU, we could not completely confirm these pathophysiological findings.
Further paCO2 in COVID-19 patients was rather similar compared to patients with ARDS at 52 mmHg and 41 mmHg, respectively. Our data show that all COVID-19 patients had tidal volumes and compliance resulting in minute ventilation of 6 L/min to 20 L/min. These findings might not be typical for patients with ARDS. In these patients, tidal volume is low because lung compliance is decreased. 13 As CO2 has a higher diffusion coefficient than O2, hypercapnia is normally a problem of ventilation rather than diffusion. 14 In usual ARDS, hypercapnia can be explained by low tidal volume and the subsequent lack of alveolar ventilation. However, in CARDS patients, minute ventilation was not decreased. Our group of CARDS patients had significantly higher tidal volume and higher dynamic compliance than ARDS patients. Matching these 2 groups by PaO2 and oxygenation index, these parameters were quite similar in both groups. The question that arises is the pathophysiology behind hypercapnia despite high minute ventilation and preserved compliance. V/Q mismatch could be an explanation for the ineffective gas exchange in CARDS patients. Additionally, non-effective regulation of hypoxic vasoconstriction 10 could be another reason why blood volume passes non-ventilated areas in the lungs and is not able to participate in gas exchange. However, we could not find differences between CARDS and ARDS with regard to calculated physiological dead space and shunt fraction. The calculated dead space in CARDS and ARDS patients was in the range expected according to the PaO2/FiO2 ratio. 15 However, we found a significant difference in the estimated CO2 production, which might explain at least some of the CARDS features. Indeed, the intensity of ventilation was significantly higher in CARDS patients than ARDS patients. Nevertheless, the intensity in CARDS patients was not surprisingly high and comparable to previously reported data in patients with ARDS. 16
In ARDS patients, there is often pulmonary hypertension as a consequence of hypoxia or hypercapnia. Furthermore, there is a higher rate of right heart failure and lower cardiac output in ARDS patients because of a higher right ventricular afterload. 17,18 In CARDS patients, we did not observe signs of right heart failure or decreased cardiac output. The cardiac output in CARDS patients was 7.8 L/min in median compared to 6.1 L/min in ARDS patients (cardiac index 3.9 L/min/m2 vs. 3.1 L/min/m2). Pulmonary vascular resistance was significantly lower in CARDS patients than in ARDS patients (133 dyn × sec × cm-5 in COVID-19 vs. 248 dyn × sec × cm-5 in ARDS patients). One reason for increased PVR is higher PEEP. It has been shown previously that increasing PEEP increases PVR in mechanically ventilated patients. 19 In our study, PEEP was similar in both groups, PAOP did not differ, and there was no correlation between PEEP and PVR. The difference in PVR may thus simply result from increased cardiac output of CARDS patients. CARDS patients probably had an increased cardiac output in comparison to ARDS patients due to inflammation and low systemic vascular resistance.
Mean pulmonary arterial pressure was similar in COVID-19 patients and in patients with ARDS; nevertheless, both groups showed pulmonary arterial hypertension to some degree. Both groups had postcapillary forms of pulmonary hypertension with PAOP > 15 mmHg, but the median diastolic pressure gradient was 7 mmHg in CARDS patients vs. 8 mmHg in ARDS patients. With a DPG less than 7 mmHg, there is no precapillary component in pulmonary hypertension according to the actual guidelines. 12 In our study, the median DPG was 7 mmHg, and PVR was 1.7 WU × m2 (vs. DPG 8 mmHg, PVR 3.1 WU × m2 in ARDS), meaning that pulmonary arterial hypertension in CARDS might be more a result of a postcapillary than a precapillary component. The transpulmonary gradient (TPG) that may be useful to differentiate between pulmonary hypertension as result of passive or reactive mechanisms did not differ between the 2 groups. In both groups the TPG was 15 mmHg, indicating a reactive component of pulmonary hypertension. Hence, there was only a slight difference, and a defect in pulmonary vascular regulation in the presence of hypoxemia and hypercapnia unable to avoid a pathologically high right-left shunt 20 can be ruled out. We did not calculate an unexpectedly high shunt in CARDS patients. Rather, elevated CO2 production might explain differences between CARDS and ARDS. Patients presented with prolonged fever and unexpected long periods of elevated inflammatory parameters, both of which might contribute to increased VCO2.
Early recommendations for COVID-19 patients with respiratory failure consisted of early invasive ventilation strategies to avoid contagious aerosols and the use of a high PEEP analogue to usual ARDS. 21 These therapies may be most effective in patients with lower diffusion capacity and compliance, but the benefit in ventilation/perfusion mismatch needs to be questioned. These recommendations may be effective in ARDS patients; however, in CARDS patients, an important factor according to our data might be to limit excessive CO2 production, e.g. by rigorous temperature control.
Moreover, veno-venous extracorporeal life support (vvECMO) should be considered to treat these patients. Six patients in the CARDS group received vvECMO therapy later because of increasing hypercapnia and pH < 7.1 at exhausted mechanical ventilation.
Limitations
Our study has several limitations that need to be considered. First, the sample size of this analysis is relatively small. However, PAC is only used in special situations in ARDS patients in clinical practice, rendering sample sizes small. Differences between groups in important values might be more pronounced if the sample size was larger. A critical parameter such as P(v-a)CO2/C(a-v)O2 might in fact reach statistical significance in larger samples. The fact that SARS-CoV-2 is still causing a global pandemic could be a favor in recruiting more patients. Further, some of the physiological parameters are derived from calculations and e.g. calculation of CO2 using Harris-Benedict formula is critical, since predicted VCO2 has a large variation.
Second, the comparator group for pulmonary hemodynamics could be more consistent and homogeneous. We compared the hemodynamics of COVID-19 patients with ARDS that was not exclusively due to viral infection. However, hypoxic pulmonary vasoconstriction has been expected to work independently of a causative organism in the past.
Third, the time of PAC insertion in CARDS patients was distinctly later than in ARDS patients, and the measurement was only at one point in time. This was mainly because as a tertiary care center, we received patients with COVID-19 at the beginning of the pandemia from other hospitals where patients had already been treated for several days in ICUs. It seems that COVID-19 has different phenotypes according to the time of evaluation, being less usual at the beginning and adopting a more usual phenotype after days of mechanical ventilation. Interestingly, despite the differences in time, we could not detect relevant differences between groups. It is possible that the pathophysiology of COVID-19 is simply prolonged compared to that of other respiratory diseases.
Conclusion
Our data do not support the assumption that CARDS (at a later stage) leads to changes in pulmonary vasculature distinct from ARDS due to pulmonary infections. The mechanical power applied to the lungs of CARDS patients by ventilation was significantly higher than that in ARDS patients. The data presented here could be useful to guide CARDS therapy, as we assume that the results also apply for other cohorts of patients with severe SARS-CoV2 infection. Further investigations are needed to elucidate the mechanisms behind SARS-CoV2-induced pulmonary pathology.
Footnotes
Authors’ Note
Members of the PACovid Study Group: Albert Omlor, MD (Department of Internal Medicine V—Pneumology, Allergology and Critical Care Medicine, University Hospital of Saarland and Saarland University, Homburg/Saar, Germany; Interdisciplinary COVID-19-Center, University Hospital of Saarland, Saarland University, Homburg/Saar, Germany), Sebastian Mang, MD (Department of Internal Medicine V—Pneumology, Allergology and Critical Care Medicine, University Hospital of Saarland and Saarland University, Homburg/Saar, Germany; Interdisciplinary COVID-19-Center, University Hospital of Saarland, Saarland University, Homburg/Saar, Germany), Christophe Jentgen, MD (Department of Internal Medicine V—Pneumology, Allergology and Critical Care Medicine, University Hospital of Saarland and Saarland University, Homburg/Saar, Germany; Interdisciplinary COVID-19-Center, University Hospital of Saarland, Saarland University, Homburg/Saar, Germany), Holger Wehrfritz, MD (Department of Internal Medicine V—Pneumology, Allergology and Critical Care Medicine, University Hospital of Saarland and Saarland University, Homburg/Saar, Germany; Interdisciplinary COVID-19-Center, University Hospital of Saarland, Saarland University, Homburg/Saar, Germany), Thilo Mertke, MD (Interdisciplinary COVID-19-Center, University Hospital of Saarland, Saarland University, Homburg/Saar, Germany; Department of Anaesthesiology, Critical Care Medicine and Pain Medicine, University Hospital of Saarland and Saarland University, Homburg/Saar, Germany), Heinrike Wilkens, MD (Department of Internal Medicine V—Pneumology, Allergology and Critical Care Medicine, University Hospital of Saarland and Saarland University, Homburg/Saar, Germany; Interdisciplinary COVID-19-Center, University Hospital of Saarland, Saarland University, Homburg/Saar, Germany).
Author Contributions
André Becker, Frederik Seiler, Guy Danziger, Sebastian Mang, Maren Kamphorst, Thilo Mertke, and Philipp M. Lepper contributed to the collection, review, and/or analysis of the data; André Becker and Philipp M. Lepper drafted the manuscript, Ralf M. Muellenbach, Christopher Lotz, the members of the PACovid Study Group and Robert Bals revised the manuscript for important intellectual content. All authors have seen and approved the final version of the manuscript. Philipp M. Lepper is the guarantor of the manuscript.
Availability of Data and Materials
Data can be provided on request addressed to the corresponding author. All data sharing statements are subject to conformity with German data protection legislation and rules (Datenschutzgrundverordnung—DGSVO).
Ethics Approval and Consent to Participate
Informed consent for pulmonary artery catheterization as part of standard intensive care was obtained by the patient or legal representative. The institutional review board (Ärztekammer des Saarlandes) registered the study to use a PAC in patients with ARDS, irrespective of the infectious agent, in 2019 under the number 278/19. Informed consent for the analysis of data is waived by the institutional review board due to the anonymous and retrospective analysis of data.
Declaration of Conflicting Interests
The author(s) declared no potential conflicts of interest with respect to the research, authorship, and/or publication of this article: All other authors have no conflicts of interest to declare.
Funding
The author(s) disclosed receipt of the following financial support for the research, authorship, and/or publication of this article: COVID-19 research at the University Hospital of Saarland is funded by unrestricted grants of the Federal State of Saarland, Saarland University and Dr Rolf M. Schwiete Foundation. The funders had no role with regard to this study in the design of the study and collection, analysis, and interpretation of data or in writing the manuscript. Robert Bals received funding from AstraZeneca, Boehringer Ingelheim, GlaxoSmithKline, Grifols, Novartis, CSL Behring, German Federal Ministry of Education and Research (BMBF) Competence Network, Sander Stiftung, Dr Rolf M. Schwiete Foundation, German Cancer help (Krebshilfe) and Mukoviszidose e.V.