






Abstract
Objectives
Dysglycemia is associated with poor outcomes in critically ill patients,which is uncertain in patients with diabetes regarding to the situation of glucose control before hospitalization. This study was aimed to investigate the effect of the difference between the level of blood glucose during ICU stay and before admission to ICU upon the outcomes of critically ill patients with diabetes.
Method
Patients with diabetes expected to stay for more than 24hs were enrolled, HbA1c was converted to A1C-derived average glucose (ADAG) by the equation: ADAG = [ (HbA1c * 28.7) – 46.7 ] * 18−1, blood glucose were measured four times a day during the first 7 days after admission, the mean glucose level(MGL) and SOFA (within 3, 5, and 7days) were calculated for each person, GAPadm and GAPmean was calculated as admission blood glucose and MGL minus ADAG, the incidence of moderate hypoglycemia(MH), severe hypoglycemia (SH), total dosage of glucocorticoids and average daily dosage of insulin, duration of renal replacement therapy(RRT), ventilator-free hours, and non-ICU days were also collected. Patients were divided into survival group and nonsurvival group according to survival or not at 28-day, the relationship between GAP and mortality were analyzed.
Results
431 patients were divided into survival group and nonsurvival group. The two groups had a comparable level of HbA1c, the nonsurvivors had greater APACHE II, SOFA, GAPadm, GAPmean-3, GAPmean-5, GAPmean-7 and higher MH and SH incidences. Less duration of ventilator-free, non-ICU stay and longer duration of RRT were recorded in the nonsurvival group. GAPmean-5 had the greatest predictive power with an AUC of 0.807(95%CI: 0.762-0.851), the cut-off value was 3.6 mmol/L (sensitivity 77.7% and specificity 76.6%). The AUC was increased to 0.852(95%CI: 0.814-0.889) incorporated with SOFA5 (NRI = 11.34%).
Conclusion
Glycemic GAP between the MGL within 5 days and ADAG was independently associated with 28-day mortality of critically ill patients with diabetes. The predictive power was optimized with addition of SOFA5.
Keywords
Summary box
It is convinced that dysglycemia including hyperglycemia and hypoglycemia are risk factors for adverse outcomes of the critically ill patients. Also, the variability of blood glucose imposes much more harmful effects upon the outcomes than both hyperglycemia and hypoglycemia. Nevertheless, the assertion was confirmed in the non-DM cohort but not in the DM. Some believe that inappropriate insulin therapy may increases the risk of hypoglycemia in patients with chronic pre-morbid hyperglycemia, which results in worse outcome and higher mortality, so the treatment for hyperglycemia should be implemented prudently in patients with or without DM.
The blood glucose control condition before the onset of acute critical ill is deemed as the key factor for determining the target of blood glucose in in the ICU. Study measuring glycosylated hemoglobin (HbA1c) as a marker of premorbid glycaemia in the 3 months prior to ICU admission, the glycemic gap-difference between admission blood glucose and A1C-derived average glucose (ADAG) levels can predict ICU mortality in patients diagnosed diabetes. However, we found the top level of blood glucose occurred within first 7 days mostly in preliminary experiment, which means the level of admission blood glucose could not reflect severity and variation of the diseases veritbly and timely.
Our research is in order to identify whether GAPmean (glycemic gap mean) defined as difference which is between the mean blood glucose level within the first 7 days after admission to ICU and ADAG is independently associated with mortality of critically ill patients with diabetes and to evaluate the predictive power on mortality comparing with GAPadm (glycemic gap-admission, the difference between admission blood glucose and ADAG) and whether the predictive power will be improved by incoporating APACHE II or SOFA into GAP. We believe that the conclusion is benificial for optimizing the strategy of blood glucose control in the ICU.
Introduction
Metabolism disturbance of glucose is pervasive in critically ill patients, hyperglycemia and hypoglycemia are proved to be risk factors for adverse outcomes in populations of acutely ill patients.1,2 Then we have got the consensus that glycemic fluctuation imposes much more harmful effects upon the outcomes than both hyperglycemia and hypoglycemia,3,4 so as the variability of blood glucose. 5 Nevertheless, this seemingly unquestionable assertion had been doubted in some studies, 6 it was more commonly proven in the non-DM cohort but not in the DM. 7 Paul E Marik suggests that hyperglycemia and insulin resistance in the setting of acute illnesses is an evolutionarily preserved adaptive responsiveness to the disorder, which was believed to be a beneficial host response that enhances the host's chances of survival.8,9 Meanwhile, chronic pre-morbid hyperglycemia increases the risk of hypoglycemia and modifies the association between acute hypoglycemia and mortality. 10
Acute hyperglycemia in patients with diabetes could result from acute physiological stress, high baseline blood glucose, or both, which make analysis difficult, even misled. In a retrospective observational study measuring glycosylated hemoglobin (HbA1c) as a marker of premorbid glycaemia in the 3 months prior to intensive care unit (ICU) admission, the authors believed that acute hyperglycemia was associated with a reduction rather than an increase in mortality in patients with “insufficiently controlled” diabetes. 11 Furthermore, the glycemic gap difference between admission blood glucose and A1C-derived average glucose (ADAG) levels has been used to evaluate the disease severity and predict the prognosis to explore the relationship between stress-induced hyperglycemia (SIH) and mortality in critically ill patients with diabetes. It is confirmed that glycemic gap, which is calculated by subtracting the ADAG from the admission blood glucose levels, can depress the impact of chronic hyperglycemia on the disease severity assessment in patients with diabetes to some extent, the elevated glycemic gap can optimally improve the value of the assessment consequently. 12
However, we found the top level of blood glucose occurred within the first 7 days mostly in the preliminary experiment, which means the level of admission blood glucose could not reflect the severity of SIH. The objective of the present research is to identify whether GAPmean (glycemic gap mean) defined as the difference which is between the mean blood glucose level within the first 7 days after admission to ICU and ADAG is independently associated with mortality of critically ill patients with diabetes and to evaluate the predictive power on mortality comparing with GAPadm (glycemic gap-admission, the difference between admission blood glucose and ADAG) and whether the predictive power will be improved by incoporating APACHE II or SOFA into GAP.
Materials and Methods
Study Design and Setting
We conducted a retrospective observational cohort study of consecutive patients with type 2 diabetes admitted to the general ICU between June 1, 2016, and May 31,2019. Our department is a 24-bed general ICU in Beijing. A mixed population of adult medical and surgical patients. The institutional review Board for Human Investigation approved this study and waived the need for informed consent. The protocol was elaborately formulated by the director, elaborately performed by all staffs, and closely supervised by a group of intensivists who were charged with this study.
Cohort and Data Collection
Adult patients admitted to our ICU during the 3-year period of the study, of those with a diagnosis of type 2 diabetes (in accordance with the 1999 WHO diagnostic criteria for diabetes) estimated to stay over 24 hours without oral feeding were enrolled regardless of whether insulin or oral antidiabetic agents were prescribed previously. Patients were excluded based on the following criteria: 1) an admission diagnosis of diabetic ketoacidosis or hyperosmolar hyperglycemic state, 2) treatment with corticosteroids within 3 months before admission to ICU, 3) admitted to ICU within 3 months before admission, 4) patients or their representatives refused to participate in the study or signed informed consent of withdrawing life-sustaining treatment within 28 days after the admission, 5)the level of HbA1c was not obtained and number of blood glucose value obtained was no more than 3 during the period of study.
The medical records of enrolled patients were reviewed for the following data: age, sex, body mass index(BMI), whether they received regular insulin therapy before admission, primary disorders, underlying comorbidities, APACHE II score within the first day and the highest SOFA (Sequential Organ Failure Assessment) score during the first 3, 5 and 7 days (SOFAtop3, SOFAtop5, SOFAtop7)after admission, laboratory data including arterial blood glucose level during the first 7 days, HbA1c levels measured within 24 hours after admission. Average daily amount of carbohydrate intake, average daily dosage of insulin (Novolin R), and total dosage of glucocorticoid (converted into dosage of Methylprednisolone) for the first 7 days were obtained.
Outcome indicators including duration of ventilator free days, renal replacement therapy (RRT), and non-ICU length of stay during 28 days, survived or not at 28-day after admission were recorded.
The Blood Glucose Management Protocol
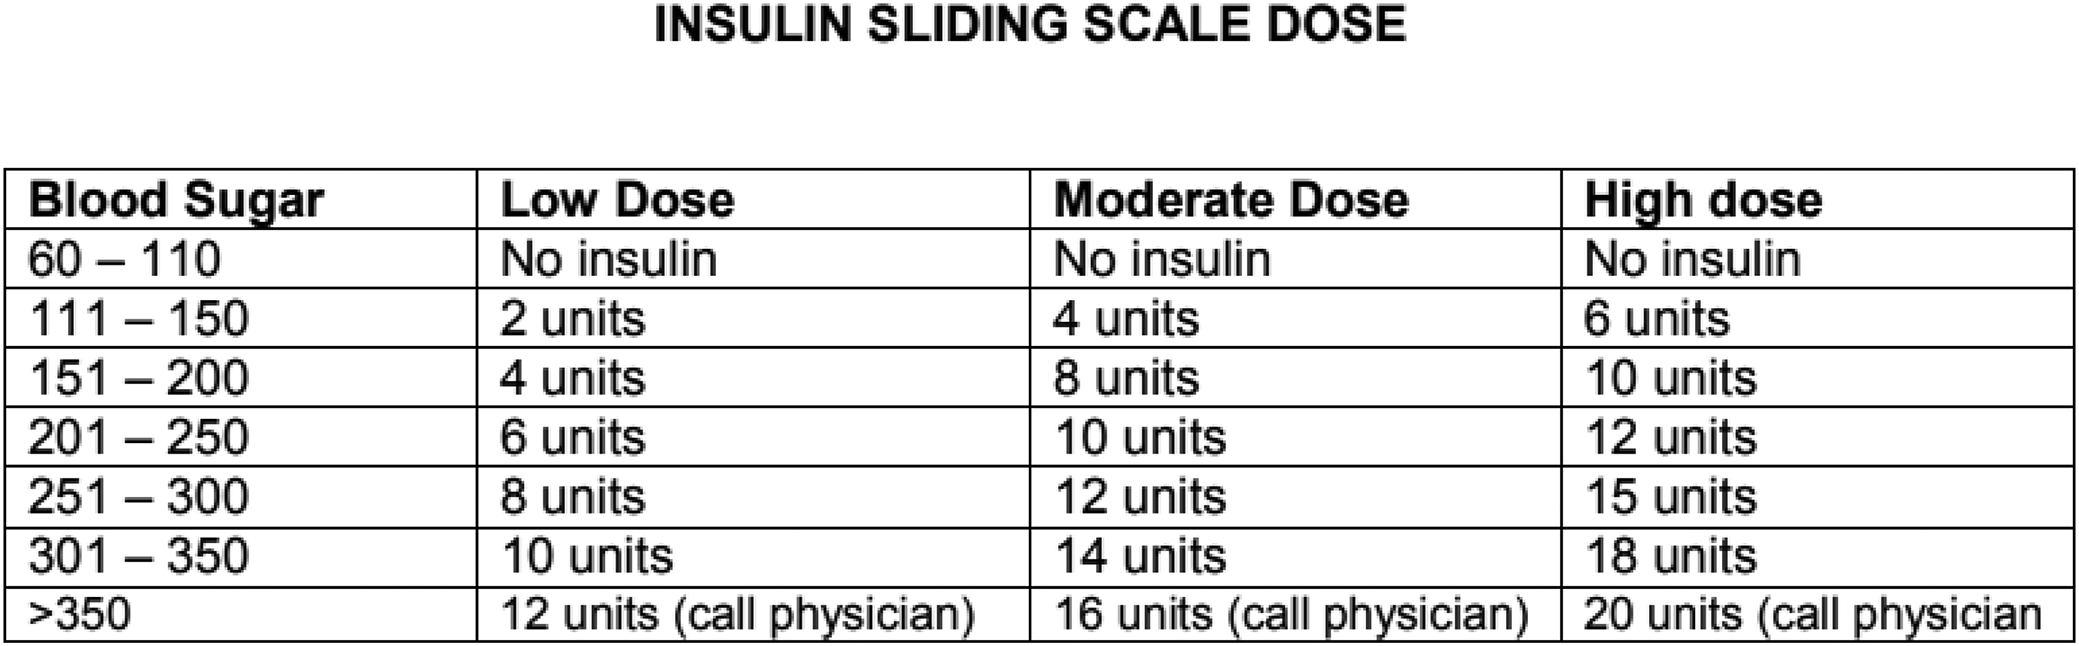
The target range of blood glucose was 8.0–10.0 mmol/L. We used insulin sliding scale strategy to control blood glucose and repeated test if we got abnormal value. The frequency of test based on the programme-every 6 hours per day-and repeated measurement within two hours if we got high value versus 30 minutes after hypoglycemia. As for the blood glucose level of 4.1–6.0 mmol/L, we would repeat test to avoid moderate or severe hypoglycemia. If the level of blood glucose was higher than 15.0 mmol/L, we would stop the intake of carbohydrate and administered insulin subcutaneously or intravenously till the blood glucose droped to lower than 15.0 mmol/L. The insulin sliding scale was as follows:
Data of Blood Glucose Level, HbA1c Value and Glycemic Gap
We tested arterial blood glucose levels at least every 6 hours during the first 7 days after admission using a blood gas analyzer (GEM PRIMIER3000) equipped with the current method. HbA1c was detected within the first 24 hours. MH was defined as blood glucose level at the range of 2.2–3.3 mmol/L, whereas SH was defined as a blood glucose level lower than 2.2 mmol/L.
Parameters including mean glucose level during the first 3 days (MGL-3), 5 days (MGL-5), and 7 days (MGL-7), the incidence of moderate hypoglycemia (MH) and severe hypoglycemia (SH) were calculated based on measurements of blood glucose level.
HbA1c levels were converted into A1C-derived average glucose (ADAG) to represent chronic average blood glucose levels using the following equation: A1C-derived average glucose (ADAG) = [(HbA1c * 28.7) – 46.7] * 18−1. GAPadm was calculated as admission blood glucose minus ADAG as follows: GAPadm = [admission BG – ADAG], GAPmean-3 was calculated as MGL-3 minus ADAG as follows GAPmean-3 = [MGL-3 – ADAG], GAPmean-5 was GAPmean-5 = [MGL-5 – ADAG] and GAPmean-7 was GAPmean-7 = [ MGL-7 – ADAG].
Statistical Analysis
Consecutive data are expressed as mean and standard deviation, categorical data are expressed as frequencies (percentage). Analyses were performed by the 2-tailed Student t-test and the Chi-square test or Fisher exact test. Logistic regression models were built after screening statistically significant variables and plotted receiver operating characteristic (ROC) curves to analyze the discernibility of the predictive parameters, and the area under the ROC curve (AUC) and 95% confidence internal (CI) was calculated simultaneously to identify the relationship between the glycemic gap and 28-day mortality. Youden's index was applied to ascertain the preponderant value of glycemic gap as an independently predictive factor of 28-day mortality. Graphs were built using Medcalc, Version 19.6.1 and data analyzed using SPSS statistics, Version 24.0. P value of <0.05 was considered statistically significant.
Results
Study Population and Baseline Characteristics
1938 patients were admitted to our general ICU during the study period, 431 patients were enrolled, of which 175 (40.6%) died at 28-day after inclusion, based on which we separated the patients into two groups survival and nonsurvival (Figure 1). Blood glucose samples with a number of 11800 in total and 27.4 per capita were collected. Non-survivors tended to be older and to have a higher APACHE II scores and SOFA scores comparing with survivors. The proportion of patients undergoing surgery in nonsurvivors was lower than that of survivors (Table 1).
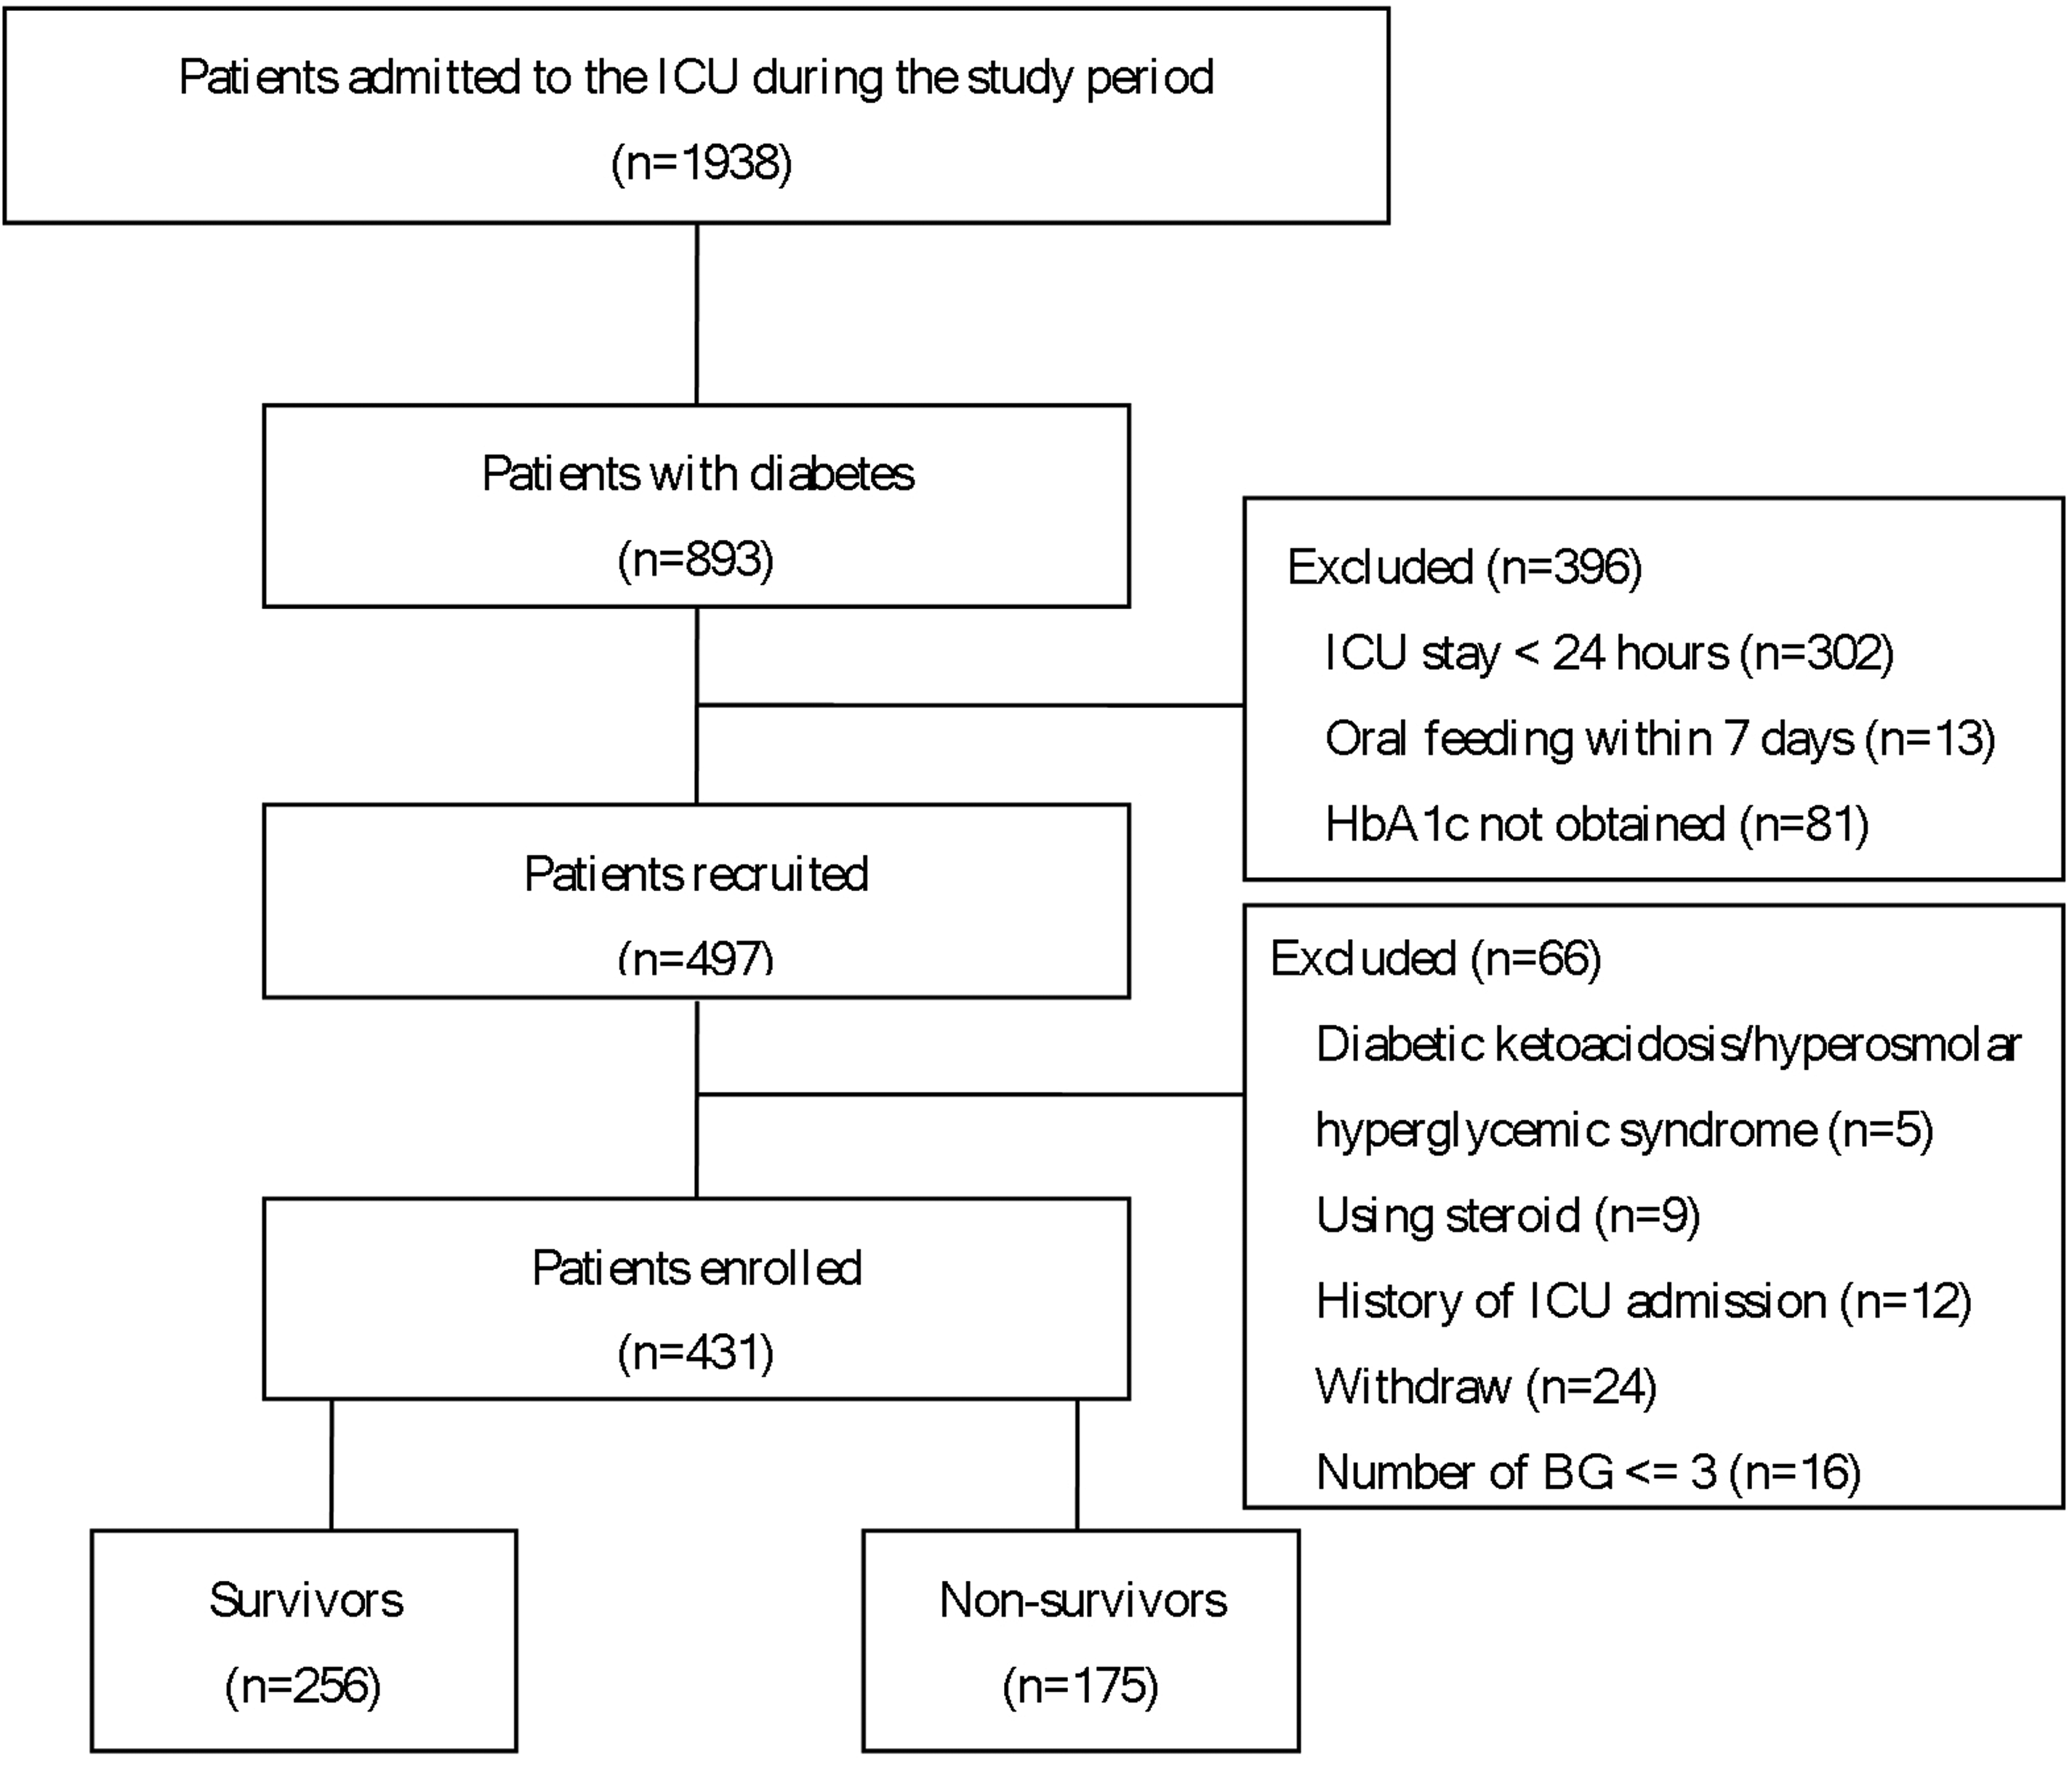
Flow chart of the study. 1938 patients were admitted to the general ICU during study period, 893 patients were diagnosed with diabetes, 462 patients were excluded, 431 patients were enrolled, of which 256(59.4%) survived and 175 (40.6%) died at 28-day.
Baseline Characteristics of the Diabetic ICU Survivors and Non-Survivors.
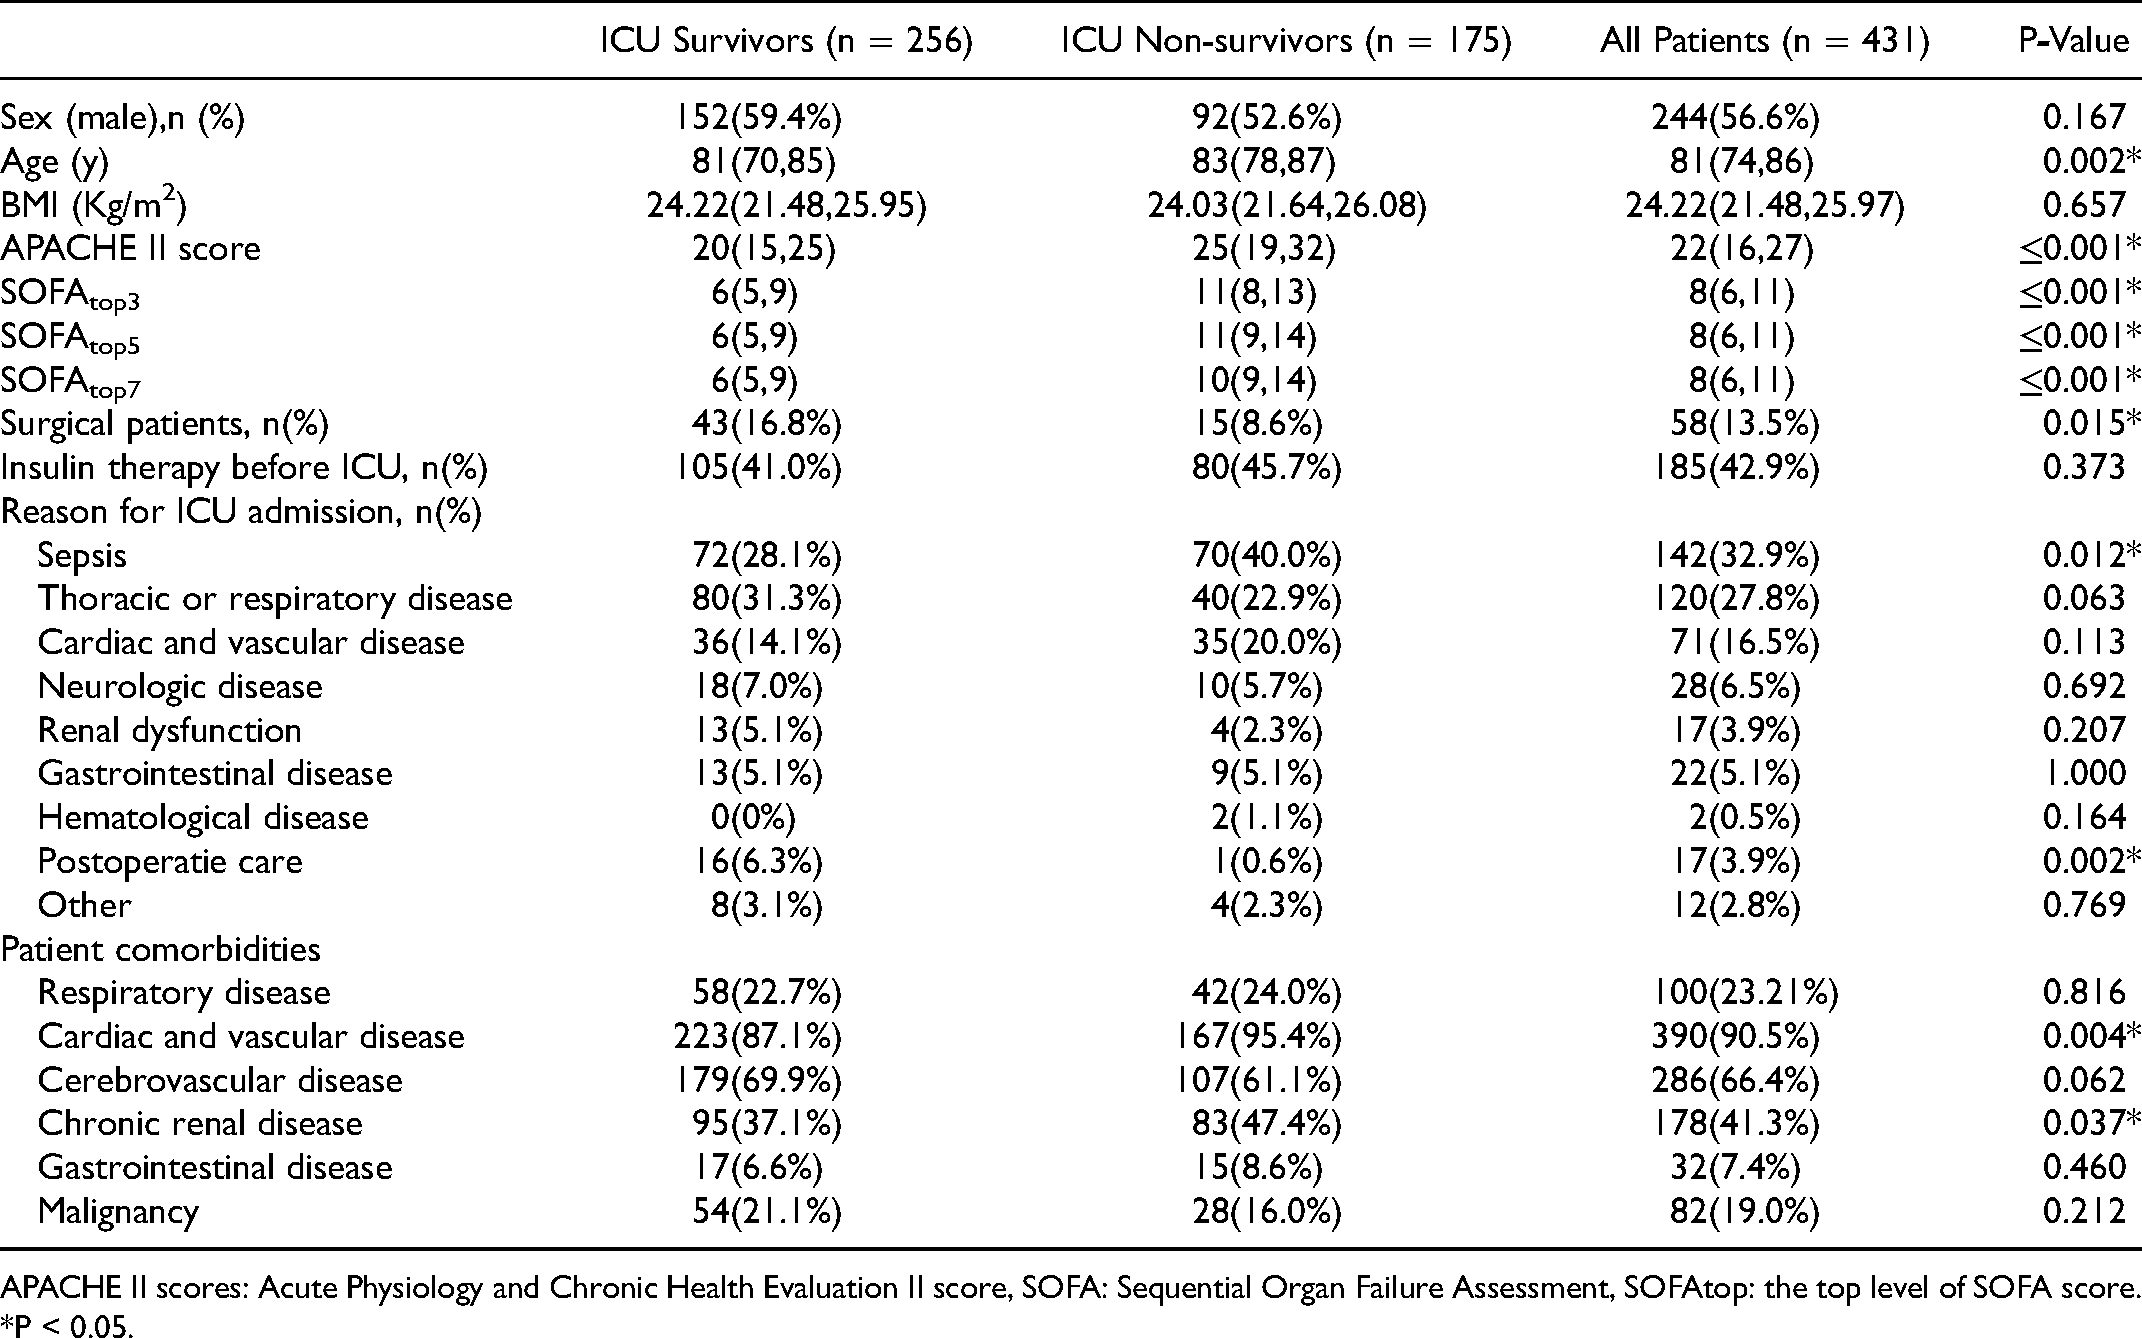
APACHE II scores: Acute Physiology and Chronic Health Evaluation II score, SOFA: Sequential Organ Failure Assessment, SOFAtop: the top level of SOFA score.
*P < 0.05.
Relevant Data of Blood Glucose Level
There were no significant differences in HbA1c value and ADAG between the two groups, greater levels of BG at admission, MGL-3, MGL-5, and MGL-7 were found in nonsurvivors, the incidence of MH and SH were more common among nonsurvivors who had higher GAPadm, GAPmean-3, GAPmean-5 and GAPmean-7 (P < 0.05, Table 2).
Relevant Data of Plasma Glucose Levels and GAP.

BG: blood glucose, MGL: mean glucose level, ADAG: A1C-derived average glucose, GAPadm: glycemic gap between blood glucose at admission and ADAG, GAPmean: glycemic gap between MGL and ADAG, MH: moderate hypoglycemia, blood glucose:2.2–3.3 mmol/L, SH: severe hypoglycemia, blood glucose:<2.2 mmol/L.
*P < 0.05.
Therapy and Outcome Data
Non-survivors received less daily intake of carbohydrates and higher daily dosage of insulin (Novolin R) and accumulated dosage of glucocorticoid (converted into the dosage of Methylprednisolone) during the first 7 days of admission.
Outcome indicators including ventilator-free hours and non-ICU stay days during 28 days were longer and duration of renal replacement therapy (RRT) shorter among survivors (P < 0.05, Table 3).
Therapy and Outcome Data.

MV: mechanical ventilation, RRT: renal replacement therapy.
*P < 0.05.
Relative Factors and Predictors of 28-day Mortality
Variables related to the primary outcome were screened out during single factor analysis and logistic regression analysis revealed that the corralation between the indexes of age, APACHE II score, MH, SH, and GAPmean-5 and mortality at 28-day. GAPmean-5 was associated with a 70% increase in 28-day mortality for each 1mmol/L elevated, and SOFAtop5 contributed to a 37% increase in mortality for 1 score increased. Data showed consistent trend of MH and SH, the two indexes were combined to generate the index “MH/SH”, which was associated with a nearly 55% increased in mortality (Table 4).
Multiple Logistic Regression Analysis of the Correlation between variables and 28-day Mortality.

BG: blood glucose, MGL: mean glucose level, ADAG: A1C-derived average glucose, GAPadm: glycemic gap between blood glucose at admission and ADAG, GAPmean: glycemic gap between MGL and ADAG, MH: moderate hypoglycemia, blood glucose:2.2–3.3 mmol/L, SH: severe hypoglycemia, blood glucose:<2.2 mmol/L.
*P < 0.05.
SOFAtop5 and GAPmean-5 were independent risk factors for mortality at 28-day, AUC of GAPmean-5 was higher than that of SOFAtop5, which reflected the greater predictive power. GAPmean-3 and GAPmean-7 were removed from the regression equation due to the collinearity with GAPmean-5 and lower discriminative power with smaller AUC comparied with GAPmean-5. SOFAtop5 was kept, SOFAtop3 and SOFAtop7 were removed with the same reason as GAPmean-3 and GAPmean-7.
The optimal cut-off value of GAPmean-5 to predict 28-day mortality was 3.6 mmol/L (sorted by Youden index), which provided a sensitivity and specificity of 77.7% and 76.6%.
Table 5 showed the AUC of APACHE II, GAP, and SOFA within 3, 5, and 7 days to predict the mortality of 28-day, GAPadm incorporated with APACHE II, GAPmean-3 incorporated with SOFAtop3, GAPmean-5 incorporated with SOFAtop5 and GAPmean-7 incorporated with SOFAtop7 were performed as well, GAPmean-5 incorporated with SOFAtop5 was the best, which increased the predictive power with the AUC of 0.807(95%CI: 0.762-0.851) to 0.852(95%CI: 0.814-0.889) (NRI = 11.34%, P < 0.001). The ROC curve was shown as Figure 2.
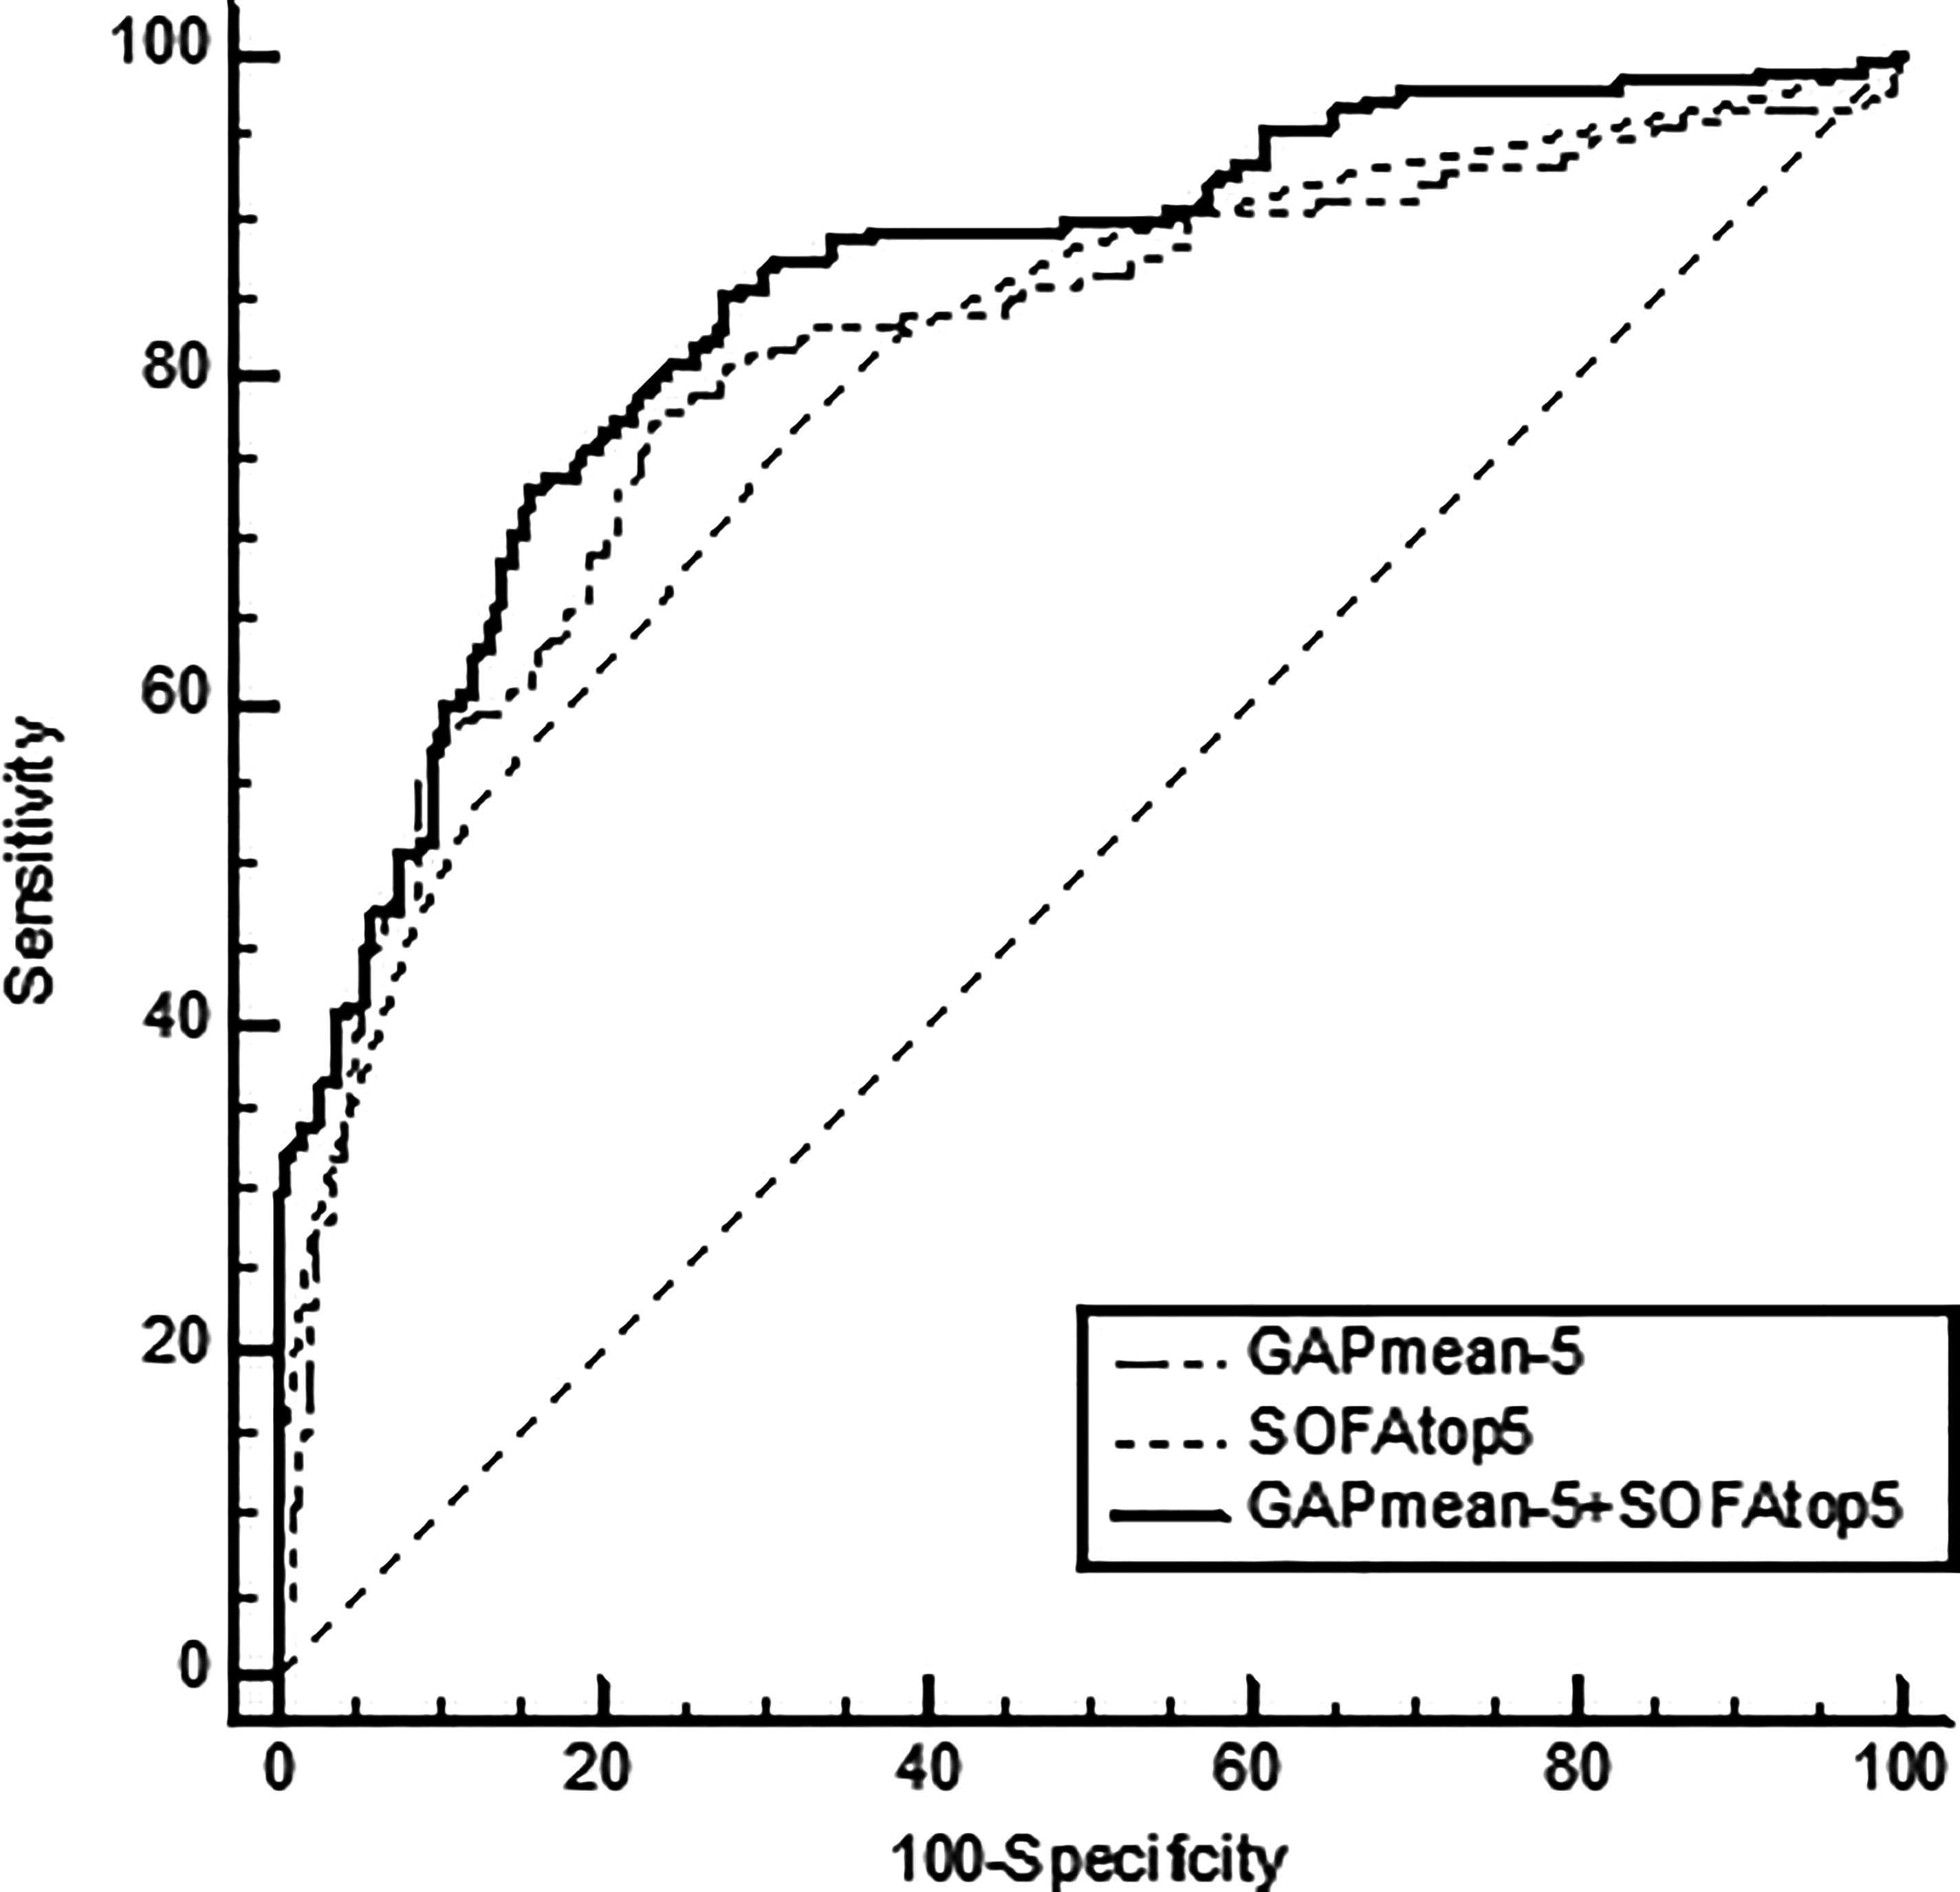
ROC curves for GAP and SOFA scores for predicting 28-day mortality. The AUC of GAPmean-5 was the highest among that of other predictors for 28-day death. SOFAtop5 incorporated with GAPmean-5 were performed as well, of which AUC was improved remarkably.
AUC and 95%CI of APACHE II, SOFA, and GAP for Prediction of 28-day Mortality.
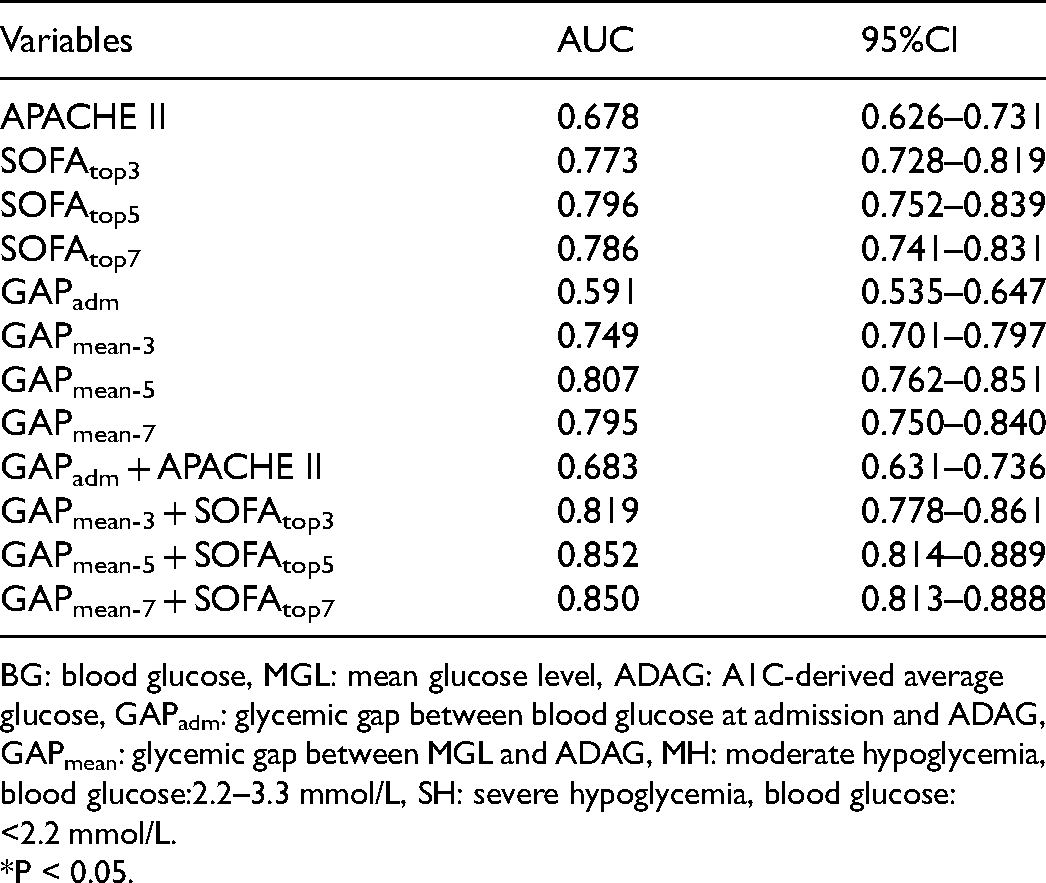
BG: blood glucose, MGL: mean glucose level, ADAG: A1C-derived average glucose, GAPadm: glycemic gap between blood glucose at admission and ADAG, GAPmean: glycemic gap between MGL and ADAG, MH: moderate hypoglycemia, blood glucose:2.2–3.3 mmol/L, SH: severe hypoglycemia, blood glucose:<2.2 mmol/L.
*P < 0.05.
Discussion
Stress-induced hyperglycemia (SIH) is commonplace in critically ill patients from which they suffer such as sepsis, multiple trauma, major surgery, acute myocardial infarction (AMI), 13 burns and stroke, 14 presenting secondary to elevated levels of counterregulatory hormone (cortisol, catecholamines, glucagon, and growth hormone) and impaired response, which results in increased gluconeogenesis and decreased glycogenolysis. SIH occurs in individuals with and without a history of diabetes and is believed to be more closely related to an increased risk of death in patients without diabetes compared with hyperglycemia in diabetes. 15 Moritoki et al reported that in patients with critical illness-associated hyperglycemia (CIAH) and “adequately controlled” diabetes, acute hyperglycemia is associated with increased mortality, whereas in patients with “insufficiently controlled” diabetes it is not.11 There is a comparable conclusion that Krinsley 16 reached, which is that patients with diabetes may benefit from higher glucose target ranges than those without diabetes. We found a higher levels of mean blood glucose in nonsurvivors without significantly statistical association with 28-day mortality, higher average daily dosage of insulin, and incidence of MH and SH were also recorded, this finding was consistent with previous studies and indicated that restraint of SIH was not definitely beneficial, 9 patients with diabetes tend to be tolerant of prolonged hyperglycemia and might be adaptive to wider and individualized range of blood glucose. 17 Tight glucose control reduces the risk of microvascular complications, but the benefits are counterbalanced by a higher risk of hypoglycemia, which is a frequent consequence of tight glucose control, particularly with the use of insulin-providing medications, counterbalancing the benefits. 18 Hypoglycemia was confirmed repeatedly associated with ICU mortality regardless of whether the patients were diagnosed with diabetes, which could result in drastic fluctuation of blood glucose and induce more serious cellular impairment, 19 that might be the reason studies failed to replicate the benefit of tight glycemic control on ICU mortality, 20 patients were more likely suffering poor outcomes. 21 The conclusion above impelled us to implement a more rational and effective protocols to monitor and control blood glucose to avoid or balance the two extremes which were “uncontrolled hyperglycemia” and “over tightly controlled glucose. 22
Tangible proof convinced researchers of the fact that hyperglycemia of critically ill patients could not totally attribute to stress response. 23 It makes researchers turn to the relationship between the degree of premorbid glycaemia and mortality, the admission blood glucose levels are especially proved associated with higher mortality. 24 Researchers had concluded that admission hyperglycemia could result from a combination of acute physiological stress or higher baseline blood glucose. 25 Quantification of the level of chronic glycemia in critically ill patients provides important clinical information how severity critical illness-associated dysglycemia is. 17 Level of HbA1c represents premorbid chronic hyperglycemia before admission and is not affected by stress or fasting status, it is inconsiderable within day and day-to-day variations, 26 HbA1c thus could be regarded as a parameter of identifying SIH and diabetic hyperglycemia 27 and routinely performed, further evidences showed the difference between blood glucose level at admission and ADAG was associated with adverse outcomes.28,29 Nonetheless, the study has witnessed the unparalleled predictive power of GAPmean on 28-day mortality in critically ill patients with diabetes compared with other parameters including GAPadm based on blood glucose measurements. The result reminded us that different responses to standard glucose control in patients with chronic hyperglycemia and normoglycemia should be considered. 17 Farid Fawzy believed that elevated glycemic gap and APACHE-II score were associated with increased ICU mortality and their incorporation could predict the mortality of critically ill patients effectively. 30 Date showed that GAPadm with smaller AUC than previous studies, despite the improvement attributed to the incorporation of APACHE II, the AUC was lower than 0.70 yet. The reasons might refer to diverse reactivity among patients, severity and progression of the disease, a single point of blood glucose value could not reflect the reality and variation veritably and timely with numerous impacted factors and unforeseen circumstances, whereas the mean level of blood glucose during several days after admission to ICU might reflect more comprehensive information of the patients.
Treating a patient and predicting mortality in the ICUs is always a challenge as well as a great concern for physicians, the effect of this prediction is on various aspects of patient care. 31 Researchers believed that both SOFA and APACHE II had the discreminative power of predicting the mortality of critically ill patients with comparable sensitivity and specificity, APACHE II was better, the reason might be that most of the patients admitted to the emergency department were shifted to the ICU without significant vital support. 32 Nevertheless, the validity of the APACHE II has been challenged because it does not take into account the treatment or the subsequent course of disorders after the first 24 hours admitted to ICU, the severity of critically ill patients might not get the top level at admission, the situation of patients may deteriorate after admission, recognition of evolving illness severity in ICU is invaluable. SOFA score is commonly used for assessing the severity and predicting outcomes of critically ill patients, 33 it has the potential advantage of assessing the intensity of organ failure and organ support during the patient's stay in ICU comparing with APACHE II. 34 Our data showed that the top levels of SOFA during 3, 5, and 7 days after admission were related to the mortality of critically ill patients definitely, furthermore, when we incorporated the top level of SOFA into GAPmean within the same period would provide more optimal predictive power on 28-day mortality. We believed that these parameters were mutual complementary, and the predictive power was increased consequently.
Limitations
There are limitations in the study. First, this is a single-center study with a limited number of samples, thus selection bias may exist. Second, there remains controversy about the strategy of controlling and targeting the level of blood glucose. Insulin was administered through intravenous way continuously or subcutaneous way intermittently to achieve the target level of blood glucose which ranged from 8.0 mmol/L to 10.0 mmol/L during the study. Third, we did not exclusively analyze the impact on blood glucose, and the type of nutritional support, or medications such as catecholamines, diuretic, or antibiotics may have. It is necessary to carry out multicenter studies to increase the sample size and balance the process of monitoring and controlling the level of blood glucose in the future, subgroup analysis of the effects of related medications and classification of adverse outcomes may be needed either.
Conclusions
In this study, an elevated glycemic gap between the mean blood glucose level in the first 7 days, especially MGL within 5 days after admission to ICU and A1C-derived average glucose (ADAG) was independently associated with 28-day mortality in critically ill patients with diabetes significantly, the predictive power for mortality was superior to GAPadm (the difference between admission blood glucose and ADAG). The predictive power was optimized with addition of the top level of SOFA within 5 days.
Footnotes
Author Contributions
RL and LJ designed the study. RL, PW and QJ performed data collection. RL and MP did data analysis and drafted the manuscript. LJ and BZ were in charge of overall direction and planning and contributed to reviewing and editing the manuscript. All authors read and approved the final manuscript. All authors have contributed to the creation of this manuscript for important intellectual content and approved the final manuscript.
Additional Data
There is no additional data.
Research Checklist
This paper does not belong to any research checklist.
Statement
1. Study participants or the public were not involved in the design, or conduct, or reporting, or dissemination plans of our research. 2. This version of manuscript was presented as pre-print to Research Square as per the following source https://www.researchsquare.com/article/rs-151696/v1.
Declaration of Conflicting Interests
The author(s) declared no potential conflicts of interest with respect to the research, authorship, and/or publication of this article.
Funding
The author(s) received no financial support for the research, authorship, and/or publication of this article.
Ethical Approval
Not applicable, because this article does not contain any studies with human or animal subjects.
