
Abstract
Keywords
Introduction
Coronavirus disease 2019 (COVID-19), which emerged in December 2019 and rapidly became a pandemic, has resulted in many individuals being hospitalized and requiring intensive care and led to the death of millions of patients across the world. COVID-19 has also caused the development of various morbidities in survivors. There is ongoing research to elucidate COVID-19-associated morbidities. During this process, many studies have been conducted on risk factors related to COVID-19 and provided ideas about the pathogenesis and clinical prognosis of the disease, increasing treatment options. 1 Although it is now known that COVID-19 is a multisystemic disease, it primarily manifests with serious pneumonia. In the literature, it has been reported that body composition can adversely affect clinical outcomes in patients with pneumonia, and it has been suggested that respiratory and extremity muscle strength can be used to predict mortality caused by pneumonia. 2 In addition, it is known that low muscle mass and sarcopenia are associated with negative outcomes in trauma, cancer, chronic diseases, and major surgery. 3 In the current literature, sarcopenia is defined as the severe loss of skeletal muscle volume (MV) and function. Functional tests are required for the diagnosis of sarcopenia, but MV measurements also support this process. 4 Computed tomography (CT) is a modality that can be the gold standard for these measurements. 5 Many studies have shown that reduced pectoralis, psoas, and paravertebral MV are associated with decreased muscle mass and handgrip strength and sarcopenia.6,7
It is known that diaphragm dysfunction is associated with prolonged respiratory failure, difficulty in weaning from mechanical ventilation, prolonged hospitalization, morbidity, and mortality in critically ill patients. 8 In ultrasonography (US) study, it was reported that a thin diaphragm caused the lungs to be more compliant, which could cause respiratory failure. 9 In addition, other studies in the literature have shown that a decrease in diaphragm thickness in the early period can be used as a prognostic factor in patients with sepsis, and a thin diaphragm diameter (DD) in the US is associated with a poor prognosis in patients with COVID-19.9,10 Therefore, DD presents as a CT parameter that can indirectly measure diaphragm dysfunction. In addition to these muscle measurements, another parameter that can be obtained for the musculoskeletal system on CT is bone mineral density (BMD) with similar risk factors. In the literature, it has been suggested that BMD can be used as a prognostic factor for many diseases, including coronary artery disease, chronic obstructive pulmonary disease, and breast cancer.11,12 In addition, in a study conducted with COVID-19 cases, it was reported that BMD could be used as a prognostic factor. 13
There are studies in the literature exploring the association between COVID-19 prognosis and MV, DD, and BMD. However, we did not find any study evaluating these musculoskeletal system parameters together on CT. Therefore, in our retrospective study, we aimed to analyze MV, DD, and BM as prognostic factors of COVID-19 by examining thoracic CT examinations performed in almost all patients with COVID-19 admitted to the intensive care unit (ICU).
Material and Methods
Patient Population
Patients that presented to our hospital from March 11, 2020, when the first case of COVID-19 was reported in Turkey, through August 31, 2022, were screened. Those aged over 18 years, who were confirmed to have COVID-19 based on the polymerase chain reaction (PCR) test and admitted to ICU due to COVID-19 directly or during their follow-up, were included in the study. Patients whose diagnosis could not be confirmed by PCR tests, those admitted to ICU for different reasons despite also having a COVID-19 diagnosis, and cases in which CT examinations were performed earlier than 5 days before ICU admission or after 24 h after ICU admission were excluded from the study. The patients included in the sample were divided into 2 groups as those that died and those that were discharged from the hospital.
Laboratory and Demographic Data
Patients admitted to ICU were retrospectively screened from the hospital information management system. Their demographic data, such as age (year), gender, height (cm), weight (kg), and presence of comorbidities were recorded. Body mass index (BMI) was calculated by dividing the weight by the square of the height. Hypertension, diabetes mellitus, presence of lung disease, cardiovascular disease, immunodeficiency, malignancy, and heart failure were noted as chronic diseases. Fasting blood glucose (mg/dL), neutrophil count (103/μL), lymphocyte count (103/μL), platelet count (103/μL), C-reactive protein (mg/dL), ferritin (ng/ml), troponin (ng/L), and D-dimer (mg/L) values measured at the time of ICU admission were recorded. The patients’ vaccination status was also recorded. Patients who had vaccinations at 2 doses and at least 14 days following the second dosage were considered vaccinated. In addition, data on the length of stay in the hospital and ICU were obtained.
CT Protocol and Parameters
CT scans were performed with the patients in the supine position in deep inspiration, using a 16-slice device (Alexion, Toshiba, Tokyo, Japan) without the use of contrast material. The severity of lung involvement score is a semi-quantitative scoring method that utilizes visual evaluation of CT scans. This score is determined by independently scoring each of the 3 lobes in the right lung and the 2 lobes in the left lung, then adding the results to establish the total score. A score of 0 is received for no pneumonia (0%), 1 for minimal involvement (<25% of the lung lobe volume), 2 for mild involvement (26%-50%), 3 for moderate involvement (51%-75%), and 4 for severe involvement (76%-100%) for each lung lobe. 14 Then quartiles were determined for total pneumonia score. Groups were determined as minimal involvement (Q1), mild involvement (Q2), moderate involvement (Q3), and severe involvement (Q4) for our patients.
In light of the literature data, MV was measured from the section passing through the lower edge of the T12 vertebra. 15 The semi-automated segmentation technique was used for this measurement. For this purpose, open-source MATLAB Compiler (R2014a) Runtime 8.3-based (Mathworks Inc., MA, USA) BMI_CT (version 6) software was used. Muscle index (MI) (cm2/m2) was calculated by dividing MV by the square of the height. Axial sections were used for BMD measurements. Hounsfield units (HU) were used to estimate the mean CT attenuation. The region between the superior endplate of the first lumbar vertebra (L1) and the vein entry in the middle was chosen as the measurement site. The posterior basivertebral venous plexus and cortical bone were avoided, and a circular ROI was then placed in the homogenous trabecular bone area in the middle of the vertebral corpus. In the presence of pathologies, such as space-occupying lesions (hemangioma, metastasis, etc) or previous fractures that would affect the BMD measurement in the L1 vertebra, measurements were performed at the T12 vertebra level. The measurement was repeated 3 times, and the average was taken. 16 To standardize DD (mm) measurements, the level where the celiac trunk arose was determined in the axial sections. At this level, a bilateral parallel line was drawn from the anterior spinal canal, and a transverse measurement was made from the point where this line cut both diaphragms (Figure 1). Measurements were made 3 times for both diaphragms, and the diaphragm thickness was determined by taking the average of all measurements. 17
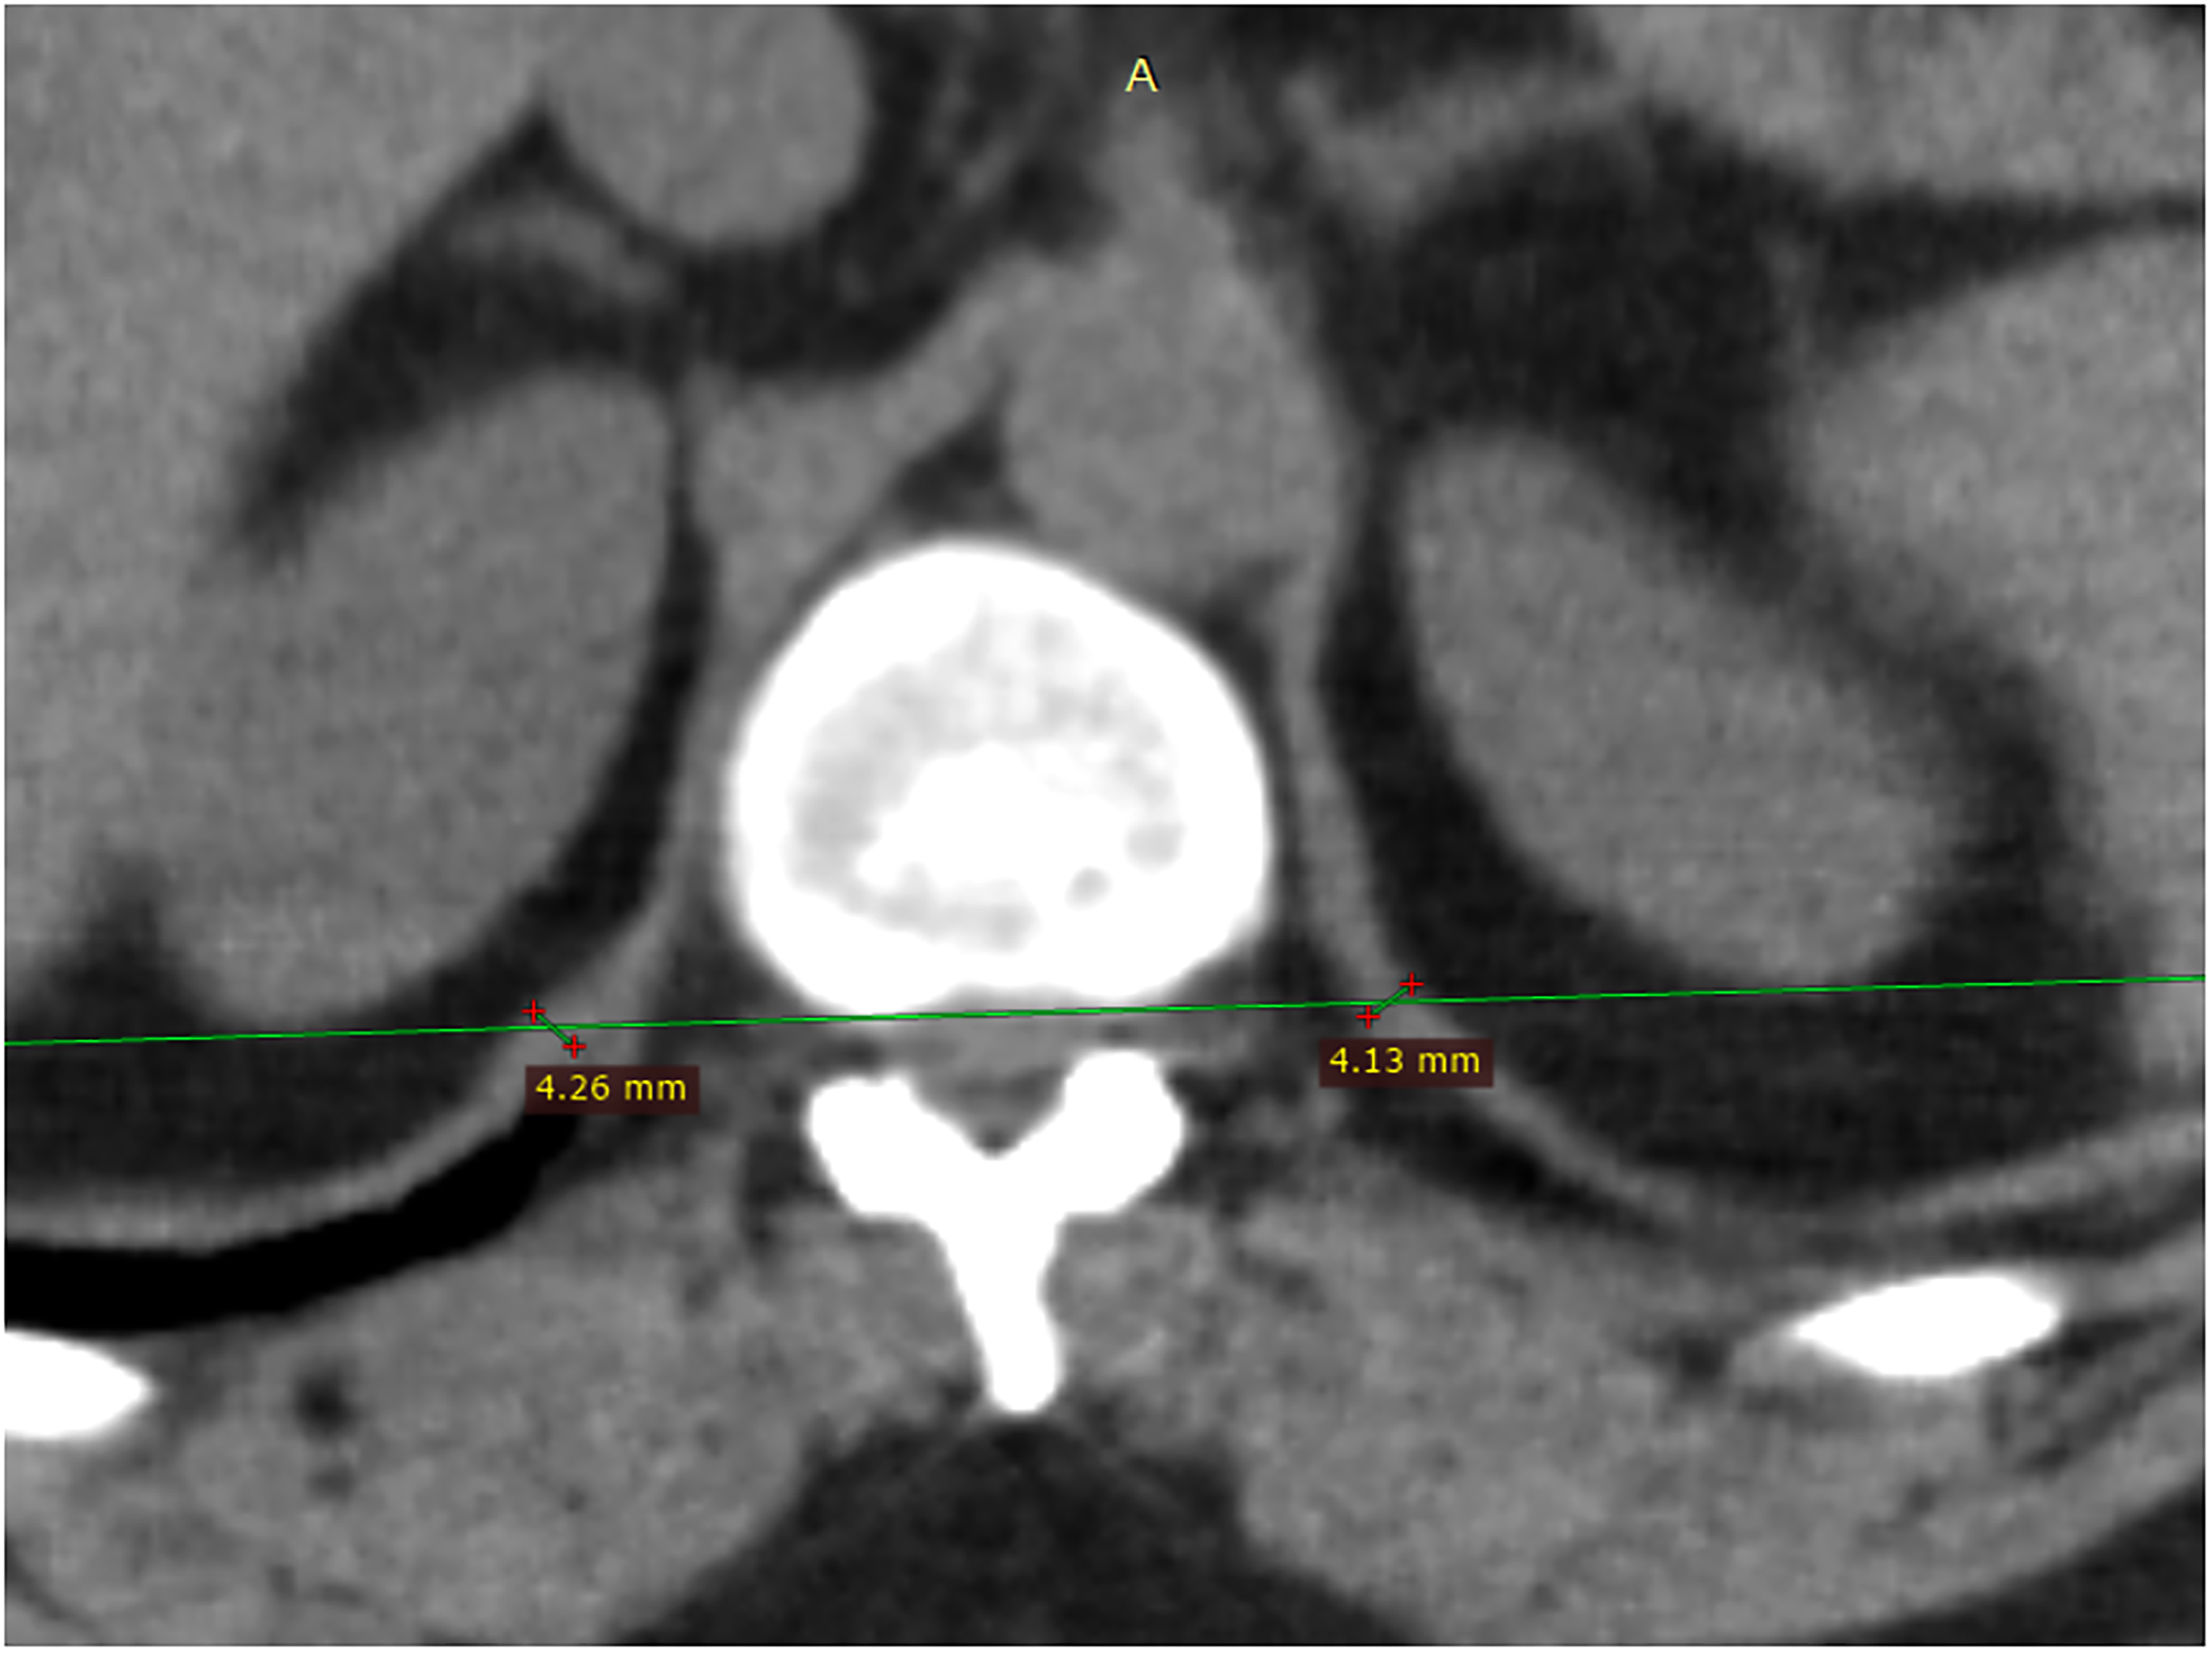
Measurement of hemidiaphragm thicknesses at the level of the anterior spinal canal at the level of the celiac artery origin on axial CT images.
Since MV, MI, DD, and BMD measurements are sex-dependent variables, quartiles were determined for all 4 measurements. Patients in the lowest quartile were recorded as having low MV, MI, DD, and BMD values.
Statistical Analysis
Categorical variables were expressed as frequency (%), and continuous data as standard deviation or median (interquartile range) values. The Shapiro-Wilk test was used to determine the normality of data distribution. Continuous data were compared with Student's t-test or the Mann-Whitney U-tests, and categorical data with the chi-square or Fisher's test. The relationship between age and parameters was evaluated with the Pearson correlation analysis.
Multivariate logistic regression was used to investigate the predictive value of various variables on adjusted odds ratio and 95% confidence interval (CI) on ICU mortality rates. By first performing univariate analysis on each variable and then eliminating values for which P-values were > .1, the variables that would be included in the model were chosen. After choosing the variables, the model's variables were checked for multicollinearity, and those with a variance inflation factor (VIF) of more than 5 were marked for additional analysis. When the model was retested without each of the flagged variables, the one with the VIF < 5 and highest receiver operating curve area under the curve (ROC-AUC) value was used. The model's fit was also evaluated using the Hosmer-Lemeshow goodness of fit test and the Nagelkerke R2 statistic. Intra-observer agreement for the measurements was evaluated with the intraclass correlation coefficient (ICC). ICC values of <0.5, 0.5 to 0.75, 0.75 to 0.90, and ˃0.90 were evaluated as weak, moderate, good, and excellent correlation, respectively. The area under the curve (AUC) values obtained from the receiver operator characteristic (ROC) curve analysis were used to determine the optimal cut-off value of DD, and MI and evaluate its specificity and sensitivity in the differentiation of the mortality and survivor groups. Youden's index (sensitivity + specificity−1) was utilized in the determination of the optimal cut-off value. P < .05 was considered statistically significant.
Results
The study included a total of 498 patients, 224 women and 274 men, who met the inclusion criteria. The mean age of the patients was 65.98 ± 14.84 years. The mean length of hospital stay was calculated as 11 (6-17) days, and the mean length of ICU stay as 7.5 (5-13) days. When the patients who died were excluded from this calculation, the duration of stay in the hospital was 13 (7-19) days and the length of stay in the ICU was 8 (4-13) days. There were 223 patients (127 male and 96 female), in the mortality group and 275 patients (147 male and 128 females) in the discharged group. According to age grouping, 212 patients were aged under 65 years, and 286 patients were aged over 65 years. The descriptive statistics of the patients and comparisons between the groups are summarized in Table 1. When classified according to the severity of pneumonia, lung involvement was minimal (Q1) in 79 (15.9%) patients, mild (Q2) in 128 (25.7%), moderate (Q3) in 137 (27.5%), and severe (Q4) in 154 (30.9%).
Descriptive Characteristics of the Study Population and Comparison Between the Groups.
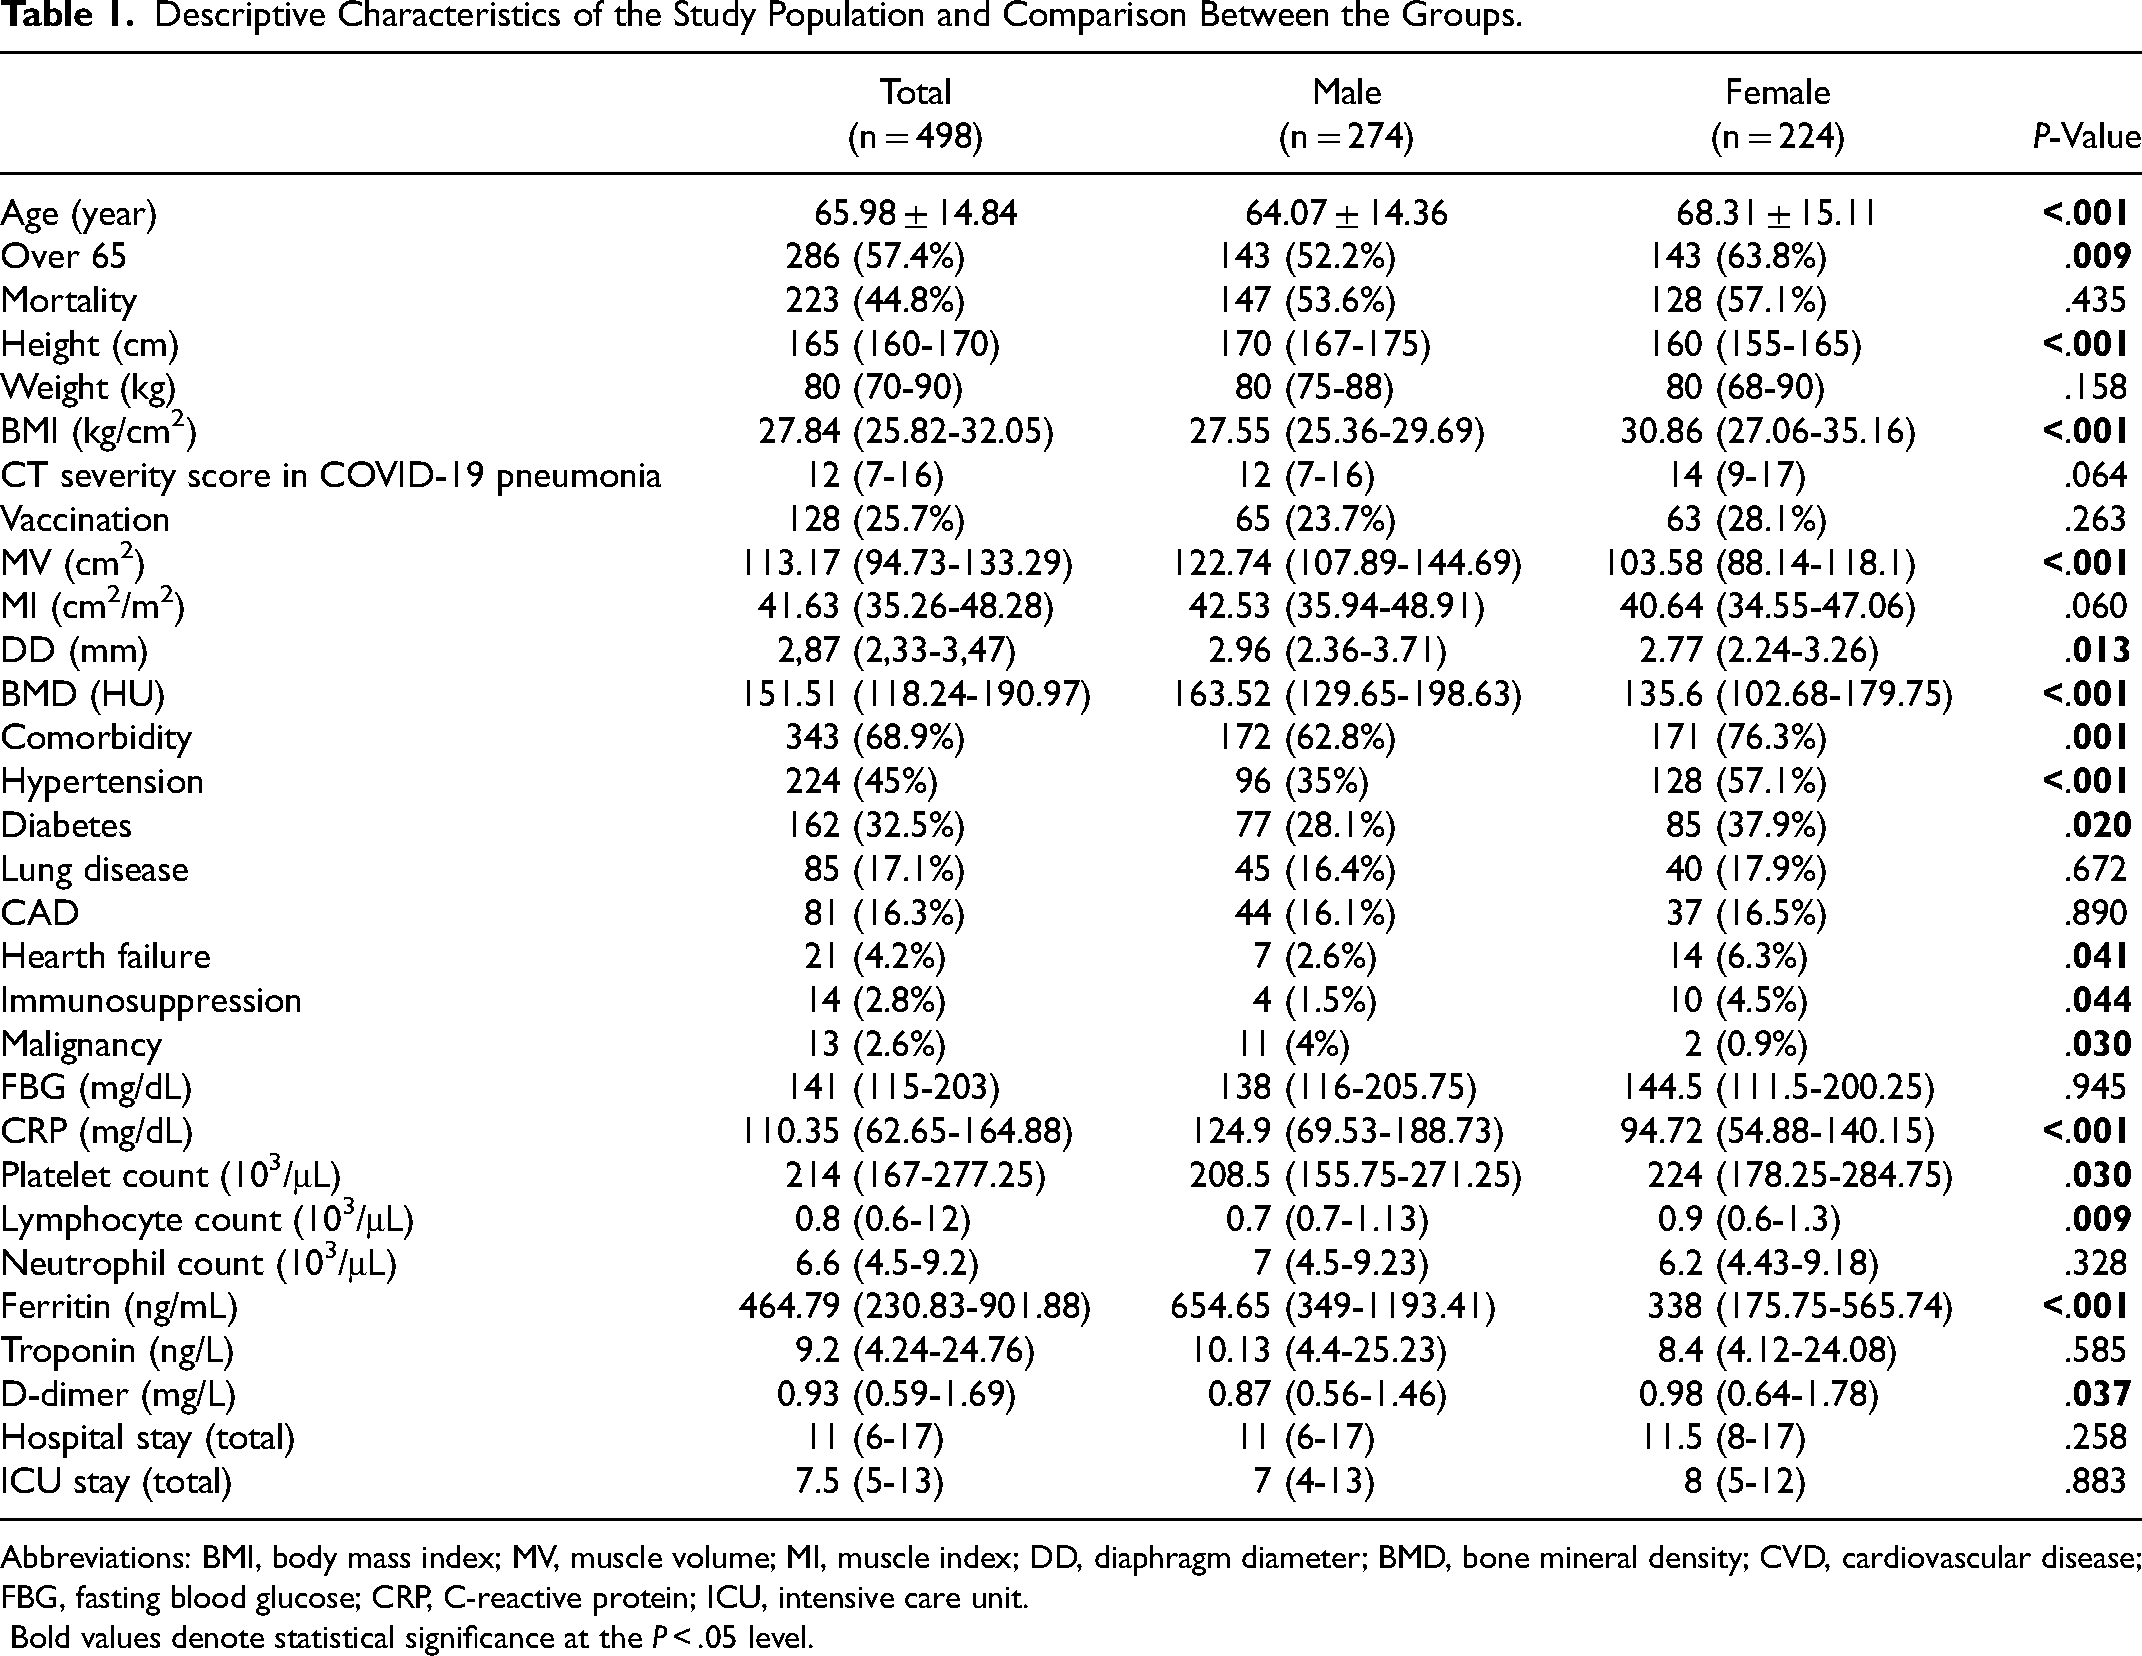
Abbreviations: BMI, body mass index; MV, muscle volume; MI, muscle index; DD, diaphragm diameter; BMD, bone mineral density; CVD, cardiovascular disease; FBG, fasting blood glucose; CRP, C-reactive protein; ICU, intensive care unit.
Bold values denote statistical significance at the P < .05 level.
Patients with DD, BMD, and MI values below the lowest quartiles determined for these parameters were evaluated as the low-value group. The lowest quartile values of MI, DD, and BMD in the whole study group were determined as 34.55 cm2/m2, 2.24 mm, and 102.68 HU, respectively in the female patients and 35.95 cm2/m2, 2.36 mm, and 129.65 HU, respectively in the male patients. There was a statistically significant negative correlation between age and BMD, MV, MI, and DD (P < .001). However, this correlation was weak for MV, MI, and DD (0.491, 0.358, and 0.382, respectively) and moderate for BMD (0.629).
Measurements were repeated for 30 patients at least 15 days later. The intra-observer correlation was excellent for BMD, MV, and DD, with the ICCs being calculated as 0.926 [95% confidence interval (CI): 0.702-0.982], 0.962 (95% CI: 0.846-0.990), and 0.946 (95% CI: 0.784-0.987), respectively.
When the patients were divided into mortality and discharged groups, MV, MI, DD, and BMD were found to be statistically significantly lower in the mortality group (Figure 2). Our findings are summarized in Table 2. Since the patients in our study group had demographic and laboratory data and low MI, BMD, and DD values, first the univariate analysis was performed. As a result of this analysis age, CT severity score in COVID-19 pneumonia, Low MI, Low DD, Low BMD, hypertension, CVD, heart failure, malignancy, FBG (mg/dL), CRP (mg/dL), platelet count (103/μL), D-dimer (mg/L) data were included in the multivariate analysis (Table 3).
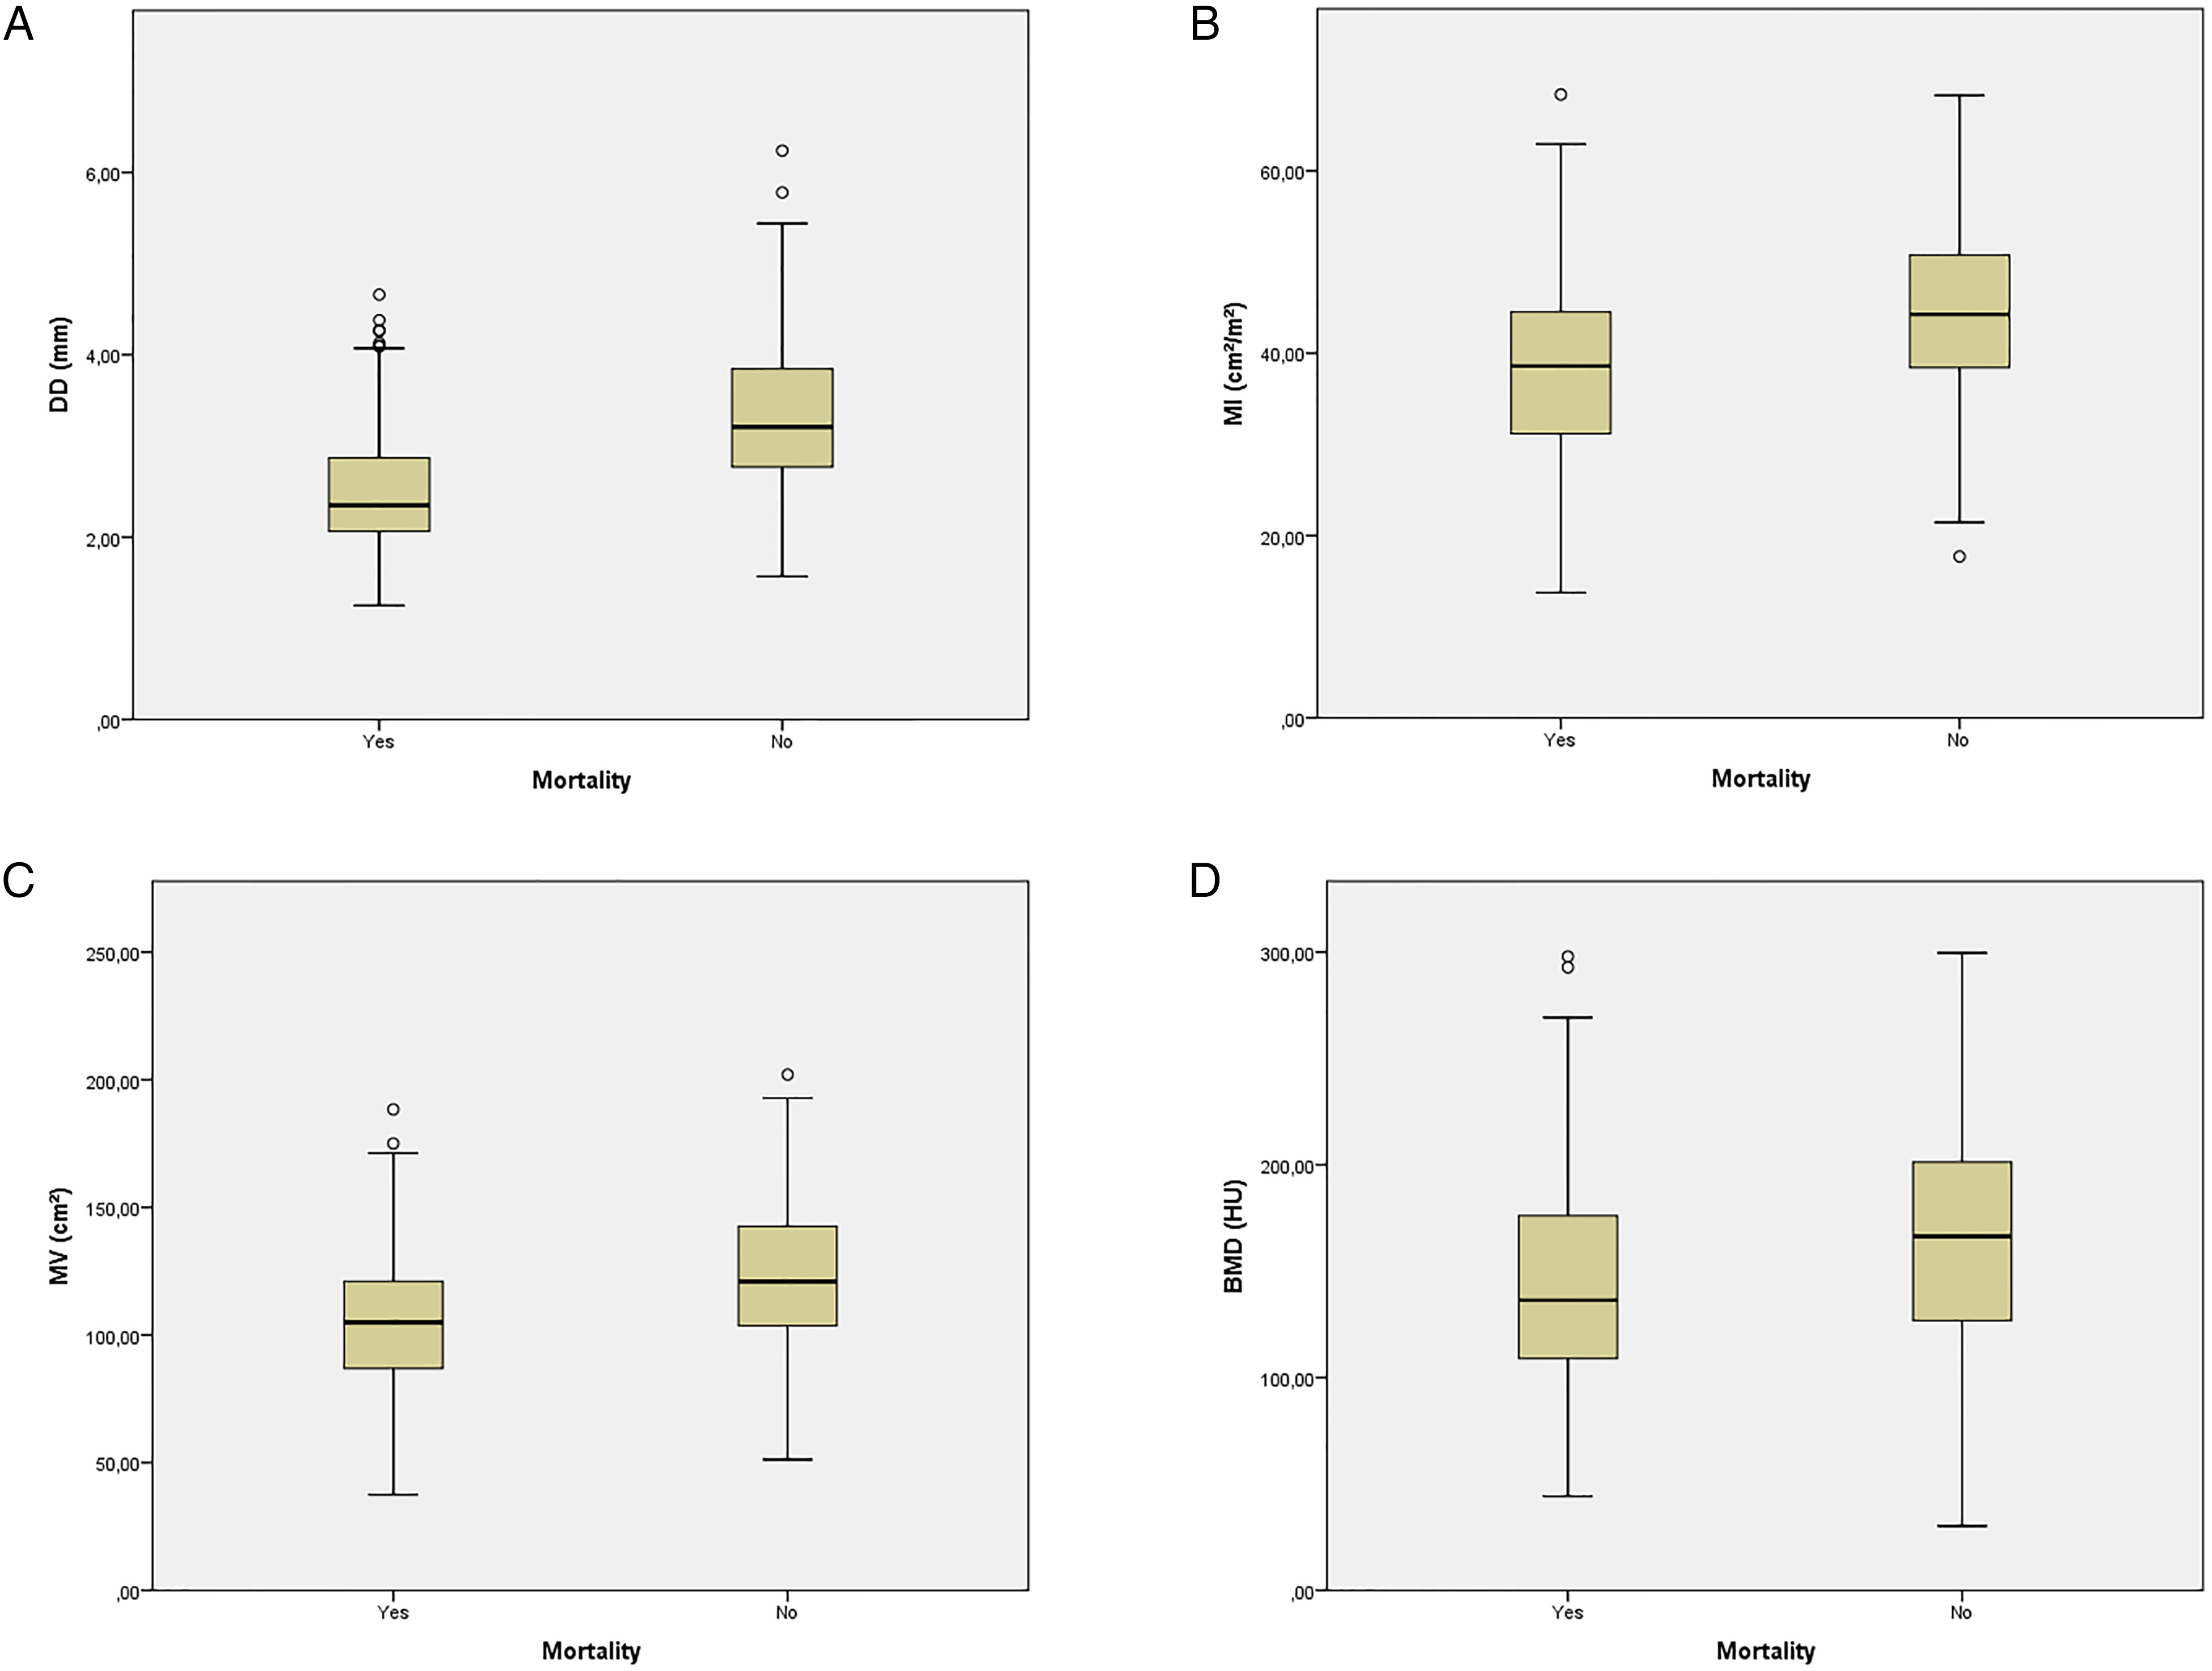
Differences in (A) diaphragm diameter (DD), (B) muscle index (MI), (C) muscle volume (MV), and (D) bone mineral density (BMD) in mortality and discharged groups.
Comparison of Computed Tomography Parameters Between the Mortality and Survivor Groups.
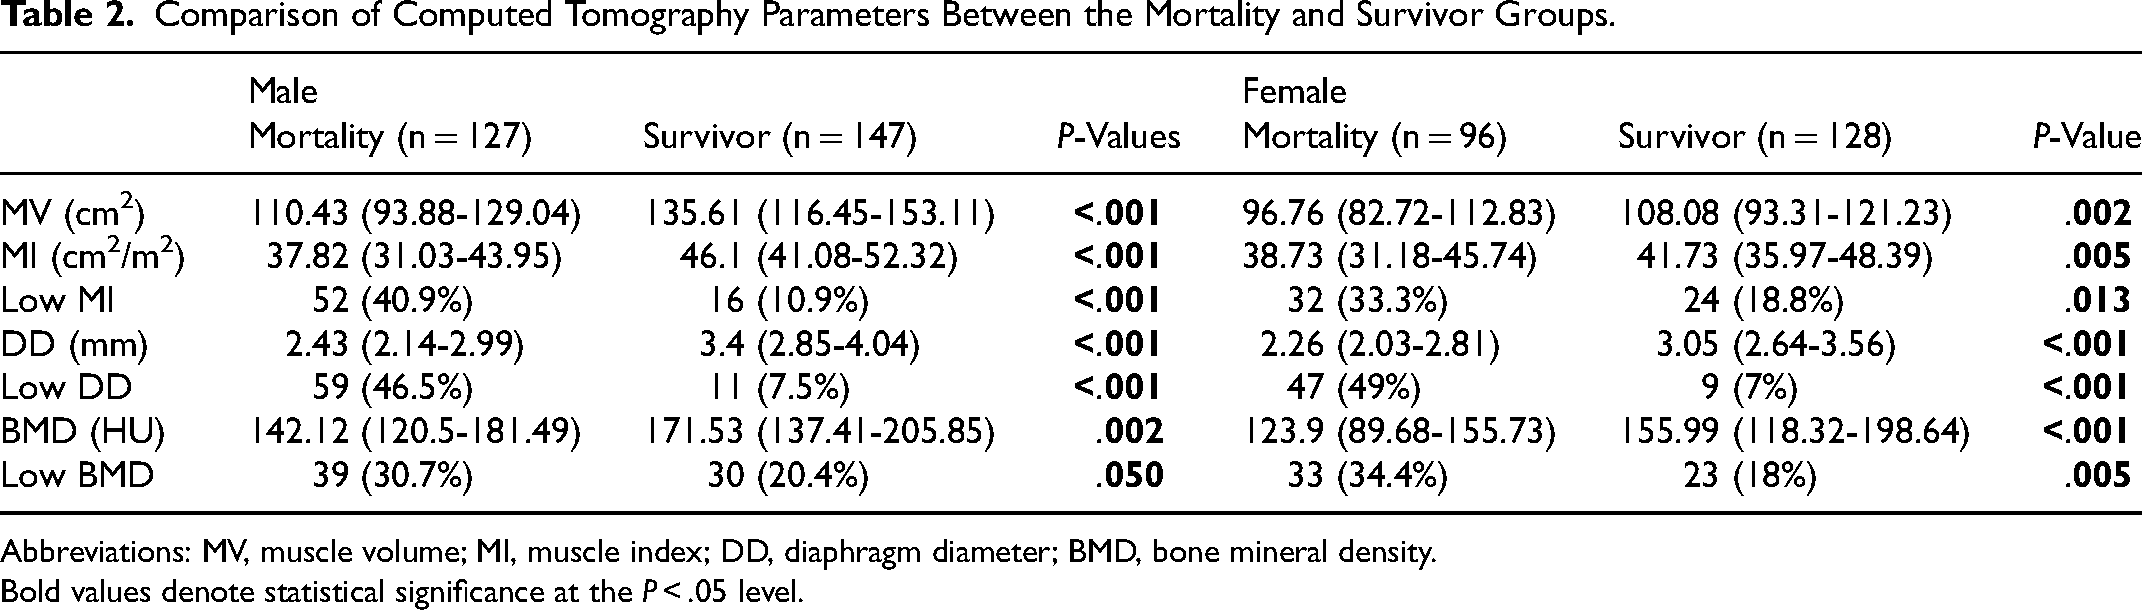
Abbreviations: MV, muscle volume; MI, muscle index; DD, diaphragm diameter; BMD, bone mineral density.
Bold values denote statistical significance at the P < .05 level.
Univariate and Multivariate Analyses of the Investigated Variables for the Prediction of Mortality.
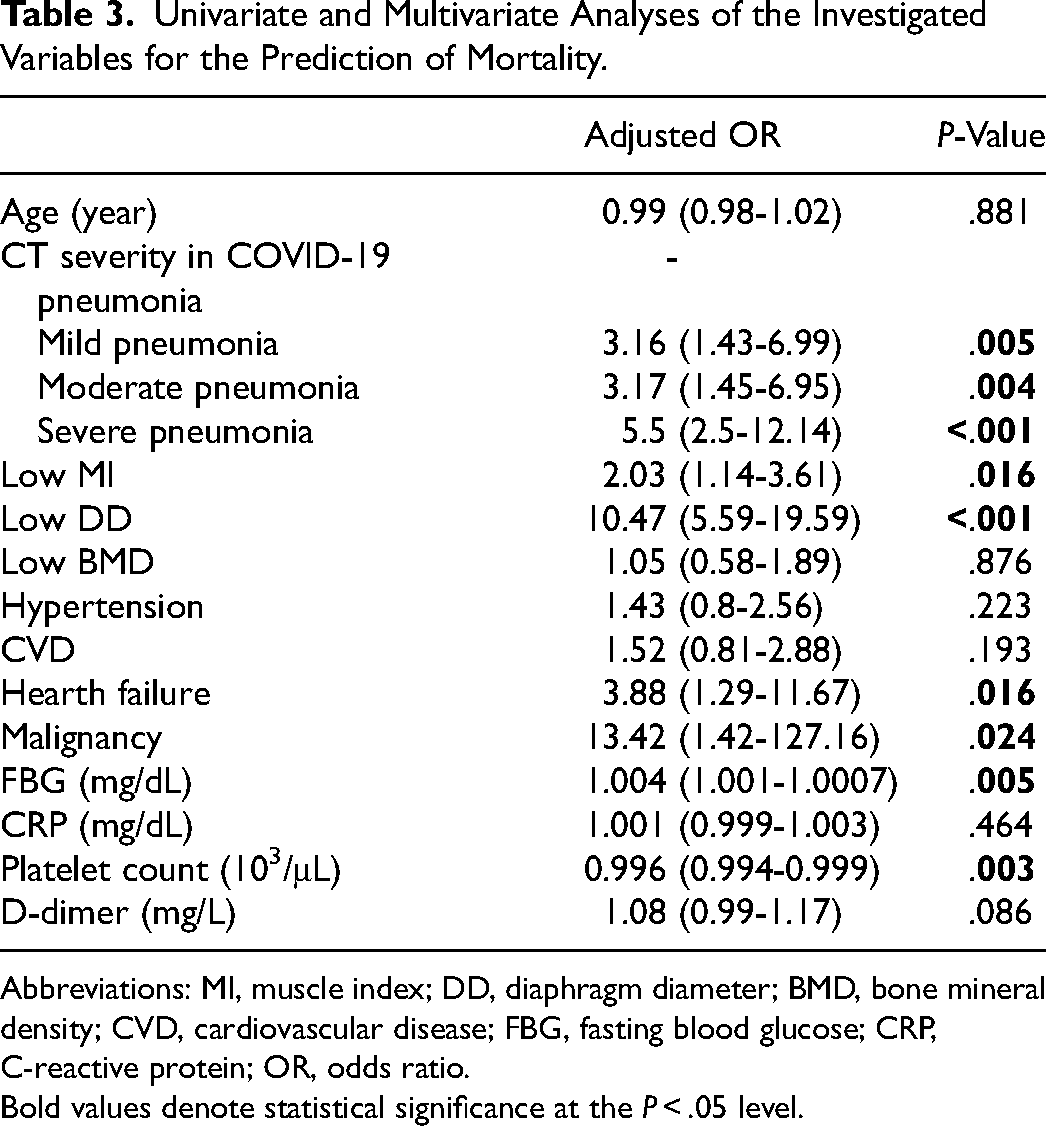
Abbreviations: MI, muscle index; DD, diaphragm diameter; BMD, bone mineral density; CVD, cardiovascular disease; FBG, fasting blood glucose; CRP, C-reactive protein; OR, odds ratio.
Bold values denote statistical significance at the P < .05 level.
The cut-off value for each gender was determined independently by the ROC analysis since DD and MI were independent risk factors. In the male patients, the cut-off value of DD was determined as 2.91 mm, (AUC = 0.817, 95% CI: 0.768-0.866, P < .001, 72.4% sensitivity and 72.8% specificity) and the cut-off value of MI was 42.29 cm2 /m2 (AUC = 0.748, 95% CI: 0.690-0.807, P < .001, 69.3% sensitivity and 69.4% specificity). In the female patients, DD had 71.9% sensitivity and 71.9% specificity at a cut-off value of 2.81 mm (AUC = 0.781, 95% CI: 0.719-0.844, P < .001) and MI had 58.3% sensitivity and 58.6% specificity at a cut-off value of 40.25 cm2 /m2 (AUC = 0.609, 95% CI: 0.533-0.684, P = .005). When the whole sample was evaluated regardless of gender, the cut-off value of DD was 2.83 mm, with the sensitivity and specificity values being determined as 72.6% and 73.1%, respectively (AUC = 0.796, 95% CI: 0.756-0.835, P < .001) and MI had 64.1% sensitivity and 64% specificity at a cut-off value of 41.33 cm2 /m2 (AUC = 0.684, 95% CI: 0.637-0.731, P < .001) (Figure 3).
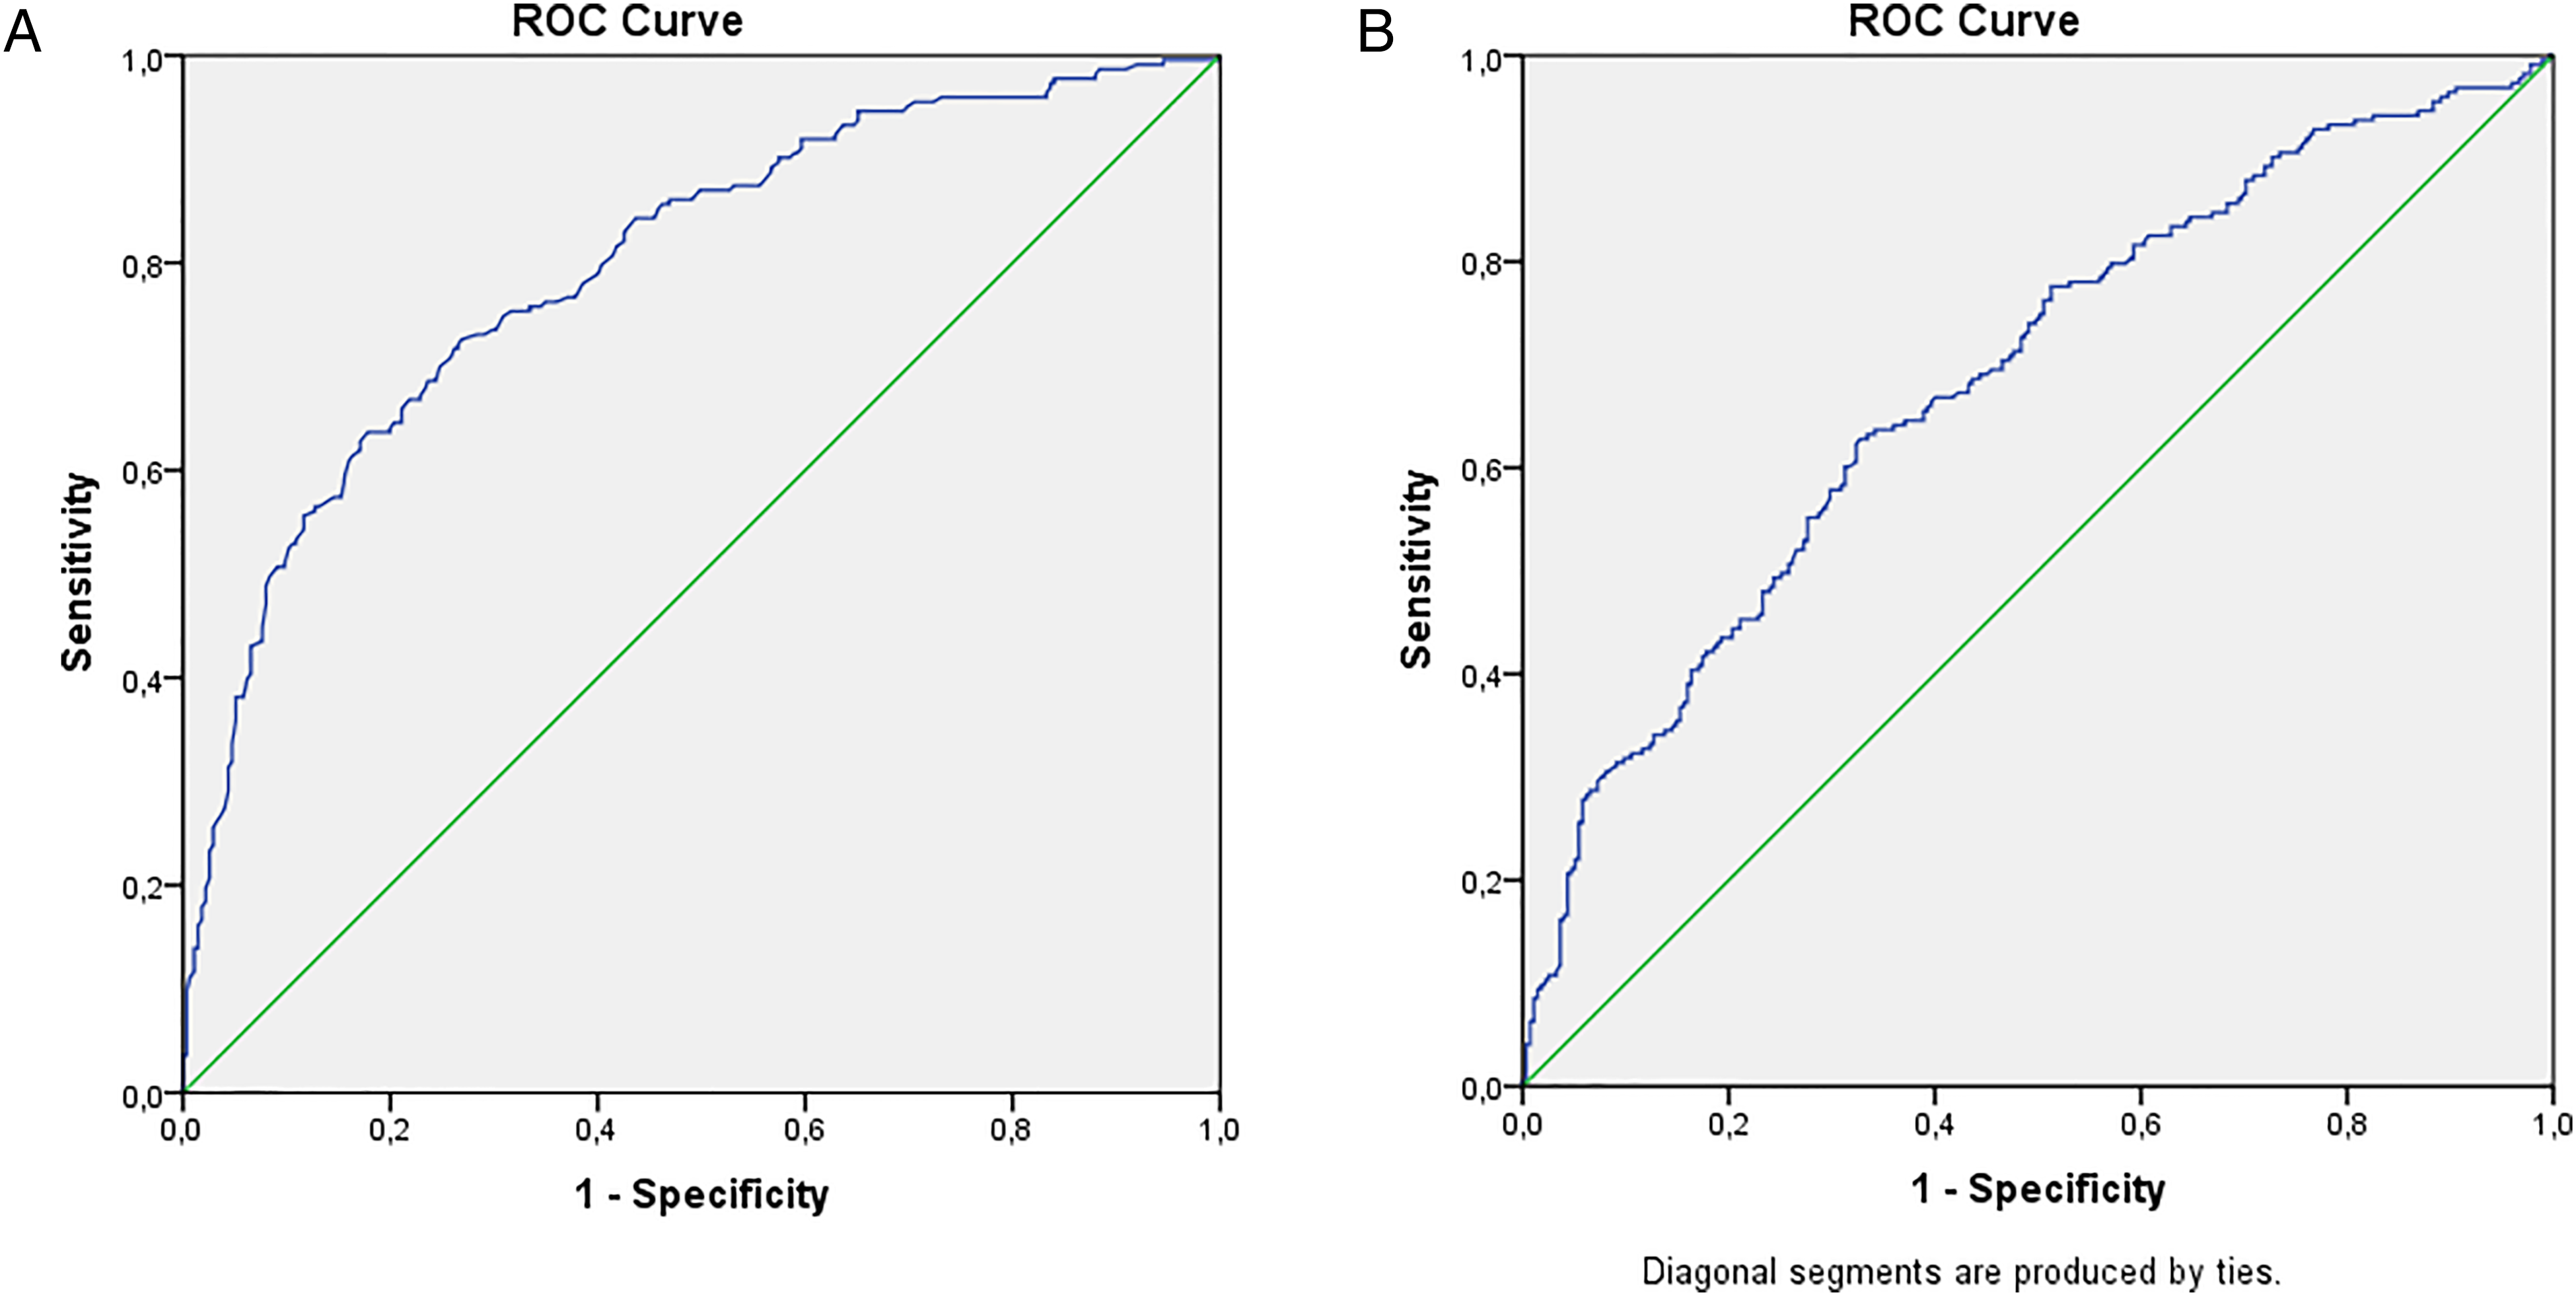
(A) Receiver operating characteristic (ROC) curve of DD to predict mortality. ROC analysis revealed a cut-off value of 2.83 mm (AUC = 0.796, 95% CI: 0.756-0.835, P < .001). (B) Receiver operating characteristic (ROC) curve of MI to predict the mortality. ROC analysis revealed a cut-off value of 41.33 cm2/m2 (AUC = 0.684, 95% CI: 0.637-0.731, P < .001).
Discussion
In this study, we evaluated whether BMD, DD, and MV could be used to predict mortality in patients admitted to ICU due to COVID-19. In the literature, there are positive and negative views concerning the use of these parameters in predicting the prognosis of COVID-19.13,18–21 Therefore, we considered that it was important to evaluate musculoskeletal parameters in the same population with largely similar etiological risk factors.
We determined that the BMD value was statistically significantly lower in the mortality group for both genders. The low BMD value, which we determined based on the lowest quartile, was statistically significant for the prediction of mortality in the univariate analysis. However, this statistical significance was lost when the multiple regression analysis was performed together with other variables. In a previous study, no significant relationship was reported between the presence of vertebral fractures and trabecular bone density and mortality in patients with COVID-19. 18 However, Kottler et al 22 stated that a low BMD was a risk factor for admission to ICU among patients with COVID-19. Similar to our study, the authors noted that BMD was not significant in the multiple regression analysis. In another study, it was reported that a low BMD was an independent risk factor for mortality according to the multiple regression analysis. 13 In light of these discrepancies in the literature, Ran et al 23 suggested that BMD was an age-dependent variable that should be evaluated according to age ranges. In their study, they did not find a significant relationship in low age groups, and they stated that in the group aged over 60 years, having a high BMD was protective against COVID-19, and BMD could be used to predict ICU admission. 23 In the current study, we found a moderate correlation between age and BMD, but a low BMD value was not statistically significant for predicting. In a recent cohort study, it was found that osteoporosis, not osteopenia, resulted in a higher risk of sepsis and infection compared to normal BMD. 24 The findings of our study, on the other hand, indicate that a low BMD value was a risk factor for mortality in the whole sample, but BMD cannot be used as a predictor of mortality. However, in our study, the median BMD value was measured as 151.51 HU for the whole population, and 142.12 HU for the men and 129.3 HU for the women in the mortality group. These values suggest that BMD was not very low in our study population. Therefore, we may not have included the osteoporotic group, which has a significantly lower BMD and may have prognostic effects, as a separate group in our study. In this regard, when evaluated together with the literature data, we consider that future studies providing data indicating that BMD can be used to predict the prognosis of COVID-19 in the presence of low BMD values suggesting osteoporosis can further contribute to the literature.
Sarcopenia is a parameter that has been investigated in the literature in relation to many diseases and clinical conditions. It has been reported that the length of hospital stay and mortality increase in critically ill patients and trauma cases.25,26 In our study, we also found that MV and MI were statistically significantly lower in the mortality group. Also in the multiple regression analysis, low MI statistical significance was valid. There were many studies in the literature that obtained similar or opposite results to our research. In a study that performed pectoral muscle area measurements, it was reported that MI was significantly associated with intubation, prolonged hospitalization, and mortality in the multiple regression analysis. However, there were only 8 patients in the mortality group. 19 Similarly, in a recent meta-analysis study of 1059 patients, it was concluded that a low MV could be used as a predictor of mortality. 27 Schiaffino et al reached similar results in their study. 28 In another study conducted with US, the volume of the psoas muscle was measured at the time of hospitalization, and it was reported that this parameter could be used to predict mortality due to COVID-19 within 30 days. 29
In a study conducted with 93 patients, Kim et al concluded that sarcopenia was a risk factor for mortality and long hospital stay but not an independent factor for mortality. 30 In a multicenter study evaluating 1138 patients, although the MI and MV values were higher in the survivor group, no muscle parameter obtained from CT was associated with negative outcomes related to COVID-19. 20 Similar negative results were found in other studies for both the whole sample and patients aged over 65 years.31,32 There may be many reasons for these discrepancies. First, sarcopenia and MV reduction is a process with multifactorial causes. In addition, patient populations in studies show much heterogeneity in terms of age and clinical status. Previous studies included patients that presented to the outpatient clinic or emergency department, or critically ill patients as in our study.19,20,32 In the literature, it is reported that the annual rate of skeletal muscle loss is approximately 0.1% to 0.5% per year from the age of 30 years, and this rate increases dramatically after the age of 65 years. 33 In previous research, the mean age of patients varies between 48 and 65 years.19,28
It can be considered that the correlation of sarcopenia with age may have caused the MV or MI variable to be excluded from the multiple regression analysis in some studies. Another parameter that may lead to these results is the time from contracting COVID-19 to CT scan. In a previous study, MV measurement was performed on CT in patients during 2 pandemic waves. A statistical relationship was found between MV and the severity of COVID-19 only in the first wave. The authors attributed this to delayed hospital presentations in the first wave of the pandemic due to the health policies implemented. 34 In another prospective study, in which MV was measured with CT, it was shown that acute MV loss was associated with negative clinical outcomes. 35 Based on all these data, we suggest that the MI value should be considered as an indicator of mortality despite the presence of many confounding factors.
It is known that diaphragm dysfunction is associated with negative outcomes in patients with sepsis and pneumonia. 10 Although the causes of diaphragm dysfunction are diverse, studies evaluating diaphragm morphology and thickness with imaging methods in healthy individuals have shown that these parameters contribute to the evaluation of diaphragm function.36,37 In the current study, DD was statistically lower in both genders in the mortality group. In addition, a low DD parameter was statistically significant in the multiple regression analyses. The literature presents similar results. In a study conducted with CT, a thin diaphragm was found to be associated with mortality and an independent predictor for serious disease, while another study showed a relationship between a thin diaphragm and long hospital stay.21,38 In a study in which diaphragm thickness was reported to be lower in the mechanical ventilation and mortality groups, the cut-off values were determined as 3.35 and 3.275 mm, respectively.39 Parlak et al 21 found the cut-off value of diaphragm thickness as 3.67 mm for ICU admission and 3.47 mm for mortality. Many studies conducted with US also indicated that DD was lower in the severe patient group, 40 while the diaphragm was thinner in patients that developed complications, 9 and mechanical ventilation and mortality could be predicted by a diaphragm examination performed within 12 h of hospitalization. 41 Our results are in agreement with the literature data. We determined that DD could be used as an independent risk factor and determined the cut-off value of this parameter as 2.83 mm in the prediction of mortality. Our lower cut-off value compared to the literature may be due to our patient population consisting of those requiring ICU.
Our study had several limitations. The first and most important limitation concerns the retrospective and single-center design. Second, although we evaluated ICC, the measurements were made by a single observer. Third, despite our measurements being parallel to those described for thorax CT in the literature, abdominal CT examinations are primarily used for MV and BMD. Fourth, we excluded CT examinations with artefacts that could affect our measurements, but we had to include patients that could not perform optimal inspiration since our study population consisted of patients requiring intensive care, which may have affected our measurements. Another limitation is that if there were any ICU cases that were not suitable for a clinical CT examination, this may have created a bias in sample selection. Finally, MV data were not supported by any physical strength measurement. Therefore, we can only state that COVID-19 prognosis had a relationship with MV, our results are not sufficient to comment on its relationship with sarcopenia.
Conclusions
We found that BMD, MV, and DD measurements were lower in the mortality group among severe COVID-19 cases admitted to ICU. Although there are different results in the literature, we consider that BMD is a risk factor for mortality in severe COVID-19 cases but cannot be used as an independent risk factor. Finally, supporting the literature, the MI and DD measurements can be used as an independent predictor of mortality even in cases of severe COVID-19. We consider that our study is important in that it presented all these parameters evaluated in the same patient population. Prospective studies investigating these parameters in a larger patient population grouped by age range can further contribute to the literature.
Footnotes
Declaration of Conflicting Interests
The author(s) declared no potential conflicts of interest with respect to the research, authorship, and/or publication of this article.
Funding
The author(s) received no financial support for the research, authorship, and/or publication of this article.