
Abstract
Background
Accurate assessment of organ dysfunction is essential for risk stratification in critically ill patients. The traditional Sequential Organ Failure Assessment score (SOFA-1) is widely used but reflects clinical practices from the 1990s. The updated SOFA-2 incorporates revised thresholds aligned with current organ-support strategies; however, its prognostic performance in infection-focused intensive care unit (ICU) populations remains uncertain. We compared SOFA-1 and SOFA-2 for predicting 28-day mortality in ICU patients undergoing blood culture acquisition ≥48 h after admission.
Methods
We conducted a retrospective cohort study of adult ICU patients who underwent blood culture sampling ≥48 h after ICU admission between June 2022 and August 2024. SOFA-1 and SOFA-2 scores were calculated at the time of index blood culture. Mortality prediction was assessed using receiver operating characteristic analysis with paired DeLong comparisons. Associations with 28-day mortality were examined using logistic regression and Cox proportional hazards models adjusted for age and comorbidity burden. Clinical utility was evaluated using decision curve analysis.
Results
Among 403 patients, 28-day mortality was 54%. SOFA-2 scores were lower than SOFA-1 in 70% of patients, resulting in frequent downward reclassification across severity strata. Discriminative performance for 28-day mortality was similar for SOFA-1 and SOFA-2 (AUC 0.707 vs 0.700; ΔAUC = 0.007; p = .031). Calibration and net clinical benefit were comparable between scores. In adjusted time-to-event analyses, only the very severe category (>10) was independently associated with mortality in both scoring systems, with a numerically higher hazard ratio for SOFA-2.
Conclusions
In this infection-triggered ICU cohort, SOFA-2 did not demonstrate consistent prognostic superiority over SOFA-1 for 28-day mortality prediction. Despite systematic score redistribution, overall discrimination and clinical utility were similar, with any apparent advantage of SOFA-2 confined to the highest-risk subgroup. Further validation in infection-enriched ICU populations is warranted.
Keywords
Introduction
Sepsis remains one of the leading causes of morbidity and mortality among patients admitted to intensive care units (ICUs) worldwide. 1 Gram-negative bacterial infections, in particular, are characterized by a rapidly progressing systemic inflammatory response and a high propensity for multiorgan failure, substantially increasing the risk of death in critically ill patients. 2 These features underscore the need for accurate early assessment of organ dysfunction and objective tools for predicting clinical outcomes. 3 Among the scoring systems developed for this purpose, the Sequential Organ Failure Assessment (SOFA) score provides a quantitative measure of organ dysfunction and has been incorporated as a core component of modern sepsis definitions. 4 Its widespread use for risk stratification and prognostication in critically ill patients has established SOFA as one of the fundamental tools in modern intensive care practice. 5
The original Sequential Organ Failure Assessment score (SOFA, hereafter referred to as SOFA-1) evaluates dysfunction across six organ systems—respiratory, cardiovascular, central nervous system, hepatic, renal, and hematologic. Each system is assigned 0 to 4 points, yielding a total score ranging from 0 to 24. 6 However, the variables, thresholds, and decision rules underlying SOFA-1 largely reflect ICU practices of the 1990s and may not adequately capture current patterns of vasopressor use, ventilatory management, and other organ support strategies. These limitations, together with known inconsistencies in certain scoring components, have prompted calls to update the score to better align with modern intensive care practice. 7
In response to this need, Ranzani et al developed and validated an updated Sequential Organ Failure Assessment (SOFA-2) score using data from more than 3 million adult ICU admissions across 1319 units in 9 countries. SOFA-2 retains the original six organ systems but revises variables and cut-off values to incorporate modern organ support therapies and to better align score categories with observed mortality risk. In a large, heterogeneous ICU population, SOFA-2 demonstrated similar or slightly higher discrimination for ICU mortality compared with SOFA-1. 8 However, these validation efforts have primarily focused on unselected general ICU cohorts, and the performance of SOFA-2 has not been evaluated in high-risk, infection-focused subgroups particularly among critically ill patients undergoing blood culture acquisition. 8
In routine ICU practice, the time of blood culture sampling represents a clinically meaningful decision point. At this moment, empiric antimicrobial therapy and key organ-support interventions are often initiated or escalated.9,10 Anchoring SOFA assessment to this index timepoint therefore provides a pragmatic framework for evaluating prognostic performance in an infection-triggered ICU population.
This study aimed to compare the ability of SOFA-1 and SOFA-2 to predict 28-day mortality in critically ill patients undergoing blood culture acquisition ≥48 h after ICU admission. In addition, subgroup analyses were performed to assess the discriminative performance of both scores in patients with and without documented gram-negative growth. By focusing on this infection-triggered ICU cohort, our study addresses an important gap in SOFA-2 validation and provides context-specific evidence relevant to infection-driven organ dysfunction.
Materials and Methods
Study Design and Setting
This retrospective, single-center cohort study was conducted in the adult ICUs of a tertiary-care training and research hospital in Türkiye. The study period covered June 2022 to August 2024. We identified all adult ICU patients who underwent blood culture sampling ≥48 h after ICU admission during the study period. The time of blood culture acquisition was selected as the index time point, representing a clinically meaningful moment of diagnostic escalation and potential modification of antimicrobial and organ-support therapies. Clinical and laboratory data were obtained through structured extraction from the institutional electronic health record system. The study was approved by the institutional ethics committee (Approval No: 3250; Date: 23 December 2025).
Eligibility Criteria
Inclusion Criteria
Patients were eligible if they met all of the following criteria:
Age ≥18 years Admission to the ICU At least one blood culture obtained ≥48 h after ICU admission
Microbiologic Restrictions
To create a pathogen-restricted analytic cohort while maintaining clinical relevance, predefined microbiologic restrictions were applied. Episodes with gram-positive bacterial growth, fungal growth, or polymicrobial infections (ie, gram-negative plus any additional non–gram-negative organism) were excluded. This approach reduced pathogen-related heterogeneity while preserving the clinically relevant spectrum of infection-triggered ICU episodes.
Culture-negative episodes were retained, as culture-negative sepsis represents a substantial proportion of ICU sepsis presentations. Retaining these cases preserved the clinically relevant infection spectrum and allowed evaluation of SOFA-1 and SOFA-2 performance within an infection-triggered ICU population.
Contamination was defined based on microbiology laboratory classification and the absence of documentation supporting a clinically significant bloodstream infection in the medical record.
Additional Exclusion Criteria
Patients were additionally excluded if they had:
Insufficient clinical or laboratory data to calculate SOFA-1 or SOFA-2 Repeat infectious episodes or multiple qualifying blood culture events during the same ICU admission
The final analytic cohort therefore consisted of patients with either (1) confirmed gram-negative bloodstream infection or (2) no gram-negative growth (including sterile cultures and laboratory-reported contaminants).
Each patient was included only once, using the first qualifying blood culture as the index episode. Subsequent infectious episodes or repeat ICU admissions during the same hospitalization were not considered.
Data Collection and Variables
Demographic characteristics (age, sex), comorbidities, vital signs, vasopressor requirement, mechanical ventilation status, and laboratory parameters relevant to organ function were collected at the time of the index blood culture, defined as the first blood culture obtained ≥48 h after ICU admission. Comorbidity burden was summarized using the Charlson Comorbidity Index, derived from documented comorbid conditions in the electronic health record. 11
Microbiological information—including blood culture results and organism identification—was extracted from the institutional microbiology information system. For analytic purposes, blood culture outcomes were classified into two groups: (1) gram-negative growth and (2) no gram-negative growth. The latter category included both sterile cultures and laboratory-reported contaminants, consistent with the subgroup structure of the study.
Physiologic and laboratory variables required for SOFA scoring were obtained from the electronic health record within a prespecified ±12-h window around the index blood culture time point. The most abnormal value within this interval was used for scoring. Organ support modalities—including vasopressor therapy, mechanical ventilation, and renal replacement therapy—were recorded simultaneously. All patient data were extracted electronically, and identifiers were removed after extraction and before analysis.
SOFA-1 and SOFA-2 Scoring
The original Sequential Organ Failure Assessment (SOFA-1) score was calculated according to the standard definitions for six organ systems (respiratory, cardiovascular, central nervous system, hepatic, renal, and hematologic), each graded from 0 to 4, yielding a total score of 0–24. 6
The updated SOFA-2 score was computed following the revised framework published by Ranzani et al, which retains the same organ systems but incorporates modern variables and contemporary thresholds that better reflect current patterns of organ support in the ICU. 8
For both SOFA-1 and SOFA-2, physiologic and laboratory measurements were obtained within a prespecified ±12-h window around the index blood culture time point. The most abnormal (worst) value within this interval was used for scoring. Organ support modalities (eg, vasopressors, mechanical ventilation, renal replacement therapy) were incorporated into each scoring algorithm as defined. All SOFA-2 components, thresholds, and scoring rules were applied exactly as described in the original publication.
Severity Categories
To enable descriptive comparisons and reclassification analyses, both SOFA-1 and SOFA-2 total scores were grouped into five a priori–defined severity strata. Because no universally accepted categorical thresholds exist for SOFA scoring in the literature, these strata were defined before data analysis. These cut-offs are not part of the official SOFA-2 framework but were selected to provide clinically interpretable ranges across the full SOFA score spectrum and to facilitate direct category-to-category comparison between SOFA-1 and SOFA-2. The same thresholds were applied to both scoring systems to ensure internal consistency and to avoid post hoc optimization of category boundaries. This approach also allowed systematic assessment of reclassification patterns and mortality risk gradients.
Low: 0–1 Mild: 2–4 Moderate: 5–7 Severe: 8–10 Very severe: >10
Outcomes
The primary outcome was 28-day all-cause mortality, defined as death occurring within 28 days of the index blood culture time. Secondary outcomes included 7-day, 14-day, and in-hospital mortality, each determined from the hospital electronic medical records. In addition to these predefined clinical outcomes, subgroup analyses were planned to compare the discriminative performance of SOFA-1 and SOFA-2 in patients with documented gram-negative growth versus those with no gram-negative growth in the index blood culture.
Statistical Analysis
Baseline characteristics were summarized using medians and interquartile ranges (IQRs) for continuous variables and frequencies with percentages for categorical variables. Normality of continuous variables was assessed using the Shapiro–Wilk test and visual inspection of histograms. Group comparisons were performed using the Mann–Whitney U test or Kruskal–Wallis test for continuous variables and the chi-square test or Fisher's exact test for categorical variables, as appropriate.
Primary Analysis (28-day Mortality)
The discriminative ability of SOFA-1 and SOFA-2 for predicting 28-day mortality was assessed using receiver operating characteristic (ROC) curves and the area under the ROC curve (AUC). AUCs were compared using DeLong's test for paired data. 12 ROC analyses treated the SOFA-1 and SOFA-2 total scores as continuous predictors.
Multivariable logistic regression models were fitted to evaluate the independent association between SOFA scores and 28-day mortality, adjusting for age and comorbidity burden (Charlson Comorbidity Index). Age and Charlson Comorbidity Index were selected as adjustment variables based on their established role as independent determinants of mortality in critically ill populations. Both variables were also significantly associated with 28-day mortality in univariable analyses within the cohort (age p < .001; CCI p = .001). Variables directly reflecting acute organ dysfunction were not included to avoid adjustment for components already captured within the SOFA score. Survival over 28 days was examined using Kaplan–Meier curves. Hazard ratios were estimated using multivariable Cox proportional hazards models in which SOFA scores were modeled both as continuous variables and as prespecified categorical strata, adjusted for the same covariates.
Decision curve analysis (DCA) was performed to compare the net clinical benefit of SOFA-1 and SOFA-2 across a range of threshold probabilities for 28-day mortality, using predicted probabilities from the corresponding logistic regression models. 13
Assessment of Proportional Hazards and Complementary Survival Analyses
The proportional hazards assumption was formally evaluated using Schoenfeld residuals and global testing procedures. Because categorical specifications of SOFA scores indicated potential deviation from strict proportionality, complementary Restricted Mean Survival Time (RMST) analyses were performed as a sensitivity approach. RMST estimates the average survival time within a prespecified truncation time (τ = 28 days) and does not rely on the proportional hazards assumption.
For RMST analyses, a threshold of 8 points was applied for dichotomized comparisons. This threshold corresponds to the transition between moderate and severe categories and approximates the cohort median. Its selection was further supported by ROC-based assessment, showing sensitivities of 70.5% for SOFA-1 and 65.4% for SOFA-2 for predicting 28-day mortality. Detailed threshold performance metrics are provided in Supplementary Table S1.
Secondary Analyses (7-day, 14-day, and in-Hospital Mortality)
For 7-day, 14-day, and in-hospital mortality, only ROC curves, AUC estimation, and DeLong comparisons were performed. No regression-based or survival modeling was conducted for these endpoints.
Subgroup Analysis
Subgroup analyses compared the discriminative performance of SOFA-1 and SOFA-2 in patients with documented gram-negative bloodstream infection versus those with no gram-negative growth, using ROC curves and AUC comparisons only. Consistent with the study design, sterile cultures and laboratory-reported contaminants were analyzed together in the “no gram-negative growth” group. This grouping was prespecified to contrast confirmed gram-negative bloodstream infection with the absence of gram-negative growth in the index culture. These subgroup comparisons were performed across all mortality endpoints (7-day, 14-day, 28-day, and in-hospital).
Calibration Assessment
Calibration performance of SOFA-1 and SOFA-2 for 28-day mortality was evaluated using LOESS-smoothed calibration curves and Brier scores. Predicted probabilities for calibration analyses were obtained from the corresponding logistic regression models for each scoring system. Both unscaled and scaled Brier scores were reported. The scaled Brier score was calculated as 1 – (Brier / Brier_reference), where the reference Brier corresponded to the observed event rate model.
Missing Data and Statistical Software
Patients with missing data required for SOFA-1 or SOFA-2 calculation were excluded (complete-case analysis). Of 457 eligible patients, 54 (11.8%) were excluded due to insufficient data to calculate SOFA components within the prespecified index time window. This resulted in a final analytic cohort of 403 patients. No imputation was performed. All analyses were conducted using R version 4.5.1 (R Foundation for Statistical Computing, Vienna, Austria) within RStudio version 2024.12. 14 A two-sided p-value <.05 was considered statistically significant.
Ethical Considerations
This study was conducted in accordance with the Declaration of Helsinki and was approved by the local institutional ethics committee (Approval No: 3250; Date: 23 December 2025). Patient identifiers were removed after data extraction and before analysis, and only de-identified data were used. Because the study was retrospective and used de-identified data, the requirement for informed consent was waived by the ethics committee.
Results
A total of 457 ICU patients were eligible; 403 were included in the final analysis after excluding 54 (11.8%) due to missing data required to calculate SOFA-1 or SOFA-2. Among the included patients, 111 had gram-negative growth in the index blood culture, whereas 292 had no gram-negative growth (sterile cultures or contaminants). Baseline characteristics at the time of the index blood culture are summarized in Table 1, and stratified comparisons by blood culture result are presented in Supplementary Table S2. The median age was 74 years, and the median Charlson Comorbidity Index was 5. Compared with patients with no gram-negative growth, those with gram-negative growth more frequently had a central venous catheter (83% vs 58%; p < .001). In contrast, empiric gram-negative antibiotic therapy was more common in the no gram-negative growth group (73% vs 59%; p = .015). Invasive mechanical ventilation was numerically more frequent in the gram-negative-growth group (79% vs 70%). SOFA-1 and SOFA-2 scores at the index culture timepoint were similarly elevated between groups. Overall 7-, 14-, and 28-day mortality rates were 30%, 43%, and 54%, respectively, and in-hospital mortality was 74%.
Baseline Characteristics of the Study Population at index Blood Culture.
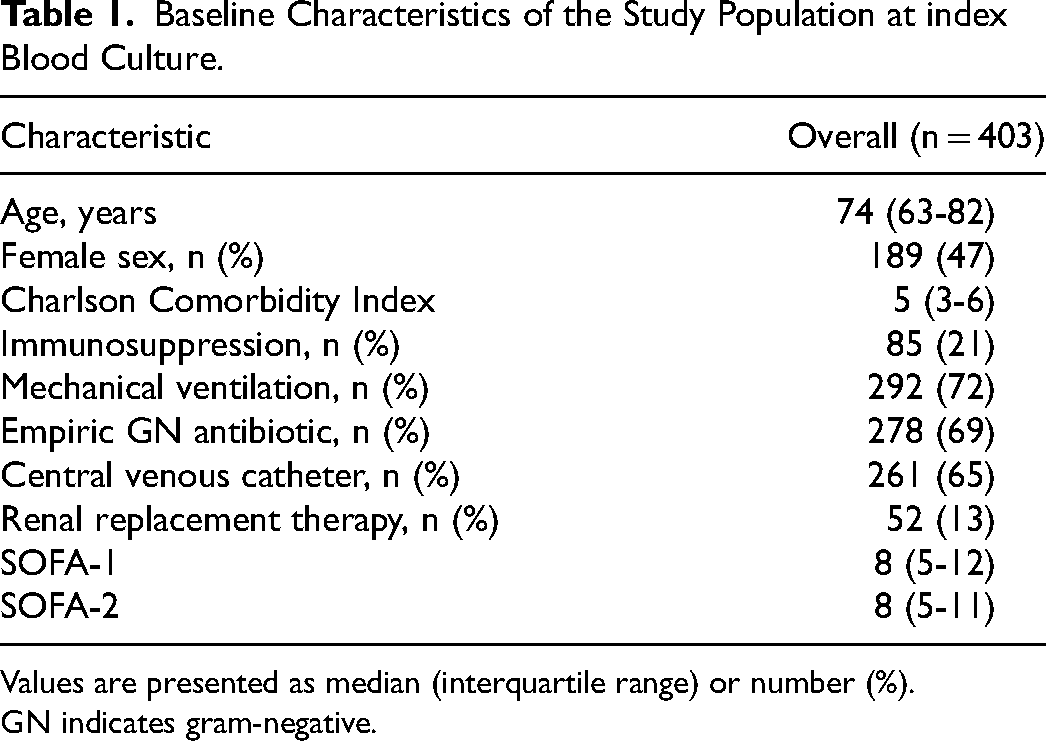
Values are presented as median (interquartile range) or number (%).
GN indicates gram-negative.
SOFA-2 total scores were lower than SOFA-1 in 284 patients (70.5%), identical in 116 (28.8%), and higher in 3 (0.7%). The joint distribution of SOFA-1 and SOFA-2 total scores is shown in Figure 1. Using the prespecified five-level severity strata (0-1 low, 2-4 mild, 5-7 moderate, 8-10 severe, >10 very severe), 330 patients (81.9%) remained in the same category. Downward reclassification under SOFA-2 occurred in 72 patients (17.9%), whereas upward reclassification was rare (n = 1). Risk-category reclassification from SOFA-1 to SOFA-2 is presented in Table 2.
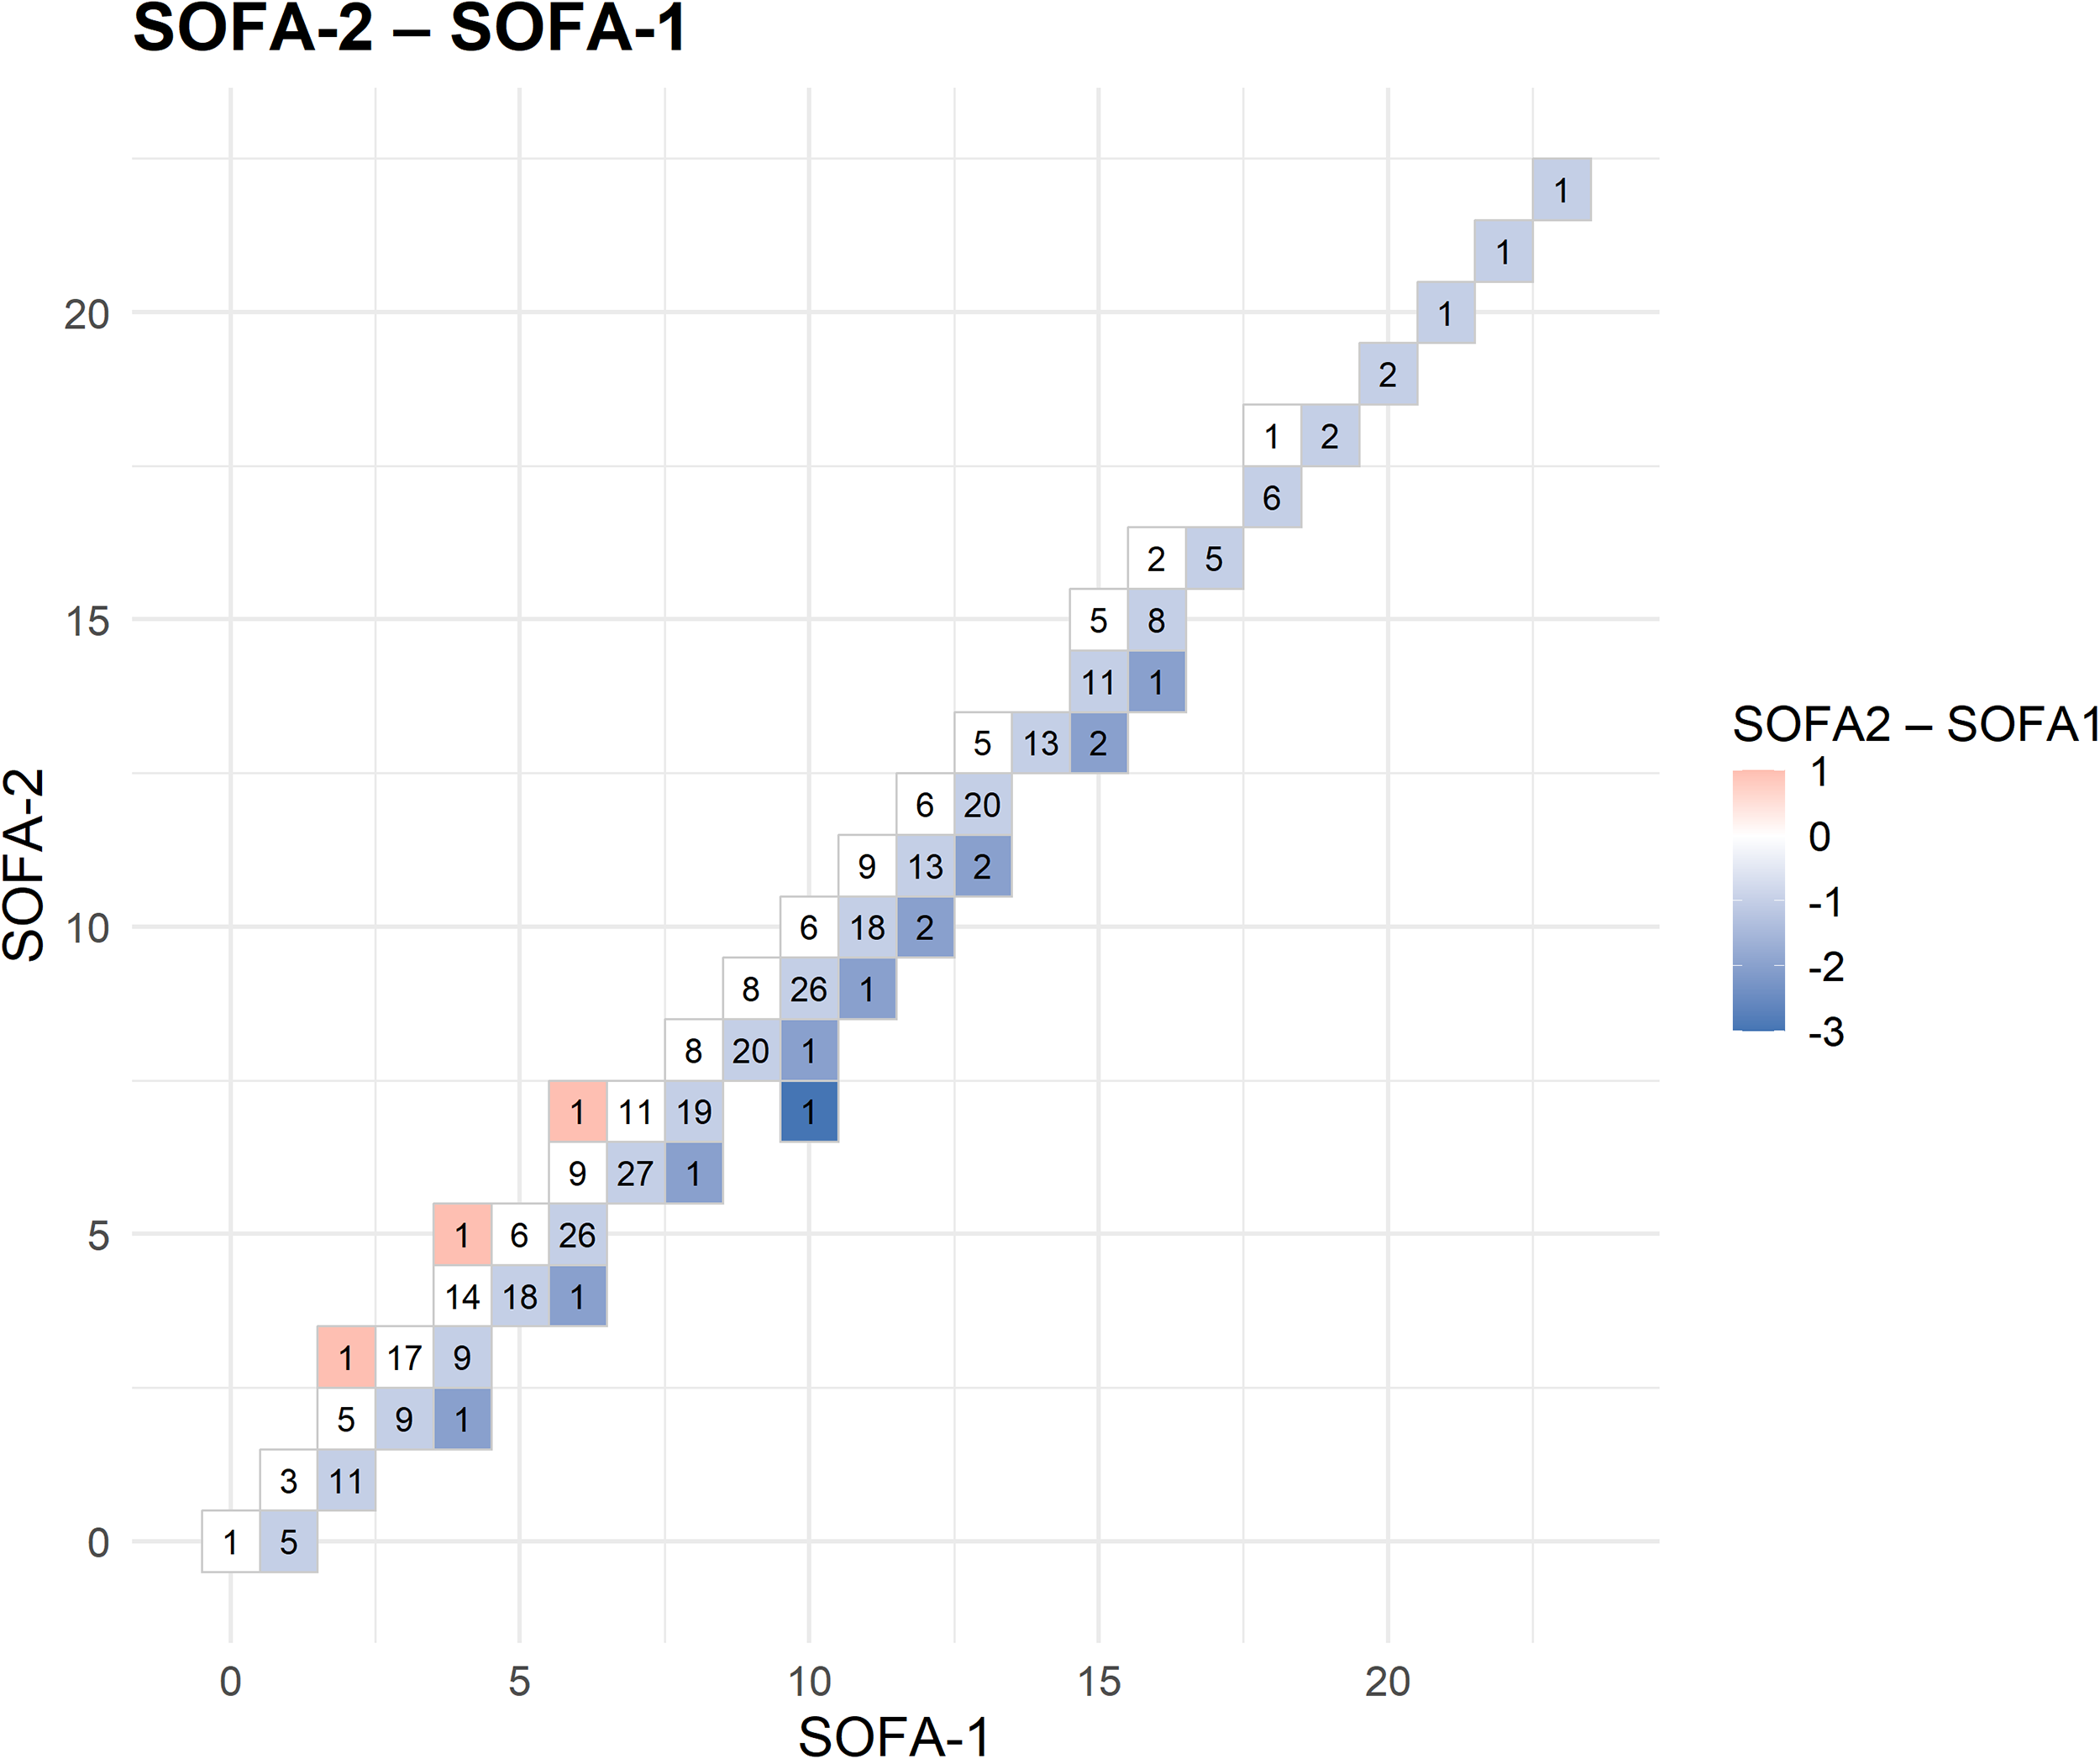
Distribution of Total SOFA-1 and SOFA-2 Scores at the Time of index Blood Culture (n = 403).
Reclassification of Five-Level Severity strata from SOFA-1 to SOFA-2.
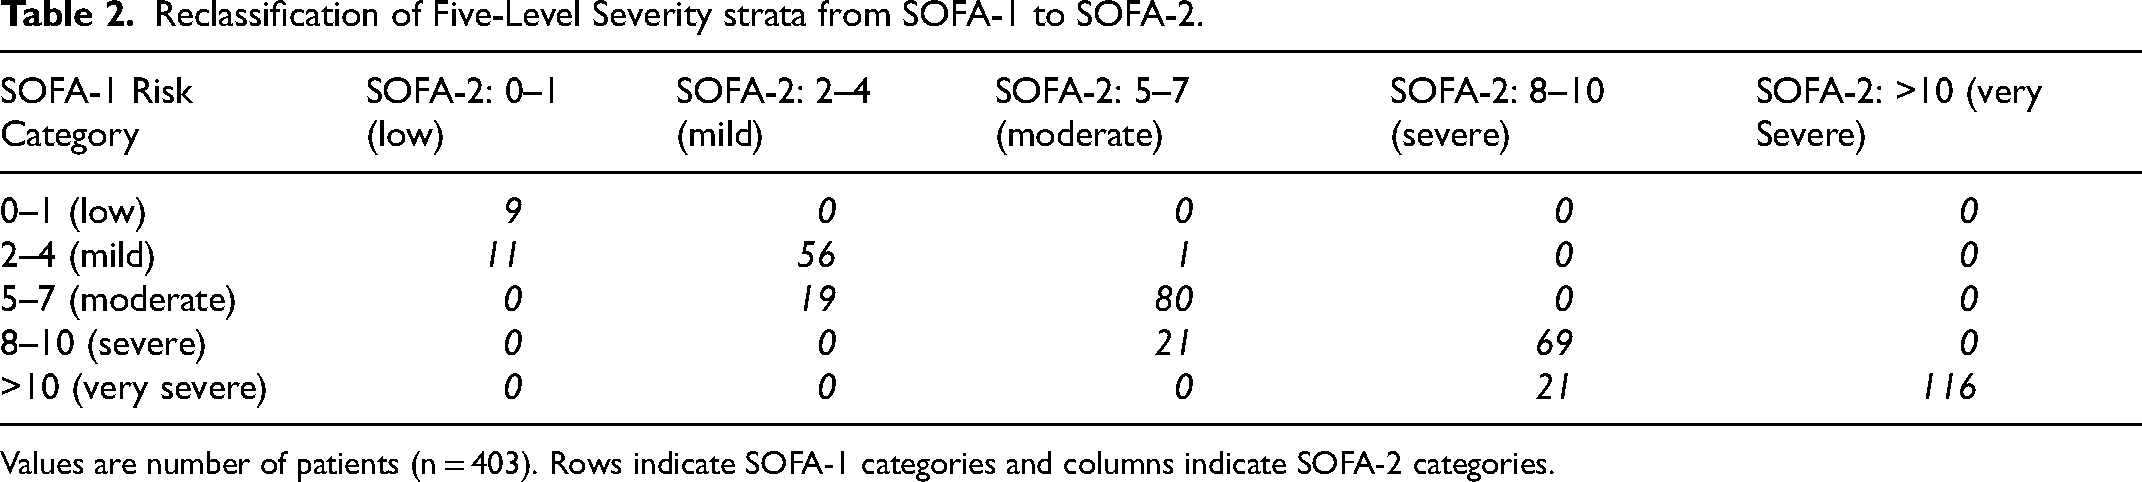
Values are number of patients (n = 403). Rows indicate SOFA-1 categories and columns indicate SOFA-2 categories.
Discriminative performance of SOFA-1 and SOFA-2 across mortality endpoints is presented in Table 3. For 28-day mortality, the AUC was 0.707 for SOFA-1 and 0.700 for SOFA-2, and for in-hospital mortality it was 0.709 versus 0.698, respectively. DeLong tests showed no statistically significant difference for 7-day or 14-day mortality. SOFA-1 showed slightly higher discrimination for 28-day (p = .031) and in-hospital mortality (p = .004); however, absolute differences were small (ΔAUC ≤0.012), suggesting limited clinical relevance.
Discriminative Performance of SOFA-1 and SOFA-2 for Mortality Outcomes.
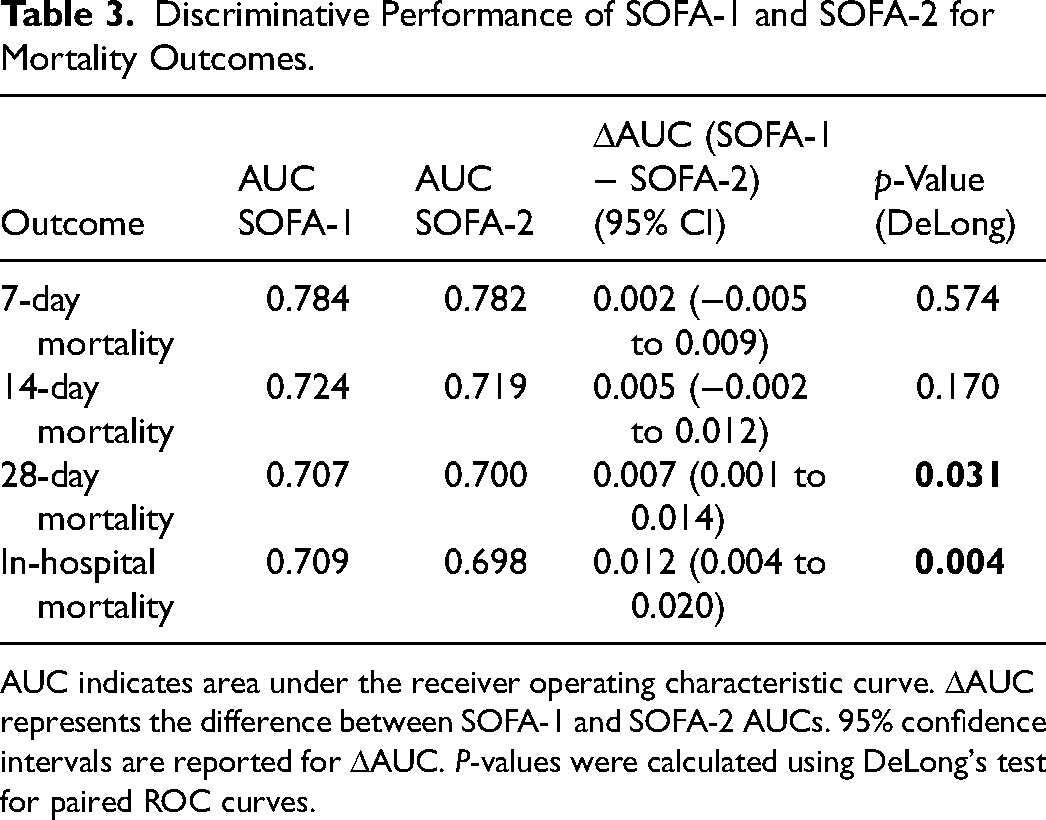
AUC indicates area under the receiver operating characteristic curve. ΔAUC represents the difference between SOFA-1 and SOFA-2 AUCs. 95% confidence intervals are reported for ΔAUC. P-values were calculated using DeLong's test for paired ROC curves.
Subgroup analyses stratified by gram-negative growth status showed comparable AUCs for SOFA-1 and SOFA-2 in both the gram-negative growth and no gram-negative growth groups, suggesting similar discriminative performance across microbiological subgroups. These results are reported in Supplementary Table S3.
In multivariable Cox proportional hazards models adjusted for age and Charlson Comorbidity Index, SOFA-1 and SOFA-2 showed similar associations with 28-day mortality. When modeled as continuous variables, each 1-point increase in SOFA-1 or SOFA-2 was associated with a 14% higher hazard of death (HR 1.14; 95% CI 1.10-1.18; p < .001 for both). Corresponding continuous-model hazard ratios are illustrated in Supplementary Figure 1.
When severity categories were analyzed using the lowest category (0-1) as the reference, the mild (2-4), moderate (5-7), and severe (8-10) strata were not significantly associated with mortality in either scoring system. In contrast, the very severe stratum (>10) was associated with higher mortality risk, reaching statistical significance for both SOFA-1 (HR 2.91; 95% CI 1.07-7.94; p = .037) and SOFA-2 (HR 3.87; 95% CI 1.78-8.41; p < .001). Charlson Comorbidity Index remained independently associated with mortality (p < .01), while age showed borderline associations (p = .06). These results are summarized in Figure 2.
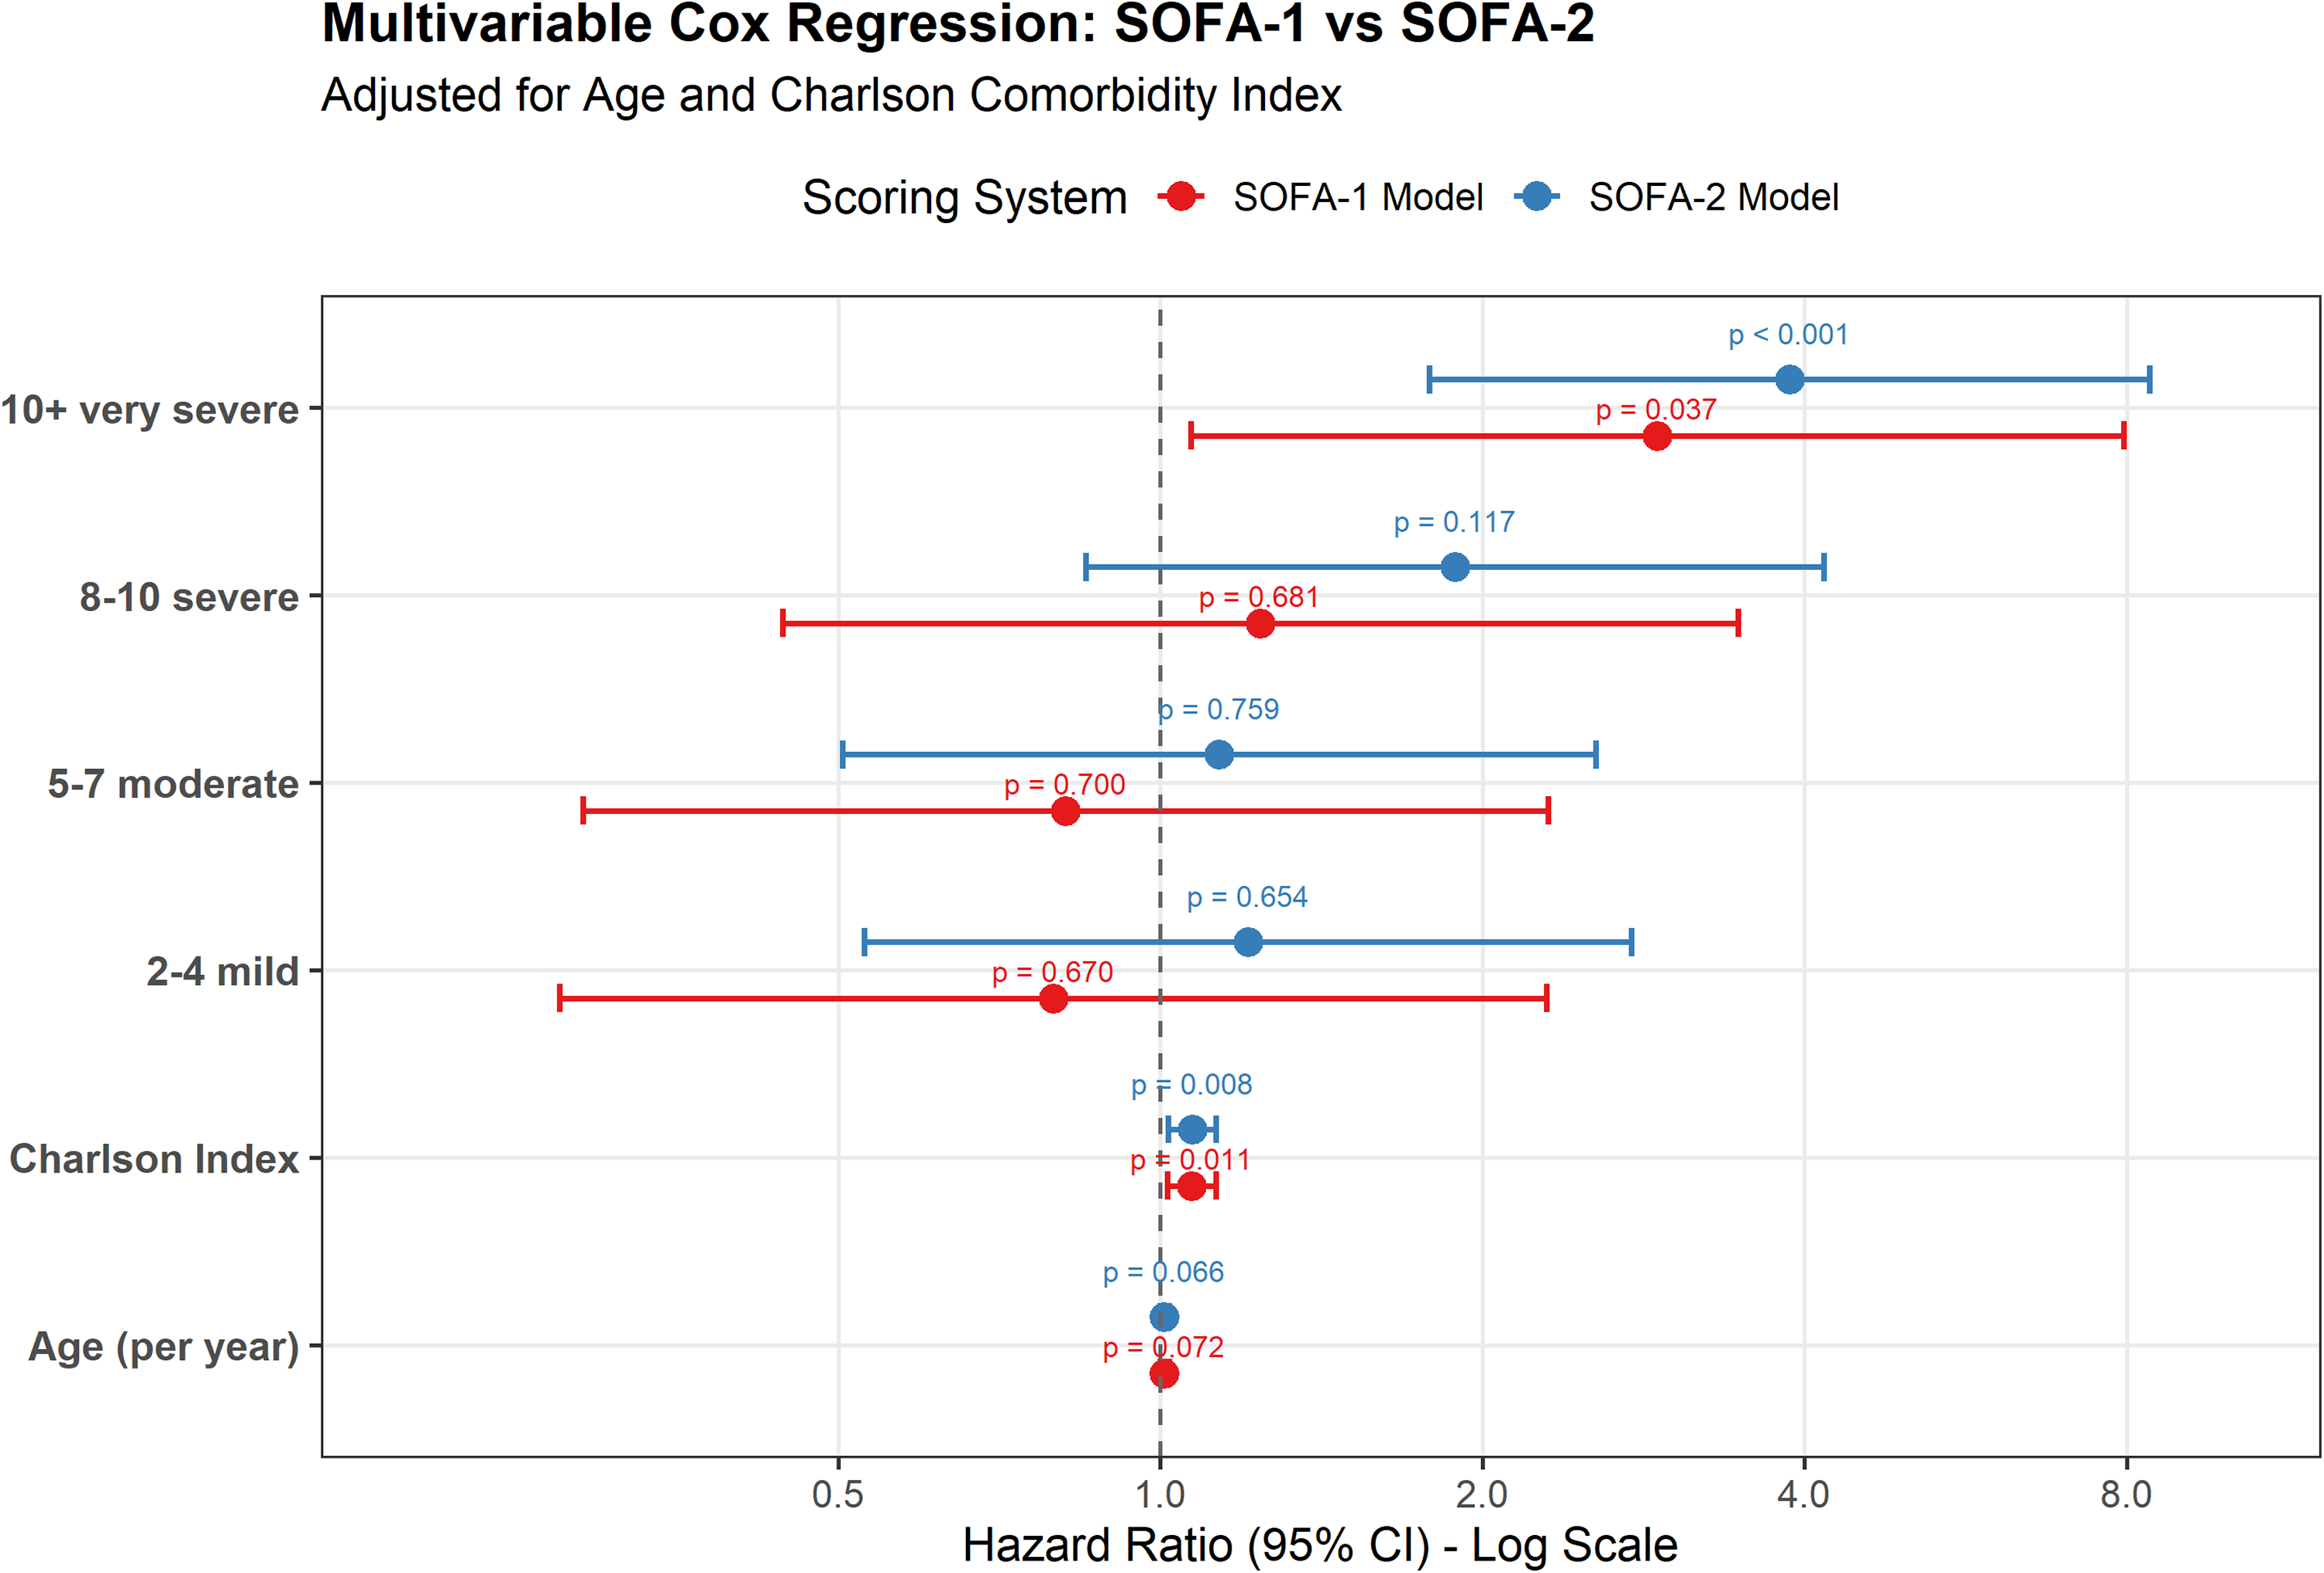
Adjusted Hazard Ratios for Mortality Across SOFA-1 and SOFA-2 Severity Categories.
The proportional hazards assumption was formally assessed using Schoenfeld residuals. The global Schoenfeld test indicated statistical deviation in categorical specifications of the SOFA models (Supplementary Table S4). However, inspection of scaled Schoenfeld residual plots did not demonstrate marked time-dependent instability within the 28-day follow-up period (Supplementary Figure S2-S3). Given the short time horizon and the stability of effect estimates, Cox regression results were retained as clinically interpretable measures of relative risk.
Complementary RMST analyses using a prespecified 28-day truncation time confirmed substantial survival differences between high- and lower-risk groups. For both SOFA-1 and SOFA-2, patients with scores ≥8 had approximately 7–8 fewer life-days within 28 days compared with those with scores <8 (all p < .001), consistent with the Cox regression findings. Detailed RMST estimates and between-group differences are presented in Supplementary Table S5, and the corresponding survival curves are shown in Supplementary Figure S4-S5. These findings were concordant with the logistic regression, discrimination, and calibration analyses.
Kaplan–Meier curves showed a stepwise decline in 28-day survival across increasing severity categories for both SOFA-1 and SOFA-2. Separation between the severe (8-10) and very severe (>10) strata appeared slightly greater under SOFA-2, suggesting marginally better risk stratification at the highest severity levels. Corresponding Kaplan–Meier curves are provided in Supplementary Figures 6–7.
In multivariable logistic regression adjusted for age and Charlson Comorbidity Index, each 1-point increase in SOFA-1 or SOFA-2 total score was associated with higher odds of 28-day mortality (OR 1.19; 95% CI 1.13-1.26; for both models). Predicted probabilities from these models were used for calibration and decision-curve analyses.
Calibration for 28-day mortality showed similar agreement between predicted and observed risks for the SOFA-1 and SOFA-2 logistic models (Supplementary Figure 8). Calibration plots did not indicate major departures from ideal calibration for either model. Overall predictive accuracy was comparable, with Brier scores of 0.206 versus 0.209 and scaled Brier scores of 0.170 versus 0.161 for the SOFA-1 and SOFA-2 models, respectively.
Decision curve analysis showed that both SOFA-1 and SOFA-2 provided greater net benefit than the “treat all” and “treat none” strategies across clinically relevant threshold probabilities (Figure 3). Net benefit was similar at low thresholds (5-30%), and the curves largely overlapped across the range. At intermediate and higher thresholds, minor fluctuations between the curves were observed, but no consistent separation favoring either model was evident. Overall, the two models demonstrated very similar clinical utility, with no consistent or clinically meaningful superiority of either score.
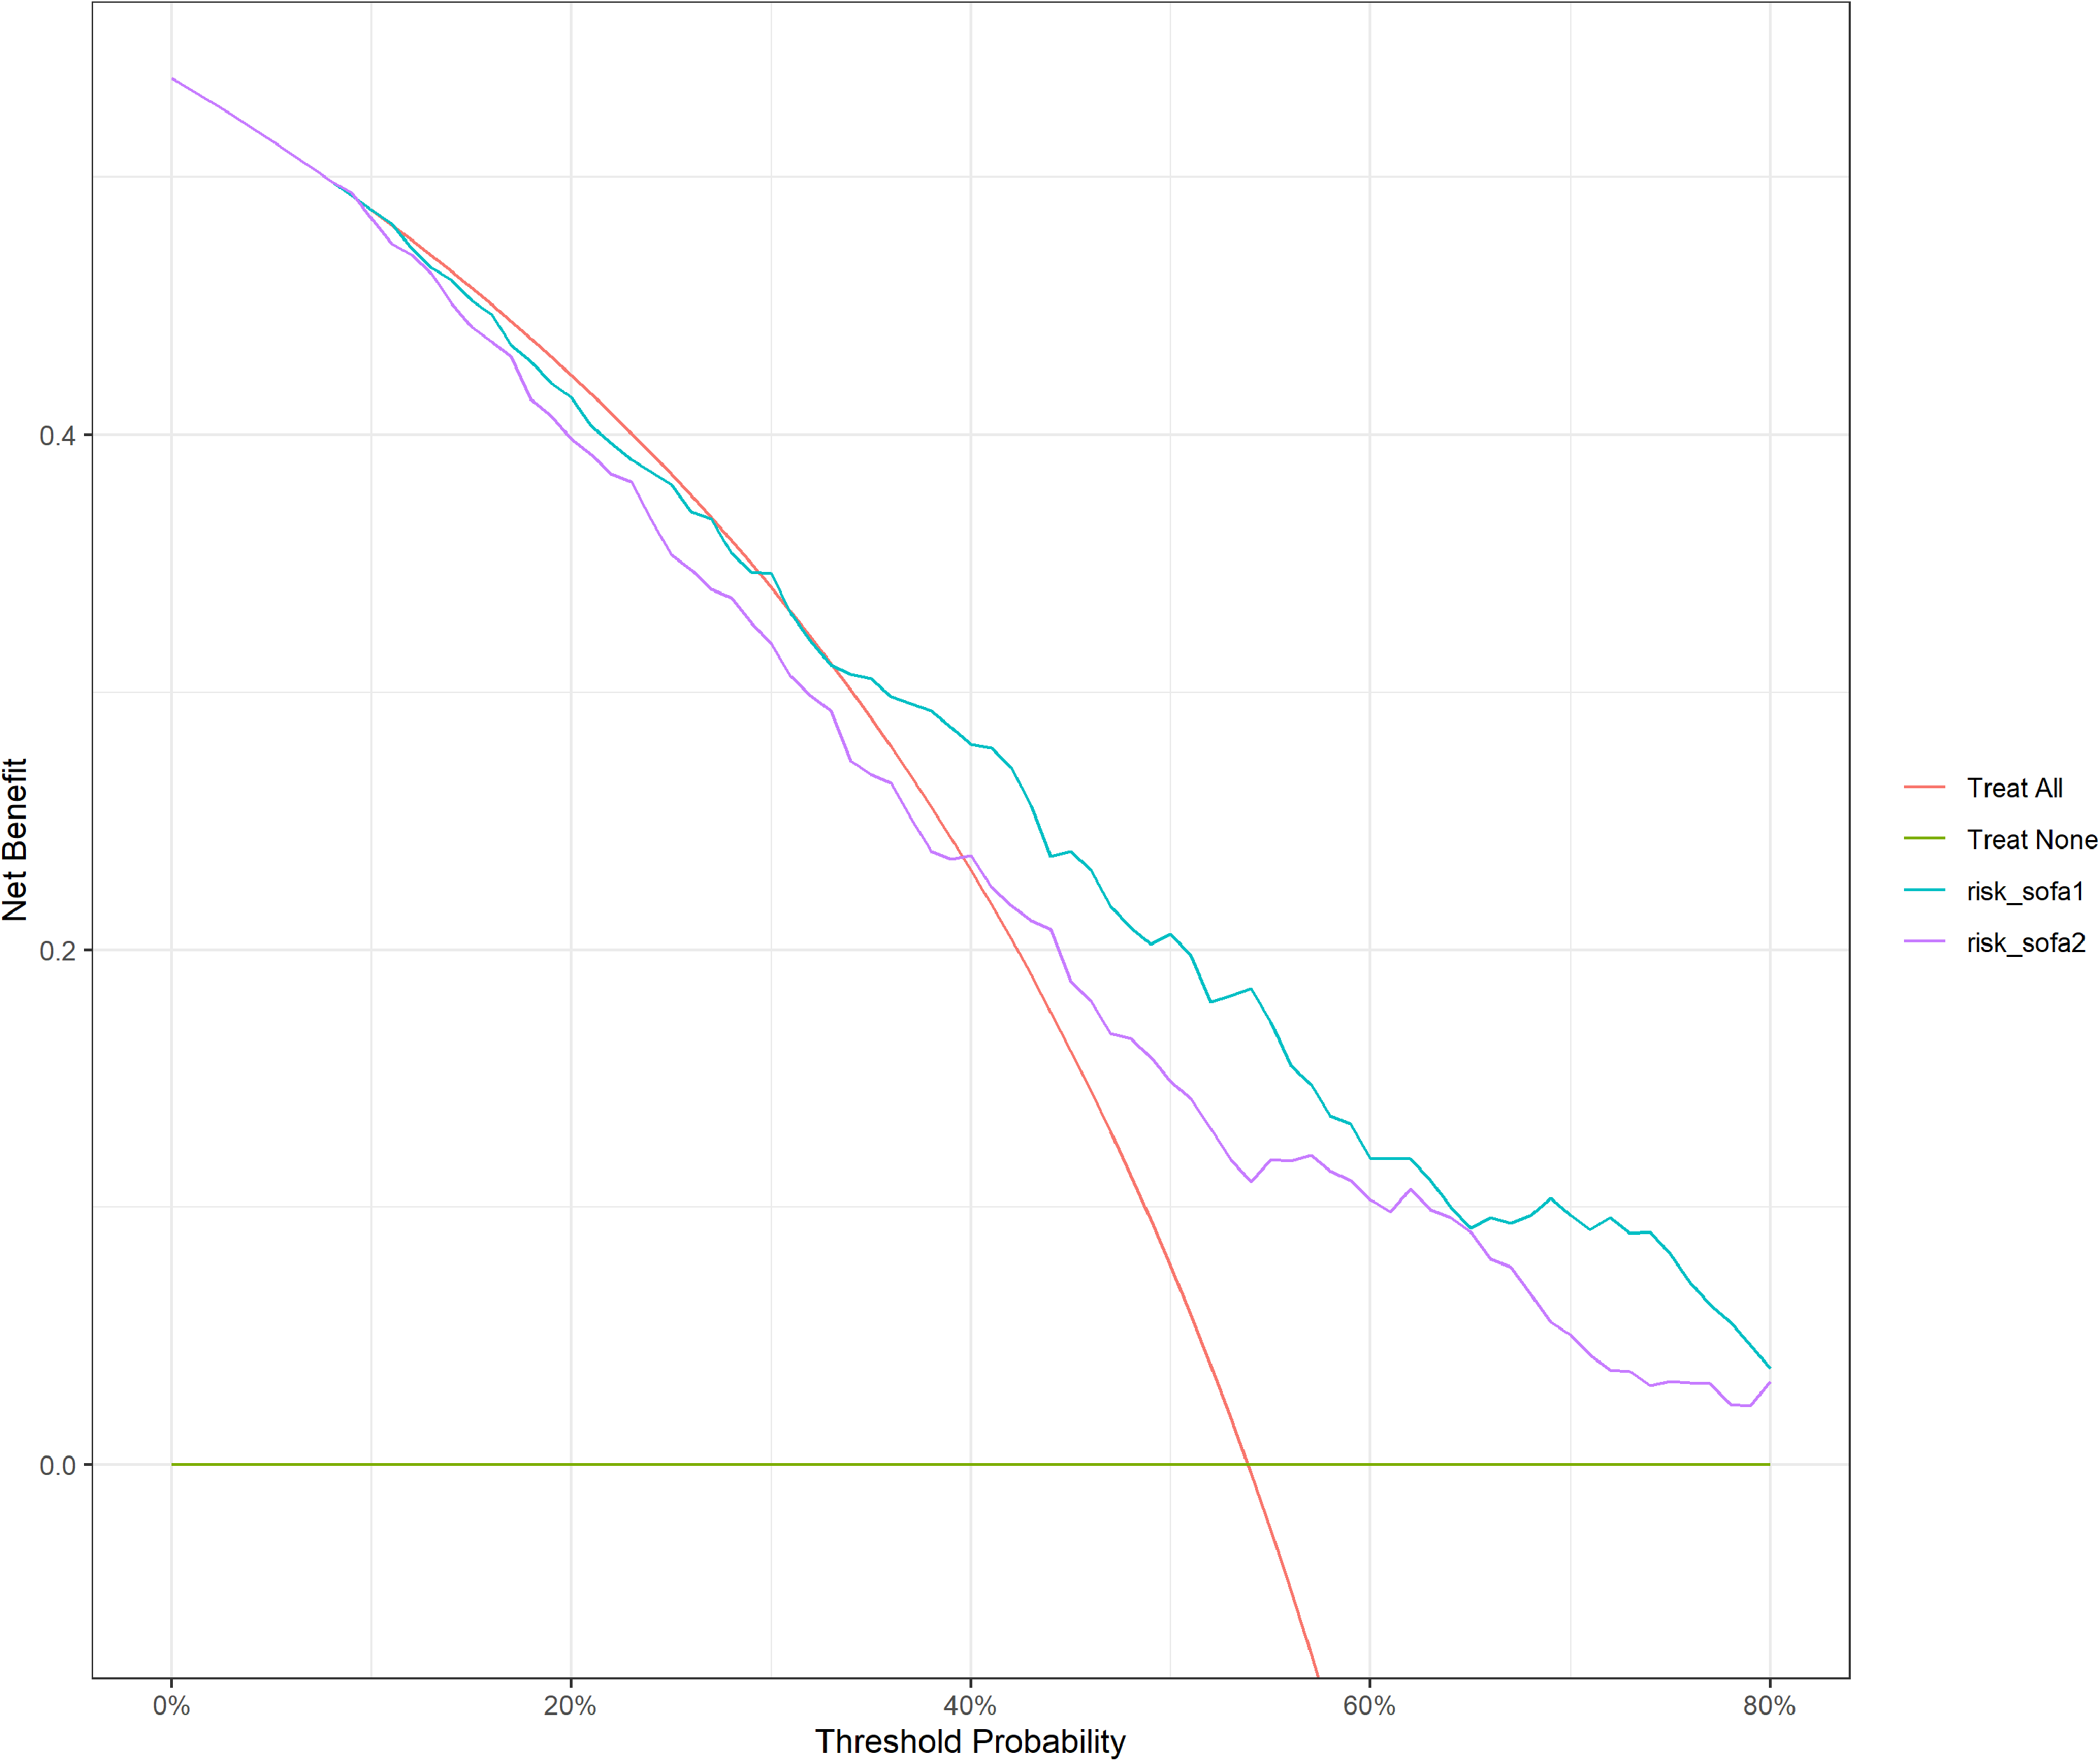
Decision Curve Analysis of the Clinical Utility of SOFA-1 and SOFA-2 for Predicting 28-day Mortality.
Discussion
In this retrospective cohort of critically ill patients undergoing blood culture acquisition ≥48 h after ICU admission, we found that the updated SOFA-2 score did not demonstrate meaningful prognostic superiority over the traditional SOFA-1 score for predicting 28-day mortality. Across multiple complementary performance domains—including discrimination, calibration, time-to-event analyses, and decision curve analysis—both scoring systems showed largely comparable ability to stratify mortality risk. Although SOFA-2 incorporates revised thresholds intended to better reflect contemporary organ support practices, these modifications did not translate into consistently improved prognostic performance in this high-risk, infection-focused ICU population.
SOFA-2 was developed through a structured consensus and data-driven update of the original SOFA framework, with the explicit goal of aligning organ dysfunction thresholds with modern ICU monitoring and organ support practices. 15 In the multinational development and validation study including more than 3.3 million ICU encounters, SOFA-2 demonstrated a modest improvement in discrimination for ICU mortality compared with SOFA-1 (AUC 0.79 vs 0.77), in a setting where ICU mortality was 8.1% overall. 8 In contrast, mortality risk in infection-enriched ICU populations is substantially higher. In the ICON international audit, overall ICU mortality was 16.2% and in-hospital mortality was 22.4%, increasing to 25.8% (ICU) and 35.3% (hospital) among patients with sepsis. 16 More infection-specific cohorts report similarly high short-term mortality: in the EUROBACT-2 cohort of ICU hospital-acquired bloodstream infections, 28-day mortality was 37.1%, and in the Turkish ICU subanalysis, 28-day all-cause mortality was 49.1%.17,18 Consistent with this high-risk case-mix, 28-day mortality in our infection-triggered ICU cohort was 54%. In our cohort, discrimination for 28-day mortality was similar between SOFA-1 and SOFA-2 (AUC 0.707 vs 0.700). The absolute difference in discrimination was minimal. These findings suggest that the modest discrimination gain reported for SOFA-2 in unselected ICU cohorts may be attenuated in infection-enriched settings and not consistently reproduced.
At the time of index blood culture sampling, illness severity in our cohort was substantial, with a median SOFA-1 of 8 (IQR 5-12) and a median SOFA-2 of 8 (IQR 5-11). Comparable SOFA levels have been reported in ICU-acquired bloodstream infection cohorts in which SOFA is explicitly anchored to the onset/diagnosis of bacteremia. For example, in a multicenter ICU-acquired bloodstream infection cohort, median SOFA at onset was 8 (IQR 5-11), closely mirroring the distribution observed in our patients. 19 Likewise, in the Turkish ICU subanalysis of the EUROBACT-2 hospital-acquired bloodstream infection cohort, the overall SOFA at diagnosis was 8 (IQR 6-11), with higher values among 28-day non-survivors (9 [IQR 6-12]), consistent with a high-severity case mix. 18 In contrast, the SOFA-2 development/validation work reports lower median SOFA values when assessed by ICU day (eg, medians around 5-6 across ICU days 1-3), reflecting both earlier time points and a broader ICU case mix rather than an infection-triggered assessment window. 8 Although such cross-study comparisons must be interpreted cautiously given differences in timing, inclusion criteria, and baseline risk, they underscore that our analysis was conducted in a particularly high-risk, infection-triggered window. This context is important for interpreting both absolute score distributions and the limited incremental gain observed with threshold recalibration.
Within this high-risk context, the most prominent difference between SOFA-2 and SOFA-1 was a systematic redistribution of scores at the time of index blood culture sampling. SOFA-2 totals were lower in most patients, resulting in frequent downward reclassification across the prespecified severity strata. This pattern is consistent with the intended recalibration of thresholds in SOFA-2 and has also been reported in the original development and validation work.8,15 Importantly, however, rescaling of score levels does not necessarily improve discrimination, particularly when score construction remains sensitive to practice variation in organ-support use and to nonrandom missingness in laboratory measurements—issues highlighted as ongoing challenges in the SOFA-2 framework. 20 Clinically, this redistribution may shift severity labeling and cutoff-based categorization (ie, who crosses commonly used thresholds), even when risk ranking and net clinical utility remain broadly similar.
Despite the largely comparable performance of SOFA-1 and SOFA-2, our time-to-event analyses suggested a more distinct risk separation at the upper end of severity. When categorized using prespecified strata, only the very severe category (>10) was independently associated with 28-day mortality, reaching statistical significance for both scoring systems, with a numerically higher hazard ratio observed under SOFA-2 (HR 3.87 vs 2.91), although confidence intervals overlapped and overall discrimination remained similar. Likewise, Kaplan–Meier curves suggested visually clearer separation between the severe and very severe strata under SOFA-2. Although formal testing of the proportional hazards assumption suggested statistical deviation in categorical models, visual inspection of Schoenfeld residuals did not indicate pronounced time-dependent effects within the 28-day horizon. Complementary RMST analyses yielded concordant findings, supporting the robustness of the time-to-event results. This pattern is clinically plausible, as organ dysfunction burden—as operationalized by SOFA—is central to contemporary sepsis risk stratification, and higher SOFA levels (and worsening trajectories) have been repeatedly linked to increased mortality risk.4,21 Moreover, SOFA-2 was explicitly designed to recalibrate thresholds to better align score strata with observed mortality gradients under modern organ-support practices.8,15 Because SOFA-2 assigns lower scores to many patients, high SOFA-2 values may capture a more selected subgroup with extreme organ dysfunction. This may help explain the clearer separation observed in the very severe (>10) category, even though overall discrimination and net clinical utility remained broadly similar.
ROC-based discrimination did not indicate a clinically meaningful separation between SOFA-1 and SOFA-2 in our cohort. Although SOFA-1 yielded statistically higher AUCs for 28-day and in-hospital mortality, the absolute differences were minimal (ΔAUC ≤0.012), suggesting limited practical impact on discrimination. Because AUC is sensitive to case-mix and baseline risk, absolute values should be interpreted cautiously, particularly when contrasted across populations and endpoints. 22 We therefore interpreted these AUC differences alongside prior SOFA-2 validation results and decision-analytic measures of clinical usefulness. In the original multinational SOFA-2 development and validation effort, SOFA-2 achieved only a modest improvement over SOFA-1 in a broad ICU population, 8 supported by an explicit operational framework intended to enhance reproducibility under current organ-support practices. 15 In our infection-triggered ICU cohort, this incremental gain was not reproduced. Calibration was also comparable between the two models. Similar LOESS calibration curves and nearly identical Brier scores (0.206 vs 0.209) and scaled Brier scores (0.170 vs 0.161) for the SOFA-1 and SOFA-2 models, respectively. Consistently, decision curve analysis showed largely overlapping net-benefit profiles across clinically relevant threshold probabilities.13,23 Collectively, these results suggest that, in this infection-enriched ICU setting, threshold revision alone is unlikely to yield a consistent, clinically decisive improvement in prognostic performance. A pragmatic transition approach—reporting SOFA-1 and SOFA-2 in parallel while crosswalk mappings and context-specific validation accumulate—may therefore be reasonable. 24
In subgroup analyses stratified by microbiological yield, the discriminative performance of SOFA-1 and SOFA-2 remained broadly similar in patients with gram-negative growth and in those without gram-negative growth (sterile cultures/contaminants), suggesting that our primary findings are not driven by culture status alone. This aligns with prior evidence that culture-negative sepsis or septic shock is common and that culture positivity is not consistently associated with mortality differences. These observations underscore that physiologic derangement and organ dysfunction burden often dominate short-term prognosis regardless of microbiological confirmation.25,26 Moreover, culture yield is influenced by pre-analytic factors—particularly antibiotic exposure before sampling—which can reduce blood-culture positivity and shift severely ill patients into the “no growth” stratum. 27 Taken together, these considerations suggest that microbiological confirmation may not fully capture short-term risk at the time of index blood culture acquisition. Rather, SOFA-based scoring primarily reflects acute physiologic and organ dysfunction severity. Accordingly, the similar performance of SOFA-2 and SOFA-1 across microbiological strata supports the robustness of our primary findings.
This study has several strengths. We compared SOFA-1 and SOFA-2 side-by-side at an infection-triggered time point (index blood-culture sampling ≥48 h after ICU admission). We also evaluated model performance across multiple complementary domains, including discrimination, calibration, time-to-event analyses, decision curve analysis, and reclassification patterns, with additional microbiology-stratified analyses.
Limitations include the retrospective single-center design, potential residual confounding, and limited generalizability. Because confirmed gram-positive and fungal bloodstream infections were excluded, the findings may not be directly generalizable to those etiologic groups. The cohort was defined based on blood-culture acquisition ≥48 h after ICU admission and was not restricted to a formally adjudicated infection diagnosis. The “no gram-negative growth” group included both sterile cultures and laboratory-reported contaminants. Culture yield may have been influenced by prior antibiotics and other pre-analytic factors. The complete-case approach (without imputation) may have introduced selection bias. In addition, SOFA was assessed in a single time window rather than across longitudinal trajectories.
Conclusions
In ICU patients undergoing blood-culture acquisition ≥48 h after ICU admission, SOFA-2 did not demonstrate a consistent prognostic advantage over SOFA-1 for predicting 28-day mortality. This finding was observed despite systematically lower score distributions and frequent downward reclassification under SOFA-2
Supplemental Material
sj-docx-1-jic-10.1177_08850666261435547 - Supplemental material for SOFA-2 Versus SOFA-1 for Mortality Prediction in Infection-Triggered ICU Patients
Supplemental material, sj-docx-1-jic-10.1177_08850666261435547 for SOFA-2 Versus SOFA-1 for Mortality Prediction in Infection-Triggered ICU Patients by Hakkı Meriç Türkkan, Umut Özgür, Olcay Dilken, Ahmet Doğukan Bayrak and Okan Derin in Journal of Intensive Care Medicine
Footnotes
Acknowledgements
The authors thank the Infectious Diseases and Intensive Care teams of Şişli Hamidiye Etfal Training and Research Hospital for their support during patient care and data collection.
During the preparation of this manuscript, the authors used AI-assisted tools to support language editing and improve readability. These tools were not used to generate, analyze, or interpret data, nor to create or alter any figures or images. The authors reviewed and edited the content as needed and take full responsibility for the content of the published article.
Authors’ Contributions (CRediT)
Conceptualization: H.M.T., O.D. Methodology: H.M.T., O.D., A.D.B. Investigation: U.Ö., H.M.T. Data curation: U.Ö., H.M.T., O.Di. Formal analysis: O.D., O.Di. Writing – original draft: H.M.T. Writing – review & editing: All authors Approval of final manuscript: All authors
Consent for Publication
Not applicable.
Data Availability
De-identified data are available from the corresponding author upon reasonable request, subject to institutional and ethical approvals.
Declaration of Conflicting Interests
The authors declared no potential conflicts of interest with respect to the research, authorship, and/or publication of this article.
Ethics Approval and Consent to Participate
This study was conducted in accordance with the Declaration of Helsinki and was approved by the local institutional ethics committee (Approval No: 3250; Date: 23 December 2025). Due to the retrospective design and use of de-identified data, the requirement for informed consent was waived.
Funding
The authors received no financial support for the research, authorship, and/or publication of this article.
Supplemental Material
Supplemental material for this article is available online.
References
Supplementary Material
Please find the following supplemental material available below.
For Open Access articles published under a Creative Commons License, all supplemental material carries the same license as the article it is associated with.
For non-Open Access articles published, all supplemental material carries a non-exclusive license, and permission requests for re-use of supplemental material or any part of supplemental material shall be sent directly to the copyright owner as specified in the copyright notice associated with the article.