
Abstract
Background
Acid–base disturbances are common in critically ill patients and provide immediate physiological insight and prognostic information. We aimed to characterize the epidemiology of specific acid–base patterns and to develop ABG-driven models for 28-day mortality.
Methods
We retrospectively analyzed 1150 critically ill adults with acid–base disorders identified from the first arterial blood gas (ABG) after ICU admission. The primary outcome was 28-day mortality. Three multivariable logistic regression models were developed: (1) a continuous model using physiological variables, (2) a pragmatic threshold-based model with Firth bias-reduced logistic regression, and (3) an ABG-only model. Discrimination (area under the receiver operating characteristic curve [AUC]), calibration, Brier score, and decision curve analysis (DCA) were reported with bootstrap optimism.
Results
Mixed acid–base disorders were the most prevalent (35.7%) and associated with high mortality (73.2%), while respiratory alkalosis also carried high mortality (69.6%). Non-survivors showed an apparently “normal” or higher pH (7.40 vs 7.30) despite marked hypocapnia and elevated lactate (4.8 vs 2.5 mmol/L). The continuous model achieved an AUC of 0.94 (optimism-corrected 0.88). The threshold model achieved an AUC of 0.85, with lactate > 4 mmol/L (adjusted odds ratio [aOR] 7.68) and sepsis (aOR 2.78) as dominant predictors. The ABG-only model maintained high discrimination (AUC 0.92; optimism-corrected 0.88) with acceptable calibration.
Conclusions
Routine ABG combined with basic clinical data at ICU admission enables accurate early mortality risk stratification in ICU patients. An apparently normal pH may conceal severe metabolic stress, emphasizing the need for integrated acid–base assessment in critical care.
Keywords
Background
Acid–base homeostasis represents a fundamental physiological process, and its disruption frequently complicates the clinical course of critically ill patients in intensive care units (ICUs). These disorders manifest through respiratory or metabolic pathways and commonly accompany life-threatening conditions such as sepsis, acute kidney injury, respiratory failure, and diabetic ketoacidosis. While serving as sensitive markers of disease severity, acid–base imbalances also actively contribute to poor clinical outcomes through direct effects on cellular metabolism, organ function, and hemodynamic stability. 1 This dual role, as both consequence and contributor to critical illness, underscores their clinical significance in ICU management.
Arterial blood gas (ABG) analysis remains the gold standard for diagnosing and monitoring acid–base disorders in critical care settings. The spectrum of disturbances ranges from isolated metabolic acidosis, often reflecting tissue hypoperfusion and lactic acidosis, to respiratory acidosis indicating ventilatory compromise, each with distinct pathophysiological implications. 2 Particularly challenging are mixed acid–base disorders, which may reflect multi-organ dysfunction and carry higher mortality risk.3,4 Despite their clinical importance, contemporary data on the epidemiology and prognostic implications of specific acid–base disturbances in ICU populations remain limited. Most available studies are restricted to small cohorts, selected subgroups, or lack detailed biochemical profiling.3,5,6
In nephrology practice, acid–base disorders are especially relevant because kidney dysfunction impairs acid excretion and bicarbonate regeneration, exacerbating systemic derangements. Understanding the prognostic thresholds of pH, lactate, and anion gap in ICU patients with and without underlying kidney disease can improve risk stratification and guide early interventions.
We therefore conducted a retrospective cohort study of 1150 ICU patients with documented acid–base disturbances. Our objectives were: first, to evaluate the epidemiology, clinical characteristics, and mortality outcomes associated with specific acid–base disorders in critically ill patients; second, to identify key independent biochemical and clinical predictors of 28-day mortality; and third, to investigate the complex interplay between pH, compensatory mechanisms, and lactate in determining patient risk, moving beyond a simplistic focus on acidemia alone.
Subjects and Methods
Study Design and Setting
We conducted a retrospective cohort study at a tertiary academic intensive care unit (ICU) of Minia University Hospital in Egypt, including consecutive adult admissions between January 2021 and December 2024. The study protocol was approved by the local Institutional Review Board of Faculty of Medicine, Minia University (approval number 1589/6/2025). Given the retrospective design and use of de-identified data, the requirement for written informed consent was waived. The study adhered to the Declaration of Helsinki and reported following the STROBE and TRIPOD recommendations for observational research.
Study Population
We screened consecutive adult MICU admissions (≥ 18 years) during the study period from January 2021 to December 2024 using the hospital electronic medical record. Eligible patients were required to have an arterial blood gas (ABG) obtained on admission with corresponding key electrolytes from the concurrent metabolic panel and an ascertainable 28-day outcome. We excluded admissions with missing critical laboratory data (particularly ABG and/or serum electrolytes), patients transferred from other facilities with incomplete records, and cases with unavailable outcome ascertainment. Participant screening and selection are summarized in the study flow diagram (Figure 1).
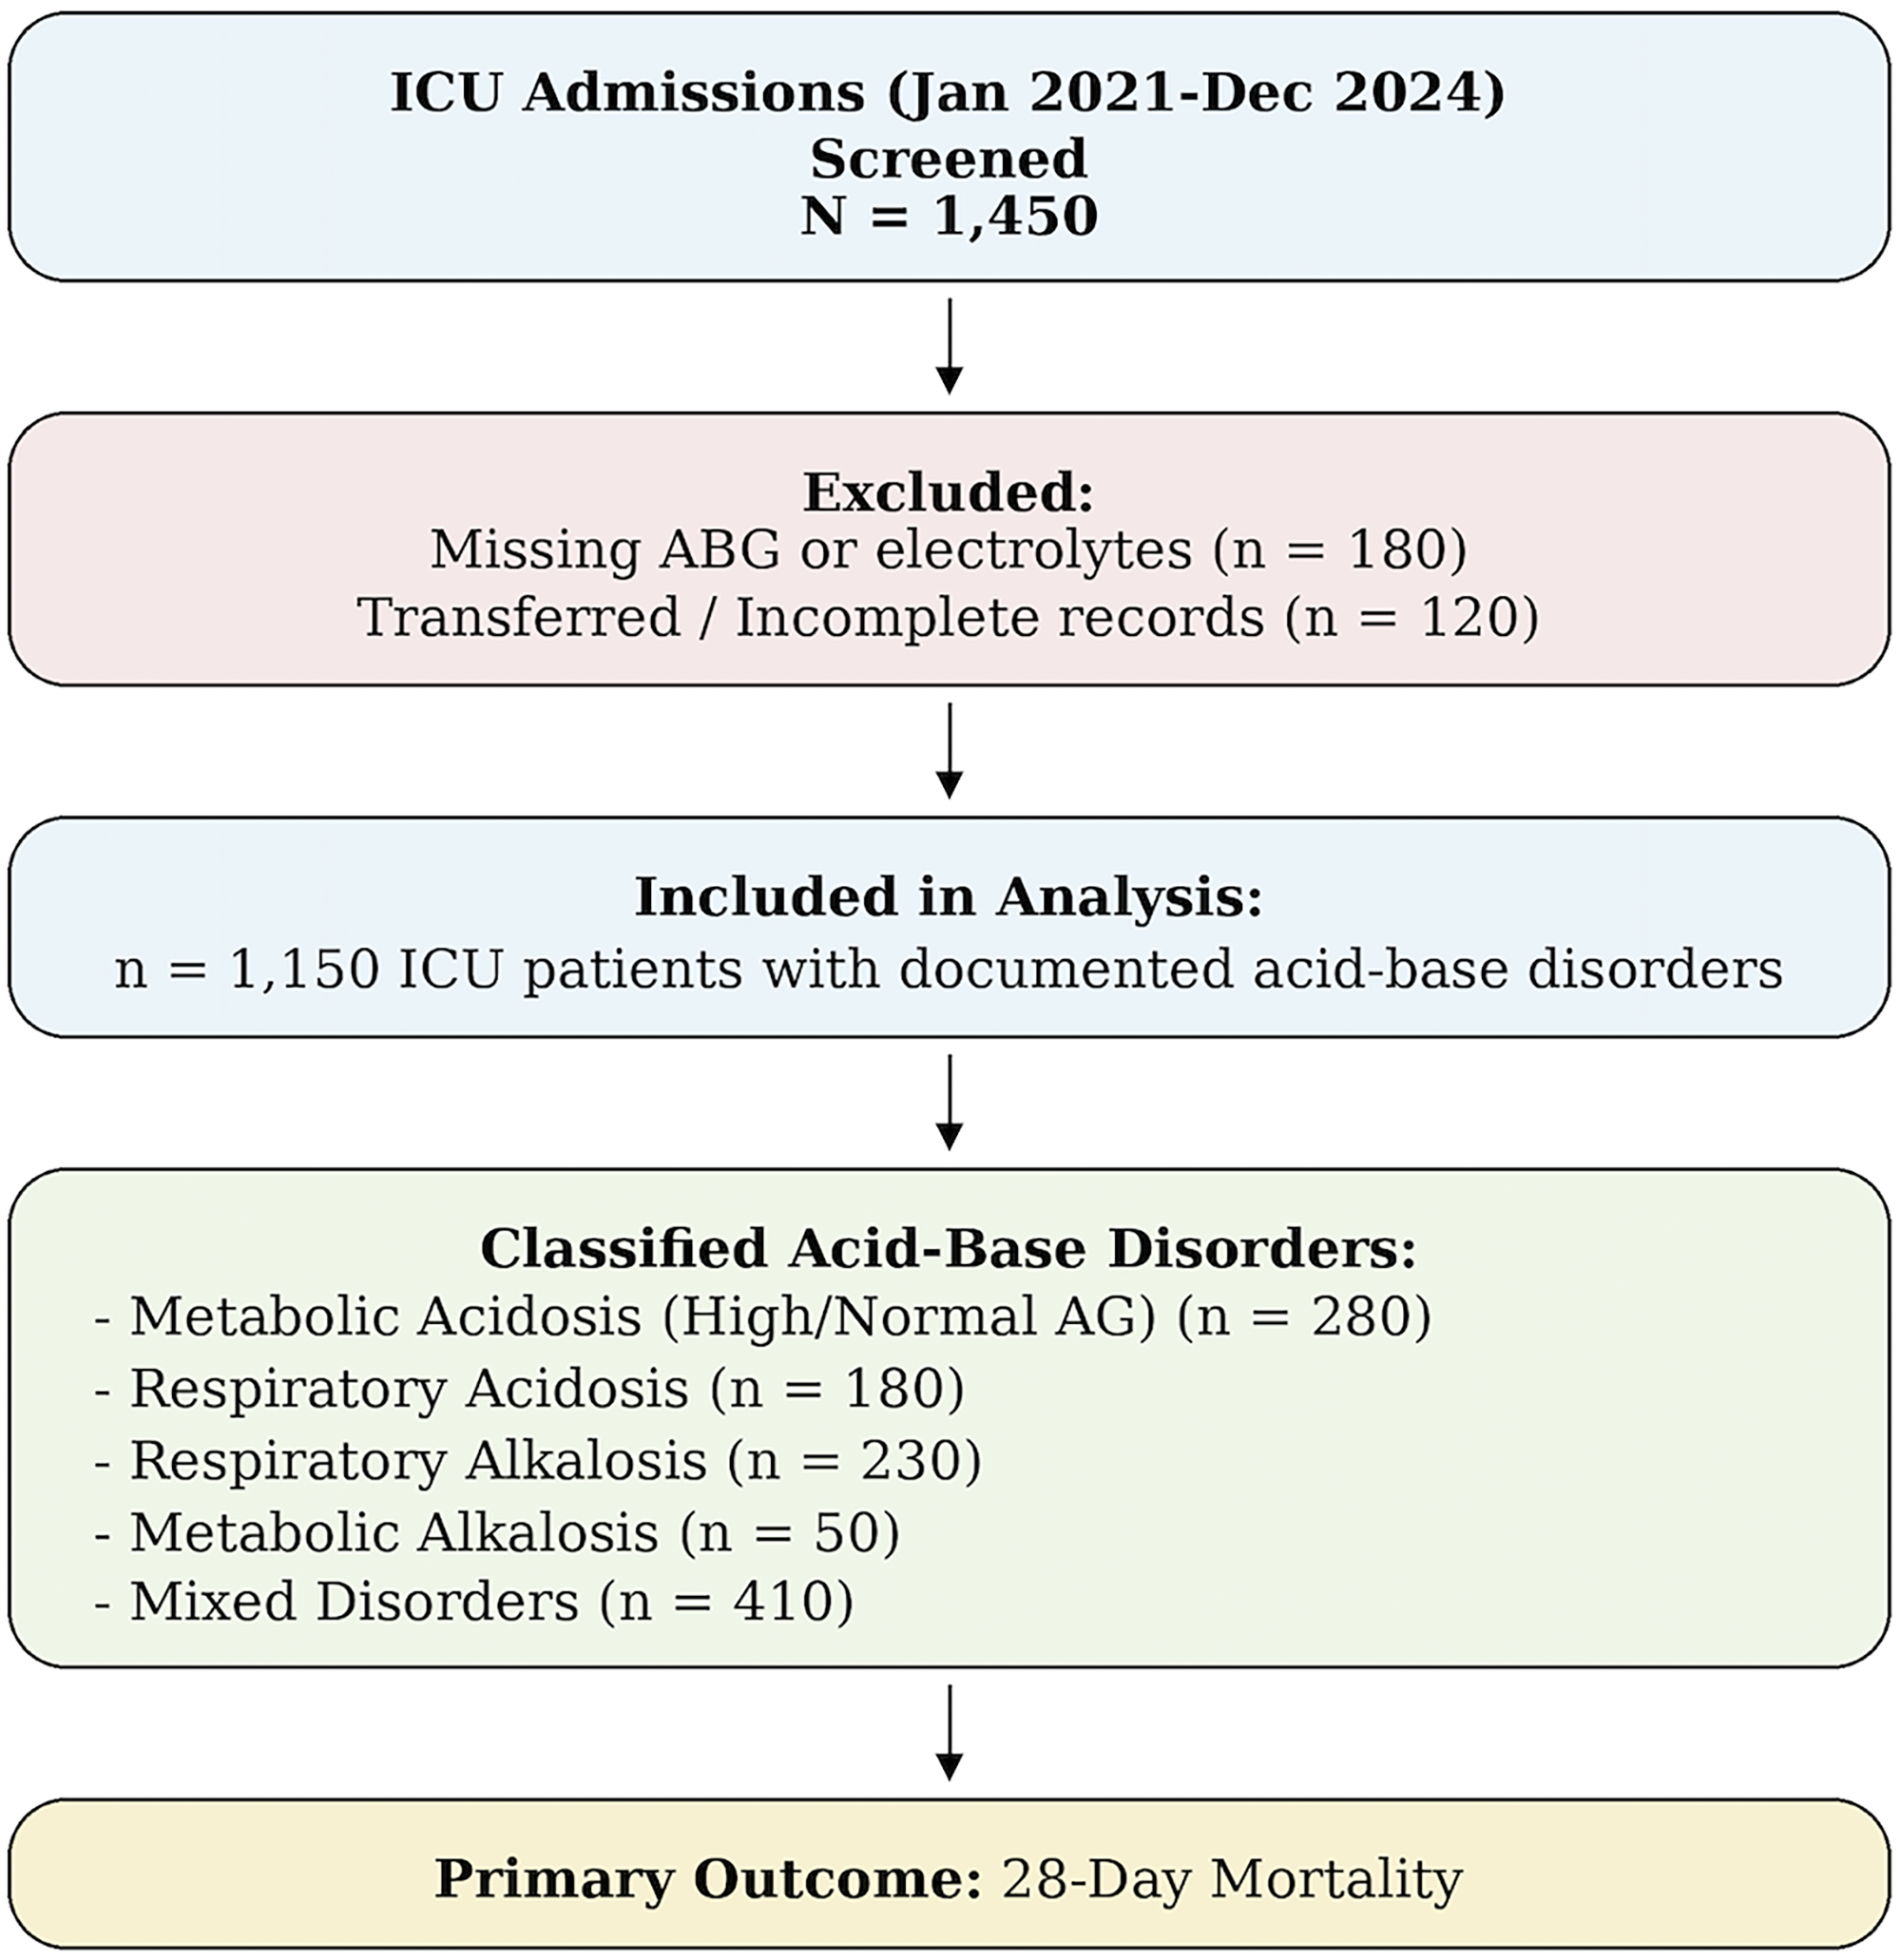
Patient Screening and Selection Flowchart. A Study Flow Diagram Detailing the Identification, Inclusion, and Exclusion of Patients Admitted to the ICU During the Study Period, Resulting in the Final Analytical Cohort of 1150 Patients with Acid–Base Disorders and Complete Outcome Data.
Data Collection and Variables
A team of three trained physicians systematically extracted data using a standardized, pilot-tested electronic case report form. To ensure data quality, duplicate extraction was performed for 10% of records. Collected variables encompassed:
Classification of Acid–Base Disorders
Acid–base disorders were classified a priori using the first ABG obtained at ICU admission together with the concurrent serum electrolyte panel. Classification was based on standard physiologic definitions and expected compensatory responses.
Mixed acid–base disorders were diagnosed when more than one primary disturbance was present simultaneously or when the observed compensatory response fell outside the accepted physiologic range for the presumed primary disorder. Thus, mixed disorders included combinations such as metabolic acidosis with superimposed respiratory alkalosis, metabolic alkalosis with superimposed respiratory acidosis, or respiratory disorders accompanied by a metabolic process inconsistent with the expected acute or chronic bicarbonate response. In cases with near-normal pH but discordant PaCO2, HCO3−, lactate, or anion gap values, classification relied on the direction and magnitude of the expected compensatory response rather than on pH alone.
To improve reproducibility, all classifications were applied using predefined formula-based criteria rather than subjective bedside impression alone. Challenging or borderline cases were independently reviewed by two nephrologists, and disagreements were resolved by consensus using the same prespecified compensation rules. 1
Sample Size and Events per Variable
Because this was a retrospective cohort based on consecutive ICU admissions over a fixed time window, the sample size was determined by the number of eligible patients available rather than by an a priori power calculation. In line with recommendations for prediction modeling, we assessed sample adequacy primarily through model stability/overfitting considerations rather than hypothesis-testing power. Specifically, we evaluated events-per-parameter (EPV) for each prespecified model as the number of 28-day mortality events divided by the number of estimated model parameters, using conventional thresholds (approximately ≥ 10-20 EPV) as a minimum benchmark for logistic regression model stability. In addition, we performed a post-hoc precision assessment for discrimination by estimating the expected uncertainty of the AUC using the Hanley–McNeil variance approximation based on the numbers of events and non-events. To further mitigate optimism and assess generalizability within the cohort, we used bootstrap internal validation to quantify optimism-corrected model performance and calibration.
Statistical Analysis
Statistical analyses were performed using SPSS version 28.0 (IBM Corp.) and R version 4.1.0 (R Foundation for Statistical Computing). Continuous variables were tested for normality using Shapiro-Wilk tests and visual inspection of Q-Q plots, with normally distributed data presented as mean ± standard deviation (SD) and non-normally distributed data as median [interquartile range]. Continuous variables were compared using Welch's t-test for approximately normally distributed data (to account for potential unequal variances) or the Mann–Whitney U test for skewed data; categorical variables were compared using χ2 tests or Fisher's exact tests, as appropriate. All statistical tests were two-tailed, with P-values < .05 considered statistically significant.
Development and Validation of Prediction Models for 28-Day Mortality
We developed three prespecified multivariable logistic regression models to identify independent predictors of 28-day mortality:
Internal Validation, Calibration, and Clinical Utility
Model discrimination was quantified by the apparent AUC; bootstrap internal validation (B = 200 resamples) provided optimism and optimism-corrected AUC. Overall accuracy was summarized by the Brier score. Calibration was assessed by intercept and slope and visually with decile-bin calibration plots. Decision-curve analysis (DCA) evaluated net benefit across threshold probabilities 0.05-0.60 versus treat-all and treat-none strategies. Model development, performance reporting, and internal validation followed TRIPOD recommendations for prognostic model studies.
Results
Study Cohort
A total of 1450 consecutive ICU admissions were screened; 1150 adults met eligibility criteria and were included in the final analysis. Overall, 300 admissions were excluded, including 180 without an admission ABG and/or electrolytes and 120 with incomplete outcome data. The study flow diagram is shown in Figure 1. During 28-day follow-up, 540 of 1150 patients died (47.0%). The effective events-per-parameter (EPV) exceeded conventional thresholds for all prespecified models: Model A EPV = 38.6 (540/14 parameters), Model B EPV = 77.1 (540/7), and Model C EPV = 60.0 (540/9). A post-hoc precision check using the Hanley–McNeil variance (540 deaths and 610 survivors) yielded approximate 95% CI half-widths for AUC of ≈0.015 (AUC = 0.94; Model A, apparent), ≈0.017 (AUC = 0.92; Model C, apparent), ≈0.021 (AUC = 0.88; Model A/C, optimism-corrected), and ≈0.023 (AUC = 0.85; Model B).
Baseline Demographic and Clinical Characteristics
Baseline characteristics at ICU admission stratified by 28-day survival are shown in Table 1 and
Figure S1
. Compared with survivors (n = 610), non-survivors (n = 540) were less likely to be male (33.3% vs 45.9%,
Baseline Characteristics and Clinical Parameters at ICU Admission Stratified by 28-Day Survival Status.
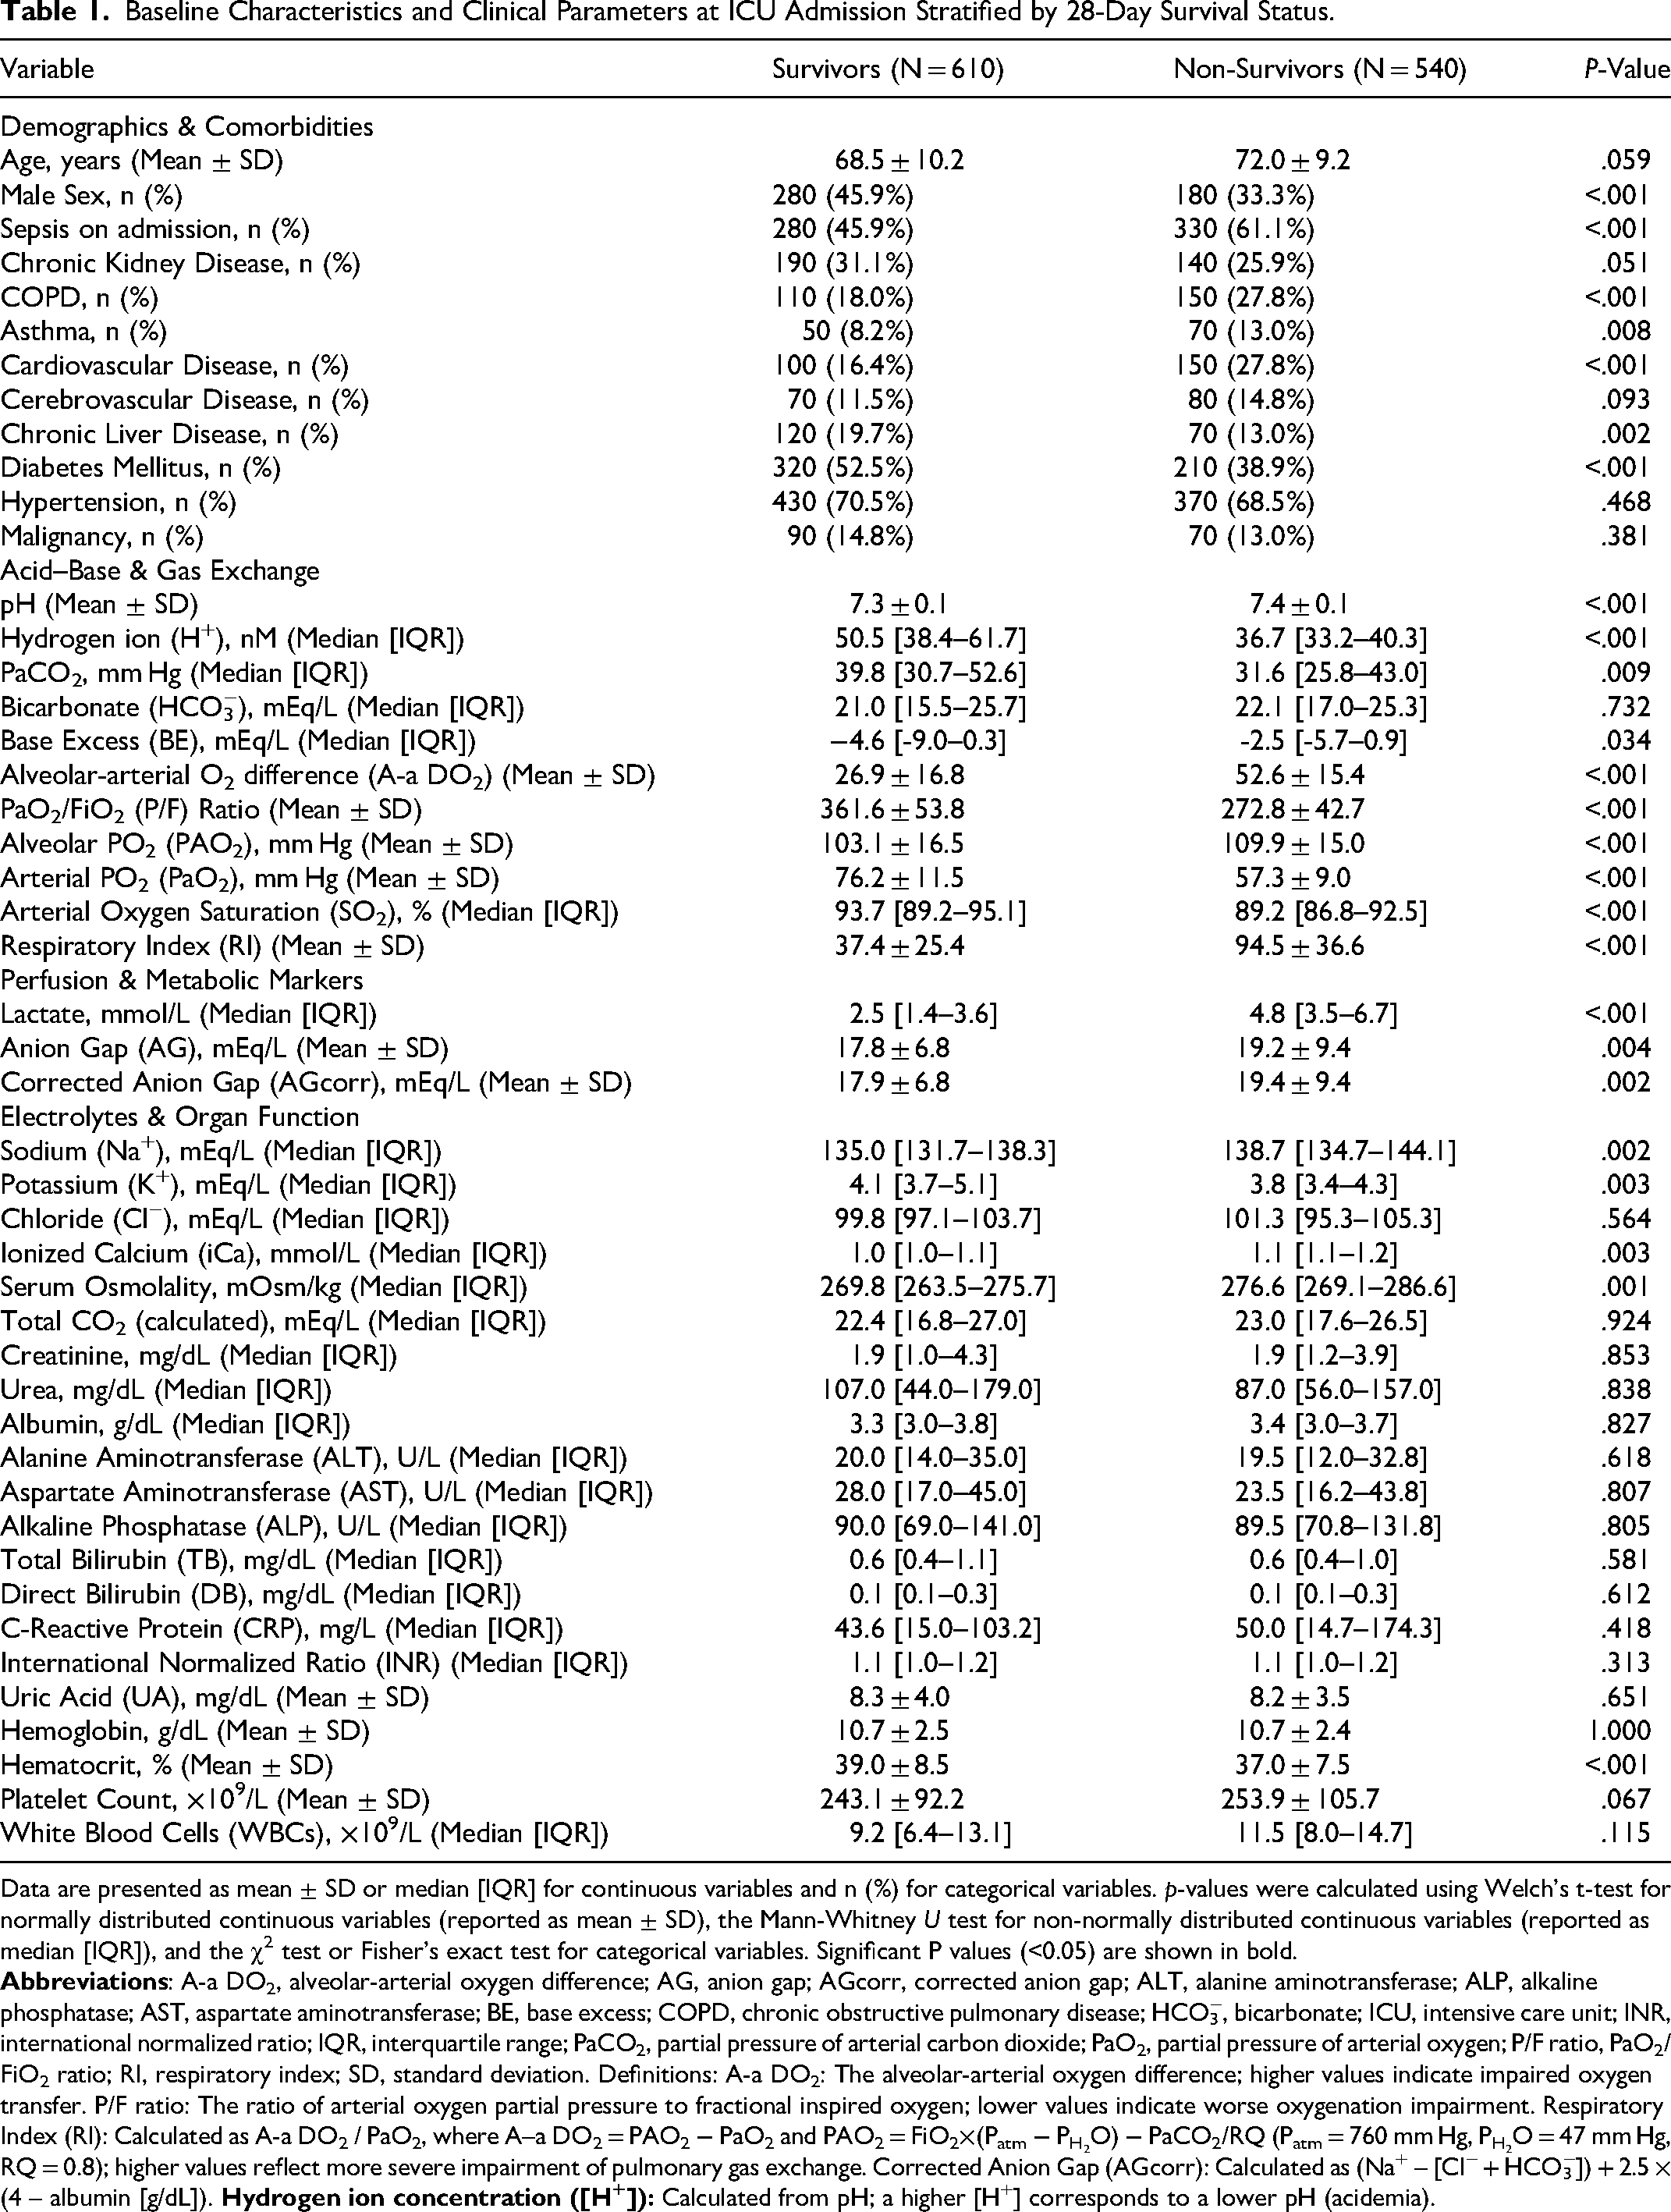
Data are presented as mean ± SD or median [IQR] for continuous variables and n (%) for categorical variables. p-values were calculated using Welch's t-test for normally distributed continuous variables (reported as mean ± SD), the Mann-Whitney U test for non-normally distributed continuous variables (reported as median [IQR]), and the χ2 test or Fisher's exact test for categorical variables. Significant P values (<0.05) are shown in bold.
On admission, non-survivors had higher pH (7.4 ± 0.1 vs 7.3 ± 0.1, P < .001) and lower hydrogen ion concentration (36.7 [33.2-40.3] vs 50.5 [38.4-61.7] nM, P < .001), with lower PaCO2 (31.6 [25.8-43.0] vs 39.8 [30.7-52.6] mm Hg, P = .009) and less negative base excess (−2.5 [−5.7-0.9] vs −4.6 [−9.0-0.3] mEq/L, P = .034), while bicarbonate did not differ (22.1 [17.0-25.3] vs 21.0 [15.5-25.7] mEq/L, P = .732). Non-survivors had worse oxygenation indices, including higher A–a DO2 (52.6 ± 15.4 vs 26.9 ± 16.8, P < .001), lower PaO2/FiO2 ratio (272.8 ± 42.7 vs 361.6 ± 53.8, P < .001), higher PAO2 (109.9 ± 15.0 vs 103.1 ± 16.5, P < .001), lower PaO2 (57.3 ± 9.0 vs 76.2 ± 11.5, P < .001), lower SO2 (89.2 [86.8-92.5] vs 93.7 [89.2-95.1]%, P < .001), and higher Respiratory Index (94.5 ± 36.6 vs 37.4 ± 25.4, P < .001). Lactate was higher in non-survivors (4.8 [3.5-6.7] vs 2.5 [1.4-3.6] mmol/L, P < .001), as were AG (19.2 ± 9.4 vs 17.8 ± 6.8 mEq/L, P = .004) and AGcorr (19.4 ± 9.4 vs 17.9 ± 6.8 mEq/L, P = .002). Sodium (138.7 [134.7-144.1] vs 135.0 [131.7-138.3] mEq/L, P = .002), ionized calcium (1.1 [1.1-1.2] vs 1.0 [1.0-1.1] mmol/L, P = .003), and serum osmolality (276.6 [269.1-286.6] vs 269.8 [263.5-275.7] mOsm/kg, P = .001) were higher and potassium was lower (3.8 [3.4-4.3] vs 4.1 [3.7-5.1] mEq/L, P = .003) among non-survivors; chloride and total CO2 did not differ (P = .564 and P = .924, respectively). Creatinine, urea, and albumin were similar between groups (P = .853, P = .838, and P = .827, respectively).
Distribution and Outcomes of Acid–Base Disorders
Table 2 summarizes the distribution of admission acid–base phenotypes and their associated 28-day mortality. Using mutually exclusive primary categories (N = 1150), mixed disorders were the most common presentation (410/1150; 35.65%) and carried the highest mortality (300/410; 73.17%). Respiratory alkalosis was also frequent (230/1150; 20.00%) and was associated with high mortality (160/230; 69.57%), while metabolic alkalosis was less common (50/1150; 4.34%) but similarly high-risk (30/50; 60.00%). In contrast, respiratory acidosis accounted for 180/1150 (15.65%) and had the lowest mortality (10/180; 5.56%). Metabolic acidosis occurred in 280/1150 (24.34%) with an overall mortality of 40/280 (14.29%); within this group, outcomes differed by subtype, with high–anion gap metabolic acidosis showing higher mortality (40/180; 22.22%) than normal–anion gap metabolic acidosis (0/100; 0.00%) (Figure S2).
Prevalence and 28-day Mortality of Acid–Base Disorder Subtypes at ICU Admission.
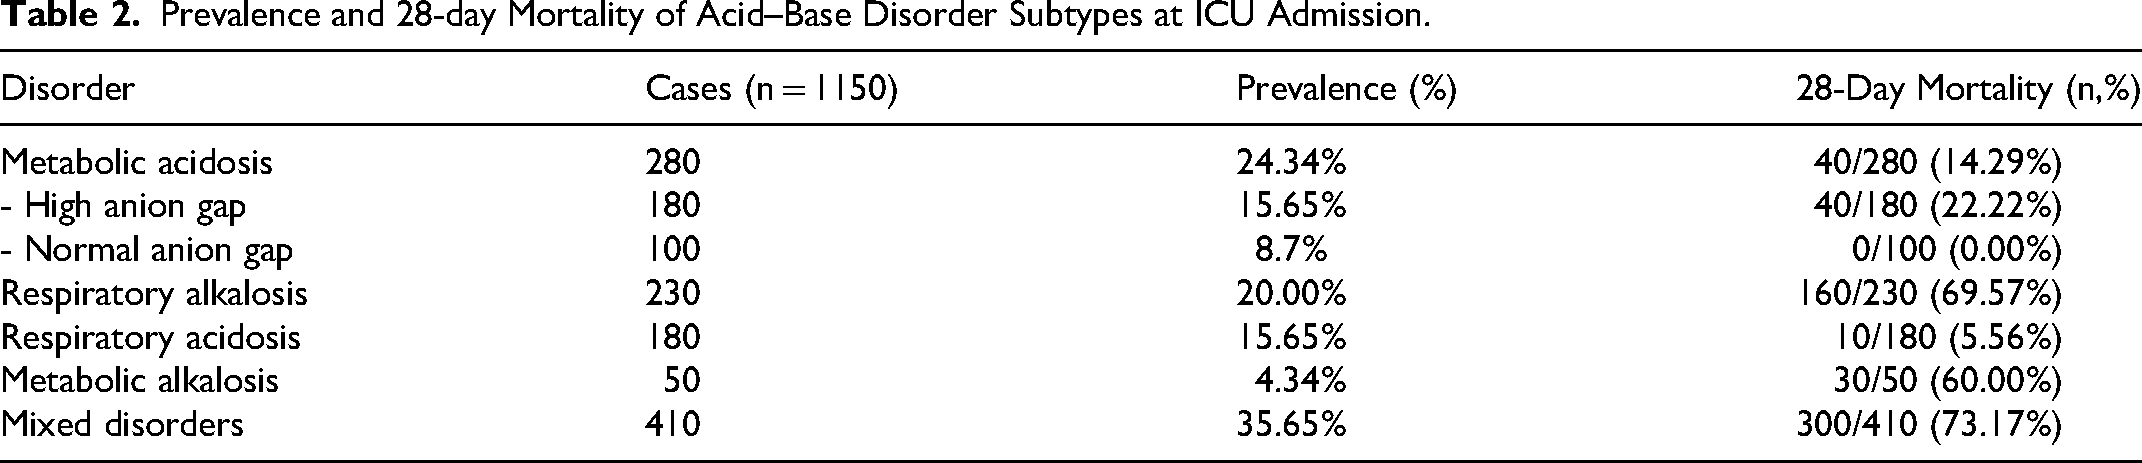
Prevalence (%) calculated as cases ÷ 1150. Mortality shown as deaths within each disorder (n, %). Primary disorder categories are mutually exclusive and sum to 1150. High–anion gap and normal–anion gap metabolic acidosis are subtypes within the metabolic acidosis category (not additional categories).
To address the concern that a normal mean pH could reflect averaging across distinct physiologic subgroups, we performed a prespecified subgroup analysis using admission values. The “compensated high-risk” phenotype -defined as pH 7.35-7.45 with PaCO2 < 35 mm Hg and lactate > 4 mmol/L – included 80 patients, with 70 deaths (87.50%). For comparison, acidemia with hyperlactatemia (pH < 7.35 and lactate > 4) comprised
Subgroup Analysis Addressing Potential “Normal pH” Averaging Artifact (Admission Phenotype strata).
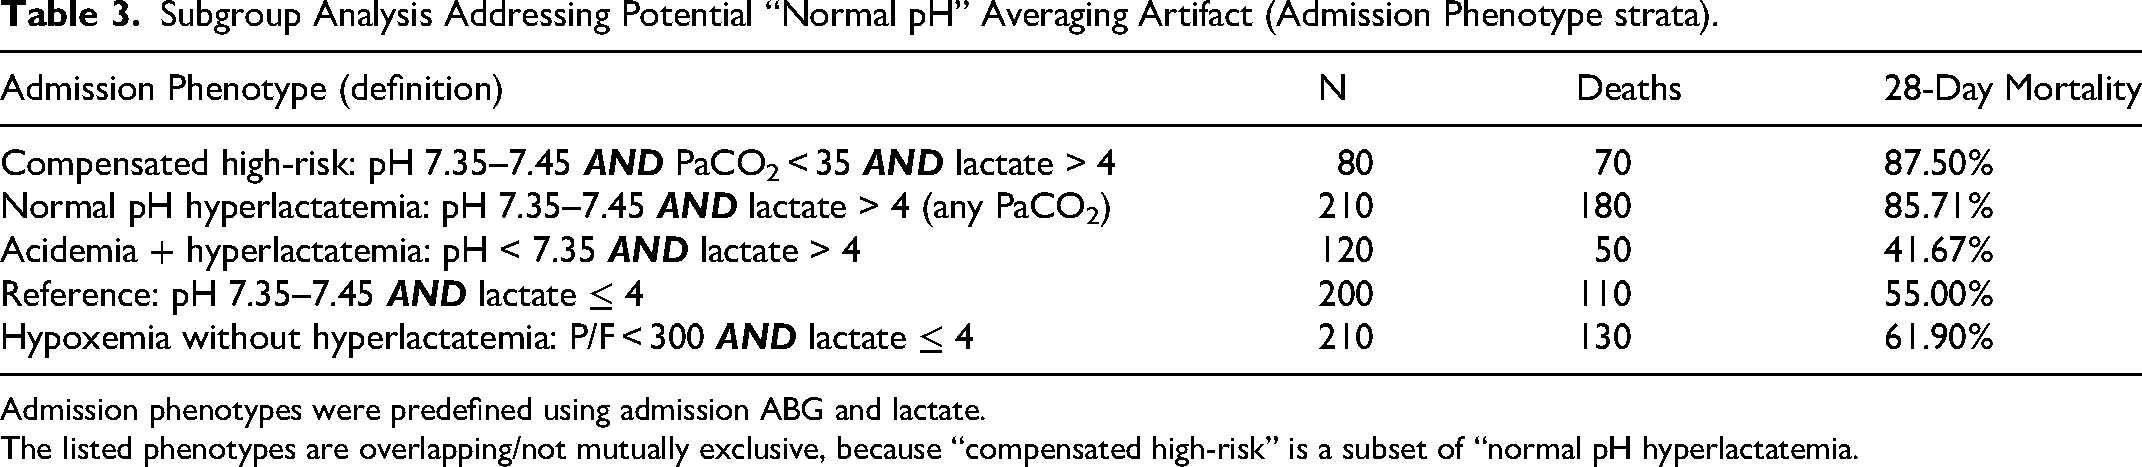
Admission phenotypes were predefined using admission ABG and lactate.
The listed phenotypes are overlapping/not mutually exclusive, because “compensated high-risk” is a subset of “normal pH hyperlactatemia.
Independent Predictors of 28-Day Mortality
We evaluated three models using first-available ABG/chemistry values at admission. Discrimination (AUC) is shown with bootstrap optimism and optimism-corrected estimates; calibration by decile-bin plots; and clinical utility by decision-curve analysis (DCA).
Model A (Primary Flexible Continuous Model: Splines for pH & Lactate + Clinical Covariates)
Using logistic regression with restricted cubic splines for pH and lactate (df = 4) and linear terms for AGcorr, PaCO2, albumin, age, sex, sepsis, and CKD, Model A showed strong apparent discrimination (AUC 0.942), with bootstrap optimism 0.061 and optimism-corrected AUC 0.881; Brier 0.094. Apparent calibration was close to ideal (intercept = 0.00, slope = 1.00). DCA demonstrated consistent net benefit over treat-all and treat-none strategies across clinically relevant thresholds (∼0.05-0.40). In the adjusted linear terms, higher AGcorr and sepsis were independently associated with mortality (AGcorr per 1 mEq/L: aOR 1.17, 95% CI 1.01-1.36; sepsis: aOR 6.25, 1.41-27.71). Male sex showed a borderline association (aOR 4.00, 0.98-16.37). Lactate displayed a strong non-linear risk rise, particularly beyond ∼4 mmol/L (Table 4; Figure 2A).
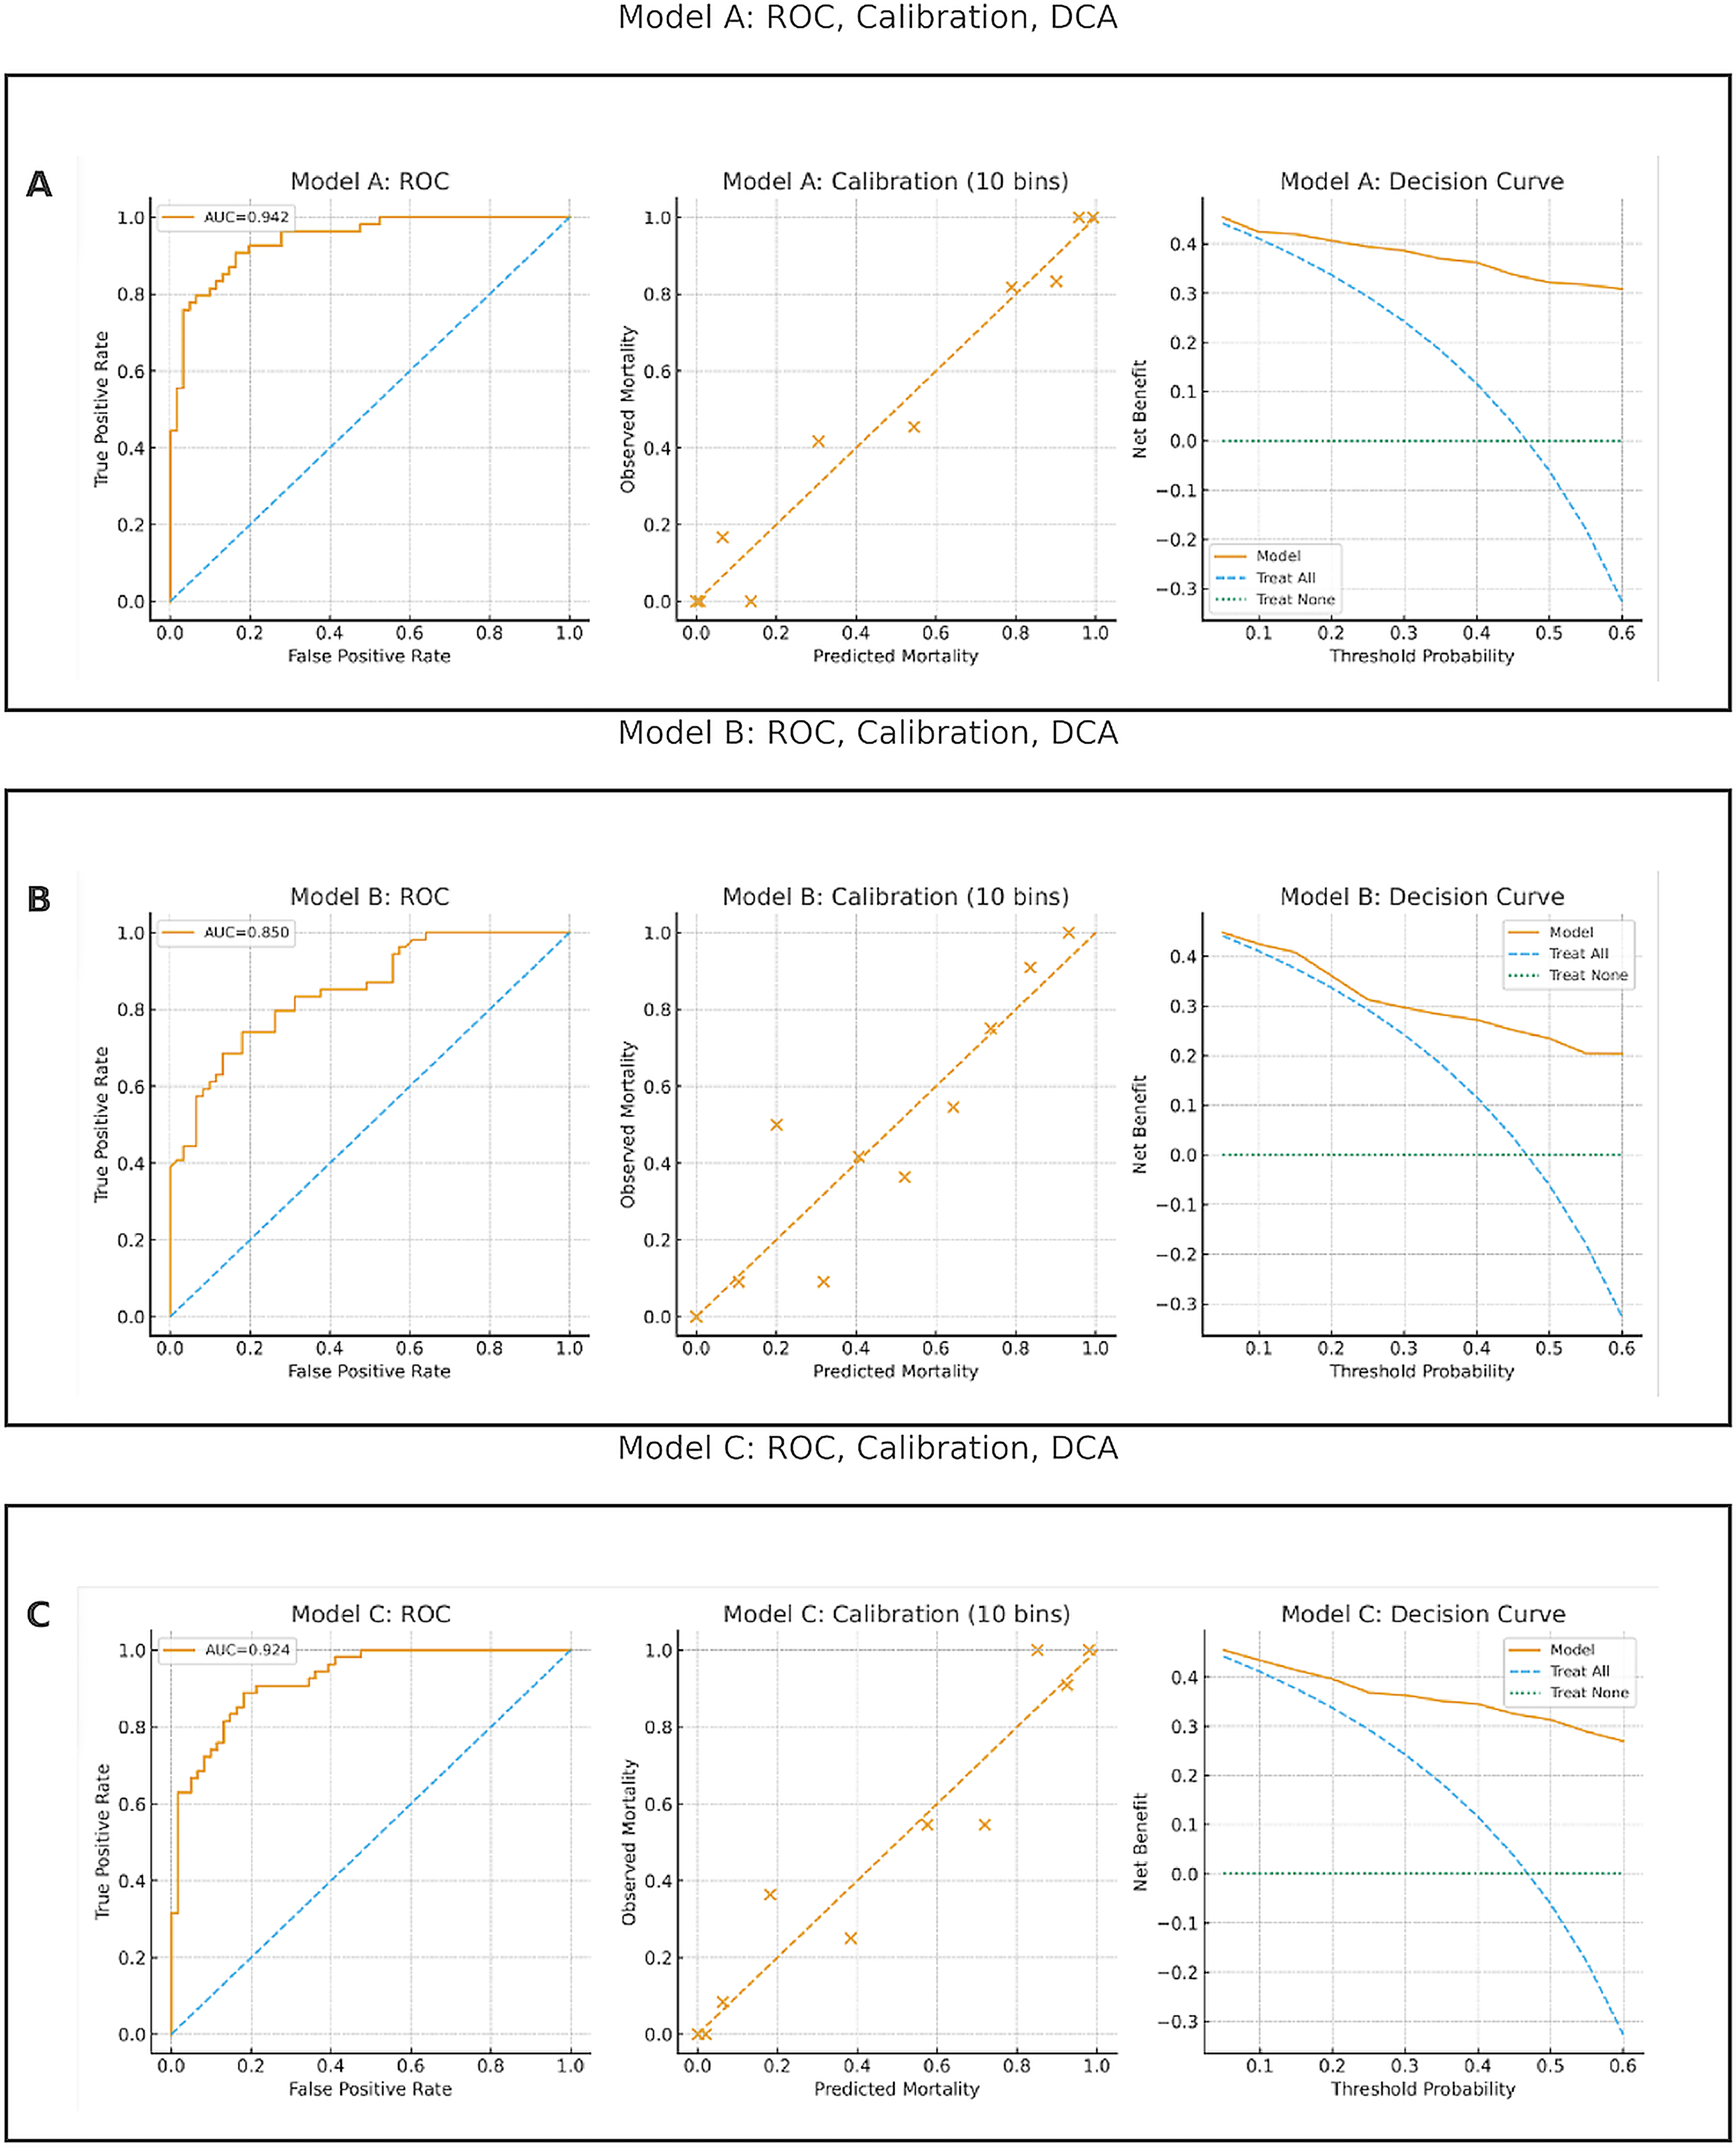
Model Performance and Clinical Utility (Panels A-C). Panels Show ROC with AUC (Apparent), 10-bin Calibration, and Decision-Curve Analysis (Thresholds 0.05-0.60). A. Model A (Restricted Cubic Splines for pH and Lactate; Linear Terms for AGcorr, PaCO2, Albumin, age, sex, Sepsis, CKD). B. Model B (Threshold with Firth Logistic: pH < 7.20, lactate > 4.0 mmol/L, AGcorr > 16 mEq/L, Sepsis; Adjusted for age, sex, CKD). C. Model C (ABG-Only: pH and Lactate with Splines; Linear AGcorr, PaCO2, Albumin). Across Models, Discrimination was Strong with Acceptable Calibration and Positive net Benefit Relative to Treat-all and Treat-None Strategies.
Model A (Flexible Continuous Model): Adjusted Effects.
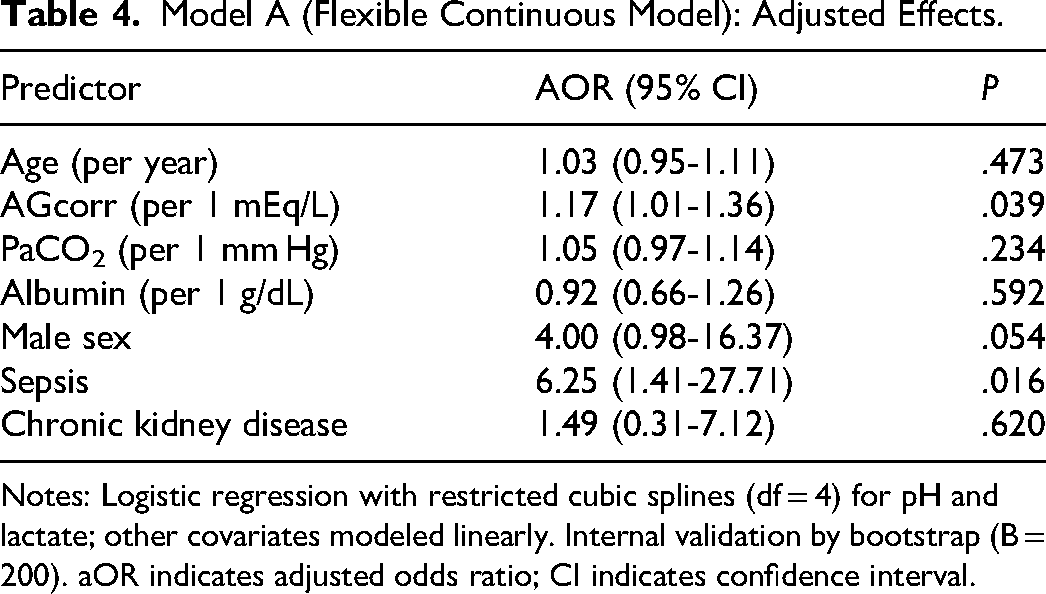
Notes: Logistic regression with restricted cubic splines (df = 4) for pH and lactate; other covariates modeled linearly. Internal validation by bootstrap (B = 200). aOR indicates adjusted odds ratio; CI indicates confidence interval.
Model B (Pragmatic Threshold Model with Firth Bias Reduction)
Binary predictors pH < 7.20, lactate > 4 mmol/L, and AGcorr >16 mEq/L with age, sex, sepsis, and CKD. Because pH < 7.20 exhibited complete separation in unpenalized fits, Firth bias-reduced estimates are reported for inference. Apparent AUC 0.851, with Brier 0.159. DCA showed positive net benefit across ∼0.05-0.35, albeit lower than Model A/C. Strong effects for lactate>4 and sepsis persisted (Table S2; Figure 2B).
Model C (ABG-Only Continuous Model)
pH and lactate (splines, df = 4), plus linear AGcorr, PaCO2, and albumin preserved most predictive signal. Apparent AUC was 0.924, optimism 0.046, optimism-corrected AUC 0.878; Brier 0.113. Decile-bin calibration points lay close to the 45° line, and DCA showed consistent net benefit over treat-all and treat-none across thresholds ∼0.05-0.40 (Table S2; Figure 2C).
Predictive Performance of Individual Biomarkers
Among single admission biomarkers, lactate and pH (acidemia direction) provided the strongest discrimination for 28-day mortality, whereas anion gap (corrected) was modest and albumin was near chance. The AUCs (95% CIs) were: lactate 0.762 (0.671-0.849), pH 0.786 (0.694-0.864), anion gap (corrected) 0.585 (0.481-0.686), and albumin 0.488 (0.383-0.598) (Table S3, Figure 3).
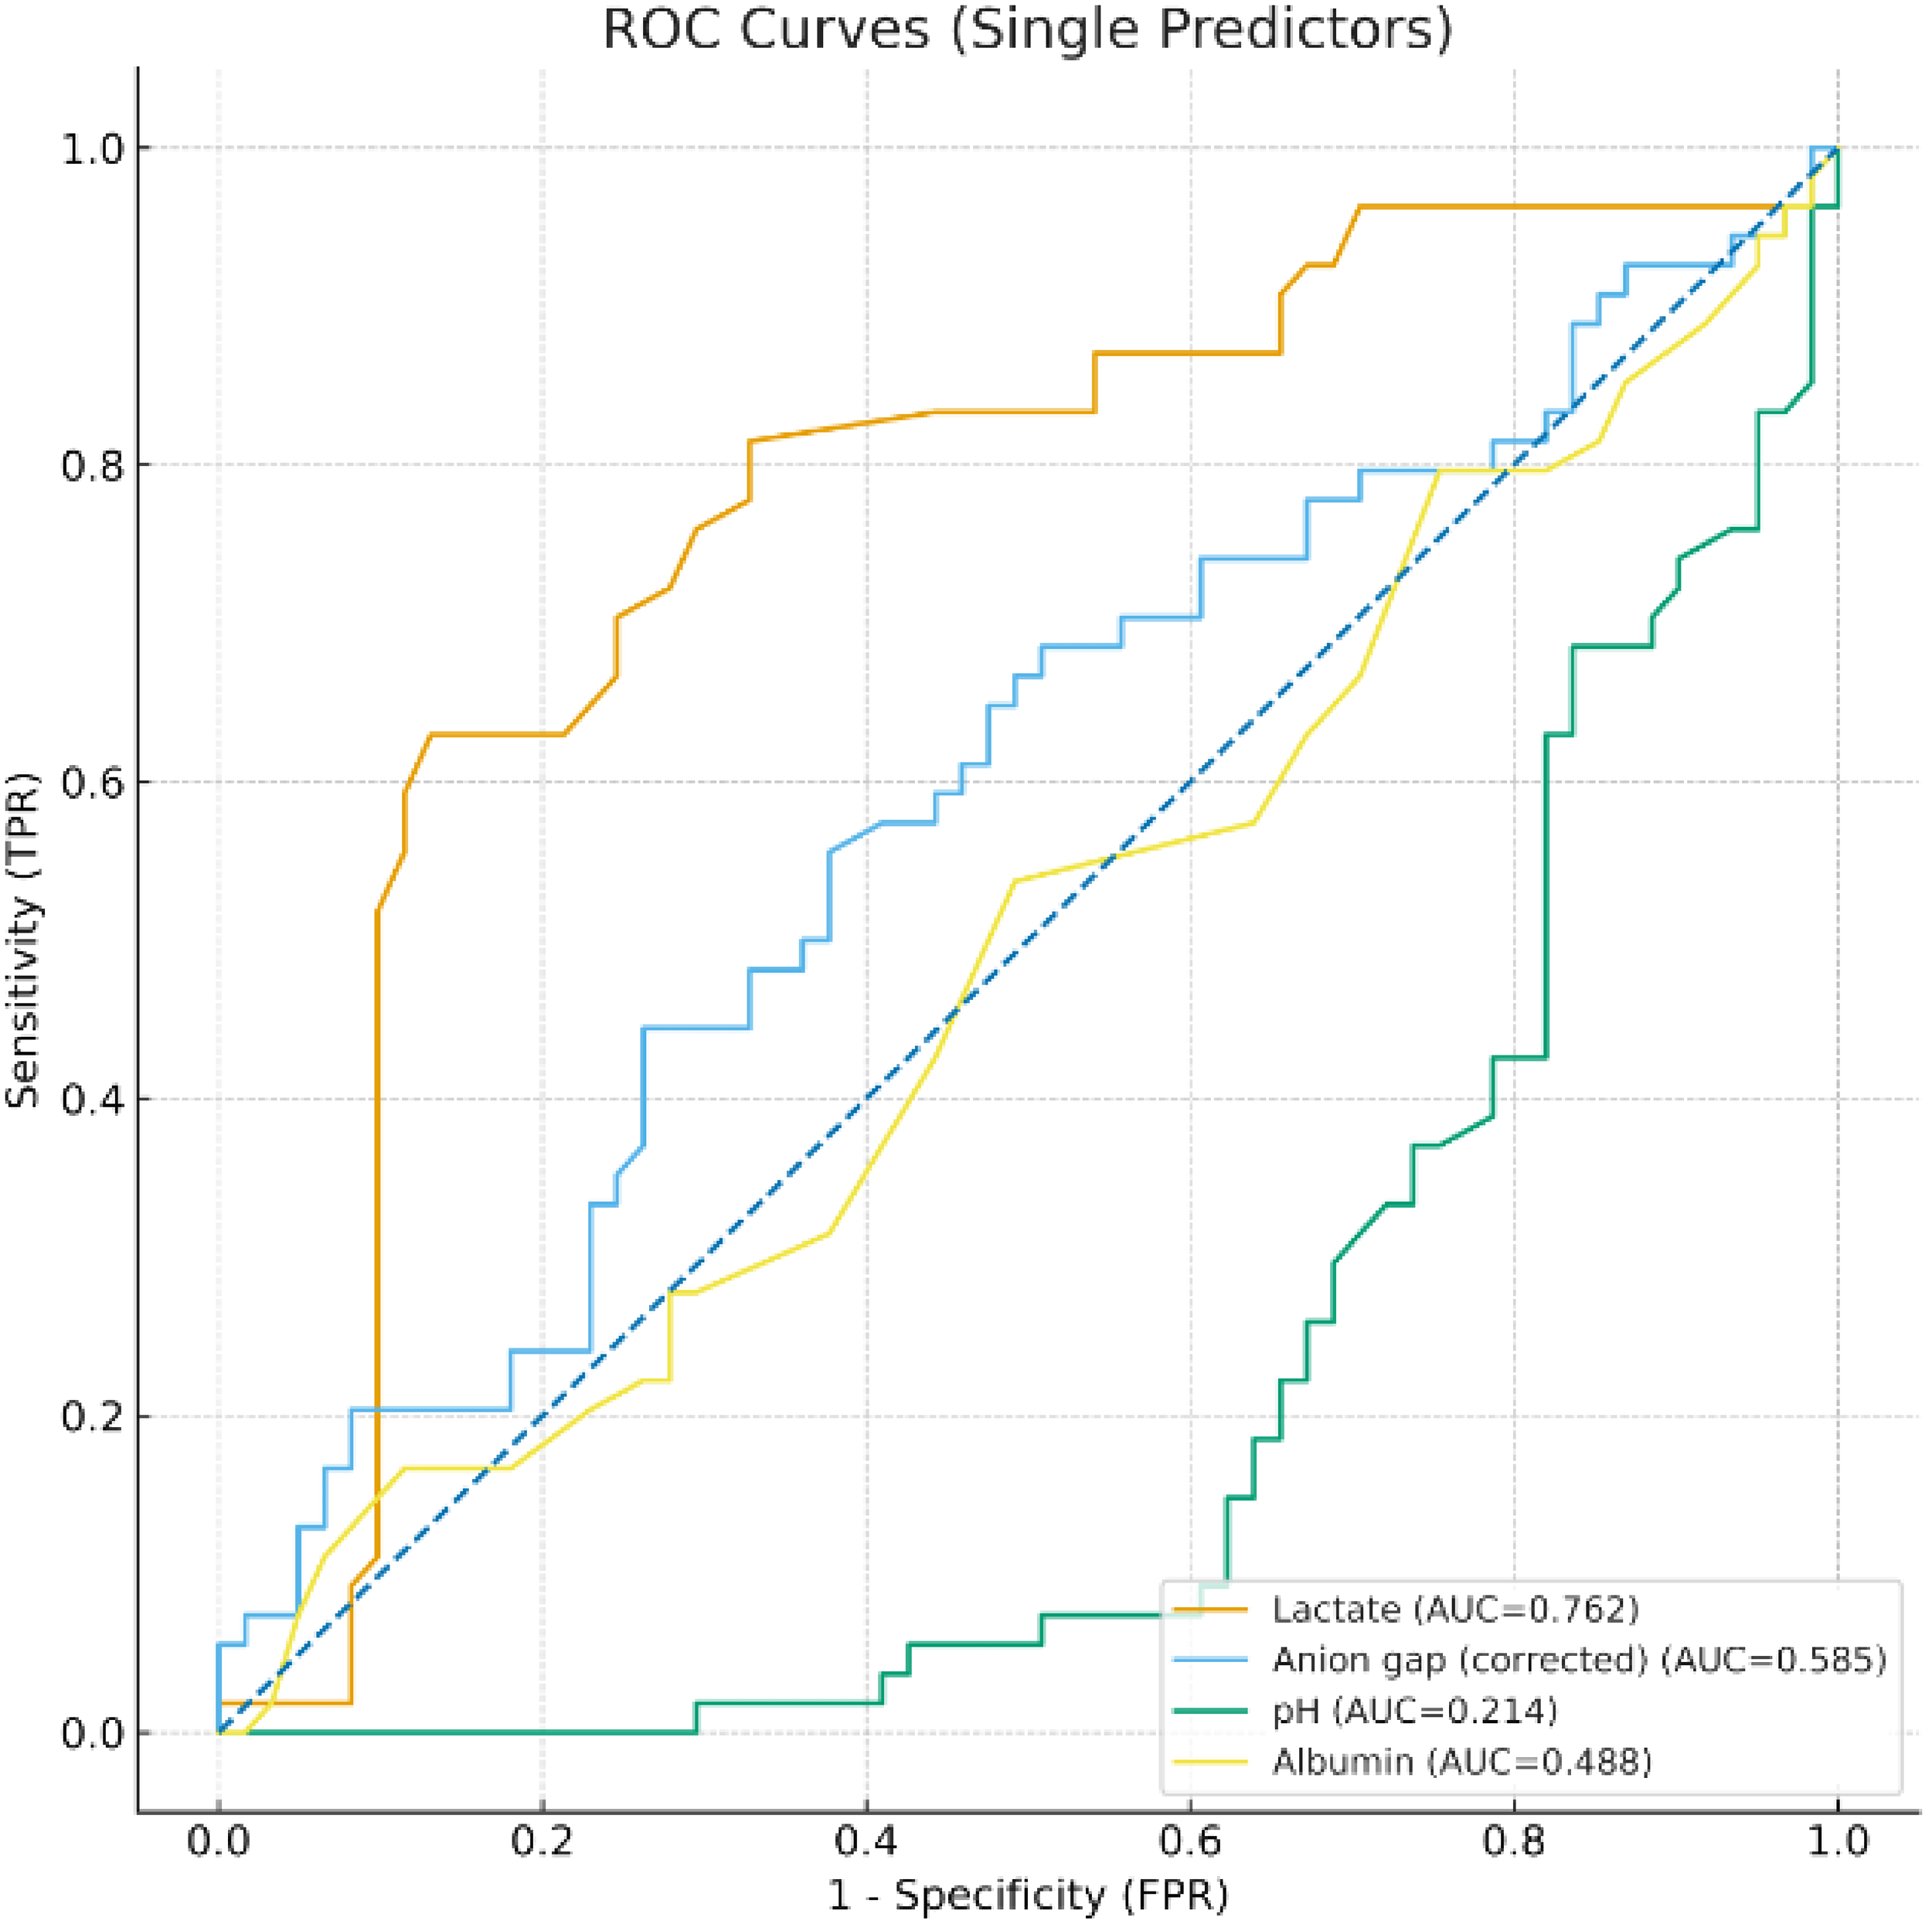
Discriminatory Performance of Individual Biomarkers. Receiver Operating Characteristic (ROC) Curves Showing the Predictive Accuracy of Individual Admission Biomarkers for 28-day Mortality. In this cohort, Lactate (AUC = 0.762) and anion gap (Corrected) (AUC = 0.585) Outperform Albumin (AUC = 0.488). pH Discriminates Mortality When Expressed in the Clinical Direction of Acidemia (AUC = 0.786). The diagonal line Denotes Random Performance (AUC = 0.5). AUC Guide: 0.90–1.00 Excellent, 0.80–0.90 Good, 0.70–0.80 Fair.
Correlation analyses are provided in the Supplementary Appendix (Figs. S4–S5).
Discussion
In this large retrospective cohort of critically ill patients with acid–base disorders identified on admission ABG, these disturbances carried important prognostic implications. Our analysis yielded several key findings: first, we identified a high-risk admission pattern in which marked hyperlactatemia coexisted with a near-normal (or higher) arterial pH and hypocapnia, and this pattern was associated with high mortality; second, we demonstrated that while individual markers like pH and lactate are strong predictors, their combination in a multivariable model offers superior risk stratification; and third, we derived a clinically practical, ABG-only continuous model that can be implemented using admission ABG and basic chemistry data, with consistent discrimination, acceptable calibration, and favorable decision-curve performance. Consistent with this physiologic complexity, mixed disorders were the most common primary category (35.65%) and carried the highest 28-day mortality (73.17%), highlighting the prognostic importance of concurrent respiratory and metabolic disturbances.
On single-marker ROC analysis, the strongest discriminators of 28-day mortality were pH (expressed in the clinical direction of acidemia) and lactate (AUC 0.786 and 0.762, respectively), whereas albumin-corrected anion gap (AGcorr) showed modest discrimination (AUC 0.585) and albumin was near chance (AUC 0.488).3,7,8 This highlights a critical limitation of relying on any single parameter. The true strength of these biomarkers is unlocked through integration. The multivariable (continuous) model showed good overall performance with strong discrimination and acceptable calibration, and decision-curve analysis (DCA) demonstrated positive net benefit across clinically relevant treatment thresholds (∼0.05-0.60), indicating potential bedside utility beyond “treat-all” or “treat-none” strategies.9–11
Clinical Implications
These results support using simple admission ABG and biochemical measures for early risk stratification. Practically, more severe acidemia and higher lactate identify patients at higher risk and can be used to prioritize evaluation and escalation (eg, closer hemodynamic monitoring, early source control for sepsis, timely nephrology input when acid retention or mixed disturbances are suspected).3,8 While AGcorr captures the global burden of unmeasured anions, its stand-alone discrimination was modest; in practice, it appears most useful in combination with other markers (eg, pH, lactate) within multivariable risk models rather than as a solitary trigger. The DCA findings reinforce this clinical perspective, indicating that multivariable predictions yield net clinical benefit across thresholds that match common bedside trade-offs.9,10
Correlation Structure and Pathophysiology
The most intriguing finding is the high mortality associated with the combination of a near-normal/higher pH, hypocapnia, and hyperlactatemia at admission. This profile likely represents a state of profound physiological dissonance. Patients, often with sepsis, mount a vigorous respiratory response resulting in
Correlation analyses clarified how markers relate to one another at admission and provide a pathophysiological rationale for our modeling approach. The strong inverse correlations between AGcorr and both bicarbonate and base excess affirm its validity as a marker of metabolic acidosis burden. The AGcorr–albumin relationship was moderately inverse, as expected because lower albumin both reduces buffering capacity and increases the corrected anion gap.12,13 However, its weaker, imprecise associations with lactate and pH are revealing. This, coupled with the unexpectedly weak correlation between pH and HCO3−, vividly illustrates the complex reality of critical illness, characterized by mixed disorders and dynamic compensatory mechanisms. This physiological complexity is precisely why a multivariable model, which can account for these interrelated signals, outperforms any single-marker heuristic.
This subgroup analysis supports that the observation of near-normal pH in non-survivors is not solely an averaging artifact. Specifically, patients meeting the “compensated high-risk” profile (near-normal pH with hypocapnia and lactate > 4 mmol/L) exhibited a high 28-day mortality (87.50%), demonstrating that substantial risk can occur within the near-normal pH range when metabolic stress is severe. Together with the multivariable model results, these findings reinforce that pH should be interpreted in conjunction with PaCO2 and lactate rather than used in isolation for prognostic assessment.
Comparison with Previous Studies
Our findings align with and extend prior research on ICU epidemiology, which has established that acid–base disturbances are common at presentation and typically involve mixed respiratory and metabolic abnormalities rather than isolated single disorders. Seminal work and contemporary reviews have emphasized that the distribution of acid–base patterns varies considerably based on case mix, timing of blood gas sampling, and classification methodology, with mixed disturbances being particularly frequent in critically ill populations.1,2 Furthermore, admission-based cohort studies have demonstrated that acid–base categories at ICU entry are not merely descriptive but carry prognostic significance. It is important to note that, as our cohort was restricted to patients with acid–base disorders identified on the first ABG after admission, the observed subtype distribution reflects the characteristics of this selected population rather than the prevalence among all ICU admissions.
Consistent with previous prospective and retrospective evidence, we found that patients with mixed acid–base disorders exhibited the highest mortality. Jung et al, in a prospective multicenter study, reported that severe metabolic or mixed acidemia at ICU admission is both clinically significant and independently associated with poor outcomes. 3 More recent investigations focusing on extreme acidosis have similarly demonstrated a grave prognosis among critically ill patients with severe acid-base derangements. 5 These observations are reinforced by the broader critical care literature, which links the severity of metabolic disturbances – particularly lactic acidosis and shock physiology—to adverse outcomes across diverse ICU phenotypes, including cardiogenic shock. 6 Collectively, these data support our interpretation that mixed disturbances and severe metabolic stress represent high-risk physiologic states rather than incidental laboratory findings.
Our results also underscore the high-risk nature of respiratory alkalosis and hypocapnia in critical illness. Prior studies have noted that respiratory alkalosis is frequently encountered in the ICU and often reflects underlying systemic illness – particularly sepsis – where hyperventilation may be driven by inflammatory-mediated increases in central respiratory drive, hypoxemia, pain, or early compensatory responses to metabolic acidosis.1,2 In parallel, the association between hyperlactatemia and mortality is well established in critically ill and septic populations, with evidence that lactate predicts mortality independently of shock and organ failure, 10 as well as broader syntheses of its etiologies and therapeutic implications. 8 Importantly, the observation that respiratory alkalosis was more prevalent among non-survivors while metabolic variables (especially lactate) dominated in multivariable models is not contradictory. Prevalence among non-survivors reflects how often a phenotype occurs in those who die, whereas independent predictors capture variables that retain prognostic information after adjustment for correlated physiology and severity. Respiratory alkalosis/hypocapnia may therefore act as a marker of severe systemic illness and compensatory response, while mortality risk remains more strongly and independently linked to underlying metabolic failure – most notably hyperlactatemia – captured in adjusted models.
Lastly, variability across studies in the reported distribution and prognostic impact of acid–base subtypes is expected and likely attributable to several factors: (i) differences in case mix (eg, proportions of sepsis, shock, or respiratory failure), (ii) timing of ABG sampling (first admission vs later or serial measurements), and (iii) classification frameworks (mutually exclusive primary categories vs overlapping component reporting).2–4 By applying a standardized admission-time approach and integrating routinely available clinical variables into multivariable models, our study contributes to the existing literature by quantifying the association between common acid–base patterns and short-term mortality, while also offering practical prediction tools grounded in admission physiology.9,11,14
Strengths and Limitations
This study has several strengths, including a large single-center cohort, standardized ABG/biochemical profiling at admission, comprehensive evaluation of model performance that included discrimination, calibration (intercept, slope, Brier score), and clinical utility (decision curve analysis), and correlation analyses that contextualize how markers relate in real patients. The counterintuitive Firth-adjusted odds ratio for severe acidemia (pH < 7.20) in Model B reflects quasi-separation rather than a protective biological effect, underscoring the instability of extreme-threshold categorization and supporting our emphasis on continuous, multivariable modeling. However, its limitations must be acknowledged. The single-center, retrospective design, and reliance on single-pass imputation (median/mode) with complete-case sensitivity analyses may affect generalizability. For the threshold model (Model B), Firth bias-reduced logistic regression was used to address separation; external validation in diverse ICU populations remains necessary. An important limitation is that all acid–base classifications and prediction models were derived from the first ABG and concurrent biochemistry obtained at ICU admission. While this approach is consistent with prior prognostic studies and supports early bedside risk stratification, it does not capture the dynamic evolution of acid–base disturbances during resuscitation and ongoing critical illness. Consequently, we could not evaluate whether serial trajectories (eg, changes in lactate, pH, PaCO2, AGcorr, or base excess over time) provide incremental prognostic information or alter subtype assignment. Future work should test whether incorporating repeated measurements improves prediction and clinical decision support.
Future Directions
Future research should focus on (1) external validation with calibration updates if needed, (2) bootstrap optimism-correction and shrinkage for deployment-ready coefficients, (3) testing clinical decision thresholds prospectively with protocolized responses, and (4) exploring whether dynamic trajectories (serial lactate/pH/AGcorr) further improve prediction and decision support. Additionally, evaluating time-updated/trajectory-based models using serial ABG and lactate measurements may further improve prognostic performance and identify evolving high-risk phenotypes.
Conclusion
In conclusion, acid–base disorders are common in the ICU and are powerful predictors of short-term mortality. Hyperlactatemia is the dominant independent risk factor, and its presence, even in the context of a normal pH achieved through compensatory hyperventilation, identifies a high-risk phenotype. Multivariable models combining these routinely available measures are better calibrated, more clinically useful, and better reflect the complex physiology of critical illness than reliance on any single-marker, such as pH alone.
Supplemental Material
sj-docx-1-jic-10.1177_08850666261442193 - Supplemental material for Arterial Blood Gas–Derived Risk Models for 28-Day Mortality in Critically Ill Adults: A Retrospective Cohort Study
Supplemental material, sj-docx-1-jic-10.1177_08850666261442193 for Arterial Blood Gas–Derived Risk Models for 28-Day Mortality in Critically Ill Adults: A Retrospective Cohort Study by Hesham Kamal Habeeb Keryakos, Sohair Adeeb Megalla and Shaimaa Hassaan Hamdy Ahmed in Journal of Intensive Care Medicine
Supplemental Material
sj-docx-2-jic-10.1177_08850666261442193 - Supplemental material for Arterial Blood Gas–Derived Risk Models for 28-Day Mortality in Critically Ill Adults: A Retrospective Cohort Study
Supplemental material, sj-docx-2-jic-10.1177_08850666261442193 for Arterial Blood Gas–Derived Risk Models for 28-Day Mortality in Critically Ill Adults: A Retrospective Cohort Study by Hesham Kamal Habeeb Keryakos, Sohair Adeeb Megalla and Shaimaa Hassaan Hamdy Ahmed in Journal of Intensive Care Medicine
Supplemental Material
sj-docx-3-jic-10.1177_08850666261442193 - Supplemental material for Arterial Blood Gas–Derived Risk Models for 28-Day Mortality in Critically Ill Adults: A Retrospective Cohort Study
Supplemental material, sj-docx-3-jic-10.1177_08850666261442193 for Arterial Blood Gas–Derived Risk Models for 28-Day Mortality in Critically Ill Adults: A Retrospective Cohort Study by Hesham Kamal Habeeb Keryakos, Sohair Adeeb Megalla and Shaimaa Hassaan Hamdy Ahmed in Journal of Intensive Care Medicine
Footnotes
Abbreviations
Acknowledgements
We thank the nursing staff and colleagues at Minia University Hospital for their support and collaboration. We also thank the patients and their families for their participation and trust.
Ethics Approval
This study was approved by the Institutional Review Board of Faculty of Medicine, Minia University (approval number 1589/6/2025) and conducted in accordance with the Declaration of Helsinki.
Consent to Participate
The requirement for written informed consent was waived by the ethics committee due to the retrospective design of the study.
Supplemental Material
Supplemental material for this article is available online.
Author Contributions
Hesham Kamal Habeeb Keryakos contributed to the conceptualization, data curation, and project administration; Sohair Adeeb Megalla contributed to the validation of the research and the formal analysis of the data; Shaimaa Hassaan Hamdy Ahmed contributed to the resources and methodology; and all authors contributed to the writing of the original draft of the manuscript. All authors critically revised the manuscript, agreed to be fully accountable for ensuring the integrity and accuracy of the work, and read and approved the final manuscript.
Funding
The authors received no financial support for the research, authorship, and/or publication of this article.
Declaration of Conflicting Interests
The authors declared no potential conflicts of interest with respect to the research, authorship, and/or publication of this article.
Data Availability
The datasets used and analyzed during the current study are available from the corresponding author on reasonable request.
Clinical Trial Number
This observational analysis was retrospectively registered at ClinicalTrials.gov (NCT07148440). Trial registration was not required for this design; the identifier is provided for transparency.
Consent for Publication
Not applicable.
References
Supplementary Material
Please find the following supplemental material available below.
For Open Access articles published under a Creative Commons License, all supplemental material carries the same license as the article it is associated with.
For non-Open Access articles published, all supplemental material carries a non-exclusive license, and permission requests for re-use of supplemental material or any part of supplemental material shall be sent directly to the copyright owner as specified in the copyright notice associated with the article.