
Abstract
Background
Sepsis-associated respiratory disease, often linked to conditions like pneumonia and acute respiratory distress syndrome (ARDS), is a major contributor to mortality in the United States. Despite its significant impact, national trends and demographic disparities in sepsis-related respiratory deaths, particularly with the influence of the COVID-19 pandemic, remain underexplored.
Study Design and Methods
This retrospective cohort study analyzed CDC WONDER mortality data (1999-2023) for adults aged ≥24 years with death records listing both respiratory disease (ICD-10: J00–J98) and sepsis (ICD-10: A02.1, A22.7, A26.7, A32.7, A40.0–A41.9, A42.7, B37.7) as causes. Age-adjusted mortality rates (AAMRs) per 100,000 were calculated using the 2000 U.S. standard population. Joinpoint regression estimated annual percent changes (APCs) and average annual percent changes (AAPCs) to identify temporal trends, stratified by sex, race/ethnicity, age, region, state, and place of death.
Results
Of 2,090,242 combined respiratory and sepsis deaths, 51.49% were male. AAMRs increased from 29.83 in 1999 to 41.12 in 2023 (AAPC=1.69%, 95% CI: 0.30-3.10; P = .017), with a rise from 1999–2018 (APC=1.86%), a surge from 2018–2021 (APC=11.47%), and a decline from 2021–2023 (APC=-12.82%). Males, American Indian or Alaska Native populations, middle-aged adults (45-64 years), and Western/Southern states showed the largest increases. Most deaths (88.16%) occurred in medical facilities.
Conclusion
Sepsis-associated respiratory mortality rose over 25 years, with a pronounced COVID-19-driven surge (2018-2021) and partial post-2021 decline. Persistent disparities by sex, race, age, and region highlight the need for targeted interventions, improved screening, and equity-focused policies to address systemic vulnerabilities.
Keywords
Introduction
Sepsis is defined as a life-threatening organ dysfunction caused by a heightened immune response to infection, resulting in tissue damage, organ failure, and death if not treated promptly. 1 It affects an estimated 1.7 million adults annually in the United States, with more than 350,000 deaths occurring mostly in hospital or after discharge. It is one of the notable causes of in-hospital mortality and a major contributor of critical care admissions. 2
Respiratory diseases are the leading source of sepsis, with pneumonia and other lower respiratory tract infections accounting for a large share of cases. 3 On the other hand, sepsis can also worsen chronic lung conditions such as chronic obstructive pulmonary disease (COPD), asthma, and interstitial lung disease, and in severe cases lead to acute respiratory failure. 4 Patients with both sepsis and respiratory disease have among the highest mortality rates in critical care. Sepsis-associated acute respiratory distress syndrome (ARDS) carries intensive care unit mortality rates of approximately 30%–40%. 5 with even higher rates in older adults and those with multiple comorbidities. 6
The COVID-19 pandemic had inequitable effects on sepsis-related death rates. The national mortality data show that COVID-19 was involved in approximately one-sixth of sepsis-related deaths from 2020 to 2022. 7 The pandemic caused an increased number of deaths from sepsis and respiratory diseases because SARS-CoV-2 infection produced inflammatory and respiratory complications, which led to a 36,000 increase in sepsis-related deaths above predicted trends during 2020. 8 Even the implementation of early recognition and antimicrobial therapy for sepsis management has not eliminated the existing outcome gaps. Sepsis patients, especially older adults, men, racial and ethnic minorities, and residents of the South and rural areas experience higher mortality rates, which have not improved significantly since 2018.7,9 The mortality trends of sepsis-associated respiratory disease remain understudied at the national level because of limited research in this area. The majority of research studies have investigated sepsis or respiratory disease mortality independently without considering deaths that involve both conditions.2,10 The current research lacks any study that investigates sepsis-associated respiratory disease mortality across 25 years in the United States while examining COVID-19's disproportionate effects on these deaths.
The analysis of these patterns serves essential purposes by helping identify vulnerable groups and consequences to develop appropriate prevention strategies. This research aims to address the existing knowledge gap by analyzing age-adjusted mortality rates for sepsis-associated respiratory diseases in U.S. adults from 1999 to 2023 while considering demographic and geographic factors.
Methods
Study Design and Data Source
This retrospective cohort study analyzed mortality data from the Centers for Disease Control and Prevention Wide-ranging Online Data for Epidemiologic Research (CDC WONDER) Multiple Cause of Death database (1999-2023). The database compiles U.S. death certificate data, capturing underlying and contributing causes of death coded using the International Classification of Diseases, 10th Revision (ICD-10), alongside demographic and geographic details. As the data are publicly available and de-identified, the study was exempt from institutional review board approval.
Case Definition and Population
Adults aged ≥24 years with death records listing both a respiratory disease (ICD-10 codes J00–J98, including chronic obstructive pulmonary disease, asthma, and interstitial lung disease) and a sepsis-related condition (ICD-10 codes A02.1, A22.7, A26.7, A32.7, A40.0–A41.9, A42.7, B37.7) as underlying or contributing causes of death were included. Sepsis codes were selected based on established epidemiological definitions to capture bacterial and fungal septicemias comprehensively. 3
Demographic and Geographic Variables
Mortality data were stratified by sex (male, female), race/ethnicity (non-Hispanic White, non-Hispanic Black, non-Hispanic American Indian or Alaska Native, Hispanic), age group (25-34, 35-44, 45-54, 55-64, 65-74, 75-84, ≥85 years, per CDC standard groupings), U.S. Census region (Northeast, Midwest, South, West), states, and place of death (eg, hospital, home). These variables enabled analysis of disparities in sepsis-associated respiratory disease mortality.
Statistical Analysis
Age-adjusted mortality rates (AAMRs) per 100,000 population were calculated using the 2000 U.S. standard population to adjust for age distribution. AAMRs were computed annually and stratified by demographic and geographic variables. Temporal trends were analyzed using Joinpoint Regression Software (version 5.4.0, National Cancer Institute, Bethesda, MD). Joinpoint regression identified significant changes in trends, fitting linear segments with up to three joinpoints. Annual percent changes (APCs) with 95% confidence intervals (CIs) were estimated for each segment using the Monte Carlo permutation test (4500 permutations to determine the optimal number of joinpoints). Average annual percent changes (AAPCs) with 95% CIs summarized trends over the study period. Statistical significance was assessed with a two-tailed t-test (P < .05). To account for multiple comparisons in subgroup analyses (sex, race, age, region, state), we applied Bonferroni correction (adjusted α = 0.01 for 5 main strata). Data was managed using Microsoft Excel and Joinpoint software.
Results
From 1999 to 2023, there were 2,090,242 deaths related to combined respiratory and sepsis conditions, 4,295,245 sepsis-only deaths, and 17,230,374 respiratory-only deaths (Supplementary Table 1). Combined respiratory and sepsis mortality increased significantly from an age-adjusted mortality rate (AAMR) of 29.83 per 100,000 in 1999 to 41.12 in 2023 (average annual percent change [AAPC] = 1.69%, 95% confidence interval [CI]: 0.30-3.10; P = .017). Mortality rose steadily from 1999 to 2018 (annual percent change [APC] = 1.86%, 95% CI: 1.49-2.24; P < .001), surged from 2018 to 2021 (APC = 11.47%, 95% CI: 1.10-22.90; P = .031), and declined from 2021 to 2023 (APC = −12.82%, 95% CI: −20.74 to −4.10; P = .007). Respiratory-only mortality was stable, with an AAMR of 351.13 in 1999 decreasing to 296.33 in 2023 (AAPC = −0.63%, 95% CI: −1.62 to 0.36; P = .210), declining from 1999 to 2018 (APC = −1.08%, 95% CI: −1.31 to −0.84; P < .001), increasing from 2018 to 2021 (APC = 14.34%, 95% CI: 6.59-22.65; P = .001), and declining from 2021 to 2023 (APC = −16.01%, 95% CI: −21.68 to −9.93; P < .001). Sepsis-only mortality was stable, with an AAMR of 77.83 in 1999 increasing to 81.79 in 2023 (AAPC = 0.33%, 95% CI: −0.73 to 1.40; P = .545), stable from 1999 to 2018 (APC = 0.10%, 95% CI: −0.16 to 0.36; P = .430), increasing from 2018 to 2021 (APC = 8.14%, 95% CI: 0.27-16.63; P = .043), and declining from 2021 to 2023 (APC = −8.38%, 95% CI: −14.84 to −1.42; P = .022) (Figure 1).
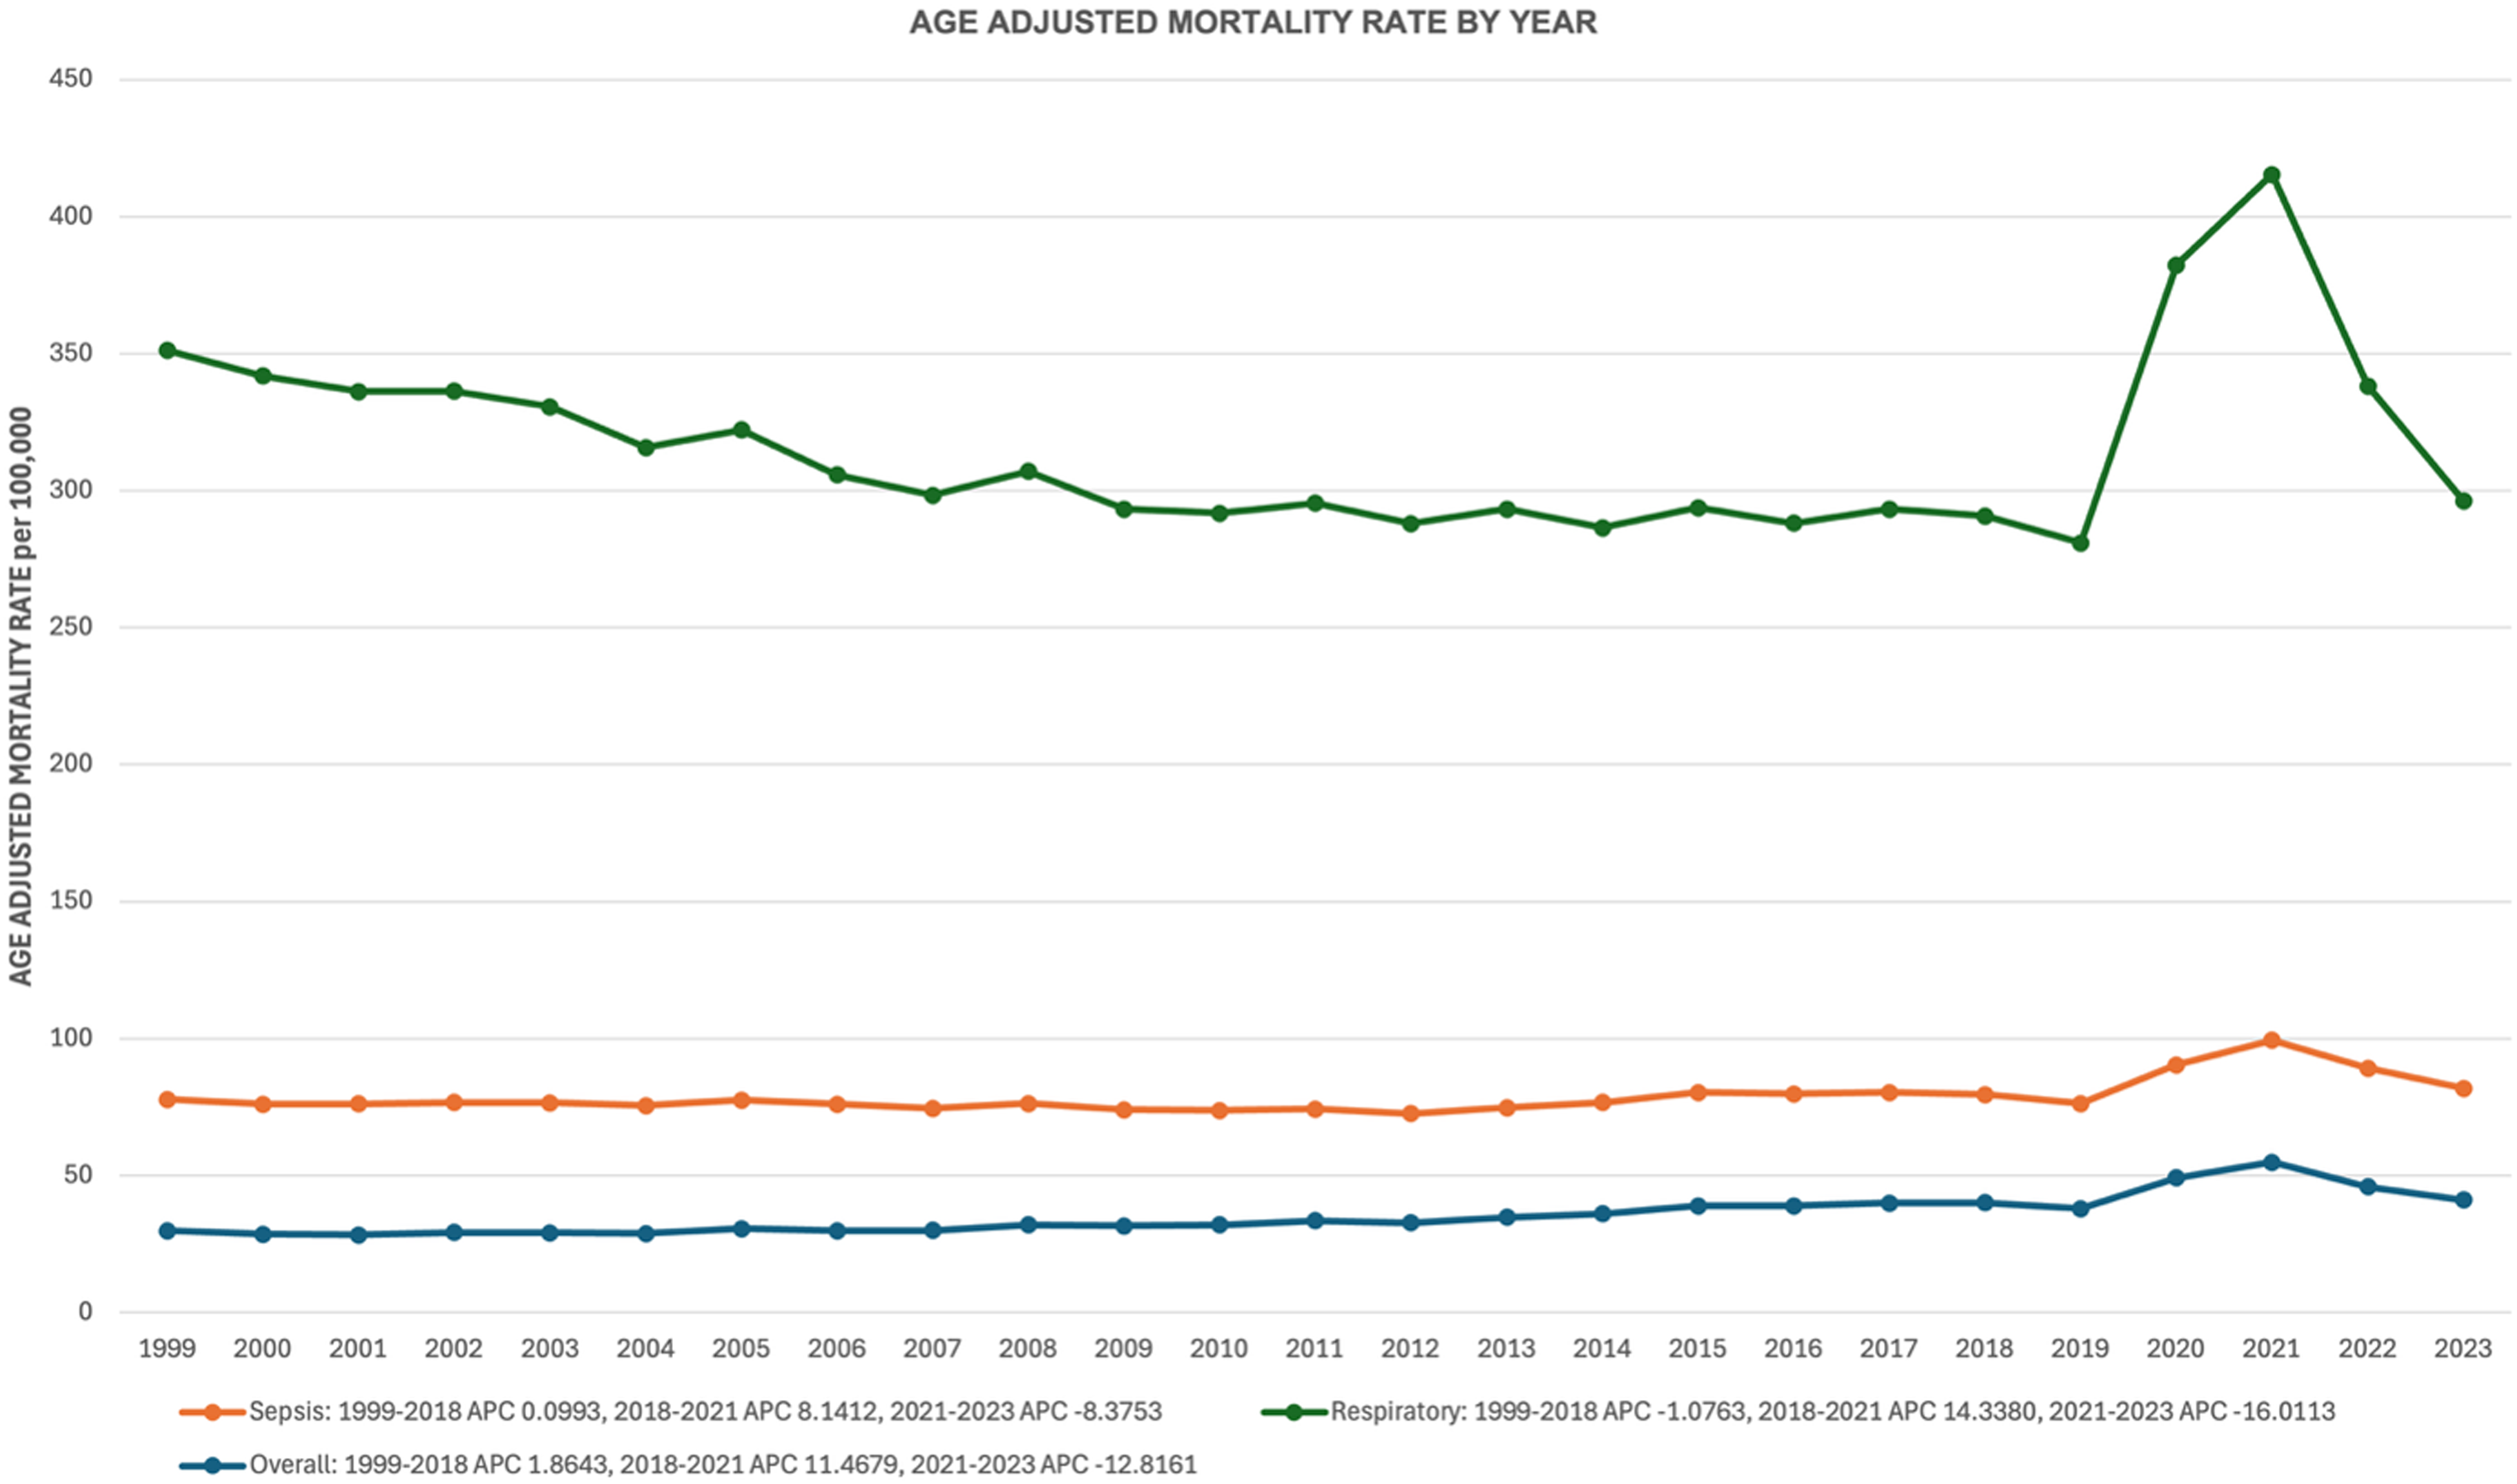
Joinpoint regression plot of age-adjusted mortality rates (AAMRs) per 100,000 population for combined respiratory and sepsis, sepsis-only, and respiratory-only deaths in the United States.
Gender-Stratified Mortality
Of the combined respiratory and sepsis deaths, 1,076,312 (51.49%) were male and 1,013,930 (48.51%) were female (Supplementary Table 2). Female mortality increased from an AAMR of 24.66 in 1999 to 34.85 in 2023 (AAPC = 1.77%, 95% CI: 0.43-3.12; P = .009), rising from 1999 to 2018 (APC = 2.01%, 95% CI: 1.66-2.36; P < .001), increasing non-significantly from 2018 to 2021 (APC = 9.41%, 95% CI: −0.37 to 20.15; P = .059), and declining from 2021 to 2023 (APC = −10.75%, 95% CI: −18.54 to −2.22; P = .018). Male mortality increased from an AAMR of 37.89 in 1999 to 49.32 in 2023 (AAPC = 1.48%, 95% CI: 0.03-2.96; P = .045), rising from 1999 to 2018 (APC = 1.57%, 95% CI: 1.16-1.97; P < .001), surging from 2018 to 2021 (APC = 12.95%, 95% CI: 2.02-25.06; P = .022), and declining from 2021 to 2023 (APC = −14.24%, 95% CI: −22.39 to −5.24; P = .005) (Figure 2).
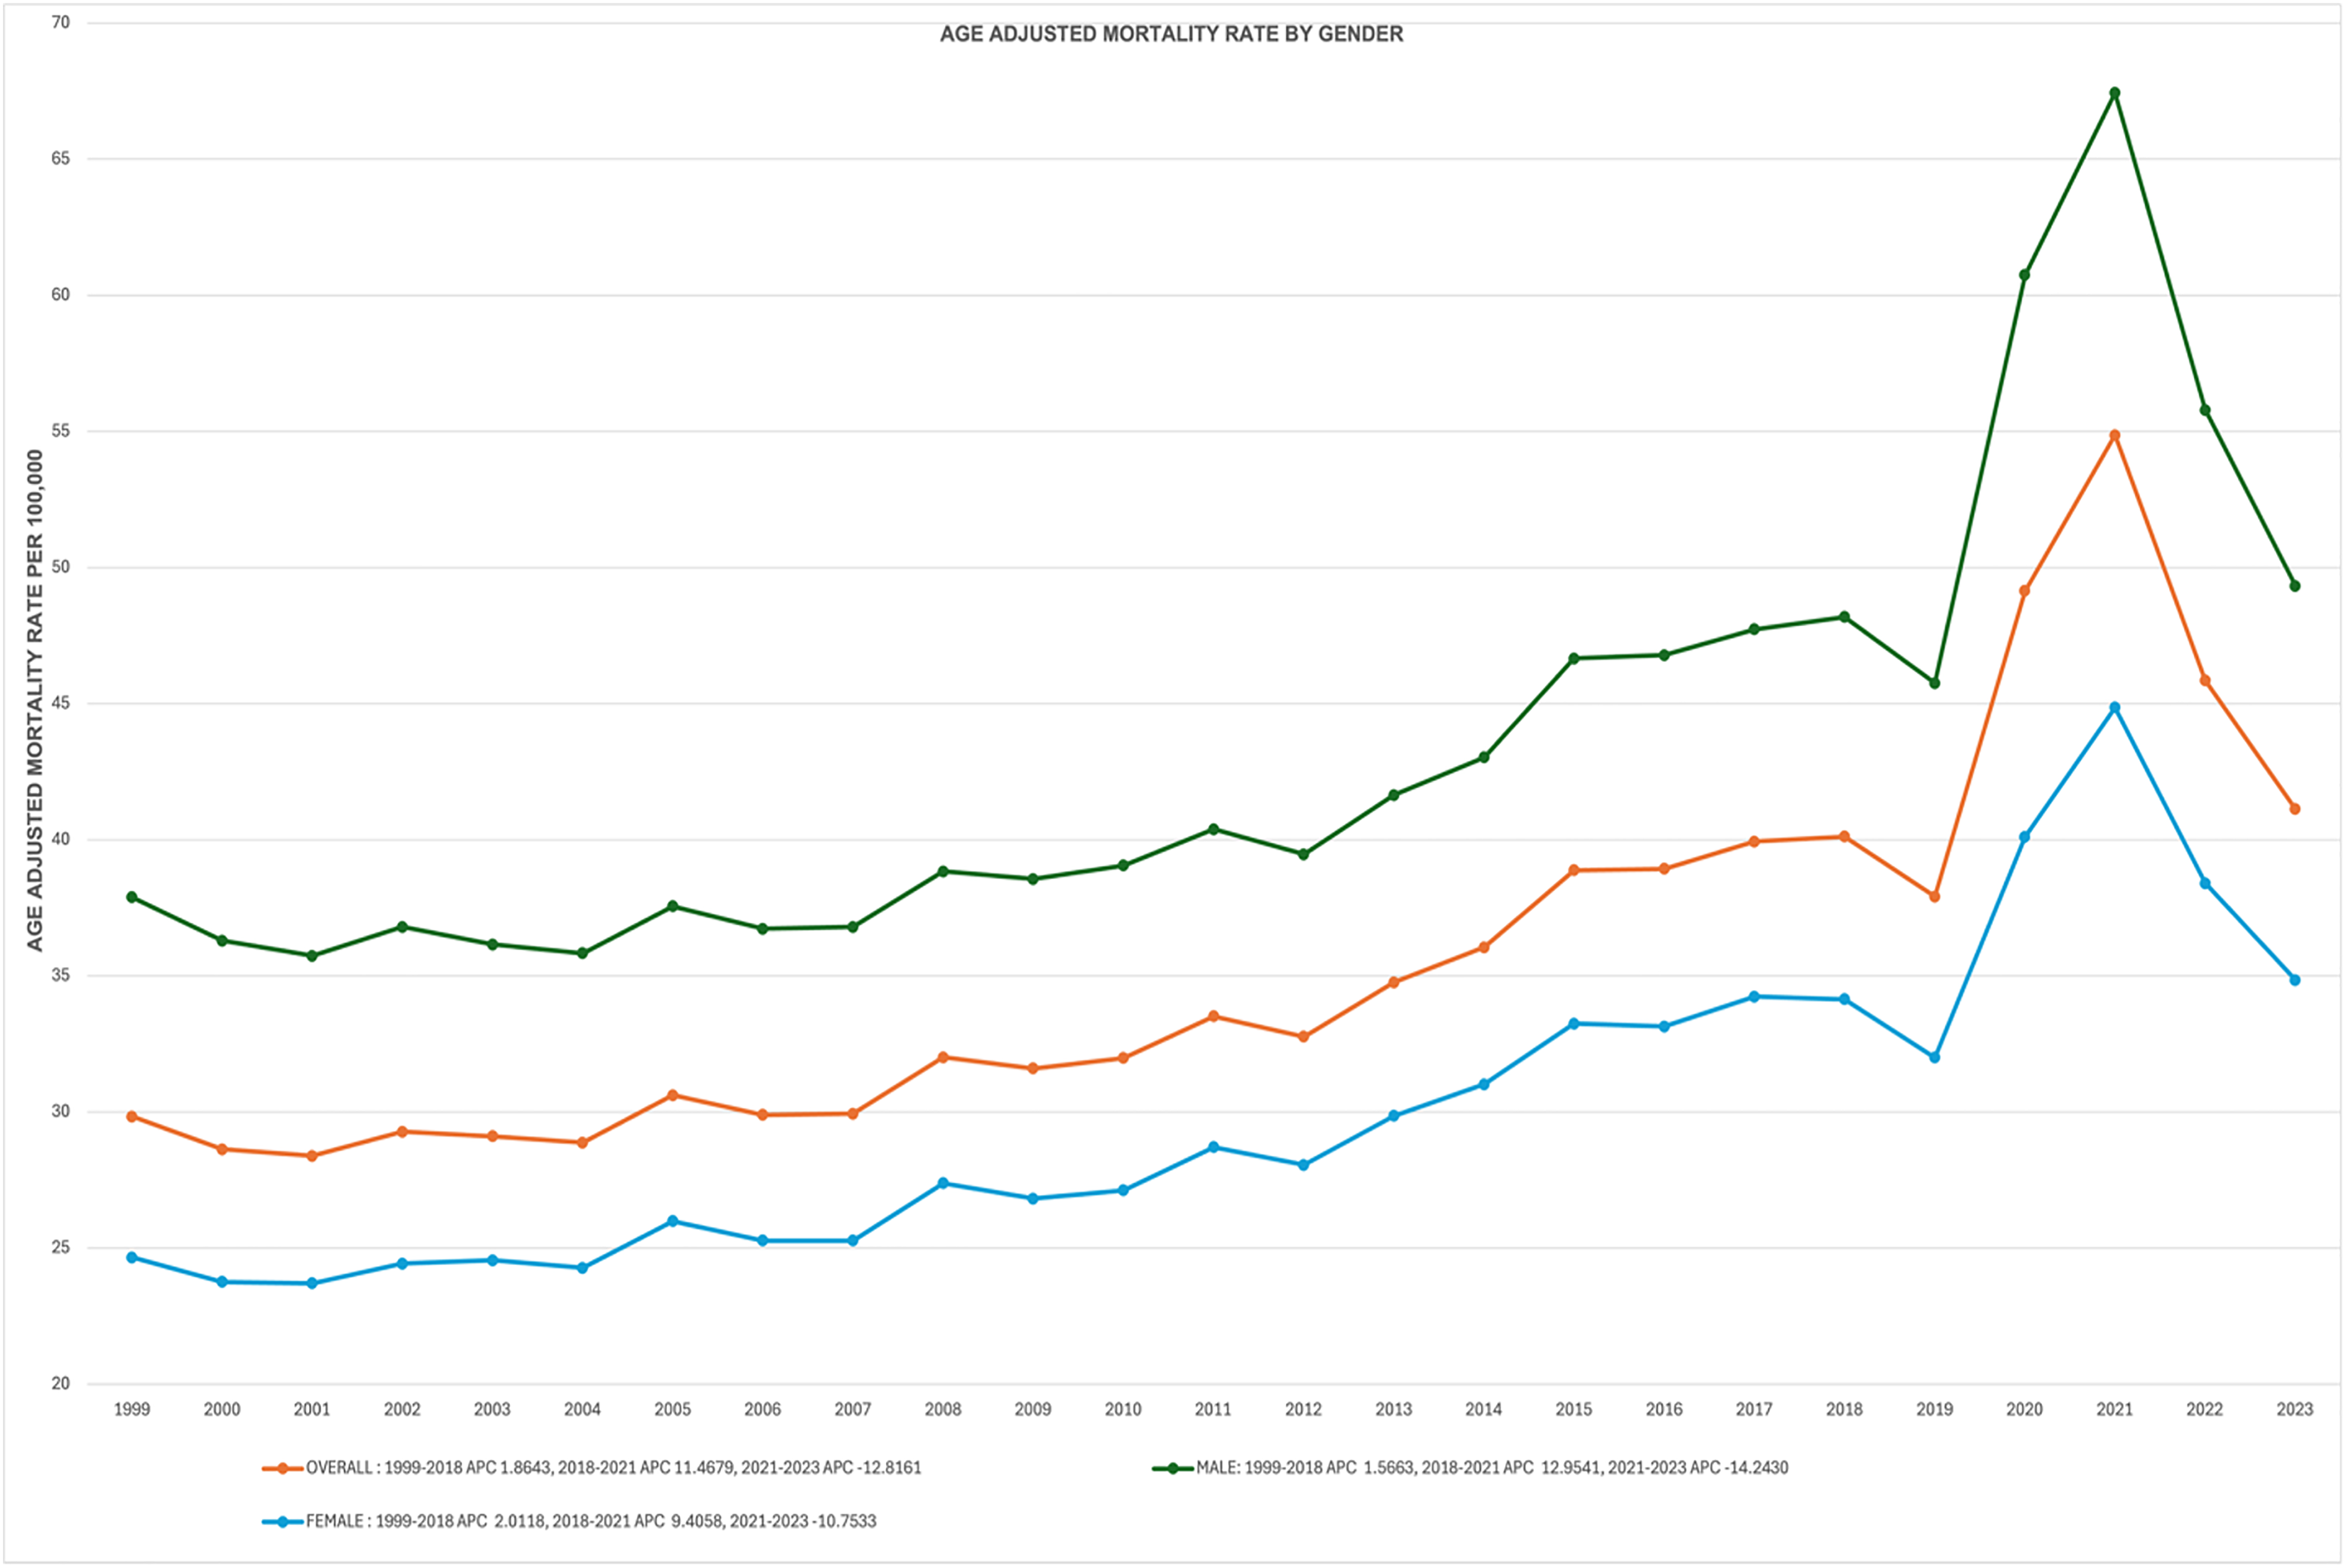
Line graph of AAMRs per 100,000 population for sepsis-associated respiratory disease mortality stratified by gender (male, female) in the United States, 1999–2023.
Race-Stratified Mortality
American Indian or Alaska Native populations had the largest increase, with an AAMR of 34.97 in 1999 rising to 56.06 in 2023 (AAPC = 2.44%, 95% CI: 0.76-4.14; P = .004), increasing from 1999 to 2018 (APC = 3.07%, P < .001), surging from 2018 to 2021 (APC = 12.35%, P = .047), and declining from 2021 to 2023 (APC = −15.87%, P = .006) (Supplementary Table 3). White populations increased from an AAMR of 26.86 to 40.18 (AAPC = 2.05%, 95% CI: 0.52-3.62; P = .009), rising from 1999 to 2018 (APC = 2.25%, P < .001), increasing non-significantly from 2018 to 2021 (APC = 9.28%, P = .100), and declining non-significantly from 2021 to 2023 (APC = −9.59%, P = .059). Hispanic or Latino populations were stable, with an AAMR of 34.75 to 38.98 (AAPC = 0.76%, 95% CI: −0.20 to 1.73; P = .121), rising from 1999 to 2018 (APC = 0.96%, P < .001), surging from 2018 to 2021 (APC = 20.63%, P < .001), and declining from 2021 to 2023 (APC = −24.53%, P < .001). Asian or Pacific Islander populations were stable, with an AAMR of 26.16 to 28.86 (AAPC = 0.48%, 95% CI: −0.34 to 1.31; P = .253), rising from 1999 to 2018 (APC = 0.39%, P = .007), surging from 2018 to 2021 (APC = 11.11%, P = .001), and declining from 2021 to 2023 (APC = −12.83%, P < .001). Black or African American populations were stable, with an AAMR of 55.55 to 56.55 (AAPC = 0.40%, 95% CI: −0.90 to 1.71; P = .553), stable from 1999 to 2018, surging from 2018 to 2021 (APC = 15.73%, P = .004), and declining from 2021 to 2023 (APC = −16.63%, P = .001) (Figure 3).
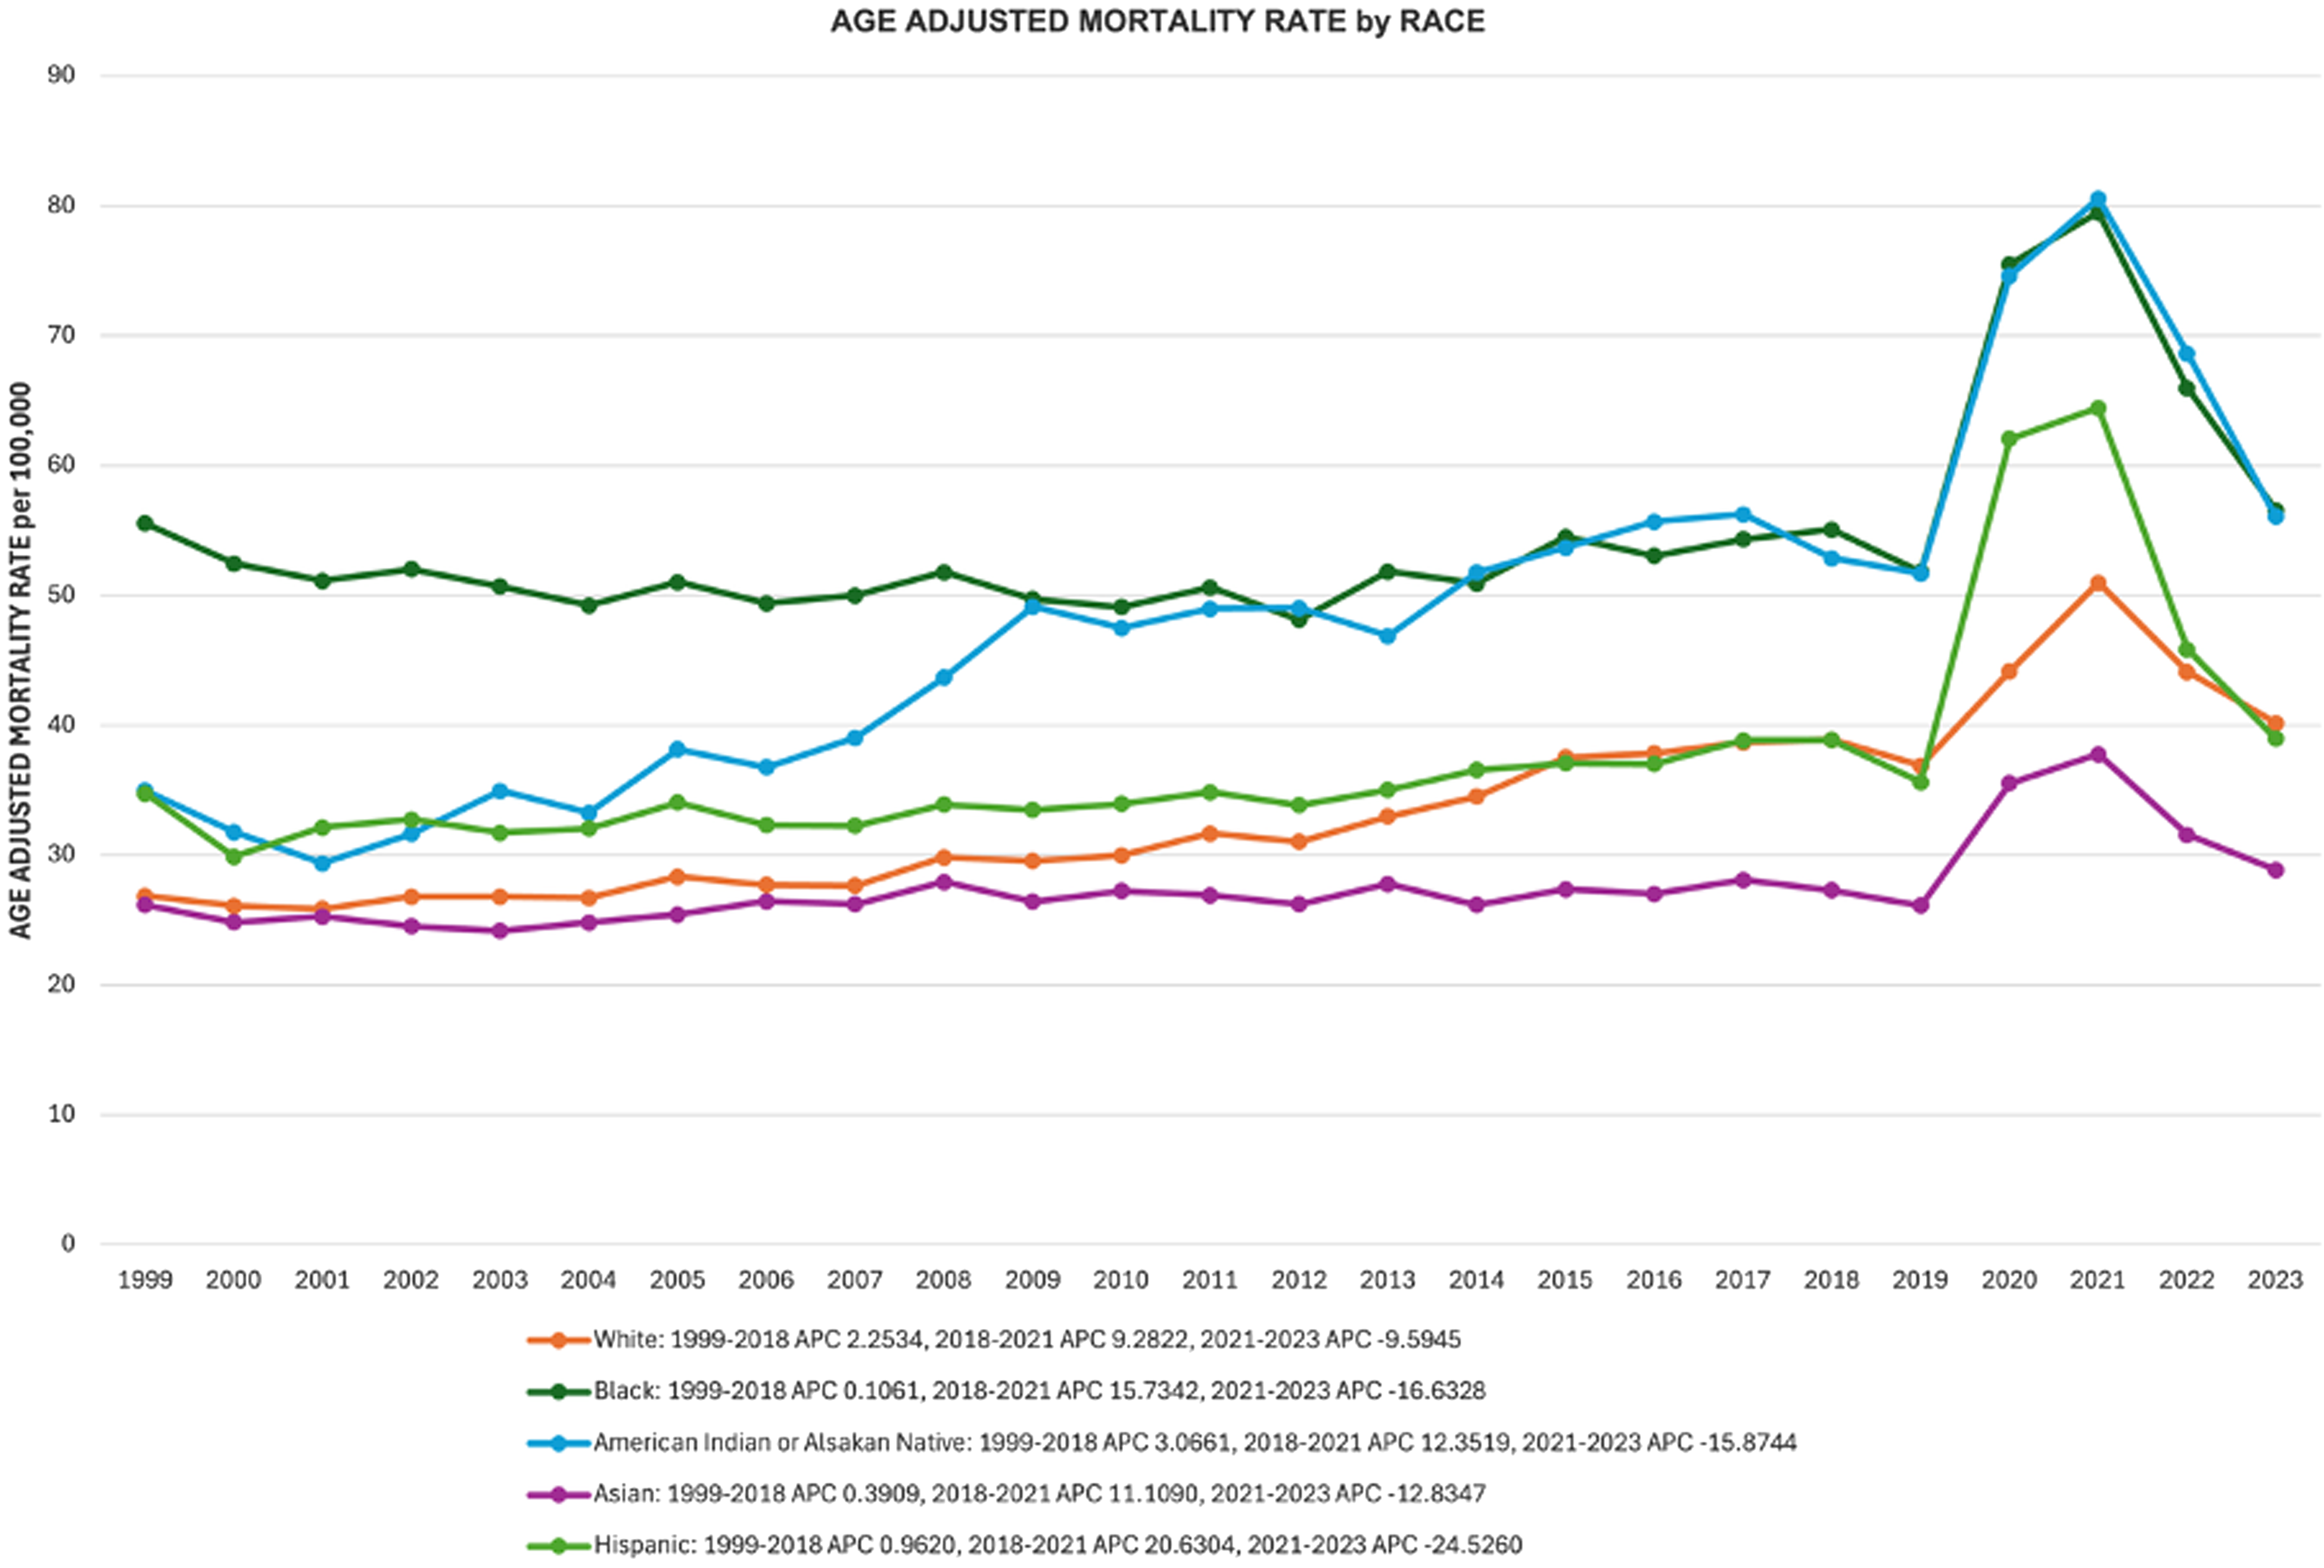
Line graph of AAMRs per 100,000 population for sepsis-associated respiratory disease mortality stratified by race/ethnicity (non-Hispanic White, non-Hispanic Black, Hispanic, Asian or Pacific Islander, American Indian or Alaska Native) in the United States, 1999–2023.
Regional Mortality Trends
The West showed the largest increase, with an AAMR of 26.20 in 1999 rising to 40.44 in 2023 (AAPC = 2.05%, 95% CI: 1.12-2.98; P < .001), increasing from 1999 to 2018 (APC = 2.26%, P < .001), surging from 2018 to 2021 (APC = 9.97%, P = .007), and declining from 2021 to 2023 (APC = −10.59%, P = .001) (Supplementary Table 4). The Midwest (AAMR: 26.43 to 37.00; AAPC = 1.88%, 95% CI: 0.22-3.56; P = .026) and South (AAMR: 33.37 to 46.62; AAPC = 1.77%, 95% CI: 0.17-3.41; P = .030) also increased, rising from 1999 to 2018 (Midwest: APC = 2.07%, P < .001; South: APC = 2.03%, P < .001), surging from 2018 to 2021 (Midwest: APC = 10.92%, P = .075; South: APC = 13.62%, P = .028), and declining from 2021 to 2023 (Midwest: APC = −11.89%, P = .033; South: APC = −15.75%, P = .004). The Northeast was stable, with an AAMR of 31.15 in 1999 to 35.13 in 2023 (AAPC = 0.59%, 95% CI: −0.54 to 1.72; P = .307), stable from 1999 to 2009, rising from 2009 to 2018 (APC = 1.51%, P = .004), increasing non-significantly from 2018 to 2021 (APC = 5.91%, P = .129), and declining from 2021 to 2023 (APC = −7.73%, P = .037) (Figure 4).
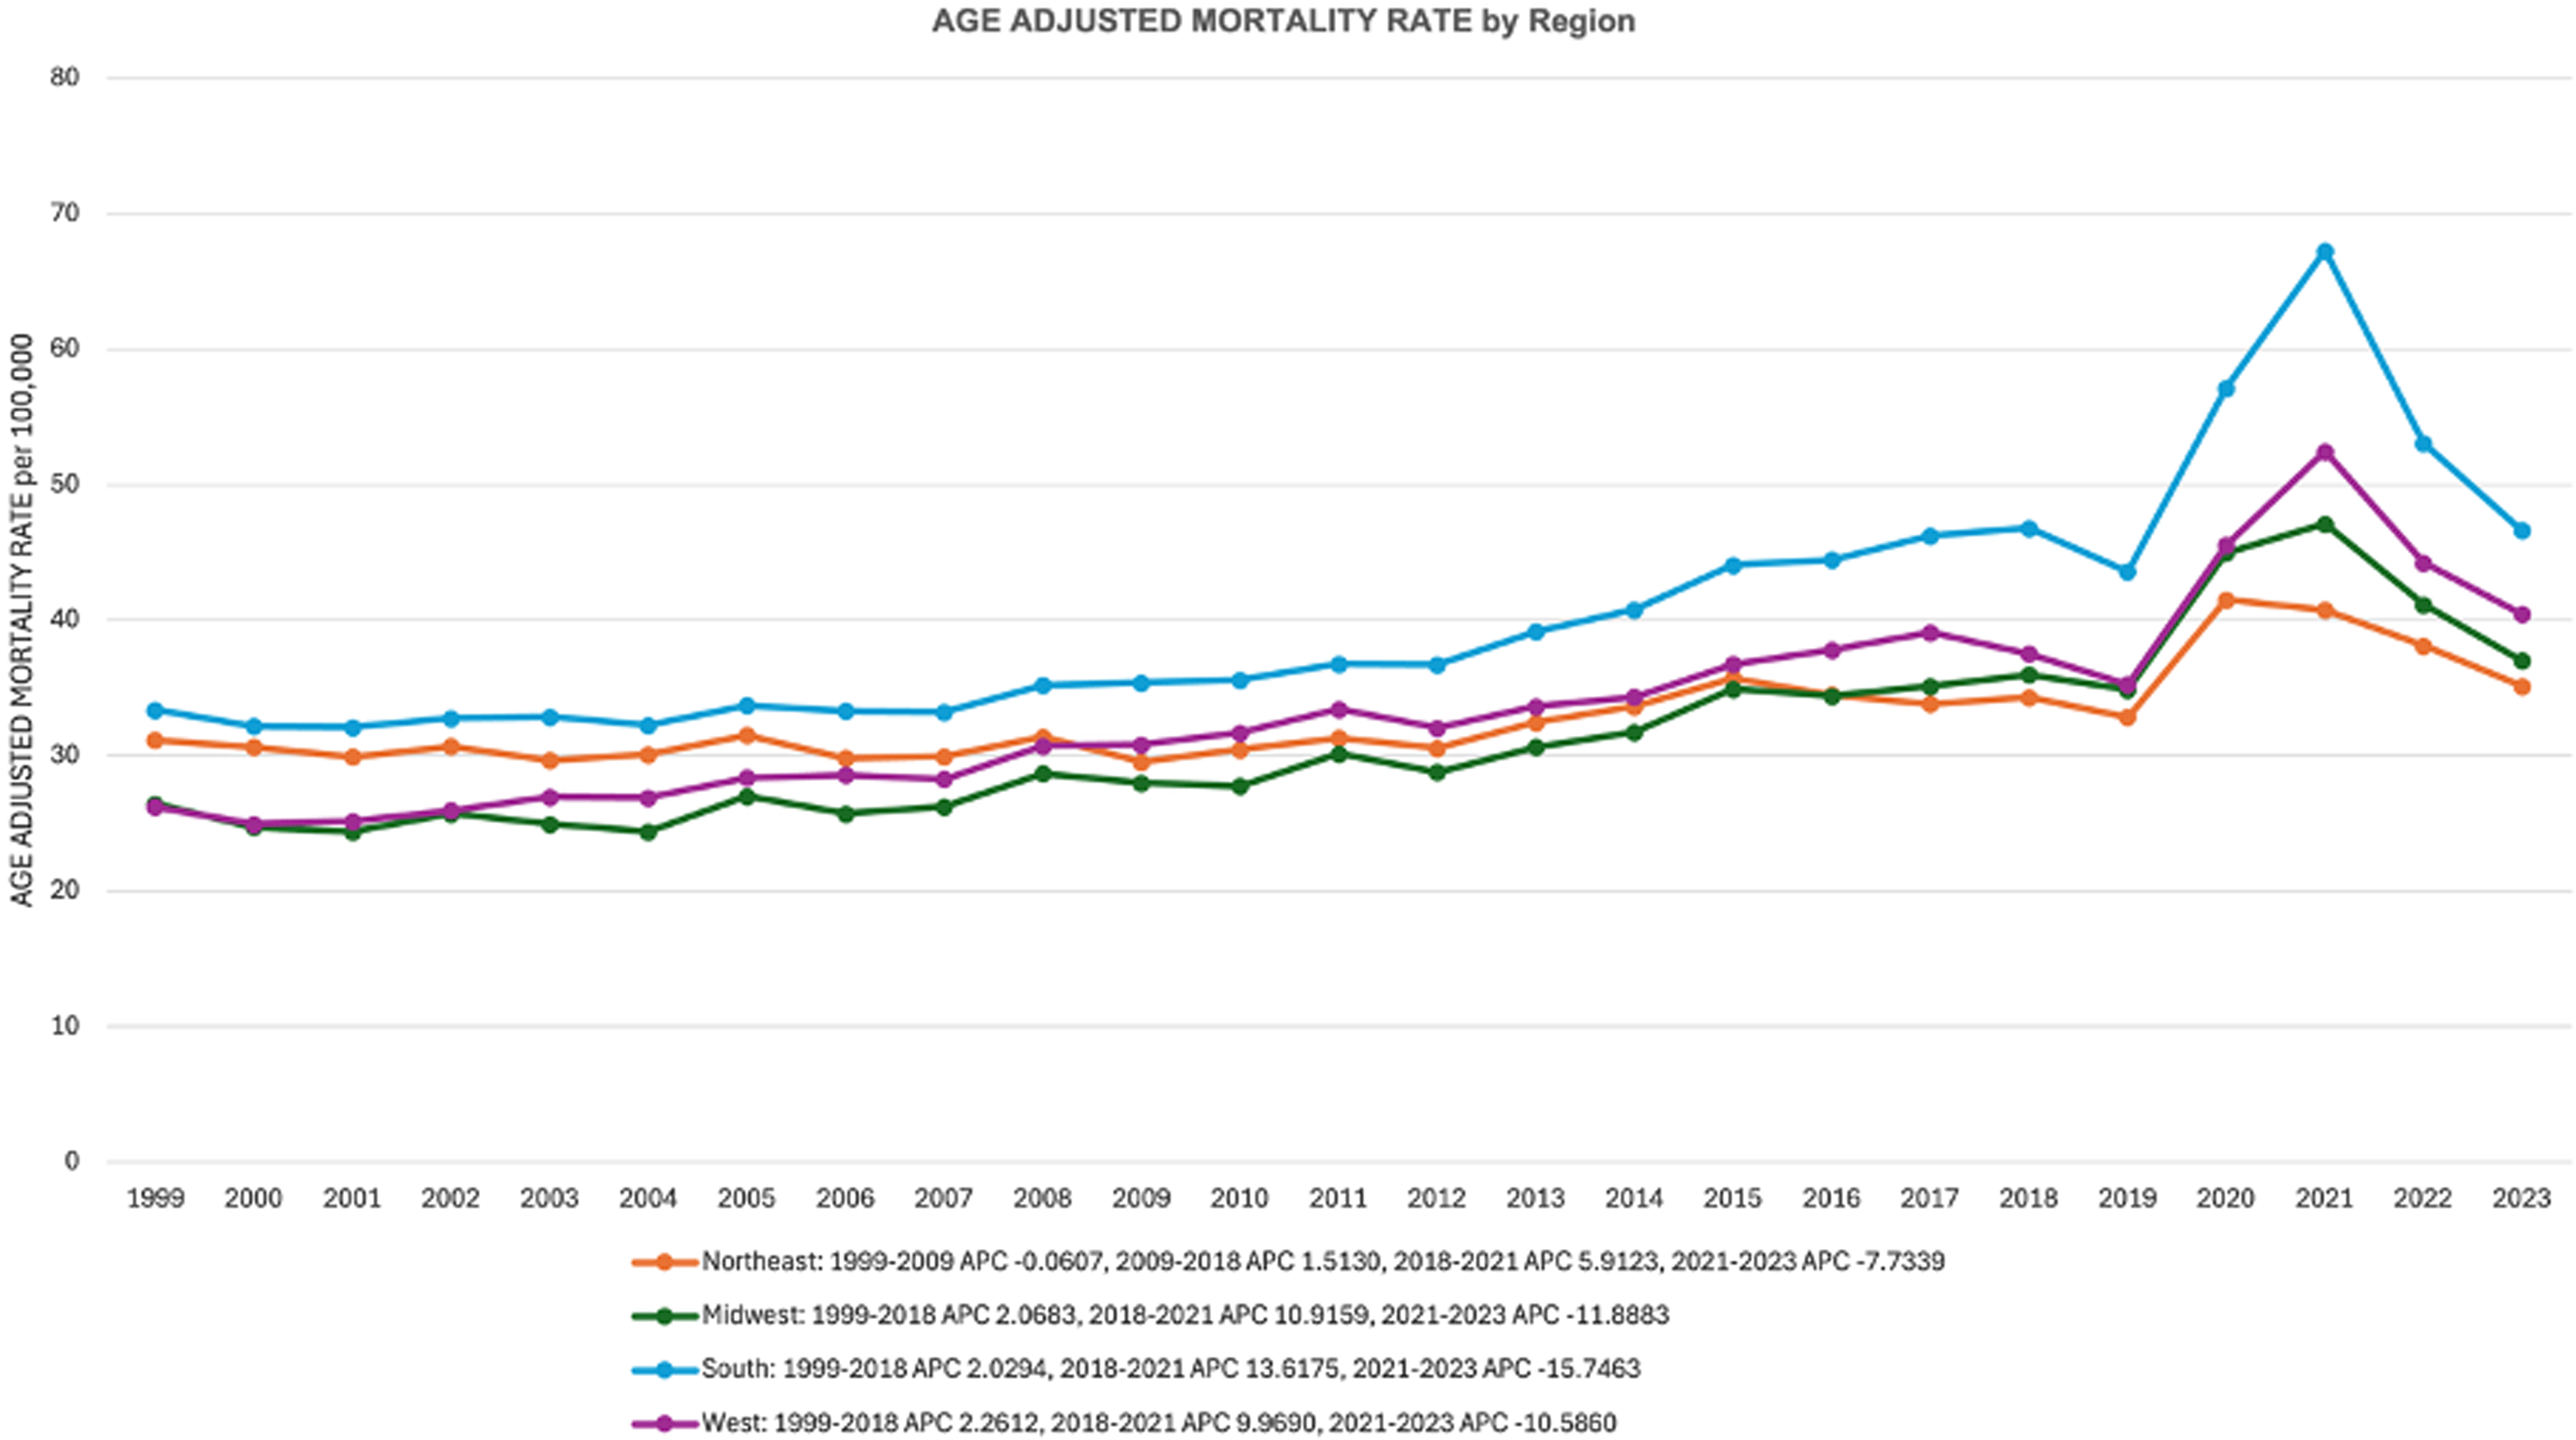
Line graph of AAMRs per 100,000 population for sepsis-associated respiratory disease mortality stratified by U.S. Census region (Northeast, Midwest, South, West) in the United States, 1999–2023.
Age-Stratified Mortality
Middle-aged adults (45-64 years) had the largest increase, with an AAMR of 14.26 in 1999 rising to 24.37 in 2023 (AAPC = 2.62%, 95% CI: 1.17-4.10; P < .001), increasing from 1999 to 2018 (APC = 2.94%, P < .001), surging from 2018 to 2021 (APC = 19.75%, P = .001), and declining from 2021 to 2023 (APC = −20.92%, P < .001) (Supplementary Table 5). Young adults (24-44 years) were stable, with an AAMR of 2.86 to 4.56 (AAPC = 1.91%, 95% CI: −0.31 to 4.18; P = .092), stable from 1999 to 2001, rising from 2001 to 2018 (APC = 2.59%, P < .001), surging from 2018 to 2021 (APC = 27.15%, P = .001), and declining from 2021 to 2023 (APC = −21.75%, P < .001). Senior adults (65 + years) increased from an AAMR of 120.83 to 156.84 (AAPC = 1.41%, 95% CI: 0.05-2.79; P = .041), rising from 1999 to 2018 (APC = 1.61%, P < .001), increasing non-significantly from 2018 to 2021 (APC = 8.02%, P = .107), and declining from 2021 to 2023 (APC = −9.47%, P = .037) (Figure 5).
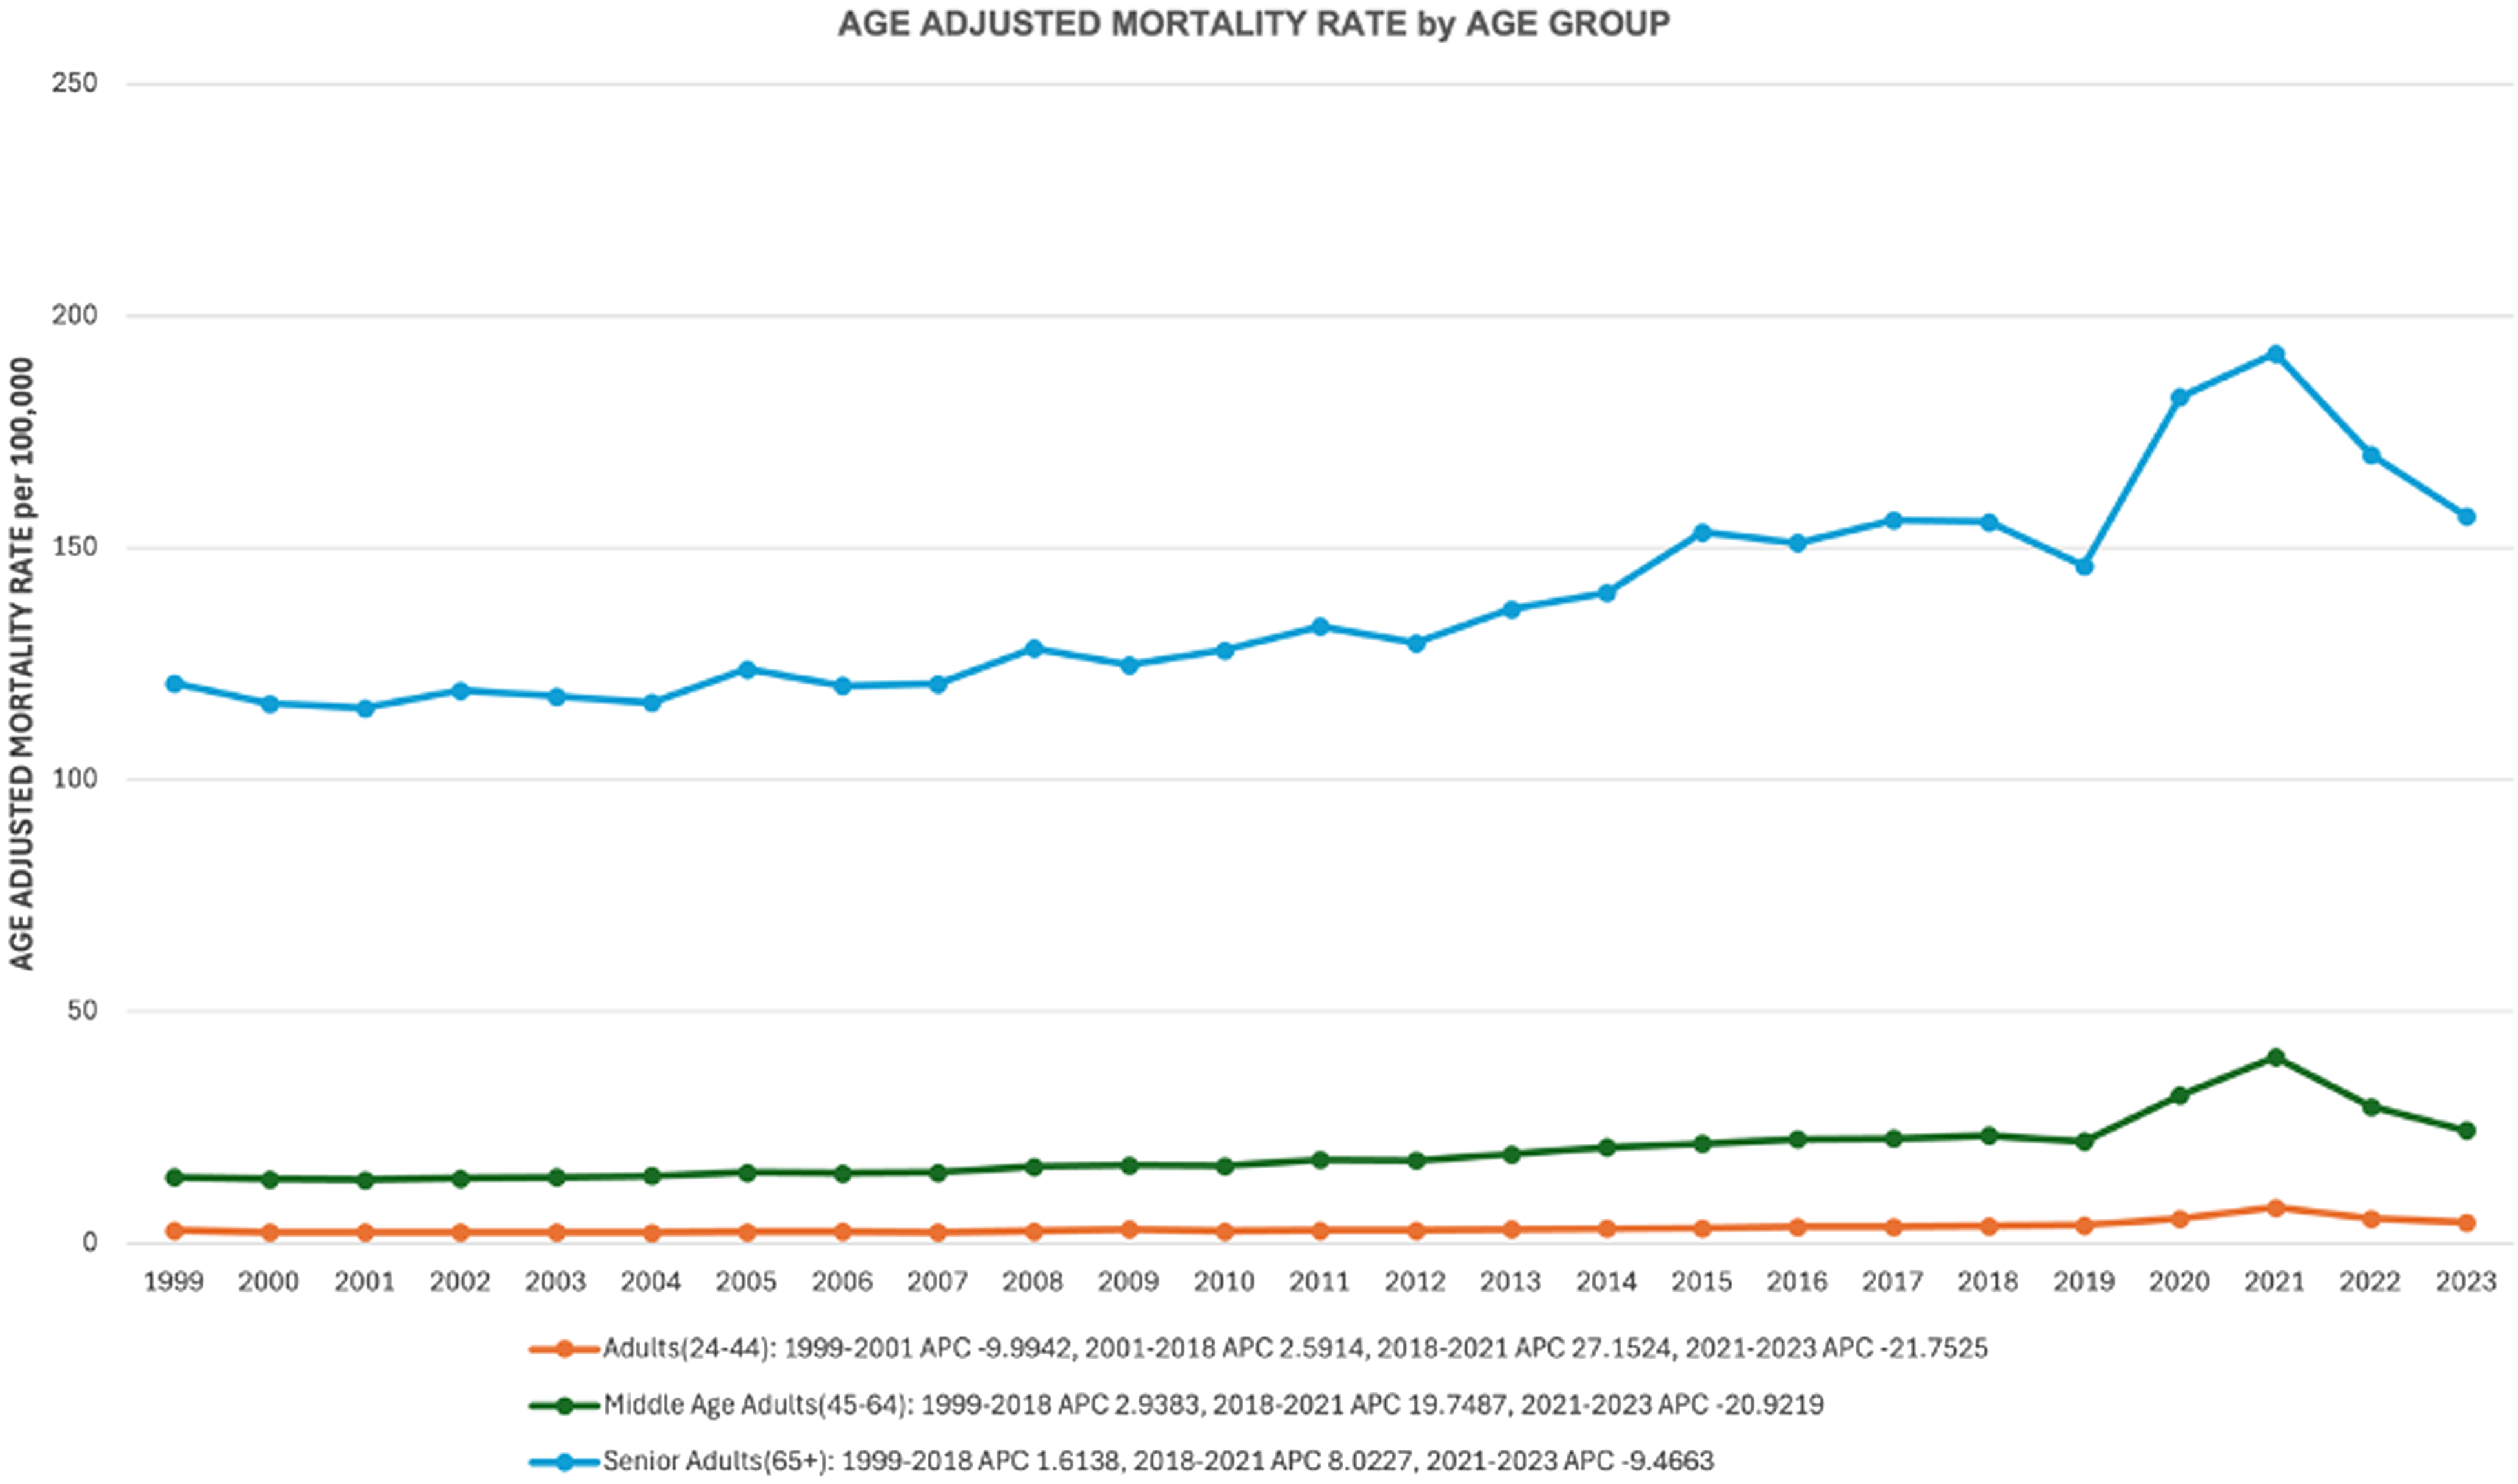
Line graph of AAMRs per 100,000 population for sepsis-associated respiratory disease mortality stratified by age group (24-44, 45-64, 65 + years) in the United States, 1999–2023.
State-Stratified Mortality
Among states, the largest increases were in North Dakota (AAMR: 13.72 to 35.46; AAPC = 4.54%, 95% CI: 2.35-6.78; P < .001), Nebraska (AAMR: 13.55 to 39.40; AAPC = 4.36%, 95% CI: 3.14-5.59; P < .001), and Washington (AAMR: 17.95 to 38.93; AAPC = 4.26%, 95% CI: 3.40-5.12; P < .001), each showing steady increases from 1999 to 2018, surges from 2018 to 2021, and declines from 2021 to 2023 (Supplementary Table 6). The largest decreases were in Rhode Island (AAMR: 38.49 to 19.19; AAPC = −3.25%, 95% CI: −4.75 to −1.73; P < .001) and Maine (AAMR: 17.53 to 8.34; AAPC = −3.04%, 95% CI: −5.18 to −0.84; P = .007), both declining steadily from 1999 to 2023, with sharper declines post-2021 (Figure 6).
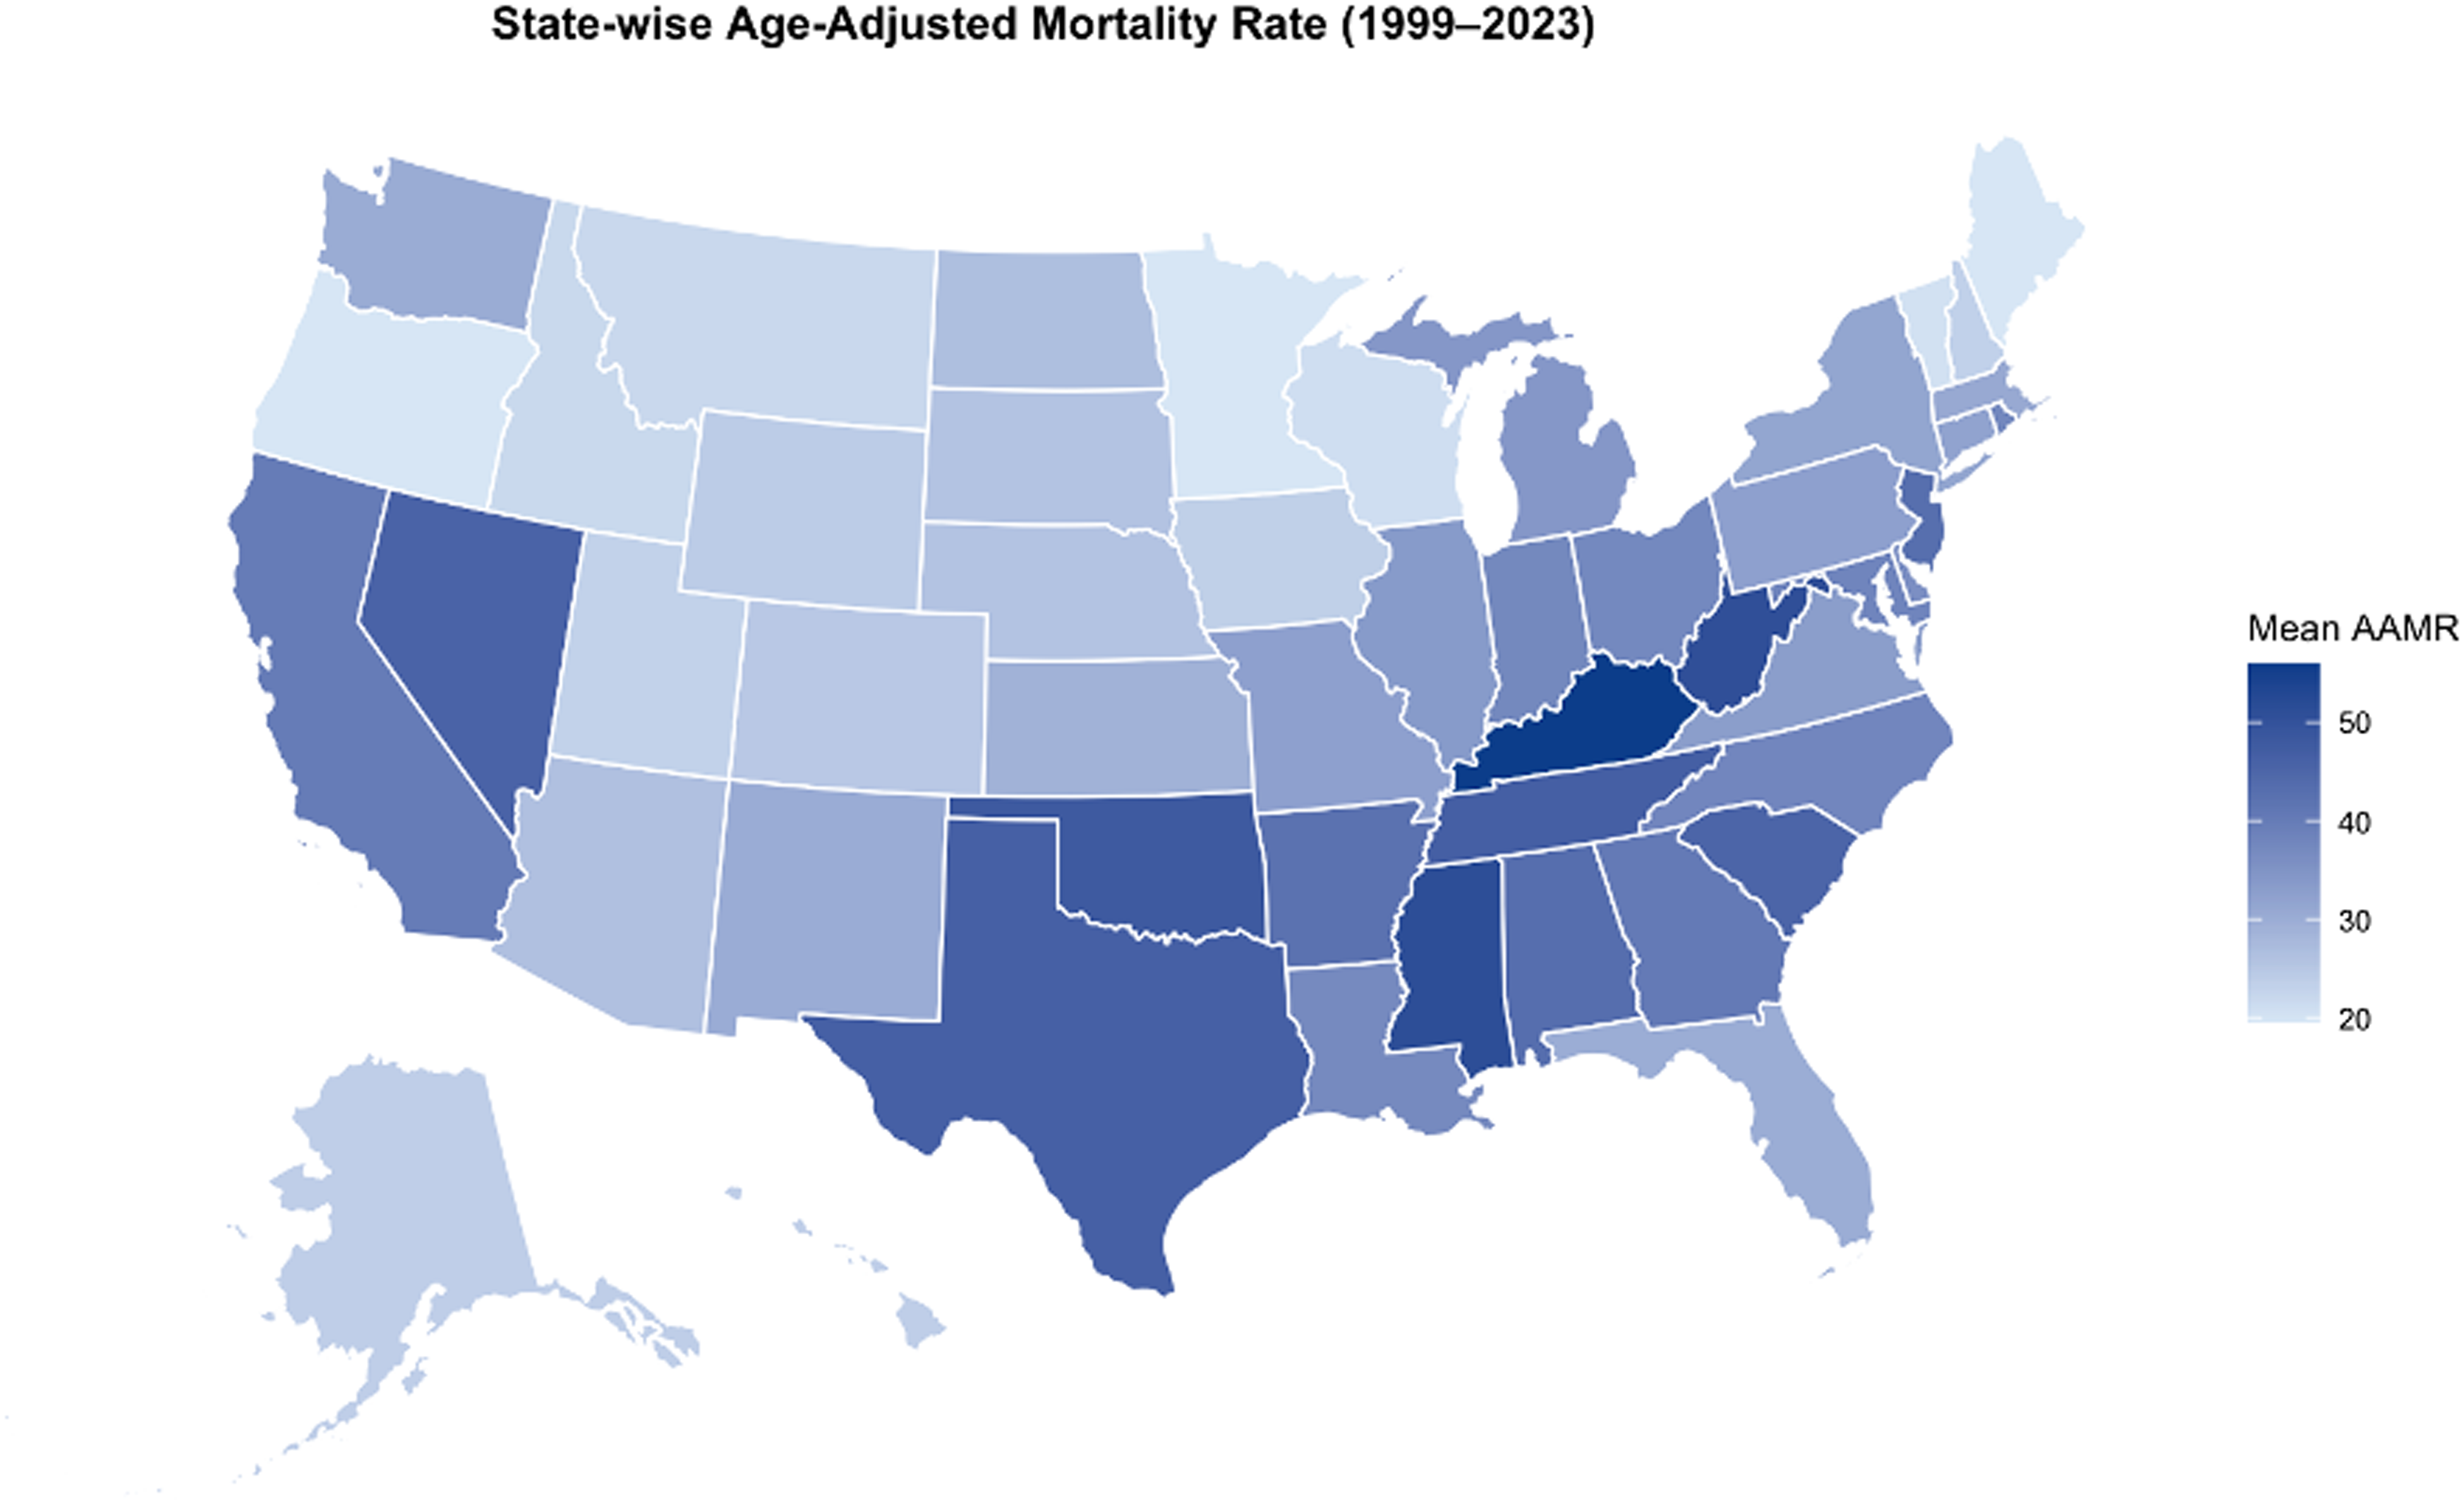
States map for sepsis-associated respiratory disease mortality 1999–2023.
Place of Death
Among 2,019,093 deaths attributed to sepsis-associated respiratory diseases from 1999 to 2023 with available place-of-death data, 88.16% (n = 1,779,994) occurred in medical facilities, 5.16% (n = 104,140) in nursing homes or long-term care settings, 3.16% (n = 63,730) in hospice facilities, 2.44% (n = 49,363) in decedents’ homes, and 0.85% (n = 17,220) in other locations; place of death was unknown in 0.23% (n = 4646) of cases (Figure 7).
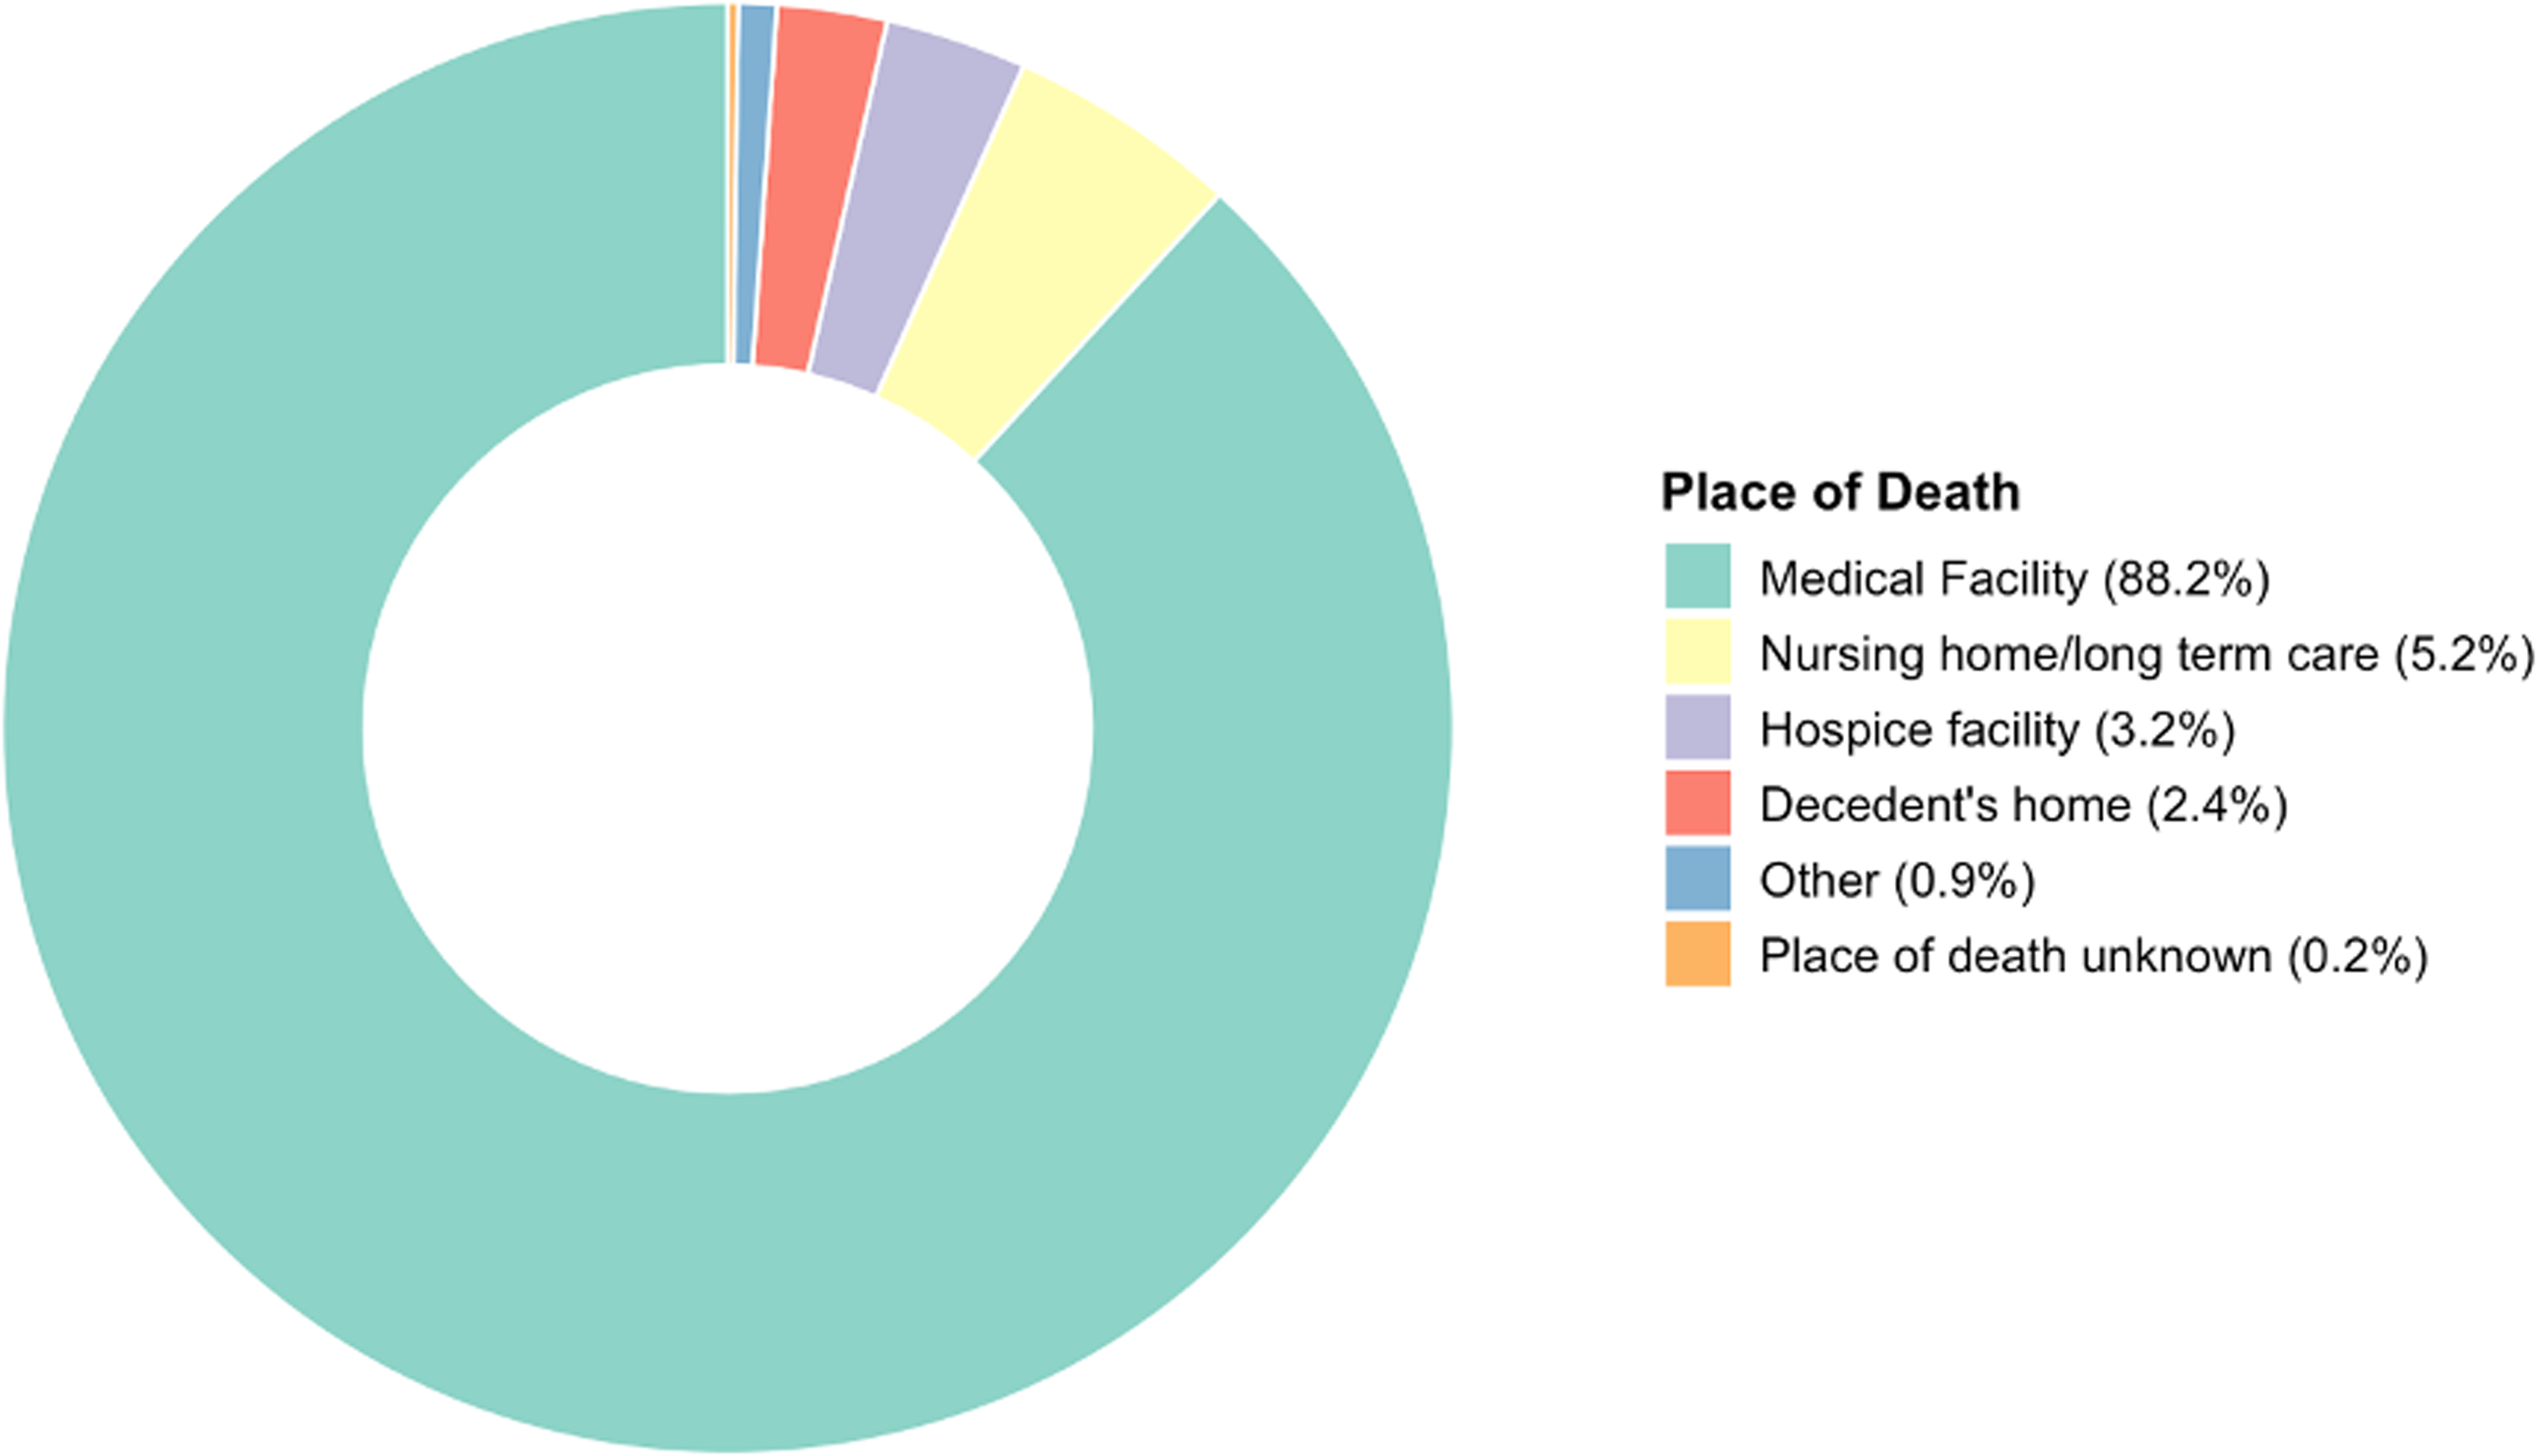
Donut graph depicting the distribution of place of death for sepsis-associated respiratory disease deaths in the United States, 1999–2023.
Discussion
This nationwide analysis of combined respiratory and sepsis-related mortality in the United States from 1999 to 2023 reveals a tri-phasic trend: a gradual increase until 2018, a sharp surge from 2018 to 2021, and a subsequent decline thereafter. These patterns were mirrored in respiratory-only and sepsis-only categories, highlighting the interplay between infectious respiratory conditions and systemic sepsis responses. 11 The pre-2018 rise may reflect aging populations, increasing comorbidities, and evolving diagnostic practices, including potential influences from changes in ICD-10 coding and awareness leading to modest rises post-2012, though misclassification bias from these shifts could artifactually inflate trends. 12 while the post-2021 decline aligns with advancements in vaccination, therapeutics, and public health measures, though rates remain elevated above pre-pandemic levels. 13 Similar trends have been observed in multinational studies, where sepsis mortality showed heterogeneous declines over decades, influenced by healthcare improvements and pathogen dynamics. 14
The COVID-19 pandemic emerged as a dominant driver of the 2018 to 2021 surge, exacerbating respiratory pathologies through mechanisms like hyperinflammation, acute respiratory distress syndrome (ARDS), and secondary bacterial infections. 15 This led to excess sepsis-related deaths, with COVID-19 contributing to approximately one-sixth of sepsis mortality between 2020 and 2022. 7 Studies confirm that SARS-CoV-2 disrupted immune and endothelial functions, increasing septic complications and overwhelming healthcare systems. 8 The subsequent decline post-2021 likely stems from widespread vaccination, reduced viral transmission, and restored medical protocols, yet lingering vulnerabilities persist, as evidenced by persistent excess mortality. 13 However, this sharp decline may primarily reflect the waning phase of the COVID-19 pandemic rather than durable improvements in sepsis prevention or management, and short-term trends should not be overinterpreted as long-term gains. In comparison, respiratory-only mortality shifted from a long-term decline driven by better pneumonia management and smoking reductions to a pandemic spike, underscoring the virus's role in reversing prior gains. 16 Temporal changes in vaccination uptake, including stable/declining pneumococcal coverage (∼65.8% in ≥65 years by 2021) and increasing influenza rates pre-pandemic (annual +1.0% 2017-2022, plateauing during COVID-19), along with high initial COVID-19 uptake in older adults (dropping post-2021), could have influenced pre-pandemic declines and post-2021 recovery through reduced respiratory infections and herd immunity (CDC, 2024; Li et al, 2022). Future meta-regression incorporating vaccination data could clarify these effects.
Sex disparities were evident, with males consistently showing higher mortality rates than females throughout the period. This aligns with biological factors, including weaker immune responses in males due to testosterone's immunosuppressive effects and estrogen's protective role. 17 Behavioral contributors, such as higher smoking rates and occupational exposures among men, may further amplify risks. 18 During the pandemic, males experienced steeper surges, potentially due to poorer adherence to preventive measures and delayed care-seeking. 19 Recent findings highlight a markedly greater pandemic-associated increase in sepsis mortality among males (23.9% vs 17.4% in females for bacterial septicaemia), 20 consistent with our data showing a steeper male APC (12.95% vs 9.41% in females, 2018-2021). Mechanisms may include biological (eg, sex hormone differences), 17 behavioral (eg, risk exposures), and utilization factors (eg, delayed help-seeking). 19 Retrospective cohorts indicate that women have lower hospital mortality in severe sepsis, supporting the observed trends. 21 However, some studies report no significant sex differences in outcomes after adjusting for confounders, suggesting context-specific influences. 22
Racial and ethnic disparities were pronounced, with American Indian or Alaska Native and Black populations facing the highest burdens and steepest increases, reflecting structural inequities like socioeconomic barriers and limited healthcare access. 23 Black individuals had nearly double the sepsis mortality risk compared to Whites, driven by overrepresentation in essential work and delayed interventions. 24 Hispanic populations showed variability, with significant pandemic surges linked to language barriers and uninsured status. 25 In contrast, Asian or Pacific Islander populations and the Northeast exhibited stable long-term trends, possibly due to lower baseline risks and better healthcare access, though both experienced pandemic-related spikes. 7 International evidence from England corroborates higher mortality in minority groups during early COVID-19 waves. 26 Systemic factors, such as poverty and healthcare inequities, outweigh biological differences in explaining these disparities. 27 Regional variations highlighted increases in the West, Midwest, and South, aligning with higher sepsis burdens in rural and socioeconomically challenged areas. 28 The South's elevated rates, forming a “sepsis belt” in the Southeast and mid-Atlantic, stem from poverty, obesity, and limited infrastructure. 29 These geographic patterns likely reflect underlying socioeconomic determinants, including insurance status, income, and access to care; lower community socioeconomic status is associated with higher sepsis-attributable mortality rates (up to 3-4 times higher in low-income areas), potentially explaining our Southern/Western disparities beyond location alone. 30 State-level data showed Kentucky and Mississippi with the highest 2023 rates, while the Northeast's stability reflects better access. 7 Pandemic hotspots in the Midwest exacerbated gaps, with rural hospitals facing resource shortages. 31 Age-stratified trends underscored vulnerability in seniors (65 + years), with the highest absolute rates due to immunosenescence and comorbidities. 32 Middle-aged adults (45-64) showed the largest relative increase, possibly from pandemic stressors like delayed care. 33 Younger adults remained stable but surged during COVID-19, highlighting emerging risks. 34 These align with recent CDC WONDER analyses showing rising mortality in adults 25–74 but declines in children <15,42 though our adult-focused study captures the former. Global data confirm steep age-related infection fatality rises. 35
Most deaths occurred in medical facilities (88.16%), reflecting acute care needs for respiratory sepsis, with smaller proportions in nursing homes or homes. 36 This distribution mirrors broader sepsis patterns, where hospital-based interventions are critical, though underreporting in non-hospital settings may bias data. 10 Pandemic shifts potentially increased home deaths due to avoidance of facilities. 37
Consistency with prior research, including CVD-sepsis 38 and diabetes-sepsis trends, 1 reinforces the need for equity-focused policies addressing social determinants and infrastructure. 39 This study uses CDC WONDER data (1999-2023) for sepsis-associated respiratory disease mortality, with ICD-10 codes for consistent bacterial/fungal case identification. Stratified by sex, race/ethnicity, age, region, state, and place of death, it analyzes disparities in over 2 million deaths. Age-adjusted mortality rates (AAMRs) standardized to the 2000 U.S. population ensure comparability and statistical power.
Limitations
Limitations of this study are death certificates risk misclassification/underreporting due to inconsistent coding and sepsis's lack of universal standards.
Conclusion
U.S. sepsis-associated respiratory mortality rose gradually pre-2018, surged 2018–2021 due to COVID-19 exacerbating pathologies and disrupting care, then declined post-2021 with vaccines and improved systems but remains above pre-2019 levels.
Take-Home Points
Study Question: What are the temporal trends and demographic/geographic disparities in sepsis-associated respiratory disease mortality in U.S. adults from 1999 to 2023?
Results: AAMRs increased from 29.83 to 41.12 per 100,000 (AAPC=1.69%), with a COVID-19 surge (2018-2021) and decline (2021-2023), highest in males, American Indian/Alaska Native groups, middle-aged adults, and Southern/Western regions.
Interpretation: The COVID-19-driven surge highlights vulnerabilities; targeted screening and equity policies are needed to reduce disparities.
Supplemental Material
sj-docx-1-jic-10.1177_08850666261443312 - Supplemental material for Trends in Sepsis-Associated Respiratory Disease Mortality in the United States, 1999 to 2023
Supplemental material, sj-docx-1-jic-10.1177_08850666261443312 for Trends in Sepsis-Associated Respiratory Disease Mortality in the United States, 1999 to 2023 by Qais Bin Abdul Ghaffar, Khawaja Omar, Zoha Khan, Talha Adil, Mujtaba Azhar Siddiqui, Arbab Burhanuddin Kasi and Imran Khawaja in Journal of Intensive Care Medicine
Footnotes
ORCID iDs
Abbreviations
Ethical Considerations
This study utilized publicly available, de-identified mortality data from the CDC WONDER database. As no human subjects were involved and all data were fully de-identified, the study was exempt from Institutional Review Board (IRB) review per the policy of Dow International Medical College.
Consent for Publication
Not applicable (the study contains no individual person's data in any form).
Consent to Participate
Not applicable.
Author Contributions
Qais Bin Abdul Ghaffar: Conceptualization, Methodology, Formal analysis, Investigation, Data curation, Writing – original draft, Writing – review & editing, Validation, Project administration. Khawaja Omar: Conceptualization, Methodology, Writing – review & editing, Validation. Zoha Khan: Conceptualization, Methodology, Investigation, Data curation, Writing – original draft, Writing – review & editing, Validation. Talha Adil: Conceptualization, Writing – original draft, Writing – review & editing, Validation. Mujtaba Azhar Siddiqui: Conceptualization, Methodology, Writing – original draft, Writing – review & editing, Validation. Arbab Burhanuddin Kasi: Conceptualization, Data curation, Writing – original draft, Writing – review & editing, Validation. Imran Khawaja: Conceptualization, Writing – review & editing, Validation, Supervision
Funding
The authors received no financial support for the research, authorship, and/or publication of this article.
Declaration of Conflicting Interests
The authors declared no potential conflicts of interest with respect to the research, authorship, and/or publication of this article.
Data Availability Statement
The data that support the findings of this study are publicly available from the Centers for Disease Control and Prevention (CDC) Wide-ranging Online Data for Epidemiologic Research (WONDER) database at ![]() . Specific queries and datasets generated during the current study are available from the corresponding author on reasonable request.
. Specific queries and datasets generated during the current study are available from the corresponding author on reasonable request.
Institutional Review Board Information
This study utilized publicly available, de-identified data from the CDC WONDER database and was exempt from Institutional Review Board (IRB) review per Dow International Medical College.
Supplemental Material
Supplemental material for this article is available online.
References
Supplementary Material
Please find the following supplemental material available below.
For Open Access articles published under a Creative Commons License, all supplemental material carries the same license as the article it is associated with.
For non-Open Access articles published, all supplemental material carries a non-exclusive license, and permission requests for re-use of supplemental material or any part of supplemental material shall be sent directly to the copyright owner as specified in the copyright notice associated with the article.