
Abstract
Background
Tachycardia, defined by SIRS criteria as a heart rate above 90, is commonly seen in numerous unrelated conditions, making its utility for screening in conditions like sepsis poor due to lack of sensitivity or specificity. Rather than using a single tachycardia value as a criterion, we evaluated the use of age-predicted maximal heart rate to individualize excessive tachycardia as a function of estimated physiologic reserve and to stratify mortality risk.
Methods
A retrospective analysis was performed on a cohort of 62,327 admitted ICU patients from the MIMIC-IV dataset, with the primary point of interest being in-hospital mortality. Utilizing the Fox formula, each patient's admission heart rate was divided by their APMHR, yielding %APMHR. Significant increases in mortality were observed with increasing %APMHR, with the most pronounced increase starting at %APMHR ≥ 60. A multinomial logistic regression model was then used to evaluate the replacement of tachycardia > 90 with %APMHR ≥60 as a new SIRS model (nSIRS) to compare mortality prediction to traditional SIRS criterion.
Results
HRs at %APMHR ≥ 60 was similar to HR > 90 in predicting mortality (16.54% vs 15.06%) in this ICU cohort, with notable further increases in mortality associated with %APMHR ≥ 70, and decreases below %APMHR ≤ 50. The nSIRS model utilizing %APMHR ≥ 60 was a better predictor of mortality with a larger log-likelihood, and smaller AIC/BIC when the nSIRS score was ≥ 2; with a similar RRR of 3.227 versus 3.335. Slightly fewer patients met these nSIRS ≥ 2 criteria versus the original SIRS.
Conclusions
%APMHR is similar to HR > 90 in predicting mortality, but the analysis also highlights that tachycardia alone poses significantly higher mortality risks, especially with increasing patient age. %APMHR ≥ 60, when substituted into the SIRS criteria for HR > 90, performs comparably as a predictor of in-hospital mortality in this patient cohort. Further evaluation of incorporating %APMHR into other mortality/screening tools is needed.
Keywords
Introduction
Tachycardia, defined in some texts as a heart rate > 90 (as in the SIRS criteria) and > 100 in others, is a well-known physiologic response to stressors and is used in multiple scoring systems to help prognosticate and inform clinical decisions. 1 For example, standardized screening tools for sepsis, such as the Systemic Inflammatory Response Syndrome (SIRS) criteria and the National Early Warning Score (NEWS) systems, include HR as a criterion directly in the score and play a valuable role in the swift recognition of sepsis. Unfortunately, these scores vary widely in terms of sensitivity and specificity, limiting their utility.2,3 A systematic review and meta-analysis of 57 studies evaluated the performance of the aforementioned scoring tools and found that in predicting sepsis, SIRS demonstrated a sensitivity of 0.85 and a specificity of 0.41, while NEWS demonstrated a sensitivity of 0.71 and a specificity of 0.85. qSOFA was found to have a sensitivity of 0.42 and specificity of 0.98, respectively. 4
A primary limitation of the SIRS criteria specifically is its low specificity in hospitalized patients. A study by Churpek et al found that almost half of all wards patients met SIRS criteria at presentation or at some point during their hospitalization, and concluded that further evaluation for all patients meeting the criteria would be impractical. 5 However, they noted that in-hospital mortality varied significantly based on which SIRS criteria were present, with an elevated respiratory rate being nearly twice the risk of in-hospital mortality compared to the other criteria. The SIRS criterion of heart rate (HR) greater than 90 beats per minute (BPM) undoubtedly contributes to the criterion's specificity issue, as patients develop elevated heart rates in response to any number of stressors. It is well established that an individual's maximum possible HR decreases with age, and may also vary depending on their fitness level, medication regimen, and physiologic reserve, among other factors. 6 As a result, younger patients with HRs of 90 may be too low a cutoff to reflect an inappropriate stress response, which would be seen in sepsis. Alternatively, HR > 90 may not capture older patients whose HR cannot adequately respond to stress, so they do not become technically tachycardic. Recognizing that the maximum possible heart rate decreases with age, tachycardia may be more accurately characterized individually based on a percentage of the maximum possible heart rate rather than a single cutoff value applied equally to all patients.
In fitness physiology, physical effort has been characterized by identifying cutoffs at which the human body physiologically transitions from predominantly aerobic to predominantly anaerobic metabolism. Traditionally, this has been assessed by measuring an individual's maximal oxygen consumption (VO2max). 7 VO2max has also been utilized in ICU settings and may even have prognostic value. 8 VO2max correlates well, albeit imperfectly, with the traditional heart rate fitness zones recognized by the AHA. Healthcare professionals reference these zones for writing exercise prescriptions and to help characterize the intensity of exercise by athletes, among many other uses.9–11 It would be reasonable to expect to see this “intensity of exercise” with other physiologic stressors, including severe illness. As such, evaluating patients’ tachycardia in relation to their age-predicted maximum heart rate (APMHR) may be a better way to characterize their ongoing physiologic “effort” or stress while critically ill. In this study, we compare the established definition of tachycardia as HR > 90 used by the SIRS criteria to characterizing tachycardia by using traditional fitness heart rate zones, both for the prediction of mortality.
Methods
Data Base
Data used in this analysis was from the Medical Information Mart for Intensive Care (MIMIC) IV 3.0 database, a freely accessible database that encompasses 94,458 unique ICU stays at Beth Israel Deaconess Medical Center in Boston, Massachusetts, from 2008 to 2022. The MIMIC-IV database contains a wealth of information, including demographics, vital signs, test results, and diagnoses.12,13 All authors obtained the necessary certifications to access this database housed on
Study Rationale
Originally, this analysis set out to determine whether APMHR is a better SIRS variable than HR > 90 for screening for sepsis in this ICU cohort group, as a possible way to individualize tachycardia within the traditional SIRS criterion to improve specificity. This question had to be answered in a data-driven, stepwise process explained following, by addressing a series of questions. HR > 90 has been shown to be an independent risk factor for mortality, even in conditions beyond sepsis, and is used in other calculators to predict outcomes or characterize illness severity (ie, NEWS score). As such, the analysis started with determining whether APMHR could similarly predict mortality.5,15 Firstly, we asked whether presenting admission HR relative to an individual patient's APMHR is associated with increased mortality. Nextly, at which ratio of HR relative to APMHR (termed %APMHR, as described following) is a comparable increase in mortality seen compared to the traditional SIRS criterion of presenting HR > 90. Finally, does the aforementioned %APMHR ratio perform better for mortality prediction when substituted for the traditional HR > 90 in the SIRS criterion? Each of these questions was answered using the methods in the following sections. We ceased the analysis before determining whether APMHR was better for sepsis screening within SIRS, and focused on mortality prediction. This was due to a noted significant recategorization of patients who would have had negative SIRS scores under our new %APMHR method (nSIRS described following), but had an original SIRS score ≥ 2. The researchers felt this recategorization would greatly reduce the sensitivity of our nSIRS compared to the original SIRS for sepsis screening, so this analysis was not completed.
Outcomes
In-hospital death during the current hospitalization was chosen as the primary outcome of this study and was determined by whether the patient had a discharge note of death and a verified date of death in order to mitigate the risk of false positives due to clerical inaccuracies. MIMIC-IV uses an algorithm based on hospital and state records to link the date of death to each individual patient, tracking up to 1 year after the last hospitalization. Two secondary outcomes of mortality were also analyzed: 1) death occurring after discharge from the current hospitalization (whether during or after any subsequent hospitalizations); and 2) being alive (classifying patients who had no date of death or no discharge note indicating in-hospital death in MIMIC-IV). The results of these two secondary outcomes are shown in Table 3. Patients who had a discharge note of death but did not have a date of death recorded in MIMIC-IV were excluded from the analysis. We did not use subsequent hospitalizations in the new SIRS criterion analysis as described below to calculate mortality; instead, we specifically analyzed deaths during the current hospitalization. Given the available data in the MIMIC-IV death algorithm, we included mortality risk stratification for presenting %APMHR in the supplementary analysis, which includes the 3mo, 6mo, and 1-year mortality (supplementary Table 1).
Patient Characteristics of the Total Sample (N = 62,327).
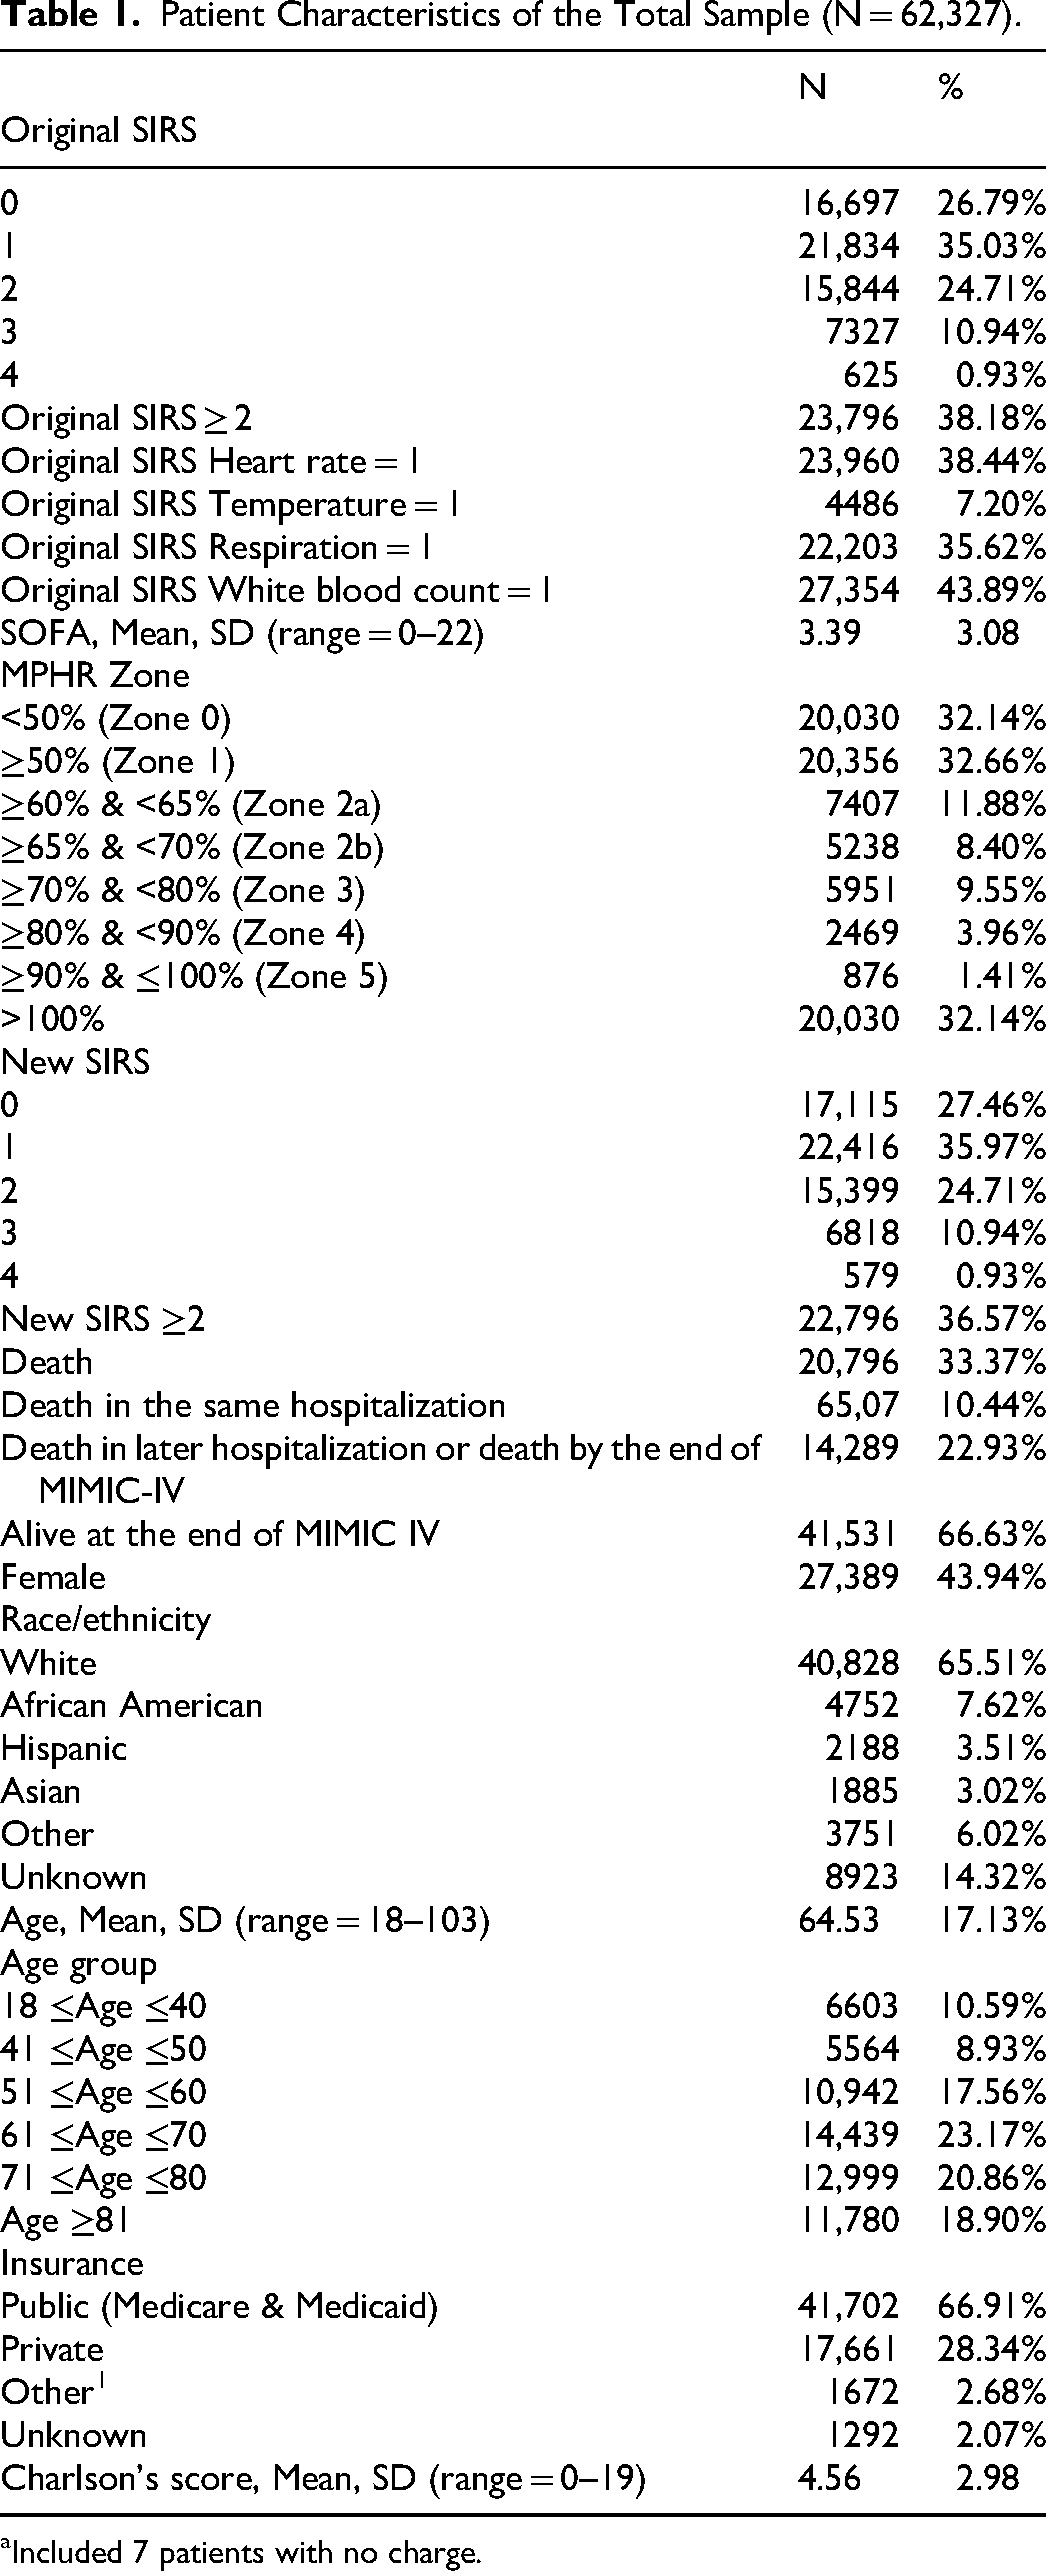
Included 7 patients with no charge.
Age-Predicted Maximum Heart Rate Percentage (%APMHR) Calculation
%APMHR was calculated by the following equation derived from the Fox formula (APMHR = 220 - Patient Age in Years), as other analyses have shown it to be less likely than other equations to over- or underestimate MHR in the general population
16
: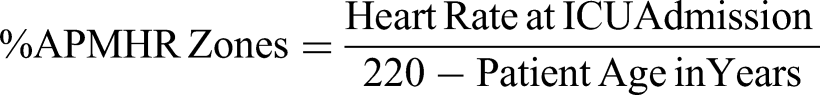
Each patient's %APMHR was then assigned to one of six categorical “zones” based on traditional cardiovascular fitness training zones, which roughly correlate with exercise physiology to VO2max cutoffs, as well as to the point at which the body transitions from predominantly aerobic to anaerobic metabolism.10,16–18 The zones are as follows: %APMHR < 50% as Zone 0, %APMHR ≥ 50% & < 60% as Zone 1, %APMHR ≥ 60% & < 70% as Zone 2, %APMHR ≥ 70% & < 80% as Zone 3, %APMHR ≥ 80% & < 90% as Zone 4, %APMHR ≥90% & ≤ 100% as Zone 5. After the primary mortality analysis was completed for each zone, Zone 2 was further divided into Zone 2a, %APMHR ≥ 60% & < 65% as %APMHR ≥ 65% & < 70% as Zone 2b, in an attempt to identify further if a clear %APMHR cutoff for our later SIRS analysis, as a noted mortality increase was noted to start somewhere between 60% and 70% APMHR. Patients with a %APMHR > 100 were excluded from the analysis, as this was considered more likely to be supraphysiologic (N = 535; < 1% of patients with an admission HR in MIMIC-IV). The results of the zones’ mortality analysis provided an inflection point at which we could compare all HRs above a certain %APMHR directly to HR > 90.
New Systemic Inflammatory Response Syndrome (SIRS) Score Comparison
After the aforementioned %APMHR zone analysis, %APMHR > 60 was found to be most similar to HR > 90 for predicting mortality. Consequently, the team next sought to determine whether substituting %APMHR > 60 for HR > 90 within SIRS could be used as a predictor of in-hospital mortality, and would be consistent with previous studies showing that increasing SIRS scores is also associated with increased in-hospital mortality. 5 Two composites of SIRS were constructed in the current study: original SIRS and new SIRS (nSIRS). The original SIRS composite was calculated using traditional four criteria 19 : abnormal body temperature (temperature above 38 °C or below 36 °C), increased heart rate (heart rate above 90 beats per minute), rapid breathing (respiratory rate above 20 breaths per minute or PaCO2 less than 32 mm Hg), and abnormal white blood cell count (WBC) (WBC above 12,000/µL or below 4000/µL, or more than 10% immature (band) forms). The values of the original SIRS ranged from 0 to 4. SIRS values were calculated by using SQL codes first developed by MIT-LPC for MIMIC-IV, which are publicly available on https://github.com/MIT-LCP/mimic-code/tree/main/mimic-iv. Based on the results of our primary analysis, we replaced HR > 90 with %APMHR ≥ 60% to construct nSIRS and when the patient's admission HR corresponded to a %APMHR ≥ 60%, it was coded as 1. The range of new SIRS was also 0 to 4. Both the original and new SIRS were dichotomized, with values coded as 1 if SIRS ≥ 2 and 0 if SIRS < 2.
Covariates
Patients’ demographic characteristics, including age at ICU admission in years, age group, sex, race/ethnicity, insurance, as well as Charlson's Comorbidity Index (CCI) and Sequential Organ Failure Assessment (SOFA). The age group consisted of 6 categories: 1 = 18–40 years old, 2 = 41–50, 3 = 51–60, 4 = 61–70, 5 = 71–80, and 6 = 81 and older. Race/ethnicity included: 1 = white, 2 = African American, 3 = Hispanic, 4 = Asian, 5 = Other, 6 = Unknown. Insurance was coded as 1 = Public (Medicare or Medicaid), 2 = Private, 3 = Other (including no charge), and 4 = Unknown. CCI and SOFA were also calculated using SQL codes developed by MIT-LPC for MIMIC-IV, which are publicly available on https://github.com/MIT-LCP/mimic-code/tree/main/mimic-iv.
Statistical Analysis
All statistical analyses were performed using Stata 19.5. Descriptive statistics were used to characterize the study population. Continuous variables were summarized using means and standard deviations, and categorical variables were summarized as frequencies and percentages.
The original SIRS and the modified new SIRS (nSIRS) using %APMHR were compared with respect to in-hospital mortality. First, we examined the prevalence of each original SIRS component and the %APMHR zones. Next, we compared in-hospital mortality rates across original SIRS components, %APMHR zones, and two SIRS scores using chi-square tests.
Finally, multinomial logistic regression analysis was performed to evaluate the association between original SIRS and nSIRS with in-hospital mortality, while adjusting for covariates, including age, sex, race/ethnicity, insurance, CCI, and SOFA score. Model fit was compared using log-likelihood, Akaike information criterion (AIC), and Bayesian information criterion (BIC). A model with a higher log-likelihood and lower AIC and BIC was considered to provide a better fit to the data. 20 Relative risk ratios (RRR) with 95% confidence intervals were reported. All statistical tests were two-sided. Statistical significance was assessed based on p-values < 0.05 in chi-square testing, estimated values without overlapping 95% confidence intervals, or a 95% confidence interval without containing 1 in multinomial logistic regression analysis.
Results
Of the 62,327 individuals analyzed within the database, 38.44% met the original SIRS criteria of HR > 90, while 38.18% had a SIRS score ≥ 2; temperature was the least frequently met criterion (7.20%). 10.44% percent of the population died in the same hospital stay (Table 1). Patients with an original SIRS score of < 2 were associated with a 6.24% in-hospital mortality rate, compared to 17.24% in those with a score of ≥ 2 (Table 2). A comprehensive comparison of the original SIRS criteria, including in-hospital mortality based on the original scores ranging from 0 to 4, is presented in Table 2.
Mortality by Original SIRS Factors and Original SIRS Scores.
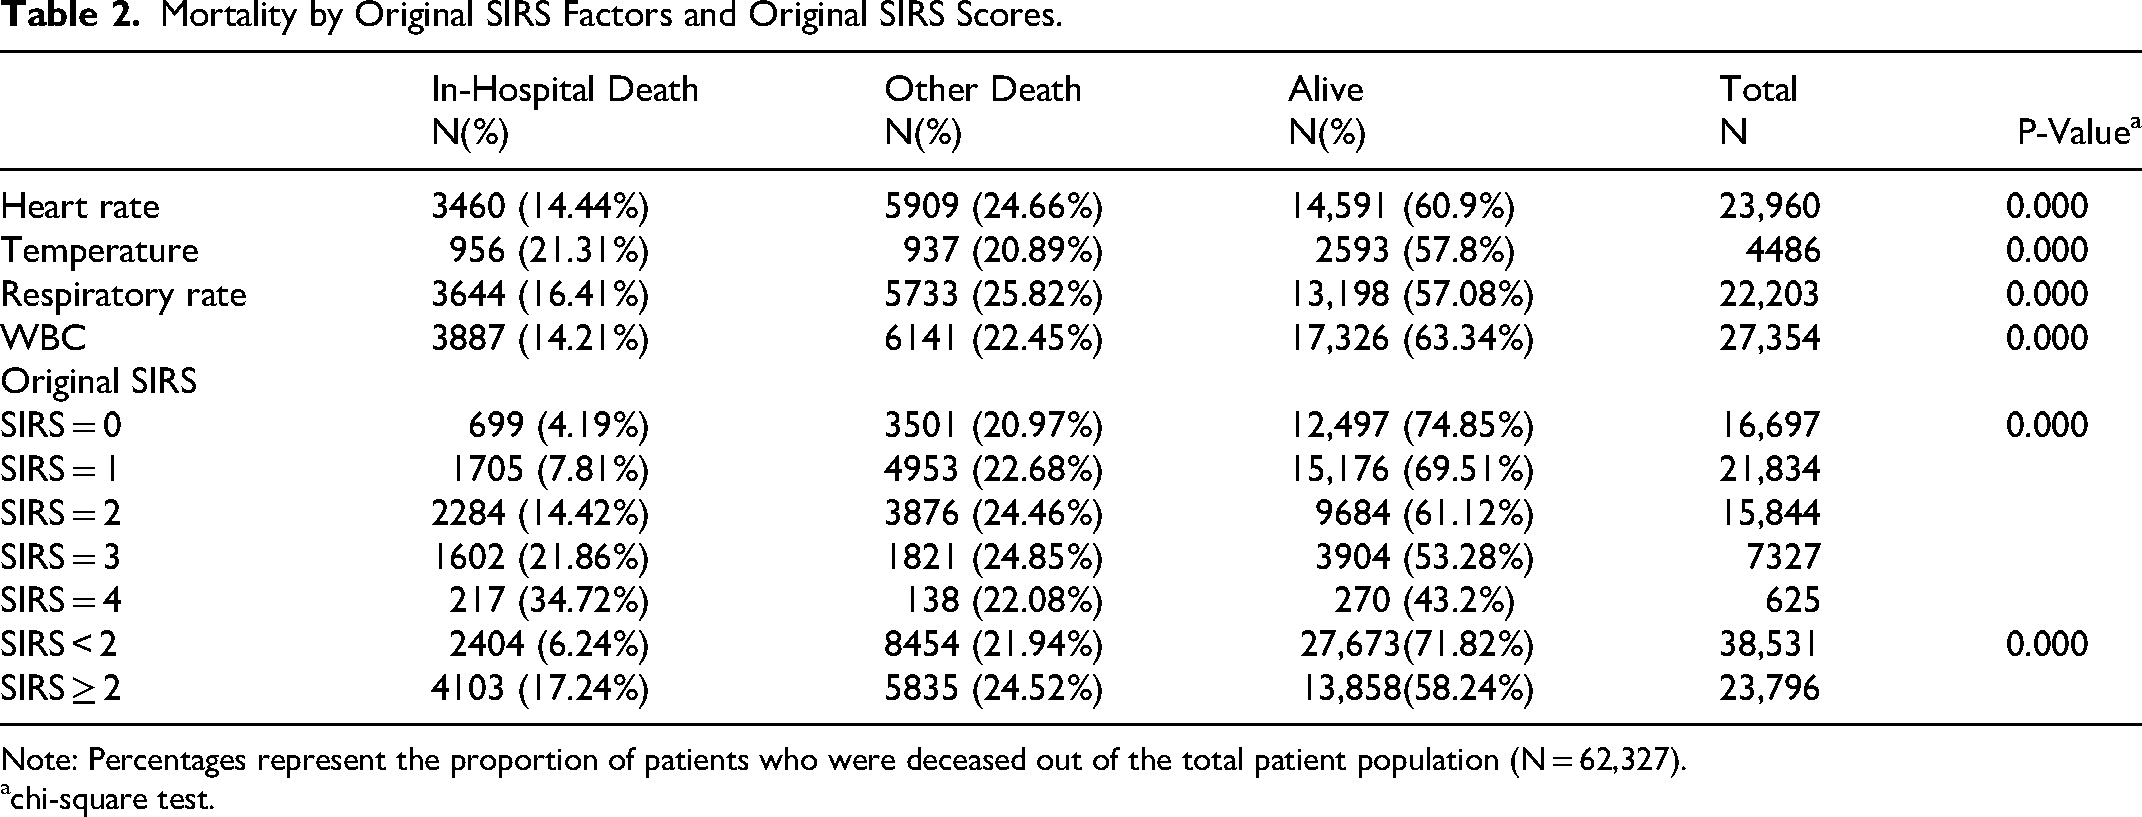
Note: Percentages represent the proportion of patients who were deceased out of the total patient population (N = 62,327).
chi-square test.
Comparison of %APMHR Zones and HR > 90
As HR on admission increased relative to APMHR (aka %APMHR), there was an associated increase in in-hospital mortality. The analysis showed the most notable increases between APMHR zones 1, 2a, 2b, and 3. However, there was no significant difference in mortality across the top three APMHR zones 3–5 (Table 3) (see Supplementary Figure 1 for graphical comparison after adjusting for covariates).
Mortality by APMHR Zone and New SIRS Score.
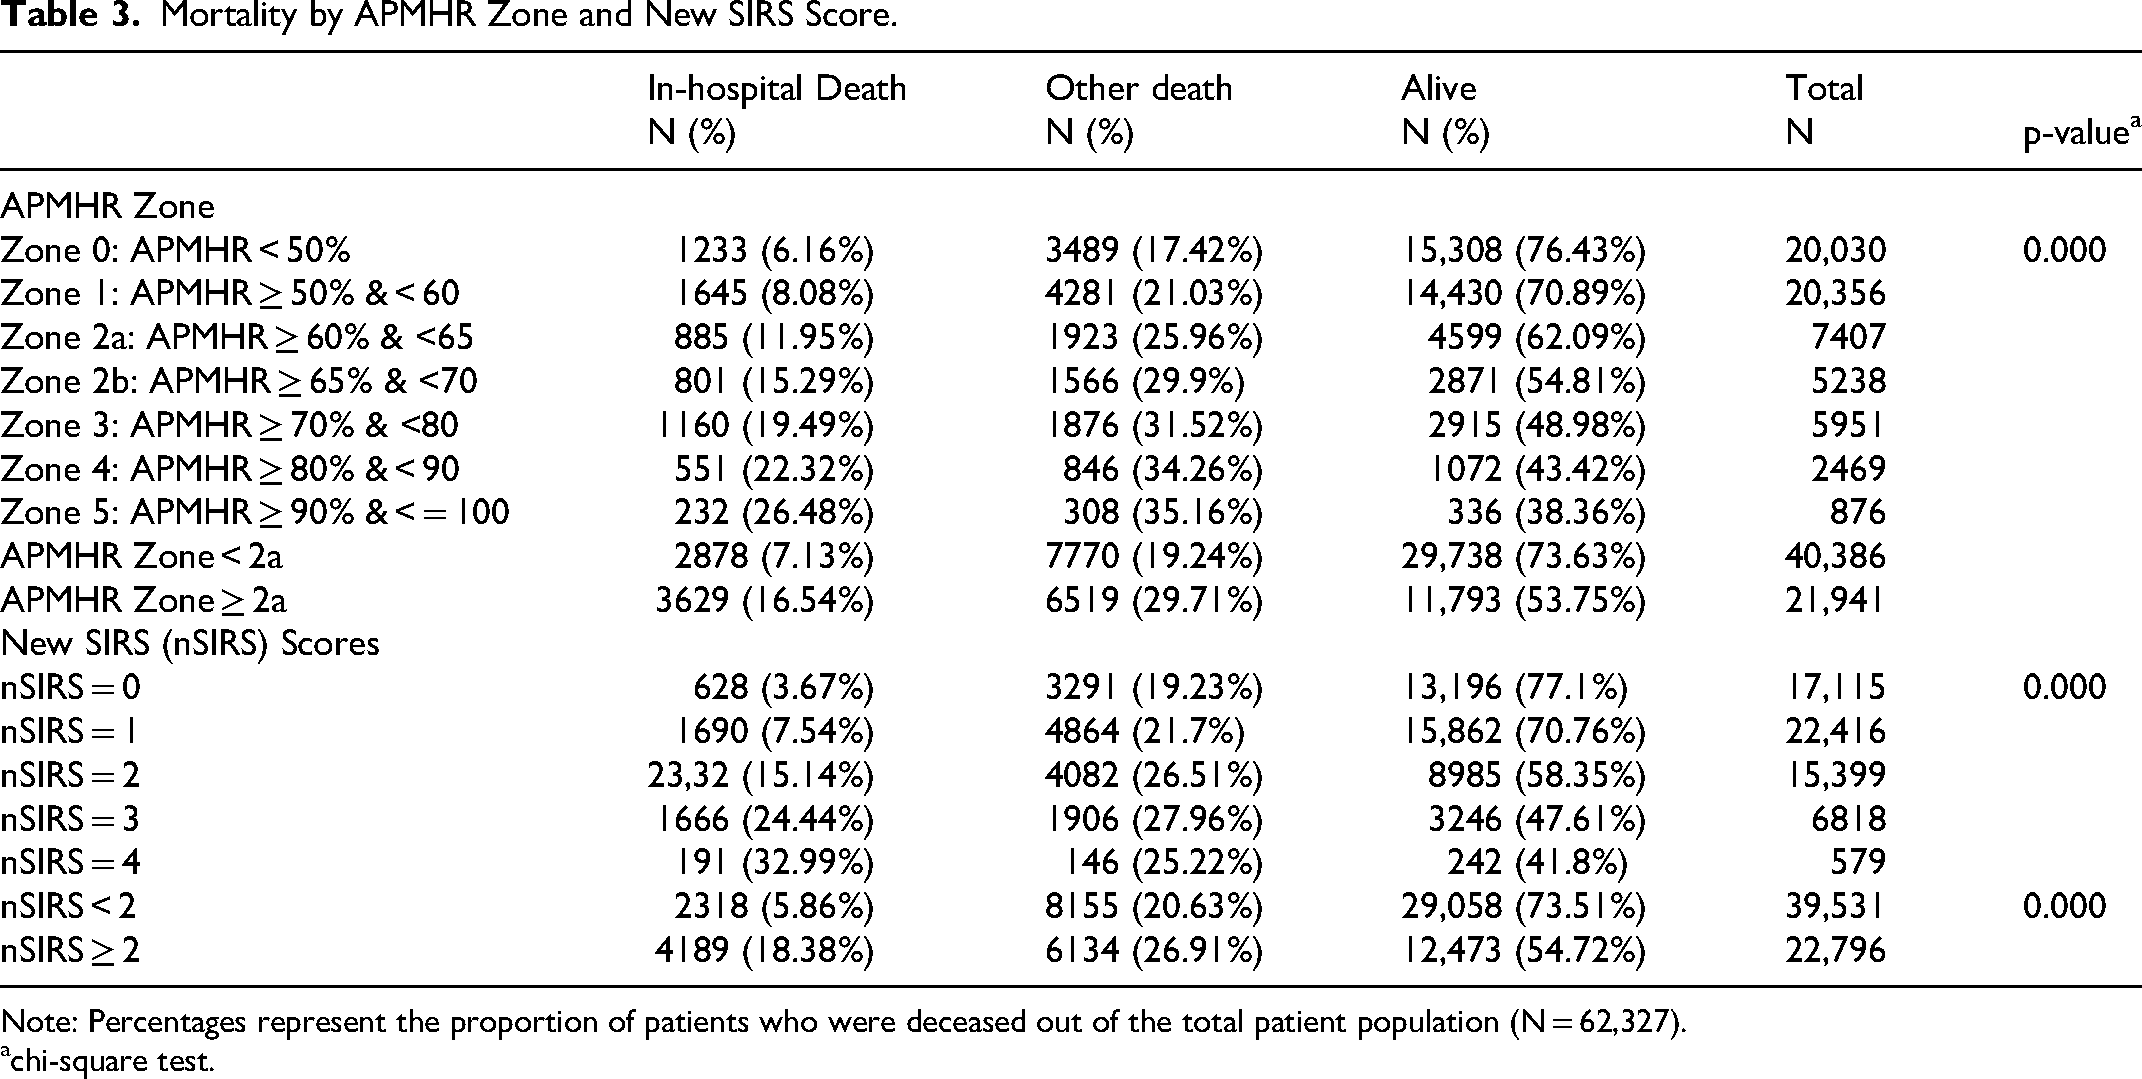
Note: Percentages represent the proportion of patients who were deceased out of the total patient population (N = 62,327).
chi-square test.
As noted in the methods, traditional heart rate training zones in athletics are based on the intensity of physiological stress where the body switches from primarily aerobic to anaerobic metabolism. We hypothesized, based on these traditional zones, that a significant increase in mortality would be observed at around 60–70% of %APMHR. After the primary analysis, we observed an increase in mortality at ≥ 60%APMHR, most significantly, and therefore determined this to be the most appropriate threshold for comparison with the criterion of HR 90. Using this as the new cutoff, we found that patients with an APMHR < 60% had an in-hospital mortality of 7.13%, whereas those with an APMHR ≥ 60% had a 16.54% risk, respectively, without adjusting for covariates (Table 3). Since an HR > 90 was associated with a 15.06% in-hospital mortality rate (Table 2), %APMHR ≥ 60% provided a relevant benchmark for proceeding with the analysis.
Original SIRS Versus New SIRS Using %APMHR
We substituted the original SIRS criterion of HR > 90 for tachycardia with a cutoff of ≥ 60% of %APMHR. A comparison of multinomial logistic regression models adjusting for covariates on in-hospital mortality between the original and new SIRS (nSIRS) is shown in Table 4. The model with new binary SIRS (nSIRS ≥ 2), utilizing %APMHR ≥ 60, was a better fit than the one with original binary SIRS, with larger (less negative) log-likelihood, and smaller AIC and BIC, although the relative risk ratio (RRR) of the new binary SIRS was smaller than original binary SIRS (3.227 vs 3.335), indicating a slightly smaller effect. A comparison of the estimated probabilities of the original SIRS versus the nSIRS is represented in Figure 1. This comparison is also represented across various common age categories in Figure 2, showing very similar risks of in-hospital mortality predicted by the original and nSIRS.
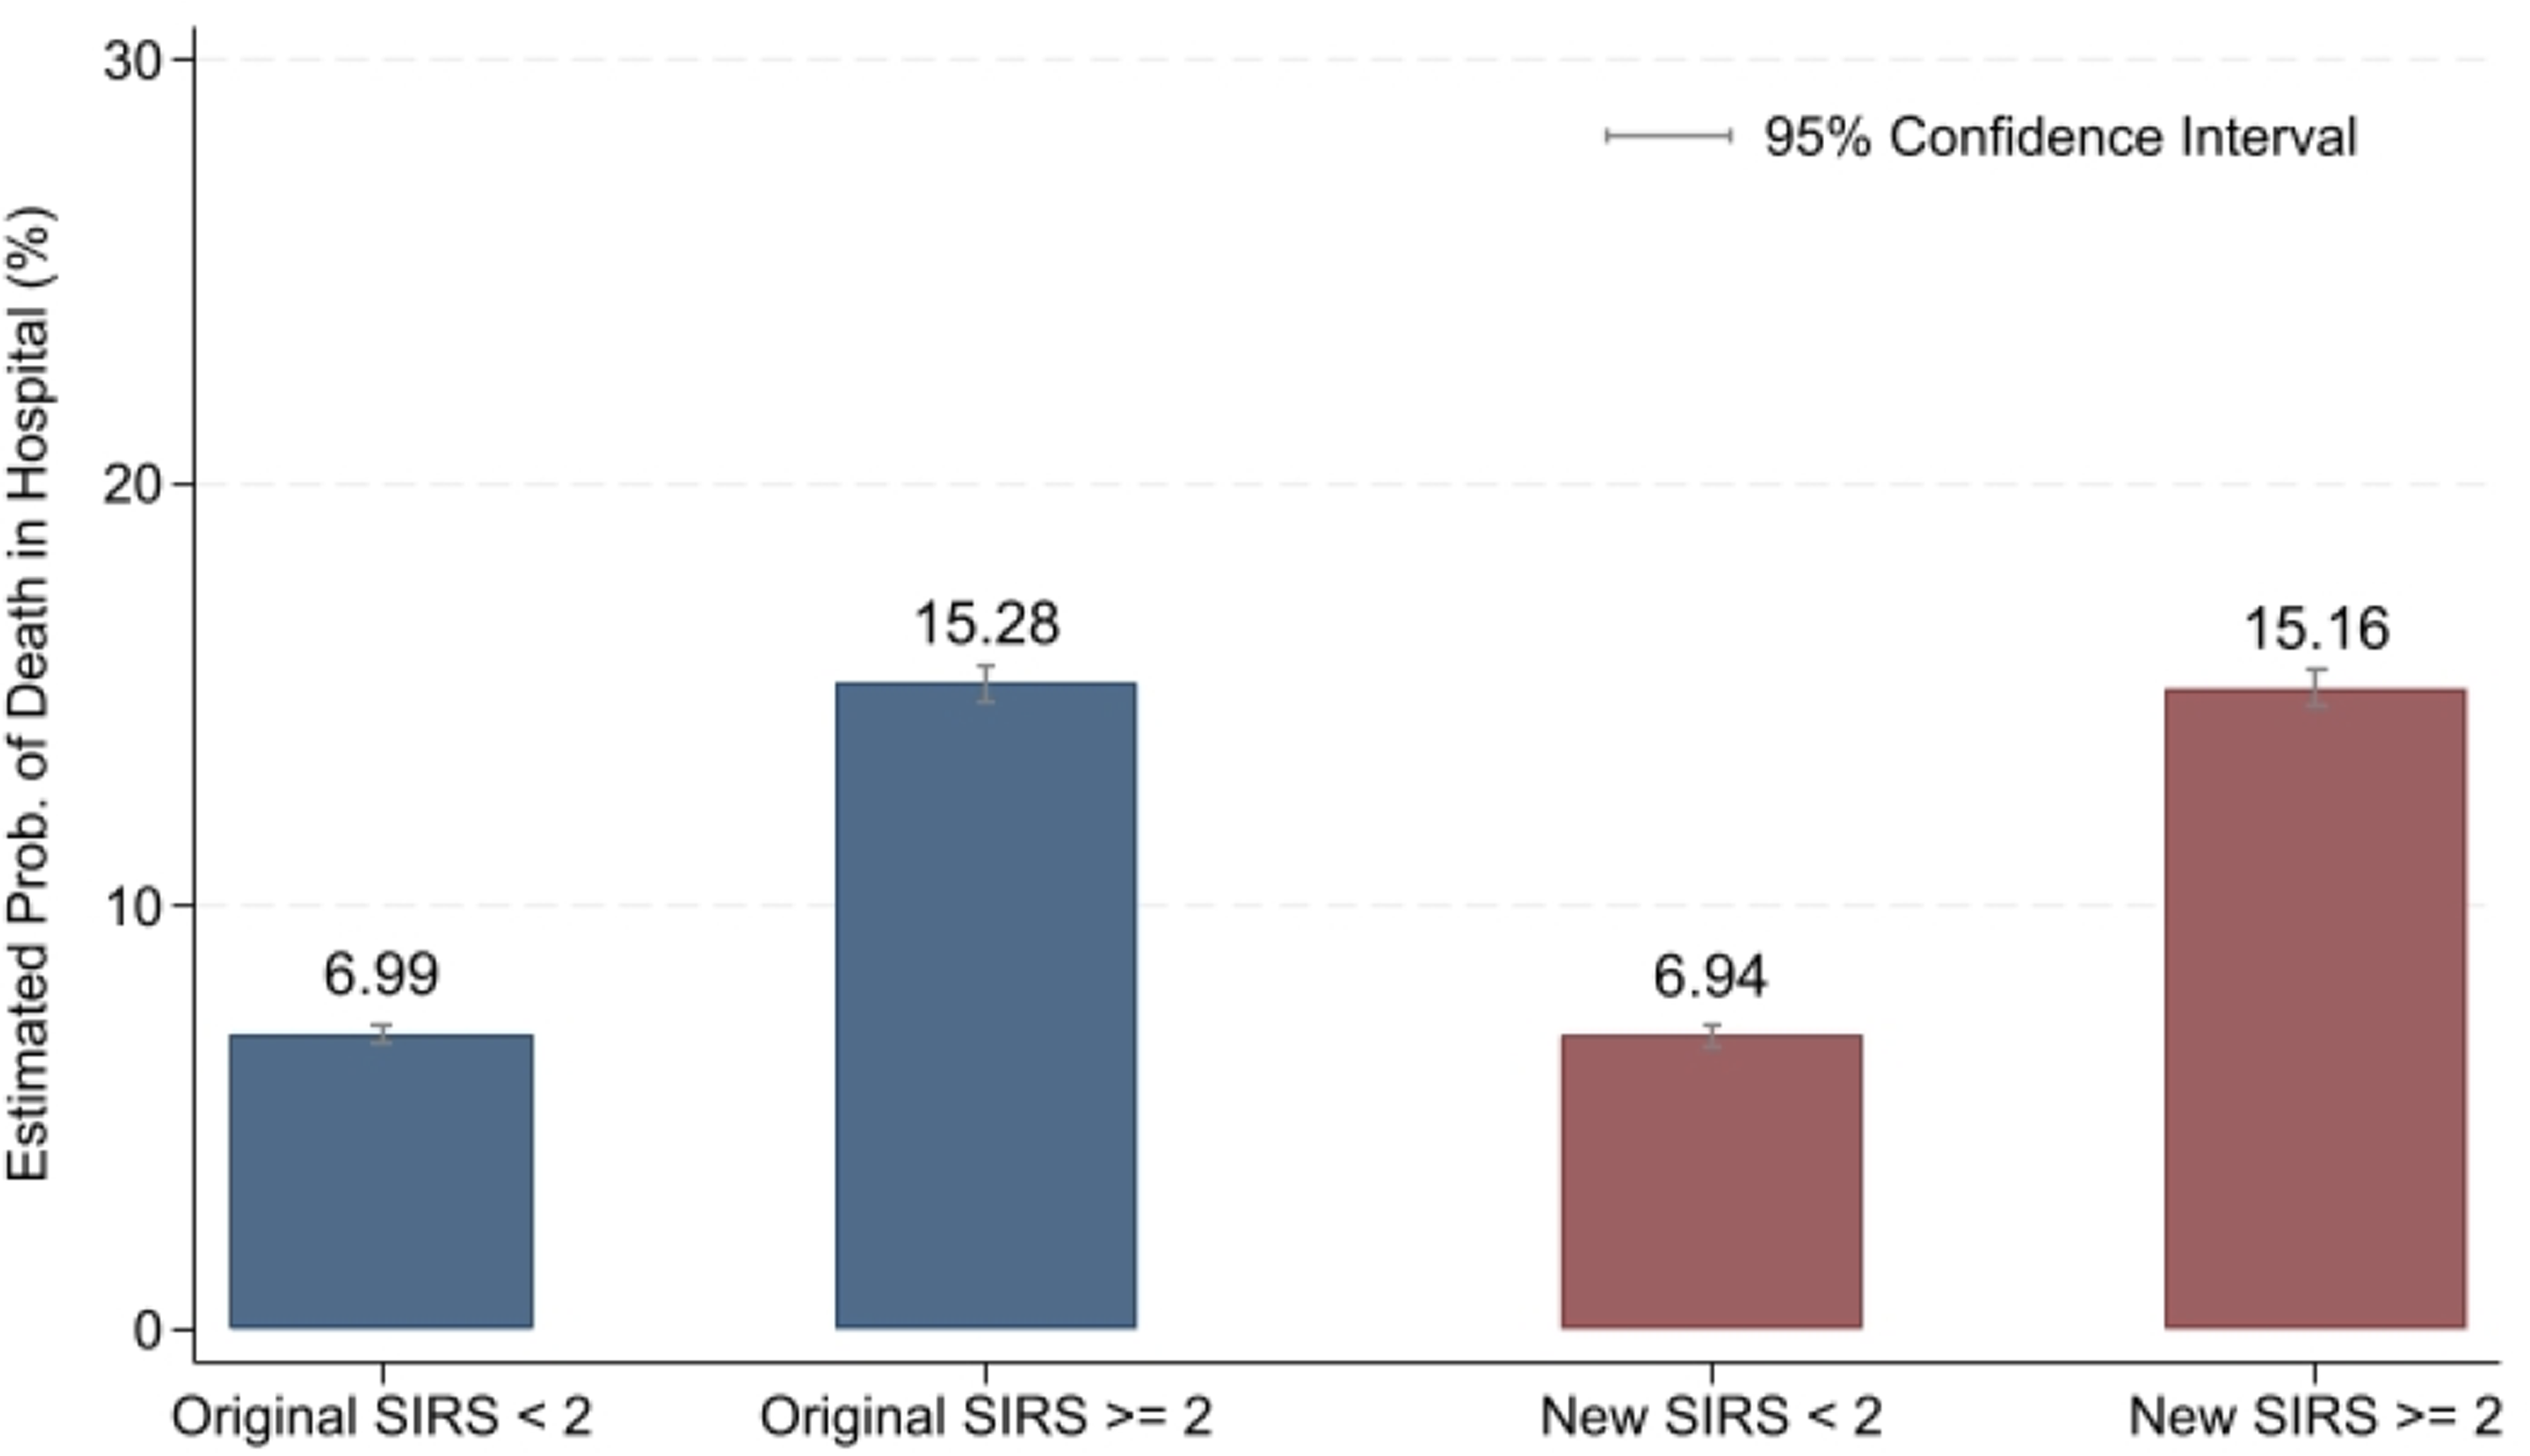
Estimated probability of hospital mortality by original SIRS and new SIRS.
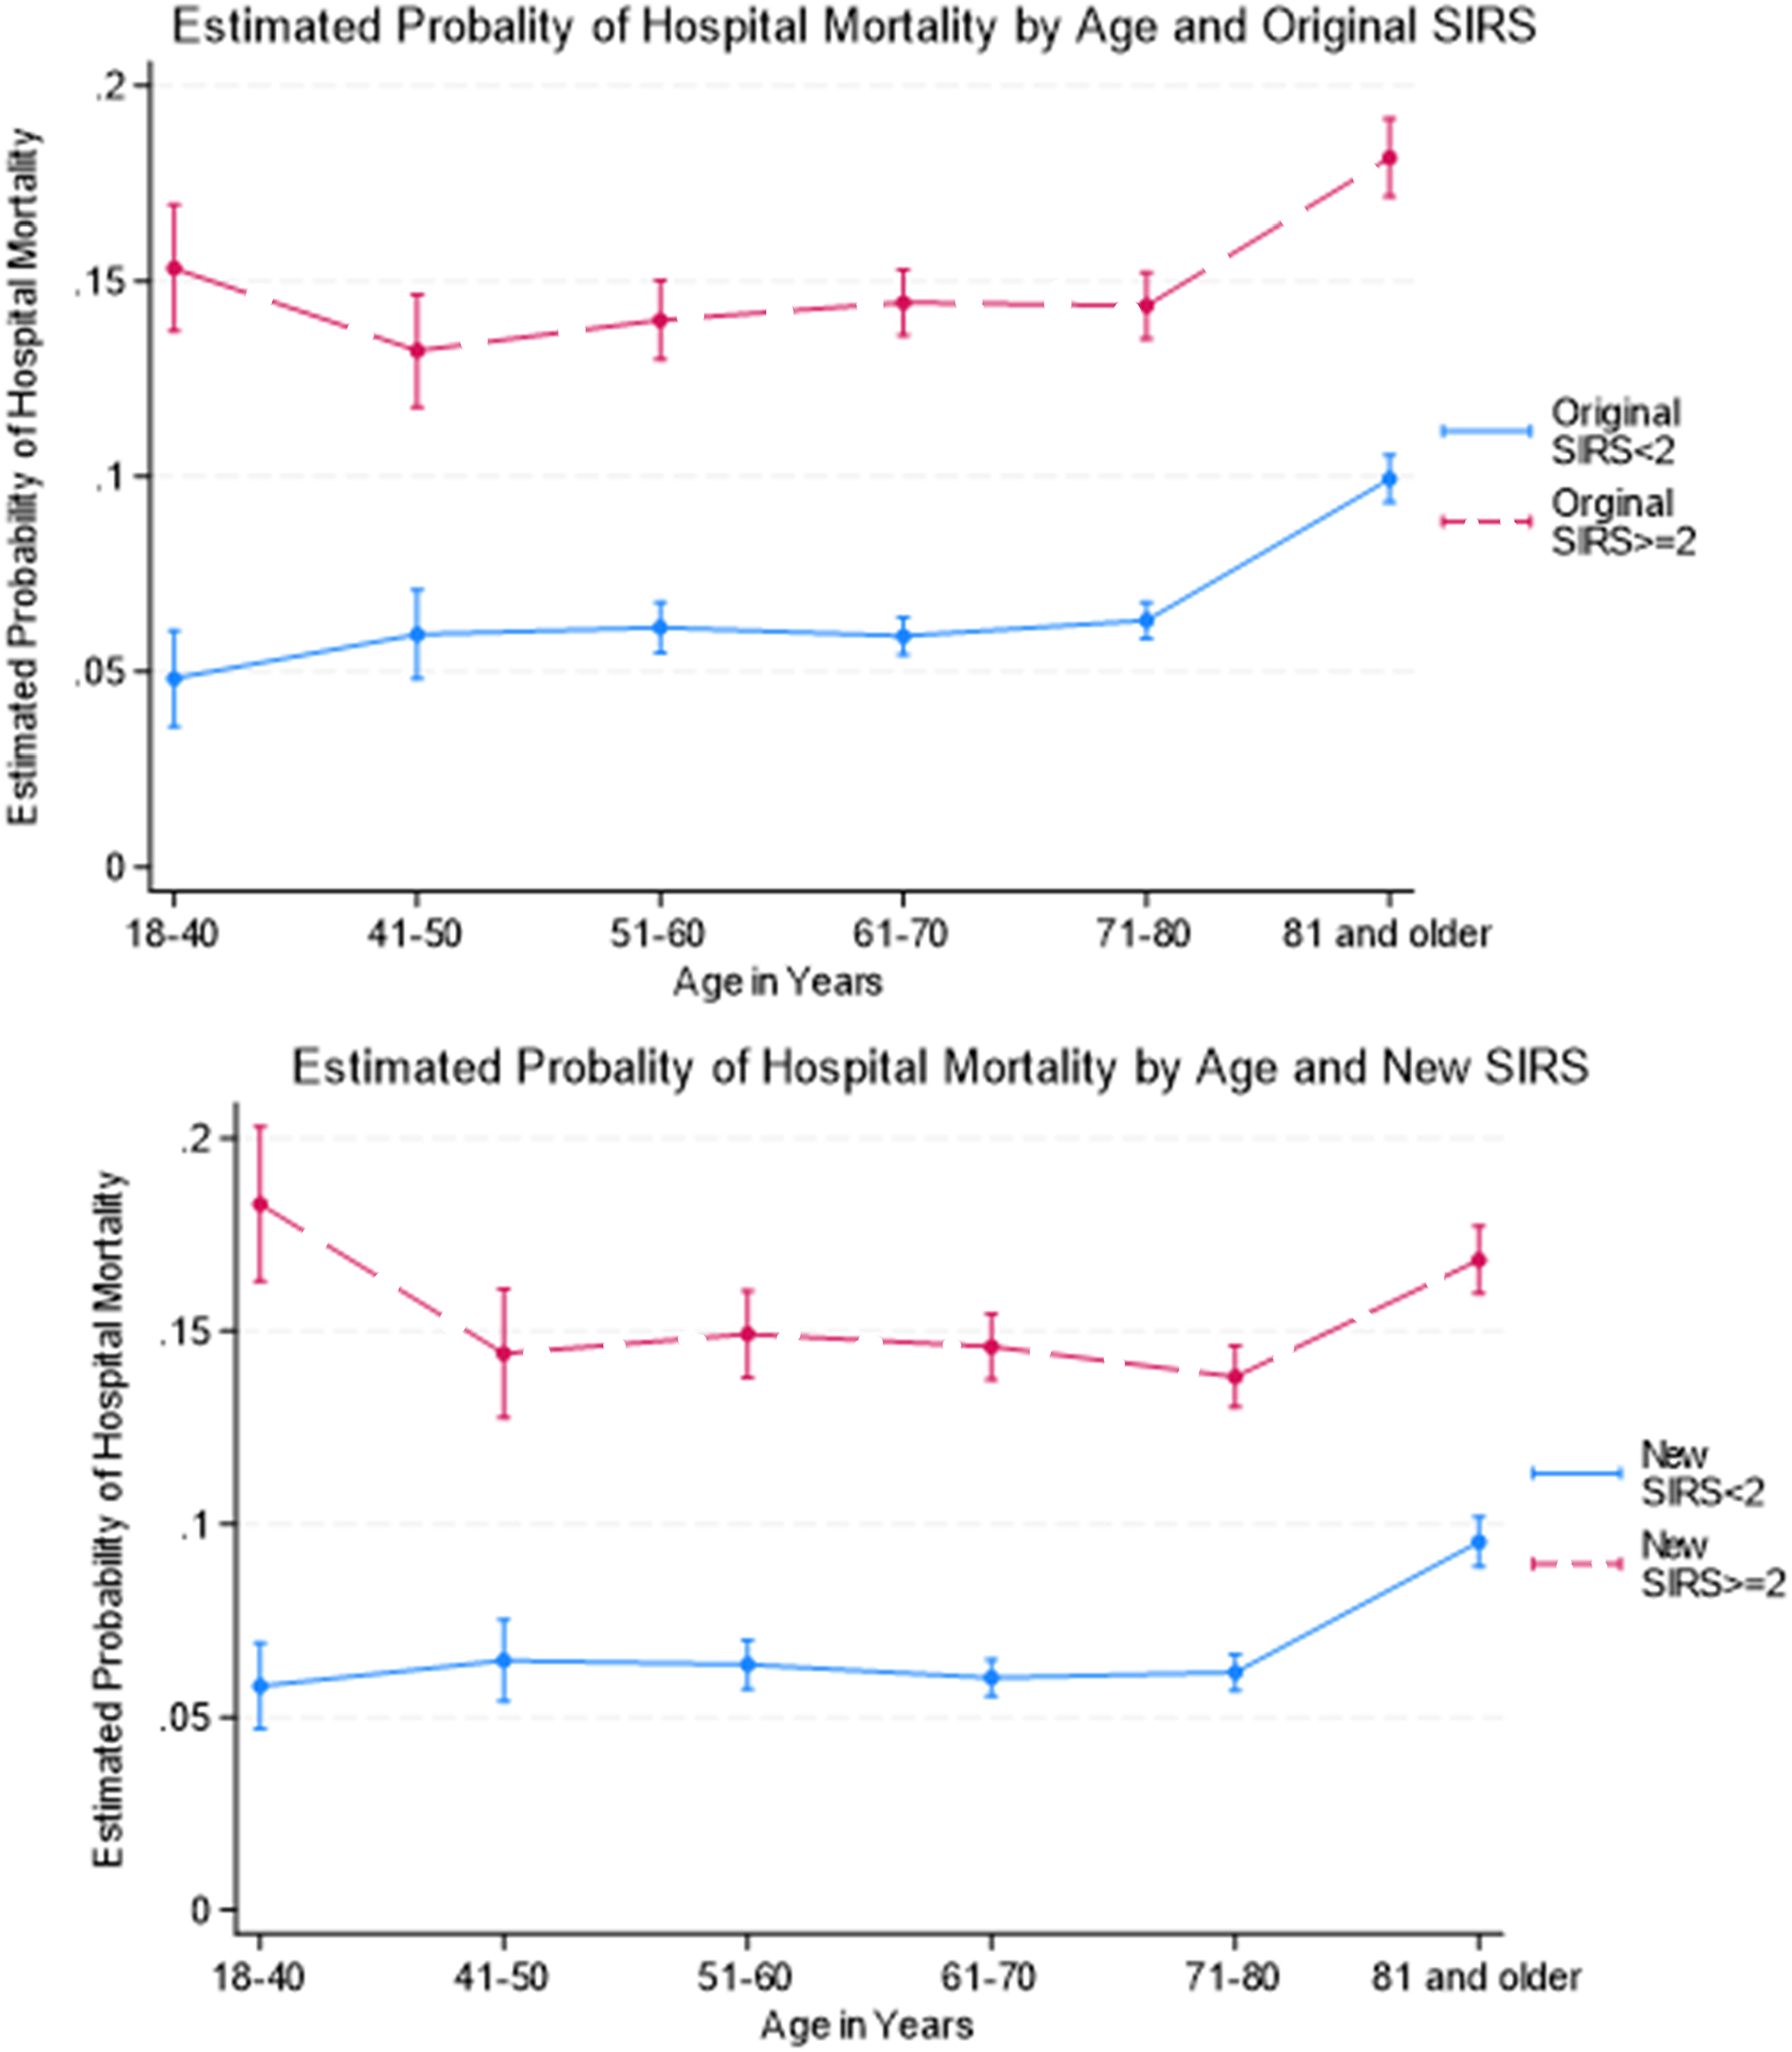
Estimated probability of in-hospital mortality by SIRS and age group.
Comparison of Multinomial Models of in-Hospital Mortality Between Original SIRS and New SIRS.
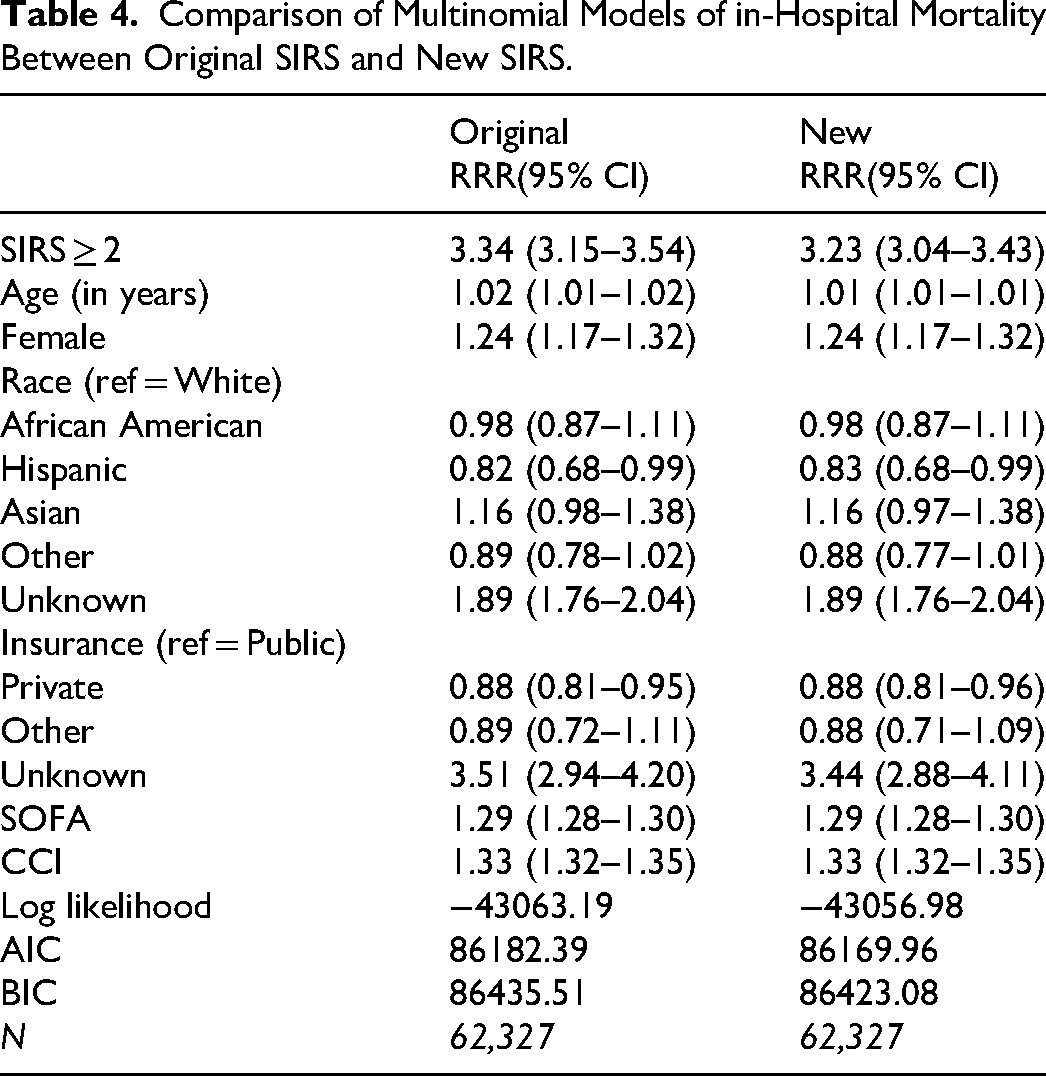
We noted that the overall prevalence of patients with an original SIRS score ≥ 2 in the study population did not change significantly compared to nSIRS score ≥ 2, from 38.18% to 36.57%. A total of 6.35% of the study sample were recategorized, with 2629 patients who initially met the original SIRS ≥ 2 but no longer met our nSIRS criteria of ≥ 2; and 1629 patients from original SIRS < 2 to nSIRS ≥ 2 (see Supplemental Table 2).
Discussion
Consistent with previous efforts, this study corroborates the well-established association between meeting SIRS criteria and increased in-hospital mortality. Our study aimed to compare %APMHR to HR > 90 with regard to mortality prediction within the SIRS model, by better individualizing in-hospital mortality risk. Our findings suggest that in a large ICU population, substituting %APMHR into the binary SIRS model improves prediction of in-hospital mortality, as evidenced by lower AIC and BIC values and a higher log–likelihood. Clinically, however, this difference is likely of limited significance, as the marginal improvement in prediction was observed only with a very large data set, and our nSIRS model would be more cumbersome to calculate in clinical settings. We found that some patients who initially met the original SIRS criteria with a score of ≥2 did not meet the nSIRS criteria for ≥2, and vice versa. In terms of using the nSIRS model for sepsis screening, one could speculate that, for younger patients with %APMHR ≥ 60, specificity would be higher than the traditional SIRS HR cutoff of 90, but most likely at the expense of decreased sensitivity. The opposite is probably true for those older than 70 years of age, where the %APMHR ≥ 60 would be less than 90, and possibly improve sensitivity. Again, we did not analyze whether the SIRS-to-nSIRS recategorization (approximately 6% of patients, as noted above) truly affects sensitivity or specificity for sepsis screening.
Prognostication in critically ill patients remains exceedingly challenging. Research has shown that in community-onset sepsis, patients with few comorbidities have about half the risk of in-hospital mortality as those with multiple comorbidities. 21 Our analysis suggests that other prognostication tools, such as APACHE, SAPII, and SAPSIII, which utilize wider HR ranges scoring parameters, may be omitting early evidence of higher in-hospital mortality in older patients with multiple comorbidities by underappreciating tachycardia. For example, our analysis suggests that a 75-year-old patient with a HR of 100 has nearly double the risk of in-hospital mortality compared to one with a HR of 90; however, a HR of 100 earns no points on the APACHE II score. How %APMHR could be used in other calculator tools, such as PESI for PE, would certainly be an interesting area of study.
Furthermore, stratifying patients into the previously discussed heart rate zones revealed significant differences in mortality across all zones at 3 months, 6 months, and 1 year after admission (see Supplementary Table 1). For example, we found patients in zone 4 (80-90% APMHR; zone of predominantly anaerobic metabolism) had a 39.13% risk of death at 3 months compared to an 11.09% risk in the < 50% APMHR group. This mortality difference would indicate that an individual's ability to otherwise compensate for the stress of critical illness will manifest as tachycardia, but the severity of tachycardia relative to an individual patient's underlying physiologic reserve is more critical prognostically. By age-adjusting HR and identifying individualized thresholds for transition to anaerobic metabolism, providers can gain a better understanding of a patient's active disease state and, in doing so, more accurately predict short-term and longer-term mortality risk.
Our analysis has several limitations that warrant discussion. Firstly, our study population consisted exclusively of ICU patients. Given that mortality risk is inherently higher in ICU admissions, the comparison of mortality prediction of %APMHR ≥ 60 versus HR > 90 could be very different compared to a regular medical unit or the ER. Additionally, the average age in our patient population was 64, making an HR > 93 the threshold for meeting the %APMHR ≥ 60 criteria. Given this trivial difference in BPM to HR > 90, a significant mortality difference was likely observed only in a very large patient population, such as ours. While we suspect that applying this screening process to all hospital admissions or all ED presentations could yield different results from those observed in the analyzed ICU population, this would ultimately require separate study.
Also worth discussion was the limited ability to adjust for certain potential confounding factors, including admission diagnosis and home medications. Although imperfect, the Charlson comorbidity index was utilized to remove comorbid conditions as confounders within our study population. Finally, while the Fox formula is relatively reliable for predicting a patient's maximum heart rate, truly determining it requires extensive physiologic testing and is typically not feasible in hospitalized patients. As such, determining when a patient exceeds physiologic stress tolerance and transitions from aerobic to anaerobic metabolism is not possible solely from monitoring vital signs. That said, our model reliably predicts mortality at least as well as HR > 90 using this simple APMHR calculation. Future AI models to more accurately determine a patient's maximum possible heart rate based on medications, comorbidities, and other factors would undoubtedly be worth exploring further.
Studies have suggested that the use of beta-blockers in sepsis may improve mortality.22,23 Our study could provide further insight into this phenomenon, as a reduction in HR by pharmacologic means may provide a rest from physiologic stress and reduce tachycardia relative to a patient's APMHR. Further study of mortality related to time spent at specific percentages of APMHR, time spent at ≥60% APMHR, time to HR decreasing to <50% APMHR, and other applications of this method for characterizing tachycardia is warranted.
Supplemental Material
sj-tiff-1-jic-10.1177_08850666261457341 - Supplemental material for Evaluating Age-Predicted Maximal Heart Rate Versus Tachycardia in SIRS Criterion
Supplemental material, sj-tiff-1-jic-10.1177_08850666261457341 for Evaluating Age-Predicted Maximal Heart Rate Versus Tachycardia in SIRS Criterion by Ethan Flathers, Fang Fang, Bryan Fitzgerald and Timothy Ori in Journal of Intensive Care Medicine
Footnotes
Abbreviations
Acknowledgements
We appreciate the knowledge and guidance of Dr Rehan Qayyum, Dr Julie Sill, and the entire research team at the Department of Medicine at Old Dominion University, Virginia Health Sciences, for their expertise and support in making this project possible.
Funding
The authors received no financial support for the research, authorship, and/or publication of this article.
Declaration of Interests
The authors declare that they have no known competing financial interests or personal relationships that could have appeared to influence the work reported in this paper. The authors declare the following financial interests/personal relationships, which may be considered as potential competing interests:
Ethan Flathers reports statistical analysis was provided by Macon & Joan Brock Virginia Health Sciences at Old Dominion University. If there are other authors, they declare that they have no known competing financial interests or personal relationships that could have appeared to influence the work reported in this paper.
Financial Disclosure Information and Conflicts of Interest
None
IRB
This project was cleared for full IRB exemption as non-human subjects research. Complete letter of exemption available upon request.
MeSH Keywords
Systemic Inflammatory Response Syndrome; Intensive Care Units; Organ Dysfunction Scores; Hospital Mortality; Heart Rate.
Supplemental Material
Supplemental material for this article is available online.
References
Supplementary Material
Please find the following supplemental material available below.
For Open Access articles published under a Creative Commons License, all supplemental material carries the same license as the article it is associated with.
For non-Open Access articles published, all supplemental material carries a non-exclusive license, and permission requests for re-use of supplemental material or any part of supplemental material shall be sent directly to the copyright owner as specified in the copyright notice associated with the article.