
Abstract
Objective
Use of vasoactive medications is common in pediatric intensive care units (ICUs), however evidence to guide medication selection is limited likely resulting in practice variation. Our objective was to describe the use of vasoactive infusions across ICUs and sites.
Design
Retrospective cohort study using the multi-institutional PICU Data Collaborative (PDC) database.
Setting
Four pediatric ICUs (PICUs) and three cardiac ICUs (CICUs) from the U.S. participating in the PDC.
Patients
Patients admitted to a participating ICU between 2010 and 2022 who received a vasoactive infusion within 7 days of ICU admission.
Interventions
None.
Measurements and Main Results
A vasoactive infusion was administered within the first 7 days of admission in 16,959 (22%) out of a total of 75,953 ICU encounters. CICU encounters comprised 20% of all ICU encounters but 60% of those with a vasoactive infusion. The most frequently used vasoactive medications were milrinone (63%) and epinephrine (59%). We found a statistically significant difference in the frequency of each vasoactive infusion between PICU sites (P < 0.001) and between CICU sites (P < 0.001). The median peak vasoactive inotrope score (VIS) was 10 [IQR 5.5–20] and 8 [IQR 5–12.5] among PICU and CICU encounters respectively.
Conclusions
We found significant variability in the frequency of vasoactive infusion medication use between sites and type of ICU. Further investigation is needed to understand what impact this practice variability has on patient outcomes.
Introduction
One of the most common interventions provided in pediatric intensive care units (ICUs) is the administration of vasoactive medications to improve oxygen delivery.1,2 Each vasoactive medication has a different combination of inotropic, chronotropic, and vasoconstrictive effects, and vasoactive selection can be tailored to distinct clinical scenarios. Evidence to guide vasoactive selection for pediatric patients is limited; this is likely to result in practice variation.3,4 The development of the PICU Data Collaborative (PDC) database facilitates the efficient collection and use of electronic health record (EHR) data from multiple sites, including granular medication data. 5 We sought to leverage this rich multi-center dataset to understand the variation in practice regarding vasoactive infusions and inform future research in this field.
Our objective was to describe the use of vasoactive infusions across ICUs from participating sites in the PDC. 5 We hypothesized that the proportions of patients receiving each medication would vary between sites and between cardiac and non-cardiac ICUs. We also hypothesized that the relative dose of vasoactive medications, measured using the vasoactive inotrope score (VIS), and duration of vasoactive use would be different between sites and between cardiac & non-cardiac ICUs.
Materials and Methods
Study Population
This is a retrospective cohort study of patients receiving one or more vasoactive infusions during admission to a participating ICU from 2010–2022. Patient encounters were identified using the PDC database (8-Site Version 240116). 5 Data from 4 of 8 sites contained all required elements and were included. All 4 sites are large, quaternary academic children's hospitals providing extracorporeal life support, transplants (bone marrow, kidney, liver and heart at minimum) and have dedicated cardiac ICUs, though 1 site did not submit cardiac ICU data. All but one site are also level 1 pediatric trauma centers. We defined vasoactive encounters as those with administration of one or more of the following VIS component infusions in the first 7 days of admission: epinephrine, norepinephrine, milrinone, vasopressin, dopamine, or dobutamine. 6 The STROBE guidelines for reporting of observational studies were followed for this manuscript (Appendix A). Each participating site received IRB approval to submit de-identified data to the PDC. 5 As no site- or patient-specific identifiers are available to PDC users, this study was determined not human subjects research by the Children's Healthcare of Atlanta IRB (Study Number: 2677).
Data Preparation
We differentiated vasoactive infusions from those administered in bolus form using medication name, dose, route, units and presence of a recorded rate. We excluded vasopressin infusions labeled for use in diabetes insipidus. We extracted vasoactive infusion dose for every hour of the first 7 days of ICU admission, or time of ICU discharge. When gaps in medication data occurred, we imputed using a 6-h window with a last observation carried forward technique up to a maximum of 6 h. 7 At the end of 6-h window, the dose would be set to zero and would remain zero unless another dose was subsequently recorded. We converted medication dosages to standardized units based on the VIS calculation and removed implausible values. We then calculated an hourly VIS for the first 7 days of ICU admission. 6 In addition to medication data, we extracted patient age at admission, sex, diagnostic codes, ICU type, length of stay (LOS) and ICU & hospital mortality. We used string matching, matching of portions of words and phrases, to group diagnostic code descriptions into clinically meaningful categories. We used all diagnostic codes associated with the encounter, there is no indicator available for primary diagnosis. We reviewed the diagnostic groupings manually to ensure accurate matching. We split ICU encounters into two groups for analysis: 1) Pediatric ICU (PICU) containing encounters with admission to a general PICU and 2) Cardiac ICU (CICU) containing encounters with admission to a designated cardiac ICU.
Statistical Analysis
We report descriptive statistics using frequency with proportions for categorical data and median with interquartile range (IQR) for continuous data. Data were not normally distributed, thus we utilized non-parametric tests including Pearson's Chi-square as appropriate. We used Kruskal-Wallis tests to evaluate whether the median maximum VIS, duration of VIS, and LOS differed between sites. We compared odds ratios for use of each vasoactive agent across sites, adjusted for the year of ICU admission. We analyzed the PICU and CICU encounters separately. Statistical significance was determined at an alpha level of 0.05. All data preparation, analyses, and visualizations were completed in a Microsoft Azure computing environment using embedded R and Python (v3.10) kernels. ChatGPT (3.0, 3.5 & 4o) and Google AI were used to assist with writing code. Source code for calculations can be found here: https://github.com/sbrown513/Vasoactive-Medication-Use-in-PICUs.
Results
We identified a total of 75,953 ICU encounters during the study period. Of these encounters, 22% included vasoactive infusion administration. CICU encounters comprised 20% (15,016/75,953) of all ICU encounters and 60% (10,151/16,959) of all ICU encounters with a vasoactive infusion. Median age in the cohort with vasoactive infusion was 3.2 years [IQR 0.4–12.4] and 45% were female (Table 1). The most common diagnoses in children receiving vasoactive infusions in the PICU were respiratory failure (46%) and sepsis (27%); in the CICU the most common diagnoses were respiratory failure (45%%) and heart failure (36%). The most frequently used vasoactive medications in the cohort were milrinone (63%) and epinephrine (59%) (Table S1
Cohort Demographics and Characteristics.
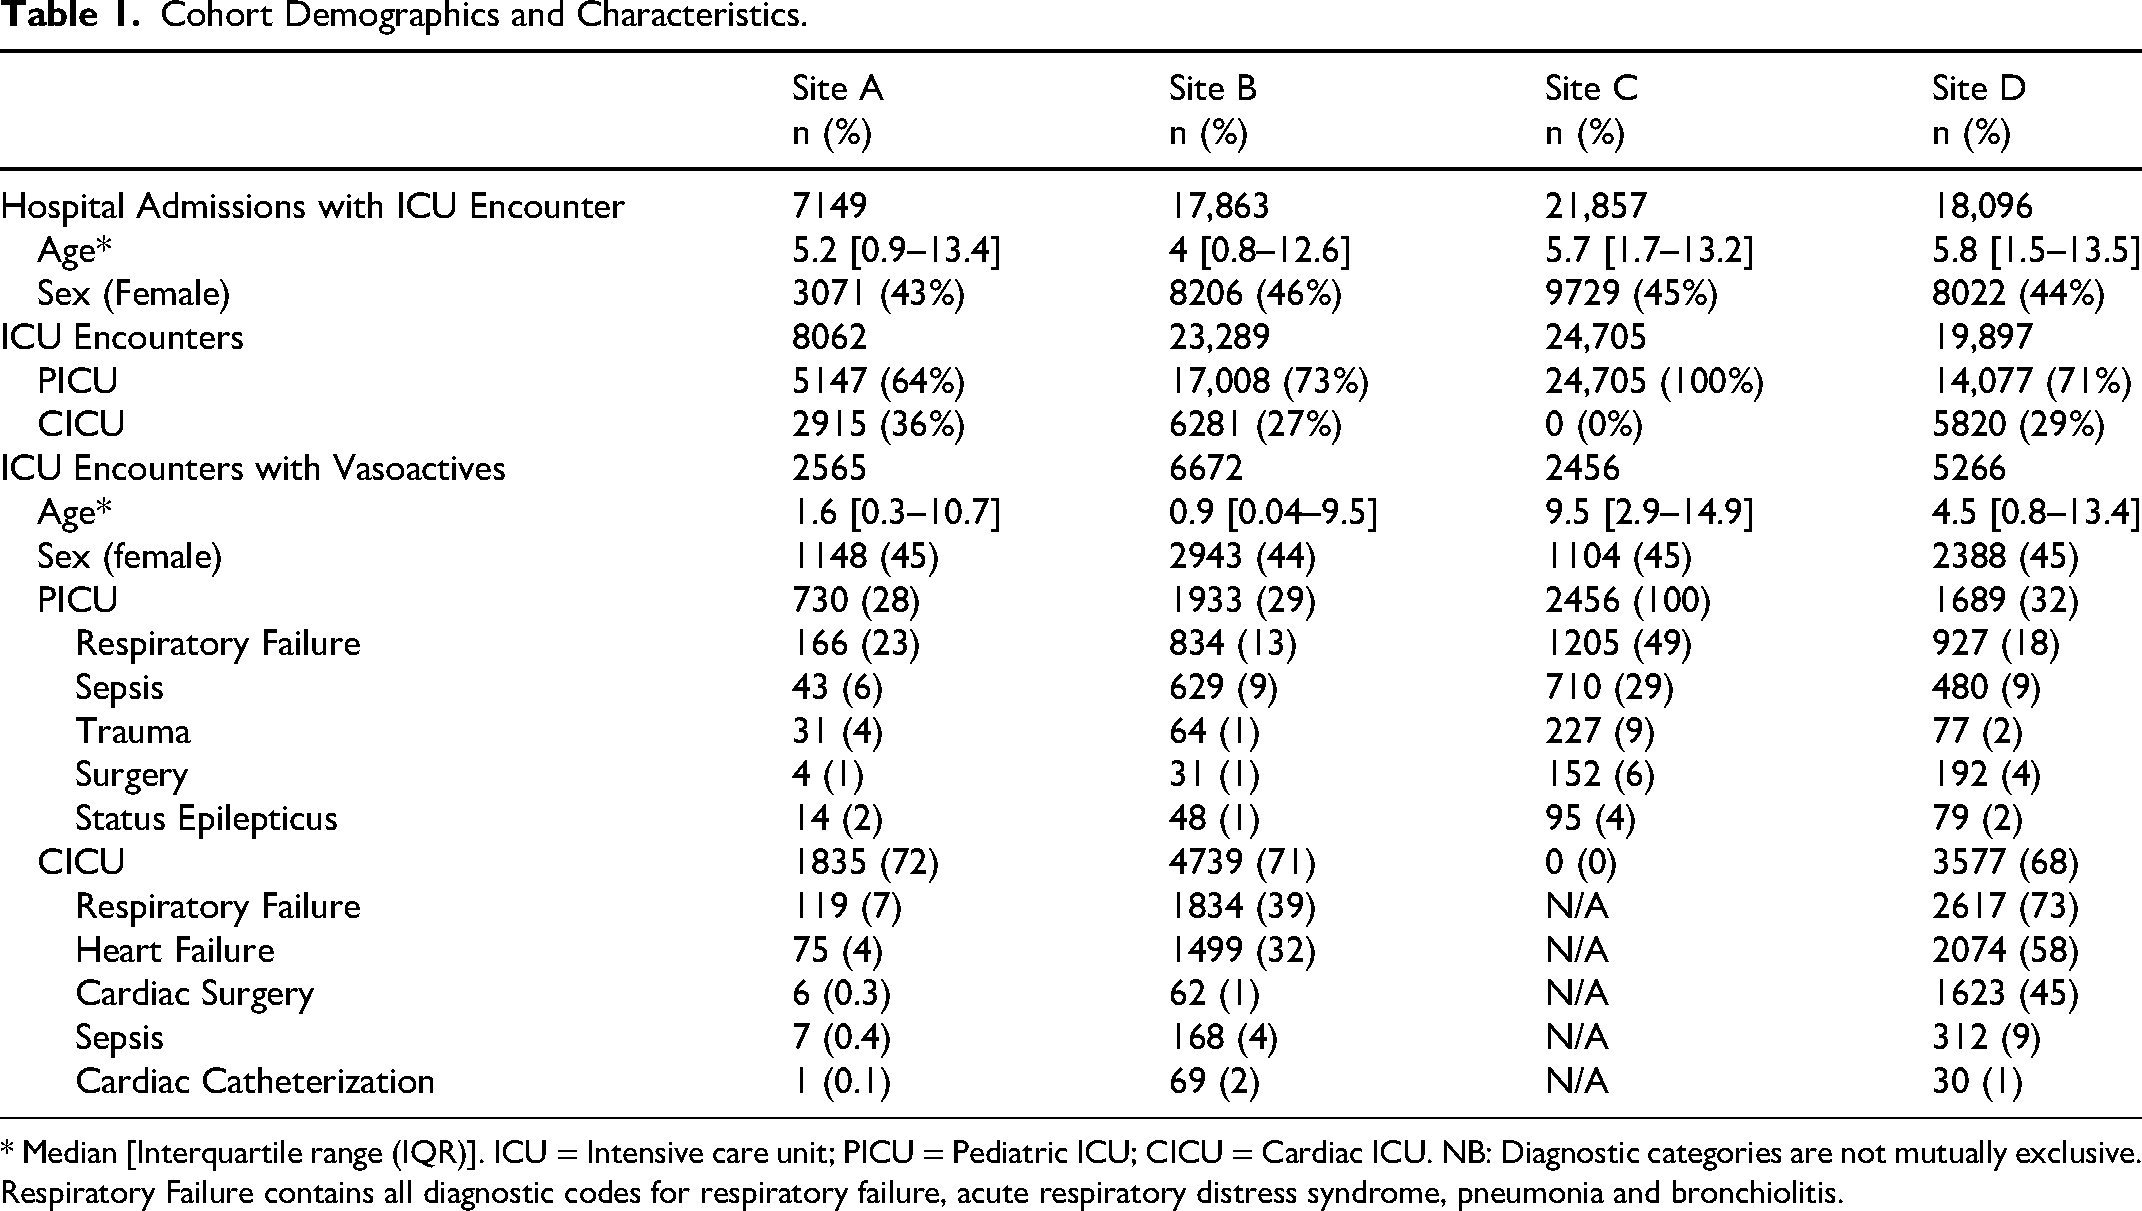
* Median [Interquartile range (IQR)]. ICU = Intensive care unit; PICU = Pediatric ICU; CICU = Cardiac ICU. NB: Diagnostic categories are not mutually exclusive. Respiratory Failure contains all diagnostic codes for respiratory failure, acute respiratory distress syndrome, pneumonia and bronchiolitis.
PICU Encounters
The frequency of use of each vasoactive medication varied by site (P < 0.001) for all medications and year of admission for all medications except dobutamine (P = 0.17 for dobutamine, < 0.001 all others). The odds of vasoactive medication use, adjusted for year of admission, differed between sites for all medications except for epinephrine an milrinone use at sites A and C and dobutamine use at sites A and D (Table S4). Median peak VIS was 10 [IQR 5.5–20] and median duration of vasoactive infusion was 13 h [IQR 8–60] (Figure 1A). Evaluation with Chi-square and Kruskal-Wallis tests (as appropriate) revealed a statistically significant association between site and each of the following measures: peak VIS, duration of vasoactive use, ICU mortality and ICU LOS (P-value < 0.001).
CICU Encounters
The frequency of use of each vasoactive medication varied by site and by year of admission for all medications (P < 0.001) (Figure S1B). The odds of vasoactive medication use, adjusted for year of admission, differed between sites for all medications except for milrinone and dobutamine use at sites A and D (Table S4). Median peak VIS was 8 [IQR 5–12.5] and median duration of vasoactive infusion was 34 h [IQR 14–82] (Figure 1B). Evaluation with Chi-square and Kruskal-Wallis tests (as appropriate) revealed a statistically significant association between site and each of the following measures: duration of vasoactive use, ICU mortality and ICU LOS (p-value < 0.001) but not between site and peak VIS (p-value 0.39).
Discussion
In this multi-center cohort of PICU and CICU encounters, we found significant variation between sites in the frequency of vasoactive medication use. Additionally, peak VIS in the PICU and duration of vasoactive infusion across both ICU types differed between sites.
Among PICU patients, there was a clear trend of decreasing dopamine use over time and a corresponding increase in epinephrine and norepinephrine over the same time-period. Two randomized controlled trials were published in 2015 and 2016 demonstrating improved outcomes with epinephrine compared to dopamine in children with septic shock.8,9 Of note, the trend of decreased dopamine use at Site C preceded these reports and Site A continued to use dopamine frequently in 2019, which was its first year of data submission. These trends demonstrate both the overall shift away from dopamine use as well as the variation that exists in the time required to shift practice between sites. While we suspect that the shift away from dopamine was related to these studies, we have limited diagnostic information for this cohort and the sites appeared to differ in the proportion missing, so we were unable to analyze vasoactive choice within diagnostic categories. The inherent limitations of diagnostic billing codes underscore the need for alternative methods of cohort identification in retrospective data, such as computational phenotypes.10,11 Development of these phenotypes as well as calculation of severity of illness scores for PDC encounters is an area of ongoing work for future studies.
In contrast to the PICU practice patterns, dopamine use remained high in two of the CICU sites across the study period, with the third again having no dopamine use. It is unclear what caused the increasing use of epinephrine and vasopressin over time. These changes could be due to a shift in the patient population or may reflect changes in individual practitioner preferences. A large proportion of CICU patients are admitted post-operatively and have vasoactive infusions running upon admission. The individual practice patterns of the anesthesiologists and surgeons can have a significant impact on the choice of vasoactive agent for these patients. The CICU sites in this study are similar in that all have cardiac transplant, cardiac surgical and extracorporeal life support programs. However, the vasoactive medication choice varies significantly between them. This practice variation is likely due to a combination of provider preference, institutional protocols and variation in the patient case-mix. Whatever the cause, the variation in practice that we observed creates a natural experiment, which could be useful for future comparative effectiveness studies.
This study has important strengths. First, the large sample size and inclusion of PICU and CICU patients from multiple sites enhances the generalizability of these results. Second, the use of detailed medication data enables comparison of dosing intensity (operationalized here using VIS) and is rare in such a large cohort.
This study has several limitations. First, were unable to include data from 4 of the 8 sites due to issues with data completeness. Second, vasoactive infusion end time was not consistently recorded and, when absent, created up to 6 h of potential inaccuracy for our estimate of duration of vasoactive use due to the last dose being carried forward. Third, while we chose to analyze the first 7 days of ICU admission for practical reasons, there may be important patterns outside of this time frame that we were unable to capture. Last, we used diagnostic codes based on encounter billing data to determine the diagnostic category; these codes can be unreliable and may have resulted in misclassification of some patients.
Conclusions
In this large, multi-center retrospective cohort study of PICU and CICU patients, we identified significant variability in the frequency of vasoactive infusion medication use. Further investigation is needed to understand why these differences exist and whether differences in practice lead to differences in outcomes such as LOS and mortality.
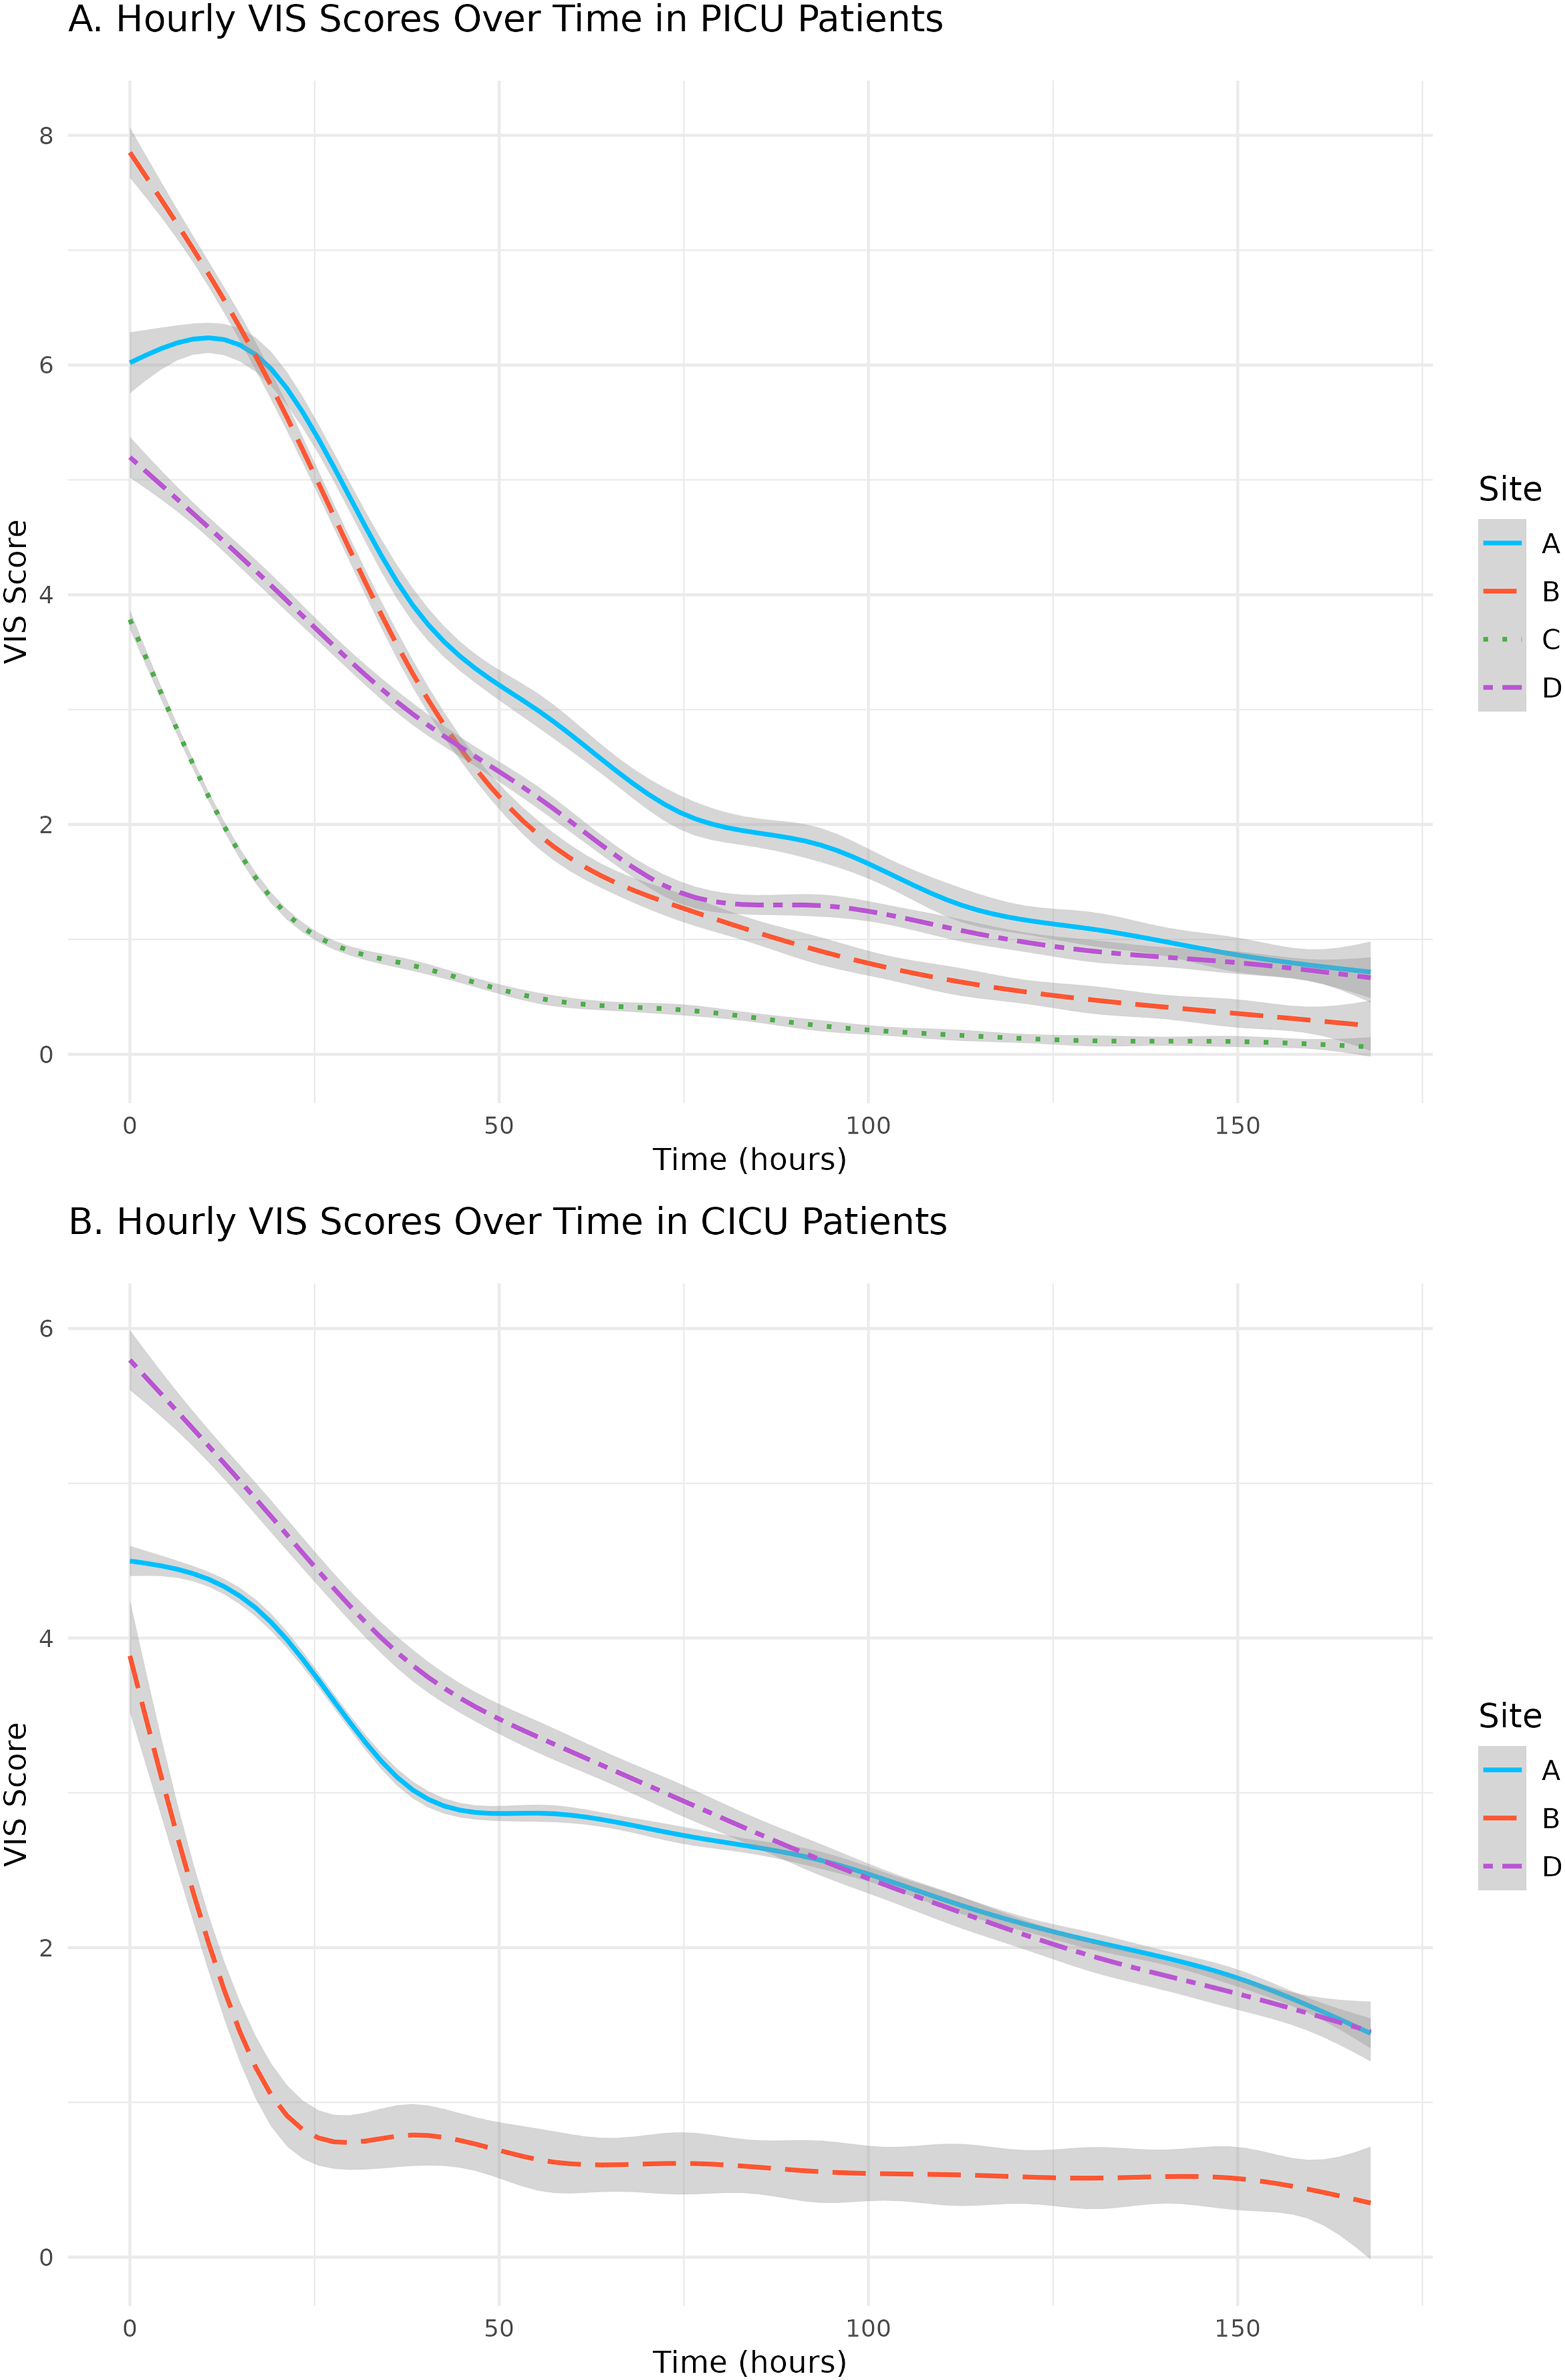
Smoothed Curves of Median Vasoactive-Inotropic Score (VIS) Hourly from Admission for Pediatric Intensive Care Unit (PICU) and Cardiac Intensive Care Unit (CICU) Encounters.
Supplemental Material
sj-docx-1-jic-10.1177_08850666261459351 - Supplemental material for Variability in Vasoactive Medication use Across Pediatric Intensive Care Units: A PICU Data Collaborative Study, 2010–2022
Supplemental material, sj-docx-1-jic-10.1177_08850666261459351 for Variability in Vasoactive Medication use Across Pediatric Intensive Care Units: A PICU Data Collaborative Study, 2010–2022 by Stephanie R. Brown,MBBS, MS, Julia A. Heneghan,MD, MS, Colleen Badke, MD,MPH, Adam C. Dziorny, MD, PhD, Alysia Flynn, PhD, ReidW.D. Farris,MD, MS, Tellen D. Bennett, MD,MS, Daniel Tawfik, MD, MS, Timothy T. Cornell, MD, Randall Wetzel, MBBS, MSB, Akira Nishisaki, MD, MSCE, and Colin Rogerson, MD, MPH, on behalf of the PICU Data Collaborative in Journal of Intensive Care Medicine
Footnotes
Acknowledgements
The PICU Data Collaborative acknowledges with gratitude the financial support as well as the contributions of the data analytics staff of the Laura P. and Leland K. Whittier Virtual PICU.
Ethical Considerations
As no site- or patient-specific identifiers are available to PDC users, this study was determined not human subjects research by the Children's Healthcare of Atlanta IRB (Study Number: 2677).
Consent to Participate
Not applicable.
Consent for Publication
Not applicable.
Author Contributions
Drs. Stephanie Brown, Julia Heneghan, Colleen Badke and Colin Rogerson contributed to study conception and design, reviewing the available pertinent literature, acquisition of data, or analysis and interpretation of data. Drs. Adam Dziorny, Alysia Flynn, Reid Farris, Tellen Bennett, Daniel Tawfik, Timothy Cornell, Randall Wetzel, and Akira Nishisaki contributed to data submission and harmonization. Dr Brown wrote the initial draft of the manuscript, which was revised and critically reviewed by all authors. All authors approve the final version of the manuscript as submitted for consideration and are accountable for all aspects of the work.
Funding
The authors received no financial support for the research, authorship, and/or publication of this article.
Declaration of Conflicting Interests
The authors declared no potential conflicts of interest with respect to the research, authorship, and/or publication of this article.
Supplemental Material
Supplemental material for this article is available online.
Appendix A. Strobe Checklist
STROBE Statement—Checklist of items that should be included in reports of cohort studies
*Give information separately for exposed and unexposed groups. Note: An Explanation and Elaboration article discusses each checklist item and gives methodological background and published examples of transparent reporting. The STROBE checklist is best used in conjunction with this article (freely available on the Web sites of PLoS Medicine at http://www.plosmedicine.org/, Annals of Internal Medicine at http://www.annals.org/, and Epidemiology at http://www.epidem.com/). Information on the STROBE Initiative is available at http://www.strobe-statement.org.
Item No
Recommendation
Page Number
Title and abstract
1
(a) Indicate the study's design with a commonly used term in the title or the abstract
1, 3
(b) Provide in the abstract an informative and balanced summary of what was done and what was found
3
Introduction
Background/rationale
2
Explain the scientific background and rationale for the investigation being reported
4
Objectives
3
State specific objectives, including any prespecified hypotheses
4
Methods
Study design
4
Present key elements of study design early in the paper
5-7
Setting
5
Describe the setting, locations, and relevant dates, including periods of recruitment, exposure, follow-up, and data collection
5
Participants
6
(a) Give the eligibility criteria, and the sources and methods of selection of participants. Describe methods of follow-up
5
(b) For matched studies, give matching criteria and number of exposed and unexposed
N/A
Variables
7
Clearly define all outcomes, exposures, predictors, potential confounders, and effect modifiers. Give diagnostic criteria, if applicable
6
Data sources/ measurement
8*
For each variable of interest, give sources of data and details of methods of assessment (measurement). Describe comparability of assessment methods if there is more than one group
5,6
Bias
9
Describe any efforts to address potential sources of bias
6
Study size
10
Explain how the study size was arrived at
5
Quantitative variables
11
Explain how quantitative variables were handled in the analyses. If applicable, describe which groupings were chosen and why
6
Statistical methods
12
(a) Describe all statistical methods, including those used to control for confounding
6
(b) Describe any methods used to examine subgroups and interactions
6
(c) Explain how missing data were addressed
5
(d) If applicable, explain how loss to follow-up was addressed
N/A
(
N/A
Results
Participants
13*
(a) Report numbers of individuals at each stage of study—eg numbers potentially eligible, examined for eligibility, confirmed eligible, included in the study, completing follow-up, and analysed
7
(b) Give reasons for non-participation at each stage
N/A
(c) Consider use of a flow diagram
N/A
Descriptive data
14*
(a) Give characteristics of study participants (eg demographic, clinical, social) and information on exposures and potential confounders
7
(b) Indicate number of participants with missing data for each variable of interest
N/A
(c) Summarise follow-up time (eg, average and total amount)
N/A
Outcome data
15*
Report numbers of outcome events or summary measures over time
7
Main results
16
(a) Give unadjusted estimates and, if applicable, confounder-adjusted estimates and their precision (eg, 95% confidence interval). Make clear which confounders were adjusted for and why they were included
8
(b) Report category boundaries when continuous variables were categorized
N/A
(c) If relevant, consider translating estimates of relative risk into absolute risk for a meaningful time period
N/A
Other analyses
17
Report other analyses done—eg analyses of subgroups and interactions, and sensitivity analyses
8
Discussion
Key results
18
Summarise key results with reference to study objectives
8,9
Limitations
19
Discuss limitations of the study, taking into account sources of potential bias or imprecision. Discuss both direction and magnitude of any potential bias
10,11
Interpretation
20
Give a cautious overall interpretation of results considering objectives, limitations, multiplicity of analyses, results from similar studies, and other relevant evidence
9,10
Generalisability
21
Discuss the generalisability (external validity) of the study results
10
Other information
Funding
22
Give the source of funding and the role of the funders for the present study and, if applicable, for the original study on which the present article is based
12
References
Supplementary Material
Please find the following supplemental material available below.
For Open Access articles published under a Creative Commons License, all supplemental material carries the same license as the article it is associated with.
For non-Open Access articles published, all supplemental material carries a non-exclusive license, and permission requests for re-use of supplemental material or any part of supplemental material shall be sent directly to the copyright owner as specified in the copyright notice associated with the article.